This pipeline performs Gene Set Enrichment Analysis (GSEA) using The Broad Institute GSEA tool with MSigDB - Class2: Canonical Pathways gene sets. For a given phenotype subtype, it shows what pathways are significantly enriched in each subtype by comparing gene expression profiles between subtypes. Here, the phenotype is mRNAseq_cNMF subtypes having more than three samples and the input expression file "DLBC-TP.uncv2.mRNAseq_RSEM_normalized_log2.txt" is generated in the pipeline mRNAseq_Preprocess in the stddata run. This pipeline has the following features:
-
For each subtype, calculates enrichment scores (ES) using signal to noise (S2N) that checks similarity between subtypes in expression level then calculates p values through permutation test.
-
Lists pathways significantly enriched in each phenotype subtype and their enrichment scores (ES).
-
Lists top 20 core genes enriched in each significant gene set and their enrichment scores (ES).
-
Checks if the top core genes are up-regulated or down-regulated.
-
Checks if the top core genes are high expressed or low expressed.
-
Checks if the top core genes are significantly differently expressed genes.
Table 1. Get Full Table basic data info
| basic data info |
|---|
| Number of Gene Sets: 708 |
| Number of samples: 48 |
| Original number of Gene Sets: 1320 |
| Maximum gene set size: 933 |
Table 2. Get Full Table pheno data info
| phenotype info |
|---|
| pheno.type: 1 - 6 :[ clus1 ] 10 |
| pheno.type: 2 - 6 :[ clus2 ] 12 |
| pheno.type: 3 - 6 :[ clus3 ] 9 |
| pheno.type: 4 - 6 :[ clus4 ] 3 |
| pheno.type: 5 - 6 :[ clus5 ] 8 |
| pheno.type: 6 - 6 :[ clus6 ] 6 |
For the expression subtypes of 17683 genes in 49 samples, GSEA found enriched gene sets in each cluster using 48 gene sets in MSigDB canonical pathways. Top enriched gene sets are listed as below.
-
clus1
-
Top enriched gene sets are KEGG OXIDATIVE PHOSPHORYLATION, KEGG PYRIMIDINE METABOLISM, KEGG ARGININE AND PROLINE METABOLISM, KEGG AMINO SUGAR AND NUCLEOTIDE SUGAR METABOLISM, KEGG PYRUVATE METABOLISM, PID INTEGRIN3 PATHWAY, PID AVB3 INTEGRIN PATHWAY, PID SYNDECAN 1 PATHWAY, PID INTEGRIN A4B1 PATHWAY, REACTOME ANTIGEN PROCESSING CROSS PRESENTATION
-
And common core enriched genes are ALDH1B1, ALDH2, ABP1, ACY1, ADC, AGMAT, ALDH7A1, ARG2, ASL, ASS1
-
clus2
-
Top enriched gene sets are KEGG NOTCH SIGNALING PATHWAY, KEGG T CELL RECEPTOR SIGNALING PATHWAY, KEGG THYROID CANCER, KEGG PRIMARY IMMUNODEFICIENCY, BIOCARTA DEATH PATHWAY, BIOCARTA VIP PATHWAY, BIOCARTA TCR PATHWAY, ST T CELL SIGNAL TRANSDUCTION, PID TCR PATHWAY, PID CD8TCRPATHWAY
-
And common core enriched genes are CD3D, ZAP70, CD3E, CD28, GRAP2, ITK, LAT, LCP2, NCK1, RASGRP1
-
clus3
-
Top enriched gene sets are PID AURORA B PATHWAY, PID ATR PATHWAY, PID CDC42 REG PATHWAY, PID ATM PATHWAY, PID BARD1PATHWAY, REACTOME METABOLISM OF NON CODING RNA, REACTOME TRANSPORT OF MATURE TRANSCRIPT TO CYTOPLASM, REACTOME RNA POL II TRANSCRIPTION, REACTOME CELL CYCLE MITOTIC, REACTOME RECRUITMENT OF MITOTIC CENTROSOME PROTEINS AND COMPLEXES
-
And common core enriched genes are ATM, BRCA1, CDC25A, CDC25C, FANCD2, MRE11A, RAD50, RBBP8, NCBP1, NUP107
-
clus4
-
Top enriched gene sets are KEGG BASAL TRANSCRIPTION FACTORS, BIOCARTA CARM ER PATHWAY, BIOCARTA CREB PATHWAY, BIOCARTA VEGF PATHWAY, SIG BCR SIGNALING PATHWAY, PID FANCONI PATHWAY, PID E2F PATHWAY, PID ATM PATHWAY, PID HDAC CLASSI PATHWAY, PID PLK1 PATHWAY
-
And common core enriched genes are CDK2, CREBBP, EP300, KAT2B, ATM, CSNK1G3, MAPK8, MAPK9, RBL2, SIRT1
-
clus5
-
Top enriched gene sets are KEGG OXIDATIVE PHOSPHORYLATION, KEGG RIBOSOME, KEGG PARKINSONS DISEASE, KEGG HUNTINGTONS DISEASE, REACTOME TRANSLATION, REACTOME FORMATION OF THE TERNARY COMPLEX AND SUBSEQUENTLY THE 43S COMPLEX, REACTOME TCA CYCLE AND RESPIRATORY ELECTRON TRANSPORT, REACTOME SRP DEPENDENT COTRANSLATIONAL PROTEIN TARGETING TO MEMBRANE, REACTOME ACTIVATION OF NF KAPPAB IN B CELLS, REACTOME ACTIVATION OF THE MRNA UPON BINDING OF THE CAP BINDING COMPLEX AND EIFS AND SUBSEQUENT BINDING TO 43S
-
And common core enriched genes are ATP5D, ATP5E, ATP5G1, ATP5H, ATP5J, ATP5O, COX4I1, COX5A, COX5B, COX6A1
-
clus6
-
Top enriched gene sets are KEGG LYSOSOME, KEGG TOLL LIKE RECEPTOR SIGNALING PATHWAY, KEGG NOD LIKE RECEPTOR SIGNALING PATHWAY, KEGG THYROID CANCER, ST TUMOR NECROSIS FACTOR PATHWAY, ST G ALPHA I PATHWAY, ST GAQ PATHWAY, PID ERBB2ERBB3PATHWAY, REACTOME ANTIVIRAL MECHANISM BY IFN STIMULATED GENES, REACTOME TRIGLYCERIDE BIOSYNTHESIS
-
And common core enriched genes are DDX58, HERC5, ISG15, UBE2L6, IFNB1, IRF1, IRF7, TNFAIP3, NFKB2, ADAR
Table 3. Get Full Table This table shows top 10 pathways which are significantly enriched in cluster clus1. It displays only significant gene sets satisfying nom.p.val.threshold (-1), fwer.p.val.threshold (-1) , fdr.q.val.threshold (0.25) and the default table is sorted by Normalized Enrichment Score (NES). Further details on NES statistics, please visit The Broad GSEA website.
| GeneSet(GS) | Size(#genes) | genes.ES.table | ES | NES | NOM.p.val | FDR.q.val | FWER.p.val | Tag.. | Gene.. | Signal | FDR..median. | glob.p.val |
|---|---|---|---|---|---|---|---|---|---|---|---|---|
| KEGG OXIDATIVE PHOSPHORYLATION | 111 | genes.ES.table | 0.54 | 1.5 | 0.087 | 0.88 | 0.96 | 0.74 | 0.35 | 0.48 | 0.59 | 0.28 |
| KEGG PYRIMIDINE METABOLISM | 98 | genes.ES.table | 0.34 | 1.6 | 0.017 | 1 | 0.93 | 0.49 | 0.32 | 0.34 | 0.6 | 0.32 |
| KEGG ARGININE AND PROLINE METABOLISM | 53 | genes.ES.table | 0.63 | 1.8 | 0 | 1 | 0.45 | 0.49 | 0.18 | 0.4 | 0 | 0.31 |
| KEGG AMINO SUGAR AND NUCLEOTIDE SUGAR METABOLISM | 44 | genes.ES.table | 0.45 | 1.7 | 0.021 | 1 | 0.68 | 0.43 | 0.27 | 0.32 | 0.65 | 0.38 |
| KEGG PYRUVATE METABOLISM | 38 | genes.ES.table | 0.52 | 1.7 | 0.018 | 1 | 0.72 | 0.5 | 0.26 | 0.37 | 0.52 | 0.32 |
| PID INTEGRIN3 PATHWAY | 42 | genes.ES.table | 0.65 | 1.6 | 0.031 | 0.96 | 0.96 | 0.55 | 0.15 | 0.47 | 0.59 | 0.3 |
| PID AVB3 INTEGRIN PATHWAY | 74 | genes.ES.table | 0.58 | 1.5 | 0.055 | 0.84 | 0.96 | 0.45 | 0.15 | 0.38 | 0.57 | 0.27 |
| PID SYNDECAN 1 PATHWAY | 46 | genes.ES.table | 0.71 | 1.7 | 0.013 | 1 | 0.82 | 0.63 | 0.15 | 0.54 | 0.59 | 0.34 |
| PID INTEGRIN A4B1 PATHWAY | 32 | genes.ES.table | 0.51 | 1.6 | 0.043 | 1 | 0.91 | 0.31 | 0.17 | 0.26 | 0.64 | 0.34 |
| REACTOME ANTIGEN PROCESSING CROSS PRESENTATION | 72 | genes.ES.table | 0.41 | 1.6 | 0.076 | 1 | 0.94 | 0.64 | 0.36 | 0.41 | 0.62 | 0.33 |
Table S1. Get Full Table This table shows a Running Enrichment Score (RES) of each gene in this pathway, that is, the enrichment score at this point in the ranked list of genes. All genes are ranked by Signal-to-Noise (S2N), a measure of similarity as default and are used to obtain ES matrix of all genes. In this way, GSEA tool uses expression pattern of not only overlapped genes but also not-overlapped genes to produce ES matrix.
| Rank | GENE | SYMBOL | DESC | LIST.LOC | S2N | RES | CORE_ENRICHMENT |
|---|---|---|---|---|---|---|---|
| 1 | P4HA3 | P4HA3 | P4HA3 | 3 | 0.86 | 0.11 | YES |
| 2 | MAOA | MAOA | MAOA | 248 | 0.46 | 0.15 | YES |
| 3 | CKM | CKM | CKM | 334 | 0.42 | 0.2 | YES |
| 4 | NAGS | NAGS | NAGS | 488 | 0.37 | 0.24 | YES |
| 5 | CKB | CKB | CKB | 492 | 0.37 | 0.28 | YES |
| 6 | ADC | ADC | ADC | 758 | 0.31 | 0.31 | YES |
| 7 | AGMAT | AGMAT | AGMAT | 848 | 0.3 | 0.34 | YES |
| 8 | ABP1 | ABP1 | ABP1 | 896 | 0.29 | 0.37 | YES |
| 9 | ASL | ASL | ASL | 932 | 0.28 | 0.41 | YES |
| 10 | CPS1 | CPS1 | CPS1 | 970 | 0.28 | 0.44 | YES |
| 11 | ASS1 | ASS1 | ASS1 | 1017 | 0.27 | 0.47 | YES |
| 12 | P4HA2 | P4HA2 | P4HA2 | 1036 | 0.27 | 0.5 | YES |
| 13 | PYCR1 | PYCR1 | PYCR1 | 1233 | 0.24 | 0.52 | YES |
| 14 | ALDH2 | ALDH2 | ALDH2 | 1612 | 0.2 | 0.52 | YES |
| 15 | GAMT | GAMT | GAMT | 1884 | 0.18 | 0.53 | YES |
| 16 | ALDH1B1 | ALDH1B1 | ALDH1B1 | 2287 | 0.15 | 0.53 | YES |
| 17 | SAT2 | SAT2 | SAT2 | 2301 | 0.15 | 0.55 | YES |
| 18 | DAO | DAO | DAO | 2342 | 0.15 | 0.56 | YES |
| 19 | SAT1 | SAT1 | SAT1 | 2358 | 0.15 | 0.58 | YES |
| 20 | ACY1 | ACY1 | ACY1 | 2606 | 0.13 | 0.58 | YES |
| 21 | CKMT1A | CKMT1A | CKMT1A | 2900 | 0.12 | 0.58 | YES |
| 22 | PRODH | PRODH | PRODH | 2998 | 0.12 | 0.59 | YES |
| 23 | P4HA1 | P4HA1 | P4HA1 | 3052 | 0.12 | 0.6 | YES |
| 24 | PYCRL | PYCRL | PYCRL | 3073 | 0.11 | 0.61 | YES |
| 25 | ARG2 | ARG2 | ARG2 | 3078 | 0.11 | 0.63 | YES |
| 26 | CKMT2 | CKMT2 | CKMT2 | 3275 | 0.11 | 0.63 | YES |
| 27 | ALDH7A1 | ALDH7A1 | ALDH7A1 | 4495 | 0.076 | 0.57 | NO |
| 28 | GOT1 | GOT1 | GOT1 | 4577 | 0.074 | 0.57 | NO |
| 29 | CKMT1B | CKMT1B | CKMT1B | 5661 | 0.051 | 0.52 | NO |
| 30 | AMD1 | AMD1 | AMD1 | 6275 | 0.039 | 0.49 | NO |
| 31 | SRM | SRM | SRM | 6451 | 0.036 | 0.48 | NO |
| 32 | ALDH18A1 | ALDH18A1 | ALDH18A1 | 6500 | 0.035 | 0.48 | NO |
| 33 | SMS | SMS | SMS | 6829 | 0.029 | 0.47 | NO |
| 34 | PYCR2 | PYCR2 | PYCR2 | 6904 | 0.028 | 0.47 | NO |
| 35 | LAP3 | LAP3 | LAP3 | 7166 | 0.023 | 0.46 | NO |
| 36 | OAT | OAT | OAT | 7236 | 0.022 | 0.46 | NO |
| 37 | GLUL | GLUL | GLUL | 7427 | 0.018 | 0.45 | NO |
| 38 | ALDH3A2 | ALDH3A2 | ALDH3A2 | 7659 | 0.013 | 0.44 | NO |
| 39 | ALDH9A1 | ALDH9A1 | ALDH9A1 | 8294 | 0.0016 | 0.4 | NO |
| 40 | MAOB | MAOB | MAOB | 8392 | -0.00017 | 0.4 | NO |
| 41 | GLUD1 | GLUD1 | GLUD1 | 8395 | -0.00022 | 0.4 | NO |
| 42 | ALDH4A1 | ALDH4A1 | ALDH4A1 | 8824 | -0.0084 | 0.37 | NO |
| 43 | ODC1 | ODC1 | ODC1 | 9082 | -0.014 | 0.36 | NO |
| 44 | GOT2 | GOT2 | GOT2 | 9438 | -0.021 | 0.34 | NO |
| 45 | GLS | GLS | GLS | 9806 | -0.028 | 0.32 | NO |
| 46 | NOS3 | NOS3 | NOS3 | 10006 | -0.032 | 0.32 | NO |
| 47 | NOS2 | NOS2 | NOS2 | 10462 | -0.041 | 0.3 | NO |
| 48 | GLUD2 | GLUD2 | GLUD2 | 11175 | -0.057 | 0.26 | NO |
| 49 | GATM | GATM | GATM | 11844 | -0.073 | 0.23 | NO |
| 50 | ARG1 | ARG1 | ARG1 | 12421 | -0.089 | 0.21 | NO |
| 51 | NOS1 | NOS1 | NOS1 | 13004 | -0.1 | 0.19 | NO |
| 52 | GLS2 | GLS2 | GLS2 | 16355 | -0.28 | 0.037 | NO |
| 53 | PRODH2 | PRODH2 | PRODH2 | 16543 | -0.3 | 0.064 | NO |
Figure S1. Get High-res Image This plot shows mRNAseq_cNMF expression data heatmap (on the left) a RunningEnrichmentScore(RES) plot (on the top right) and a Signal2Noise(S2N) plot (on the bottom right) of genes in the pathway: KEGG OXIDATIVE PHOSPHORYLATION.
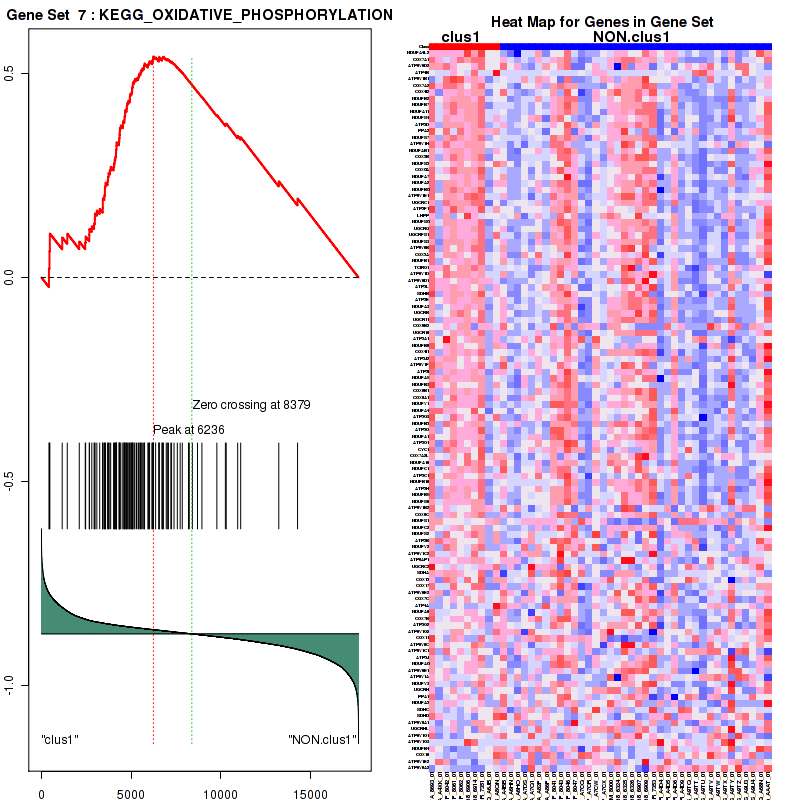
Figure S2. Get High-res Image For the top 5 core enriched genes in the pathway: KEGG OXIDATIVE PHOSPHORYLATION, this volcano plot shows how much they are up/down-regulated and significant. The significance was calculated by empirical bayesian fit
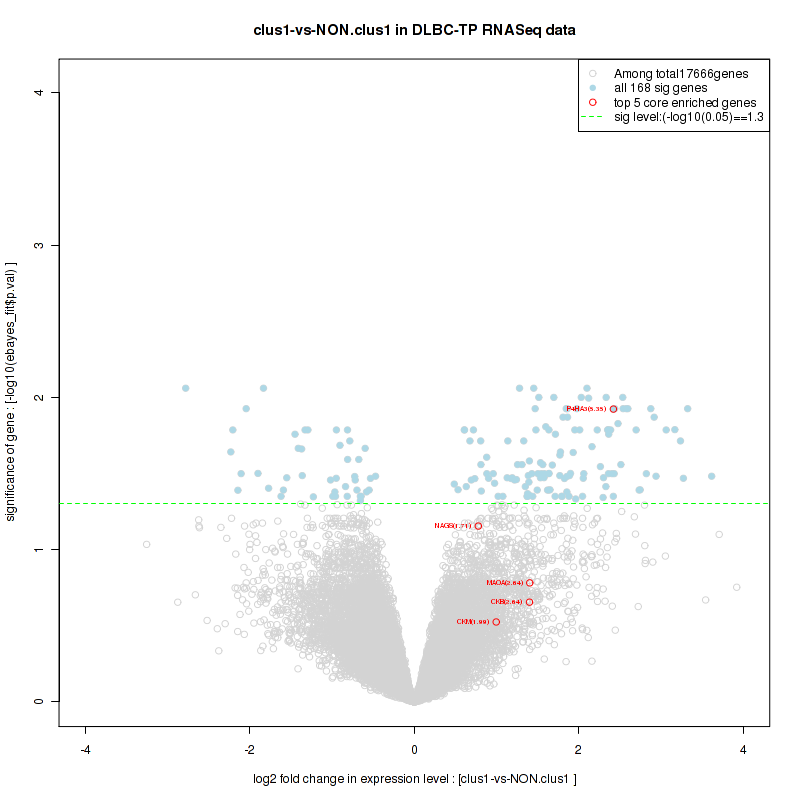
Table S2. Get Full Table This table shows a Running Enrichment Score (RES) of each gene in this pathway, that is, the enrichment score at this point in the ranked list of genes. All genes are ranked by Signal-to-Noise (S2N), a measure of similarity as default and are used to obtain ES matrix of all genes. In this way, GSEA tool uses expression pattern of not only overlapped genes but also not-overlapped genes to produce ES matrix.
| Rank | GENE | SYMBOL | DESC | LIST.LOC | S2N | RES | CORE_ENRICHMENT |
|---|---|---|---|---|---|---|---|
| 1 | GFPT2 | GFPT2 | GFPT2 | 478 | 0.38 | 0.072 | YES |
| 2 | CHIA | CHIA | CHIA | 1346 | 0.23 | 0.083 | YES |
| 3 | HK3 | HK3 | HK3 | 1538 | 0.21 | 0.13 | YES |
| 4 | CHIT1 | CHIT1 | CHIT1 | 1628 | 0.2 | 0.17 | YES |
| 5 | GALK1 | GALK1 | GALK1 | 1914 | 0.17 | 0.2 | YES |
| 6 | PGM1 | PGM1 | PGM1 | 2112 | 0.16 | 0.23 | YES |
| 7 | GALE | GALE | GALE | 2403 | 0.14 | 0.26 | YES |
| 8 | PMM1 | PMM1 | PMM1 | 2498 | 0.14 | 0.29 | YES |
| 9 | NANS | NANS | NANS | 2503 | 0.14 | 0.32 | YES |
| 10 | RENBP | RENBP | RENBP | 2839 | 0.12 | 0.34 | YES |
| 11 | HEXB | HEXB | HEXB | 2840 | 0.12 | 0.37 | YES |
| 12 | AMDHD2 | AMDHD2 | AMDHD2 | 2983 | 0.12 | 0.39 | YES |
| 13 | TSTA3 | TSTA3 | TSTA3 | 3643 | 0.097 | 0.38 | YES |
| 14 | GMPPB | GMPPB | GMPPB | 3692 | 0.096 | 0.4 | YES |
| 15 | GMPPA | GMPPA | GMPPA | 3923 | 0.089 | 0.41 | YES |
| 16 | PGM3 | PGM3 | PGM3 | 4090 | 0.085 | 0.42 | YES |
| 17 | NPL | NPL | NPL | 4309 | 0.08 | 0.43 | YES |
| 18 | HEXA | HEXA | HEXA | 4614 | 0.073 | 0.44 | YES |
| 19 | MPI | MPI | MPI | 4694 | 0.071 | 0.45 | YES |
| 20 | HK1 | HK1 | HK1 | 5377 | 0.057 | 0.43 | NO |
| 21 | UGP2 | UGP2 | UGP2 | 6136 | 0.042 | 0.39 | NO |
| 22 | PGM2 | PGM2 | PGM2 | 6738 | 0.03 | 0.37 | NO |
| 23 | UAP1 | UAP1 | UAP1 | 6922 | 0.028 | 0.36 | NO |
| 24 | CYB5R1 | CYB5R1 | CYB5R1 | 6964 | 0.027 | 0.37 | NO |
| 25 | FPGT | FPGT | FPGT | 7141 | 0.023 | 0.36 | NO |
| 26 | CMAS | CMAS | CMAS | 7629 | 0.014 | 0.34 | NO |
| 27 | GPI | GPI | GPI | 7647 | 0.013 | 0.34 | NO |
| 28 | PMM2 | PMM2 | PMM2 | 7691 | 0.012 | 0.34 | NO |
| 29 | UGDH | UGDH | UGDH | 7819 | 0.0099 | 0.34 | NO |
| 30 | GMDS | GMDS | GMDS | 7942 | 0.0078 | 0.34 | NO |
| 31 | GNPNAT1 | GNPNAT1 | GNPNAT1 | 8004 | 0.0069 | 0.33 | NO |
| 32 | CYB5R3 | CYB5R3 | CYB5R3 | 8228 | 0.0027 | 0.32 | NO |
| 33 | UXS1 | UXS1 | UXS1 | 8771 | -0.0075 | 0.29 | NO |
| 34 | GALK2 | GALK2 | GALK2 | 9281 | -0.018 | 0.27 | NO |
| 35 | NAGK | NAGK | NAGK | 9439 | -0.021 | 0.26 | NO |
| 36 | GALT | GALT | GALT | 9551 | -0.023 | 0.26 | NO |
| 37 | GNPDA2 | GNPDA2 | GNPDA2 | 11199 | -0.058 | 0.19 | NO |
| 38 | GNPDA1 | GNPDA1 | GNPDA1 | 11301 | -0.06 | 0.2 | NO |
| 39 | GFPT1 | GFPT1 | GFPT1 | 11447 | -0.064 | 0.2 | NO |
| 40 | HK2 | HK2 | HK2 | 11728 | -0.07 | 0.21 | NO |
| 41 | FUK | FUK | FUK | 11753 | -0.071 | 0.22 | NO |
| 42 | GNE | GNE | GNE | 11972 | -0.077 | 0.23 | NO |
| 43 | NANP | NANP | NANP | 14572 | -0.16 | 0.13 | NO |
| 44 | GCK | GCK | GCK | 14919 | -0.18 | 0.16 | NO |
Figure S3. Get High-res Image This plot shows mRNAseq_cNMF expression data heatmap (on the left) a RunningEnrichmentScore(RES) plot (on the top right) and a Signal2Noise(S2N) plot (on the bottom right) of genes in the pathway: KEGG PYRIMIDINE METABOLISM.
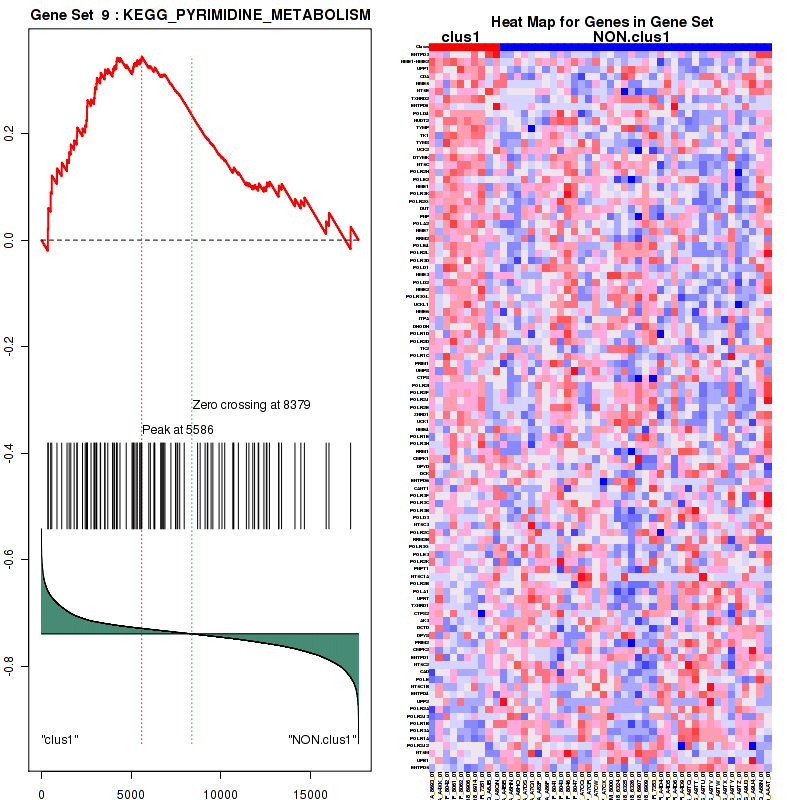
Figure S4. Get High-res Image For the top 5 core enriched genes in the pathway: KEGG PYRIMIDINE METABOLISM, this volcano plot shows how much they are up/down-regulated and significant. The significance was calculated by empirical bayesian fit

Table S3. Get Full Table This table shows a Running Enrichment Score (RES) of each gene in this pathway, that is, the enrichment score at this point in the ranked list of genes. All genes are ranked by Signal-to-Noise (S2N), a measure of similarity as default and are used to obtain ES matrix of all genes. In this way, GSEA tool uses expression pattern of not only overlapped genes but also not-overlapped genes to produce ES matrix.
| Rank | GENE | SYMBOL | DESC | LIST.LOC | S2N | RES | CORE_ENRICHMENT |
|---|---|---|---|---|---|---|---|
| 1 | LDHD | LDHD | LDHD | 460 | 0.38 | 0.066 | YES |
| 2 | HAGHL | HAGHL | HAGHL | 612 | 0.34 | 0.14 | YES |
| 3 | ME3 | ME3 | ME3 | 644 | 0.34 | 0.22 | YES |
| 4 | ME1 | ME1 | ME1 | 1018 | 0.27 | 0.27 | YES |
| 5 | PKLR | PKLR | PKLR | 1292 | 0.24 | 0.31 | YES |
| 6 | ALDH2 | ALDH2 | ALDH2 | 1612 | 0.2 | 0.34 | YES |
| 7 | AKR1B1 | AKR1B1 | AKR1B1 | 1977 | 0.17 | 0.36 | YES |
| 8 | PCK2 | PCK2 | PCK2 | 1986 | 0.17 | 0.4 | YES |
| 9 | ALDH1B1 | ALDH1B1 | ALDH1B1 | 2287 | 0.15 | 0.42 | YES |
| 10 | ACAT2 | ACAT2 | ACAT2 | 2550 | 0.14 | 0.44 | YES |
| 11 | PKM2 | PKM2 | PKM2 | 3005 | 0.12 | 0.44 | YES |
| 12 | PCK1 | PCK1 | PCK1 | 3225 | 0.11 | 0.45 | YES |
| 13 | ACYP1 | ACYP1 | ACYP1 | 3553 | 0.099 | 0.46 | YES |
| 14 | PDHB | PDHB | PDHB | 3701 | 0.095 | 0.47 | YES |
| 15 | MDH2 | MDH2 | MDH2 | 3897 | 0.09 | 0.48 | YES |
| 16 | HAGH | HAGH | HAGH | 4414 | 0.077 | 0.47 | YES |
| 17 | ACSS2 | ACSS2 | ACSS2 | 4482 | 0.076 | 0.49 | YES |
| 18 | ALDH7A1 | ALDH7A1 | ALDH7A1 | 4495 | 0.076 | 0.5 | YES |
| 19 | LDHB | LDHB | LDHB | 4569 | 0.074 | 0.52 | YES |
| 20 | LDHA | LDHA | LDHA | 4922 | 0.066 | 0.52 | NO |
| 21 | PC | PC | PC | 5198 | 0.06 | 0.51 | NO |
| 22 | DLD | DLD | DLD | 6363 | 0.038 | 0.46 | NO |
| 23 | ACACB | ACACB | ACACB | 7105 | 0.024 | 0.42 | NO |
| 24 | ACSS1 | ACSS1 | ACSS1 | 7415 | 0.018 | 0.41 | NO |
| 25 | ACAT1 | ACAT1 | ACAT1 | 7560 | 0.015 | 0.4 | NO |
| 26 | ALDH3A2 | ALDH3A2 | ALDH3A2 | 7659 | 0.013 | 0.4 | NO |
| 27 | LDHC | LDHC | LDHC | 7994 | 0.0071 | 0.38 | NO |
| 28 | ALDH9A1 | ALDH9A1 | ALDH9A1 | 8294 | 0.0016 | 0.37 | NO |
| 29 | MDH1 | MDH1 | MDH1 | 8302 | 0.0015 | 0.37 | NO |
| 30 | DLAT | DLAT | DLAT | 8570 | -0.0035 | 0.35 | NO |
| 31 | LDHAL6B | LDHAL6B | LDHAL6B | 8769 | -0.0074 | 0.34 | NO |
| 32 | ACYP2 | ACYP2 | ACYP2 | 8881 | -0.0095 | 0.34 | NO |
| 33 | PDHA1 | PDHA1 | PDHA1 | 9891 | -0.029 | 0.29 | NO |
| 34 | ME2 | ME2 | ME2 | 10876 | -0.05 | 0.25 | NO |
| 35 | GLO1 | GLO1 | GLO1 | 11647 | -0.069 | 0.22 | NO |
| 36 | GRHPR | GRHPR | GRHPR | 11962 | -0.077 | 0.22 | NO |
| 37 | ACACA | ACACA | ACACA | 12298 | -0.086 | 0.22 | NO |
| 38 | LDHAL6A | LDHAL6A | LDHAL6A | 16865 | -0.34 | 0.045 | NO |
Figure S5. Get High-res Image This plot shows mRNAseq_cNMF expression data heatmap (on the left) a RunningEnrichmentScore(RES) plot (on the top right) and a Signal2Noise(S2N) plot (on the bottom right) of genes in the pathway: KEGG ARGININE AND PROLINE METABOLISM.
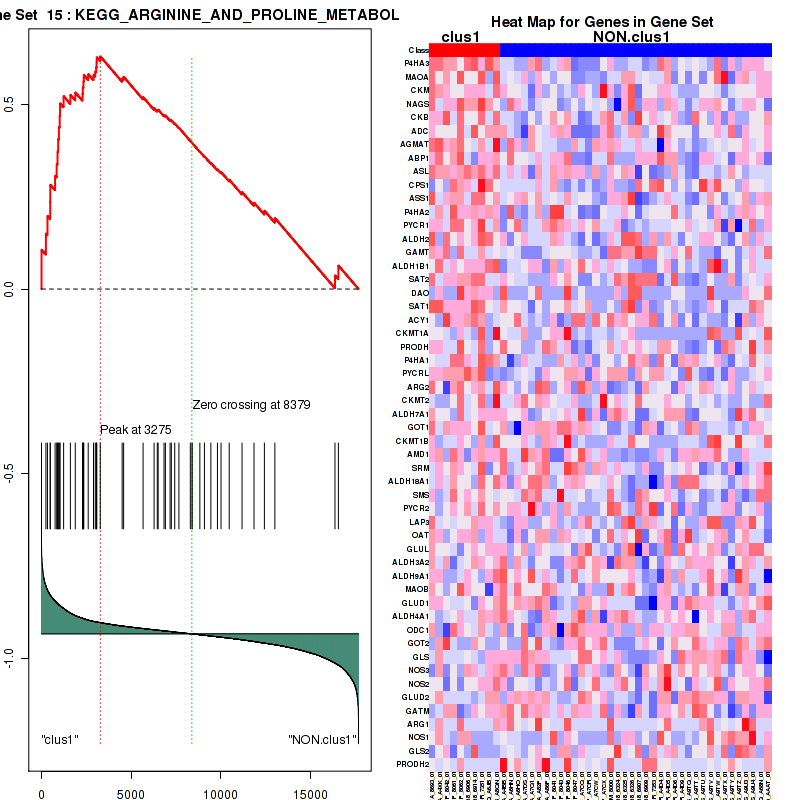
Figure S6. Get High-res Image For the top 5 core enriched genes in the pathway: KEGG ARGININE AND PROLINE METABOLISM, this volcano plot shows how much they are up/down-regulated and significant. The significance was calculated by empirical bayesian fit

Table S4. Get Full Table This table shows a Running Enrichment Score (RES) of each gene in this pathway, that is, the enrichment score at this point in the ranked list of genes. All genes are ranked by Signal-to-Noise (S2N), a measure of similarity as default and are used to obtain ES matrix of all genes. In this way, GSEA tool uses expression pattern of not only overlapped genes but also not-overlapped genes to produce ES matrix.
| Rank | GENE | SYMBOL | DESC | LIST.LOC | S2N | RES | CORE_ENRICHMENT |
|---|---|---|---|---|---|---|---|
| 1 | NME1-NME2 | NME1-NME2 | NME1-NME2 | 379 | 0.4 | 0.035 | YES |
| 2 | UPP1 | UPP1 | UPP1 | 513 | 0.37 | 0.078 | YES |
| 3 | AK5 | AK5 | AK5 | 564 | 0.36 | 0.12 | YES |
| 4 | CDA | CDA | CDA | 574 | 0.35 | 0.17 | YES |
| 5 | NT5E | NT5E | NT5E | 1130 | 0.26 | 0.18 | YES |
| 6 | GDA | GDA | GDA | 1450 | 0.22 | 0.19 | YES |
| 7 | GPX1 | GPX1 | GPX1 | 1969 | 0.17 | 0.18 | YES |
| 8 | TYMP | TYMP | TYMP | 1971 | 0.17 | 0.21 | YES |
| 9 | TK1 | TK1 | TK1 | 1991 | 0.17 | 0.23 | YES |
| 10 | TYMS | TYMS | TYMS | 2288 | 0.15 | 0.23 | YES |
| 11 | GMPR | GMPR | GMPR | 2375 | 0.14 | 0.25 | YES |
| 12 | UCK2 | UCK2 | UCK2 | 2437 | 0.14 | 0.26 | YES |
| 13 | DTYMK | DTYMK | DTYMK | 2502 | 0.14 | 0.28 | YES |
| 14 | NT5C | NT5C | NT5C | 2538 | 0.14 | 0.3 | YES |
| 15 | HPRT1 | HPRT1 | HPRT1 | 2669 | 0.13 | 0.31 | YES |
| 16 | NME1 | NME1 | NME1 | 2763 | 0.12 | 0.32 | YES |
| 17 | APRT | APRT | APRT | 2867 | 0.12 | 0.33 | YES |
| 18 | GUK1 | GUK1 | GUK1 | 2919 | 0.12 | 0.34 | YES |
| 19 | DUT | DUT | DUT | 2988 | 0.12 | 0.36 | YES |
| 20 | PNP | PNP | PNP | 3066 | 0.12 | 0.37 | YES |
| 21 | AK1 | AK1 | AK1 | 3288 | 0.11 | 0.37 | YES |
| 22 | RRM2 | RRM2 | RRM2 | 3297 | 0.11 | 0.38 | YES |
| 23 | GLRX | GLRX | GLRX | 3308 | 0.11 | 0.4 | YES |
| 24 | IMPDH2 | IMPDH2 | IMPDH2 | 3361 | 0.1 | 0.41 | YES |
| 25 | XDH | XDH | XDH | 3489 | 0.1 | 0.42 | YES |
| 26 | GMPR2 | GMPR2 | GMPR2 | 3874 | 0.091 | 0.41 | YES |
| 27 | IMPDH1 | IMPDH1 | IMPDH1 | 3925 | 0.089 | 0.42 | YES |
| 28 | NME2 | NME2 | NME2 | 4175 | 0.083 | 0.42 | YES |
| 29 | ADAL | ADAL | ADAL | 4535 | 0.075 | 0.4 | YES |
| 30 | AK2 | AK2 | AK2 | 4738 | 0.07 | 0.4 | YES |
| 31 | ADA | ADA | ADA | 4793 | 0.069 | 0.41 | YES |
| 32 | GSR | GSR | GSR | 4815 | 0.068 | 0.42 | YES |
| 33 | DHODH | DHODH | DHODH | 5046 | 0.064 | 0.41 | YES |
| 34 | TXN | TXN | TXN | 5142 | 0.062 | 0.42 | YES |
| 35 | TK2 | TK2 | TK2 | 5145 | 0.062 | 0.43 | YES |
| 36 | UMPS | UMPS | UMPS | 5330 | 0.058 | 0.42 | YES |
| 37 | ADSL | ADSL | ADSL | 5401 | 0.056 | 0.43 | YES |
| 38 | CTPS | CTPS | CTPS | 5476 | 0.055 | 0.43 | YES |
| 39 | UCK1 | UCK1 | UCK1 | 6266 | 0.04 | 0.39 | NO |
| 40 | NME4 | NME4 | NME4 | 6302 | 0.039 | 0.39 | NO |
| 41 | DGUOK | DGUOK | DGUOK | 6326 | 0.038 | 0.4 | NO |
| 42 | PAICS | PAICS | PAICS | 6443 | 0.036 | 0.4 | NO |
| 43 | ADK | ADK | ADK | 6665 | 0.032 | 0.39 | NO |
| 44 | RRM1 | RRM1 | RRM1 | 6703 | 0.031 | 0.39 | NO |
| 45 | CMPK1 | CMPK1 | CMPK1 | 6727 | 0.031 | 0.39 | NO |
| 46 | DPYD | DPYD | DPYD | 6784 | 0.03 | 0.4 | NO |
| 47 | DCK | DCK | DCK | 6822 | 0.029 | 0.4 | NO |
| 48 | GMPS | GMPS | GMPS | 7096 | 0.024 | 0.38 | NO |
| 49 | NT5C3 | NT5C3 | NT5C3 | 7953 | 0.0077 | 0.34 | NO |
| 50 | ATIC | ATIC | ATIC | 8140 | 0.0041 | 0.33 | NO |
| 51 | RRM2B | RRM2B | RRM2B | 8841 | -0.0088 | 0.29 | NO |
| 52 | GART | GART | GART | 9197 | -0.016 | 0.27 | NO |
| 53 | NT5C1A | NT5C1A | NT5C1A | 9549 | -0.023 | 0.25 | NO |
| 54 | CAT | CAT | CAT | 9598 | -0.024 | 0.25 | NO |
| 55 | PFAS | PFAS | PFAS | 9780 | -0.027 | 0.25 | NO |
| 56 | AMPD3 | AMPD3 | AMPD3 | 10085 | -0.034 | 0.24 | NO |
| 57 | ADSSL1 | ADSSL1 | ADSSL1 | 10459 | -0.041 | 0.22 | NO |
| 58 | TXNRD1 | TXNRD1 | TXNRD1 | 10662 | -0.045 | 0.22 | NO |
| 59 | CTPS2 | CTPS2 | CTPS2 | 10700 | -0.046 | 0.22 | NO |
| 60 | AMPD2 | AMPD2 | AMPD2 | 10850 | -0.05 | 0.22 | NO |
| 61 | DCTD | DCTD | DCTD | 10971 | -0.052 | 0.22 | NO |
| 62 | PPAT | PPAT | PPAT | 11132 | -0.056 | 0.22 | NO |
| 63 | DPYS | DPYS | DPYS | 11417 | -0.063 | 0.21 | NO |
| 64 | ADSS | ADSS | ADSS | 11987 | -0.077 | 0.19 | NO |
| 65 | NT5C2 | NT5C2 | NT5C2 | 12078 | -0.08 | 0.19 | NO |
| 66 | CAD | CAD | CAD | 12107 | -0.08 | 0.2 | NO |
| 67 | NT5C1B | NT5C1B | NT5C1B | 12528 | -0.092 | 0.19 | NO |
| 68 | UPP2 | UPP2 | UPP2 | 12704 | -0.096 | 0.2 | NO |
| 69 | AMPD1 | AMPD1 | AMPD1 | 13848 | -0.13 | 0.15 | NO |
| 70 | NT5M | NT5M | NT5M | 15861 | -0.24 | 0.068 | NO |
| 71 | UPB1 | UPB1 | UPB1 | 16021 | -0.25 | 0.094 | NO |
Figure S7. Get High-res Image This plot shows mRNAseq_cNMF expression data heatmap (on the left) a RunningEnrichmentScore(RES) plot (on the top right) and a Signal2Noise(S2N) plot (on the bottom right) of genes in the pathway: KEGG AMINO SUGAR AND NUCLEOTIDE SUGAR METABOLISM.
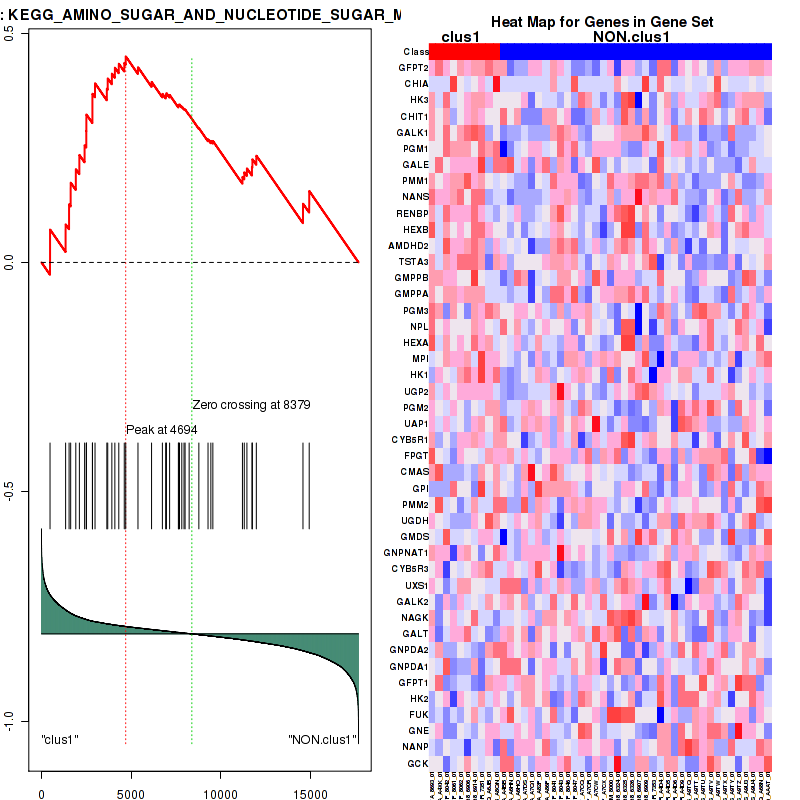
Figure S8. Get High-res Image For the top 5 core enriched genes in the pathway: KEGG AMINO SUGAR AND NUCLEOTIDE SUGAR METABOLISM, this volcano plot shows how much they are up/down-regulated and significant. The significance was calculated by empirical bayesian fit
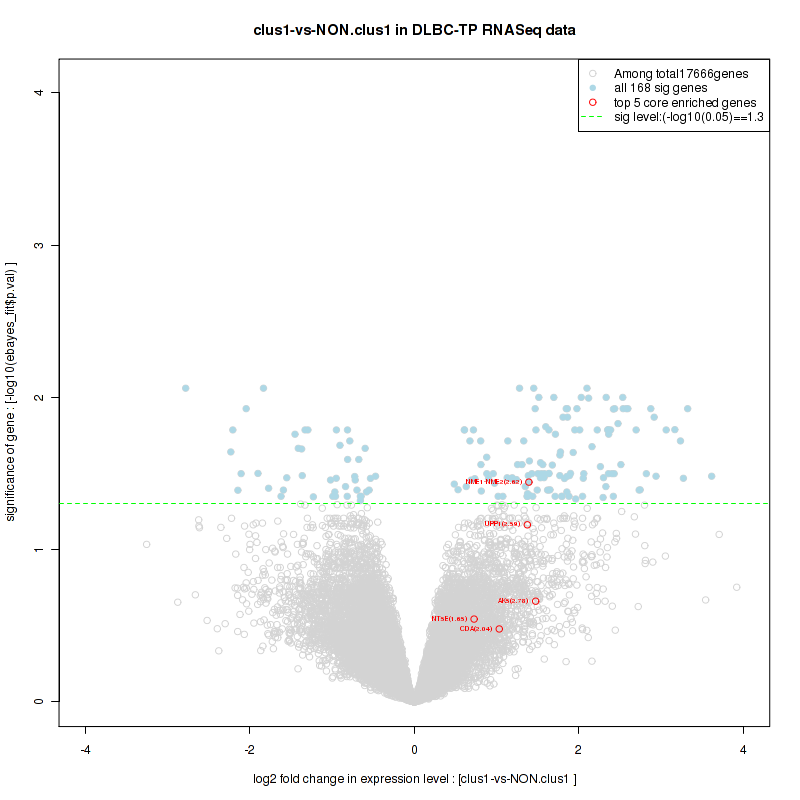
Table S5. Get Full Table This table shows a Running Enrichment Score (RES) of each gene in this pathway, that is, the enrichment score at this point in the ranked list of genes. All genes are ranked by Signal-to-Noise (S2N), a measure of similarity as default and are used to obtain ES matrix of all genes. In this way, GSEA tool uses expression pattern of not only overlapped genes but also not-overlapped genes to produce ES matrix.
| Rank | GENE | SYMBOL | DESC | LIST.LOC | S2N | RES | CORE_ENRICHMENT |
|---|---|---|---|---|---|---|---|
| 1 | SDC1 | SDC1 | SDC1 | 83 | 0.6 | 0.049 | YES |
| 2 | COL11A1 | COL11A1 | COL11A1 | 90 | 0.58 | 0.1 | YES |
| 3 | COL10A1 | COL10A1 | COL10A1 | 94 | 0.58 | 0.15 | YES |
| 4 | COL8A1 | COL8A1 | COL8A1 | 116 | 0.56 | 0.2 | YES |
| 5 | COL7A1 | COL7A1 | COL7A1 | 152 | 0.52 | 0.24 | YES |
| 6 | COL16A1 | COL16A1 | COL16A1 | 213 | 0.48 | 0.28 | YES |
| 7 | COL12A1 | COL12A1 | COL12A1 | 247 | 0.46 | 0.32 | YES |
| 8 | COL2A1 | COL2A1 | COL2A1 | 272 | 0.45 | 0.36 | YES |
| 9 | COL13A1 | COL13A1 | COL13A1 | 280 | 0.44 | 0.4 | YES |
| 10 | MET | MET | MET | 442 | 0.38 | 0.43 | YES |
| 11 | COL3A1 | COL3A1 | COL3A1 | 521 | 0.36 | 0.45 | YES |
| 12 | MMP1 | MMP1 | MMP1 | 586 | 0.35 | 0.48 | YES |
| 13 | COL5A1 | COL5A1 | COL5A1 | 599 | 0.35 | 0.51 | YES |
| 14 | COL5A2 | COL5A2 | COL5A2 | 621 | 0.34 | 0.54 | YES |
| 15 | COL1A1 | COL1A1 | COL1A1 | 713 | 0.32 | 0.56 | YES |
| 16 | MMP7 | MMP7 | MMP7 | 872 | 0.3 | 0.58 | YES |
| 17 | COL1A2 | COL1A2 | COL1A2 | 899 | 0.29 | 0.61 | YES |
| 18 | COL4A6 | COL4A6 | COL4A6 | 904 | 0.29 | 0.63 | YES |
| 19 | COL17A1 | COL17A1 | COL17A1 | 982 | 0.28 | 0.65 | YES |
| 20 | MMP9 | MMP9 | MMP9 | 1326 | 0.23 | 0.66 | YES |
| 21 | COL6A2 | COL6A2 | COL6A2 | 1504 | 0.21 | 0.66 | YES |
| 22 | COL4A3 | COL4A3 | COL4A3 | 1518 | 0.21 | 0.68 | YES |
| 23 | COL15A1 | COL15A1 | COL15A1 | 1925 | 0.17 | 0.67 | YES |
| 24 | COL8A2 | COL8A2 | COL8A2 | 1935 | 0.17 | 0.69 | YES |
| 25 | COL11A2 | COL11A2 | COL11A2 | 2027 | 0.17 | 0.7 | YES |
| 26 | COL4A4 | COL4A4 | COL4A4 | 2360 | 0.15 | 0.69 | YES |
| 27 | COL14A1 | COL14A1 | COL14A1 | 2478 | 0.14 | 0.7 | YES |
| 28 | COL9A2 | COL9A2 | COL9A2 | 2512 | 0.14 | 0.71 | YES |
| 29 | COL6A1 | COL6A1 | COL6A1 | 2630 | 0.13 | 0.71 | YES |
| 30 | COL6A3 | COL6A3 | COL6A3 | 3018 | 0.12 | 0.7 | NO |
| 31 | COL4A5 | COL4A5 | COL4A5 | 3077 | 0.11 | 0.71 | NO |
| 32 | CCL5 | CCL5 | CCL5 | 3360 | 0.1 | 0.7 | NO |
| 33 | SDCBP | SDCBP | SDCBP | 3894 | 0.09 | 0.68 | NO |
| 34 | PPIB | PPIB | PPIB | 4728 | 0.07 | 0.64 | NO |
| 35 | COL4A1 | COL4A1 | COL4A1 | 4785 | 0.069 | 0.64 | NO |
| 36 | BSG | BSG | BSG | 6537 | 0.034 | 0.55 | NO |
| 37 | TGFB1 | TGFB1 | TGFB1 | 6768 | 0.03 | 0.54 | NO |
| 38 | MAPK3 | MAPK3 | MAPK3 | 8502 | -0.0022 | 0.44 | NO |
| 39 | LAMA5 | LAMA5 | LAMA5 | 9952 | -0.031 | 0.36 | NO |
| 40 | HGF | HGF | HGF | 11982 | -0.077 | 0.25 | NO |
| 41 | MAPK1 | MAPK1 | MAPK1 | 12489 | -0.091 | 0.23 | NO |
| 42 | HPSE | HPSE | HPSE | 12815 | -0.099 | 0.22 | NO |
| 43 | PRKACA | PRKACA | PRKACA | 13292 | -0.11 | 0.2 | NO |
| 44 | COL9A1 | COL9A1 | COL9A1 | 13620 | -0.12 | 0.2 | NO |
| 45 | CASK | CASK | CASK | 14384 | -0.15 | 0.17 | NO |
| 46 | COL9A3 | COL9A3 | COL9A3 | 15754 | -0.23 | 0.11 | NO |
Figure S9. Get High-res Image This plot shows mRNAseq_cNMF expression data heatmap (on the left) a RunningEnrichmentScore(RES) plot (on the top right) and a Signal2Noise(S2N) plot (on the bottom right) of genes in the pathway: KEGG PYRUVATE METABOLISM.
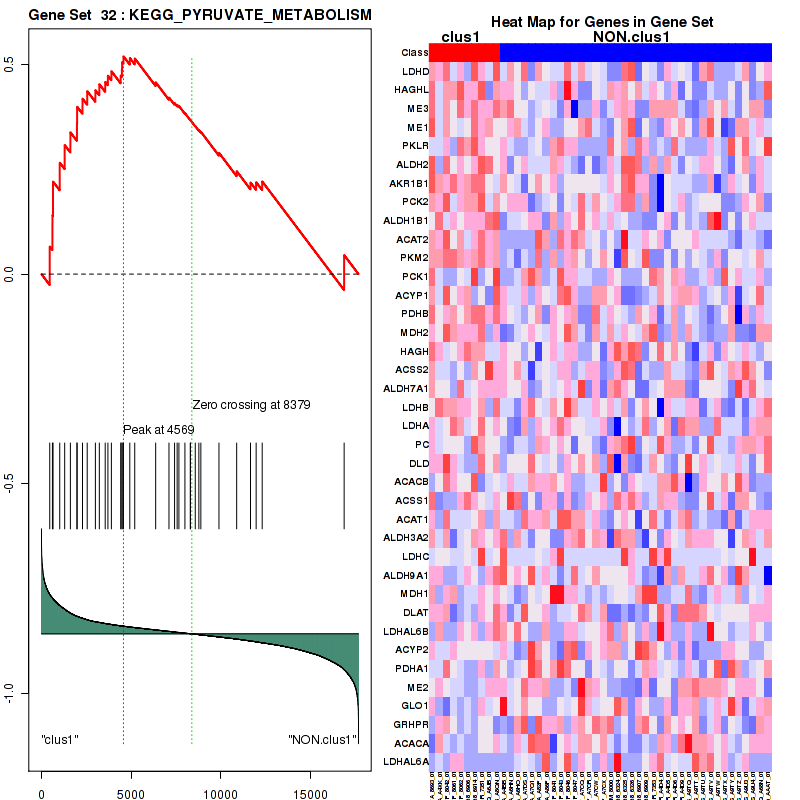
Figure S10. Get High-res Image For the top 5 core enriched genes in the pathway: KEGG PYRUVATE METABOLISM, this volcano plot shows how much they are up/down-regulated and significant. The significance was calculated by empirical bayesian fit

Table S6. Get Full Table This table shows a Running Enrichment Score (RES) of each gene in this pathway, that is, the enrichment score at this point in the ranked list of genes. All genes are ranked by Signal-to-Noise (S2N), a measure of similarity as default and are used to obtain ES matrix of all genes. In this way, GSEA tool uses expression pattern of not only overlapped genes but also not-overlapped genes to produce ES matrix.
| Rank | GENE | SYMBOL | DESC | LIST.LOC | S2N | RES | CORE_ENRICHMENT |
|---|---|---|---|---|---|---|---|
| 1 | GPC6 | GPC6 | GPC6 | 49 | 0.65 | 0.075 | YES |
| 2 | SDC1 | SDC1 | SDC1 | 83 | 0.6 | 0.14 | YES |
| 3 | GXYLT2 | GXYLT2 | GXYLT2 | 132 | 0.53 | 0.21 | YES |
| 4 | DCN | DCN | DCN | 161 | 0.51 | 0.27 | YES |
| 5 | HYAL1 | HYAL1 | HYAL1 | 510 | 0.37 | 0.29 | YES |
| 6 | CSPG4 | CSPG4 | CSPG4 | 520 | 0.36 | 0.33 | YES |
| 7 | GPC3 | GPC3 | GPC3 | 910 | 0.29 | 0.34 | YES |
| 8 | BCAN | BCAN | BCAN | 1024 | 0.27 | 0.37 | YES |
| 9 | GPC4 | GPC4 | GPC4 | 1039 | 0.27 | 0.4 | YES |
| 10 | VCAN | VCAN | VCAN | 1151 | 0.25 | 0.43 | YES |
| 11 | BGN | BGN | BGN | 1260 | 0.24 | 0.45 | YES |
| 12 | CHPF | CHPF | CHPF | 1288 | 0.24 | 0.48 | YES |
| 13 | GPC1 | GPC1 | GPC1 | 1331 | 0.23 | 0.5 | YES |
| 14 | CHSY3 | CHSY3 | CHSY3 | 1501 | 0.21 | 0.52 | YES |
| 15 | SDC2 | SDC2 | SDC2 | 1707 | 0.19 | 0.53 | YES |
| 16 | CHST3 | CHST3 | CHST3 | 1922 | 0.17 | 0.54 | YES |
| 17 | CHST13 | CHST13 | CHST13 | 2078 | 0.16 | 0.55 | YES |
| 18 | CHST11 | CHST11 | CHST11 | 2312 | 0.15 | 0.55 | YES |
| 19 | CSGALNACT1 | CSGALNACT1 | CSGALNACT1 | 2395 | 0.14 | 0.57 | YES |
| 20 | AGRN | AGRN | AGRN | 2480 | 0.14 | 0.58 | YES |
| 21 | SDC4 | SDC4 | SDC4 | 2581 | 0.13 | 0.59 | YES |
| 22 | HEXB | HEXB | HEXB | 2840 | 0.12 | 0.59 | NO |
| 23 | B3GAT3 | B3GAT3 | B3GAT3 | 3196 | 0.11 | 0.58 | NO |
| 24 | B4GALT7 | B4GALT7 | B4GALT7 | 3711 | 0.095 | 0.56 | NO |
| 25 | CHST9 | CHST9 | CHST9 | 3797 | 0.093 | 0.57 | NO |
| 26 | HSPG2 | HSPG2 | HSPG2 | 4100 | 0.085 | 0.56 | NO |
| 27 | HEXA | HEXA | HEXA | 4614 | 0.073 | 0.54 | NO |
| 28 | DSE | DSE | DSE | 5856 | 0.048 | 0.48 | NO |
| 29 | IDUA | IDUA | IDUA | 6493 | 0.035 | 0.45 | NO |
| 30 | ARSB | ARSB | ARSB | 6582 | 0.034 | 0.44 | NO |
| 31 | CHPF2 | CHPF2 | CHPF2 | 6626 | 0.033 | 0.45 | NO |
| 32 | GPC2 | GPC2 | GPC2 | 8170 | 0.0037 | 0.36 | NO |
| 33 | IDS | IDS | IDS | 8525 | -0.0028 | 0.34 | NO |
| 34 | B3GALT6 | B3GALT6 | B3GALT6 | 9200 | -0.016 | 0.3 | NO |
| 35 | CHST14 | CHST14 | CHST14 | 9865 | -0.029 | 0.27 | NO |
| 36 | CSGALNACT2 | CSGALNACT2 | CSGALNACT2 | 10556 | -0.043 | 0.24 | NO |
| 37 | NCAN | NCAN | NCAN | 11068 | -0.055 | 0.21 | NO |
| 38 | CHST12 | CHST12 | CHST12 | 11488 | -0.065 | 0.2 | NO |
| 39 | GXYLT1 | GXYLT1 | GXYLT1 | 12479 | -0.091 | 0.15 | NO |
| 40 | CHSY1 | CHSY1 | CHSY1 | 12520 | -0.091 | 0.16 | NO |
| 41 | UST | UST | UST | 13549 | -0.12 | 0.12 | NO |
| 42 | SDC3 | SDC3 | SDC3 | 14038 | -0.14 | 0.1 | NO |
| 43 | CHST7 | CHST7 | CHST7 | 14281 | -0.15 | 0.11 | NO |
| 44 | CHST15 | CHST15 | CHST15 | 14553 | -0.16 | 0.11 | NO |
| 45 | B3GAT1 | B3GAT1 | B3GAT1 | 14847 | -0.18 | 0.12 | NO |
| 46 | GPC5 | GPC5 | GPC5 | 14870 | -0.18 | 0.14 | NO |
| 47 | B3GAT2 | B3GAT2 | B3GAT2 | 14876 | -0.18 | 0.16 | NO |
Figure S11. Get High-res Image This plot shows mRNAseq_cNMF expression data heatmap (on the left) a RunningEnrichmentScore(RES) plot (on the top right) and a Signal2Noise(S2N) plot (on the bottom right) of genes in the pathway: PID INTEGRIN3 PATHWAY.
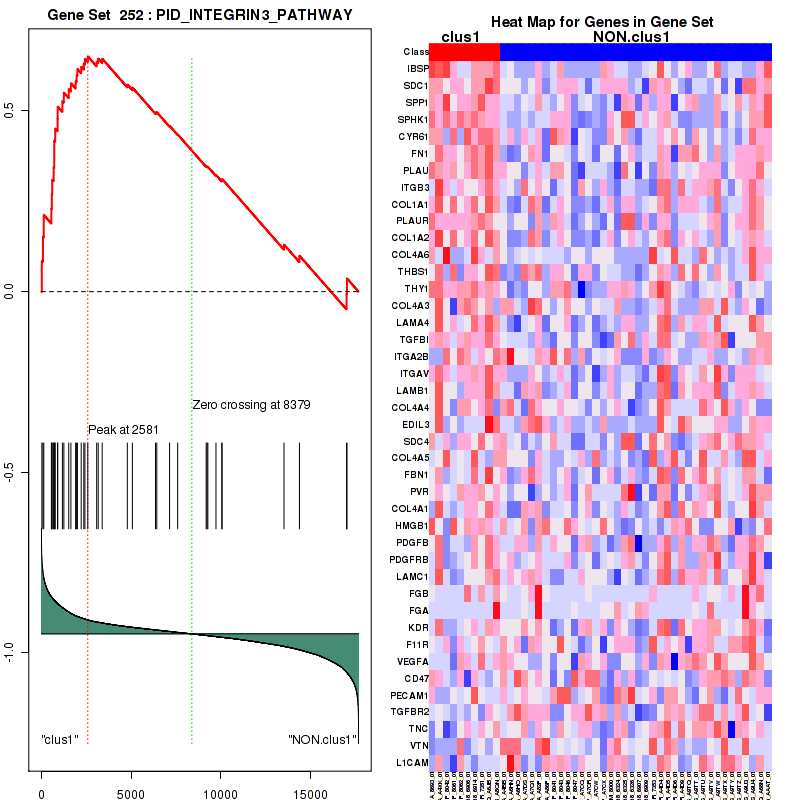
Figure S12. Get High-res Image For the top 5 core enriched genes in the pathway: PID INTEGRIN3 PATHWAY, this volcano plot shows how much they are up/down-regulated and significant. The significance was calculated by empirical bayesian fit
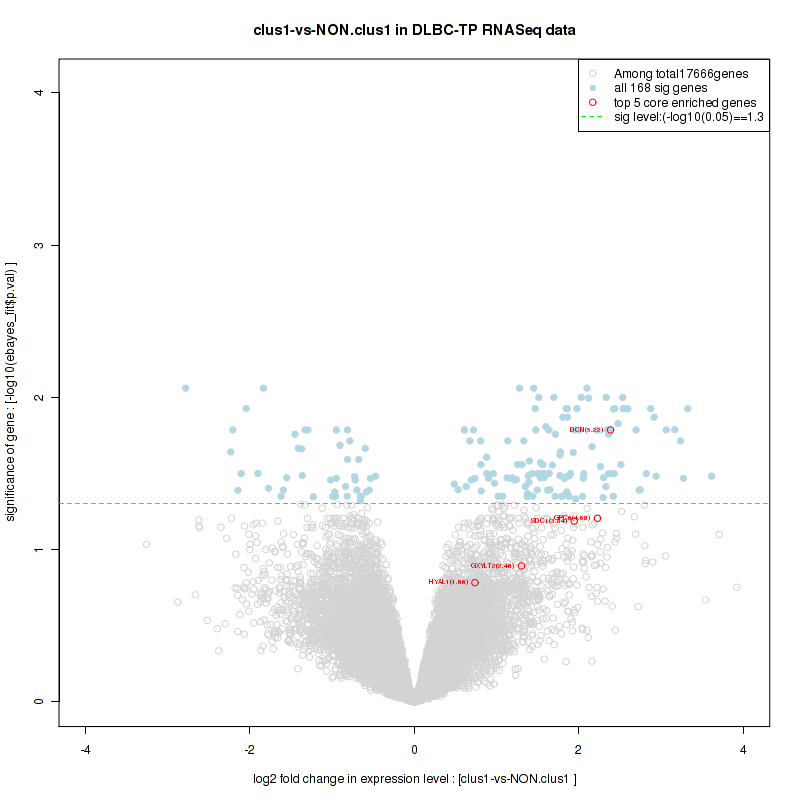
Table S7. Get Full Table This table shows a Running Enrichment Score (RES) of each gene in this pathway, that is, the enrichment score at this point in the ranked list of genes. All genes are ranked by Signal-to-Noise (S2N), a measure of similarity as default and are used to obtain ES matrix of all genes. In this way, GSEA tool uses expression pattern of not only overlapped genes but also not-overlapped genes to produce ES matrix.
| Rank | GENE | SYMBOL | DESC | LIST.LOC | S2N | RES | CORE_ENRICHMENT |
|---|---|---|---|---|---|---|---|
| 1 | COL11A1 | COL11A1 | COL11A1 | 90 | 0.58 | 0.024 | YES |
| 2 | COL10A1 | COL10A1 | COL10A1 | 94 | 0.58 | 0.054 | YES |
| 3 | COL8A1 | COL8A1 | COL8A1 | 116 | 0.56 | 0.08 | YES |
| 4 | MMP2 | MMP2 | MMP2 | 142 | 0.53 | 0.11 | YES |
| 5 | COL7A1 | COL7A1 | COL7A1 | 152 | 0.52 | 0.13 | YES |
| 6 | LEPREL2 | LEPREL2 | LEPREL2 | 180 | 0.5 | 0.16 | YES |
| 7 | COL16A1 | COL16A1 | COL16A1 | 213 | 0.48 | 0.18 | YES |
| 8 | COL12A1 | COL12A1 | COL12A1 | 247 | 0.46 | 0.2 | YES |
| 9 | MMP8 | MMP8 | MMP8 | 254 | 0.46 | 0.22 | YES |
| 10 | COL2A1 | COL2A1 | COL2A1 | 272 | 0.45 | 0.24 | YES |
| 11 | COL13A1 | COL13A1 | COL13A1 | 280 | 0.44 | 0.26 | YES |
| 12 | MMP13 | MMP13 | MMP13 | 336 | 0.42 | 0.28 | YES |
| 13 | PLOD2 | PLOD2 | PLOD2 | 352 | 0.42 | 0.3 | YES |
| 14 | MMP11 | MMP11 | MMP11 | 374 | 0.4 | 0.32 | YES |
| 15 | COL3A1 | COL3A1 | COL3A1 | 521 | 0.36 | 0.33 | YES |
| 16 | COL5A3 | COL5A3 | COL5A3 | 555 | 0.36 | 0.35 | YES |
| 17 | MMP1 | MMP1 | MMP1 | 586 | 0.35 | 0.36 | YES |
| 18 | COL5A1 | COL5A1 | COL5A1 | 599 | 0.35 | 0.38 | YES |
| 19 | COL5A2 | COL5A2 | COL5A2 | 621 | 0.34 | 0.4 | YES |
| 20 | COL1A1 | COL1A1 | COL1A1 | 713 | 0.32 | 0.41 | YES |
| 21 | BMP1 | BMP1 | BMP1 | 748 | 0.32 | 0.42 | YES |
| 22 | MMP14 | MMP14 | MMP14 | 753 | 0.32 | 0.44 | YES |
| 23 | MMP7 | MMP7 | MMP7 | 872 | 0.3 | 0.45 | YES |
| 24 | COL1A2 | COL1A2 | COL1A2 | 899 | 0.29 | 0.46 | YES |
| 25 | COL4A6 | COL4A6 | COL4A6 | 904 | 0.29 | 0.48 | YES |
| 26 | MMP3 | MMP3 | MMP3 | 921 | 0.29 | 0.49 | YES |
| 27 | COL17A1 | COL17A1 | COL17A1 | 982 | 0.28 | 0.5 | YES |
| 28 | PCOLCE | PCOLCE | PCOLCE | 1004 | 0.27 | 0.51 | YES |
| 29 | ADAMTS2 | ADAMTS2 | ADAMTS2 | 1084 | 0.26 | 0.52 | YES |
| 30 | MMP15 | MMP15 | MMP15 | 1158 | 0.25 | 0.53 | YES |
| 31 | MMP17 | MMP17 | MMP17 | 1176 | 0.25 | 0.54 | YES |
| 32 | MMP9 | MMP9 | MMP9 | 1326 | 0.23 | 0.54 | YES |
| 33 | COL6A2 | COL6A2 | COL6A2 | 1504 | 0.21 | 0.55 | YES |
| 34 | COL4A3 | COL4A3 | COL4A3 | 1518 | 0.21 | 0.55 | YES |
| 35 | KLK2 | KLK2 | KLK2 | 1778 | 0.18 | 0.55 | YES |
| 36 | COL23A1 | COL23A1 | COL23A1 | 1871 | 0.18 | 0.55 | YES |
| 37 | COL15A1 | COL15A1 | COL15A1 | 1925 | 0.17 | 0.56 | YES |
| 38 | COL8A2 | COL8A2 | COL8A2 | 1935 | 0.17 | 0.57 | YES |
| 39 | TPSAB1 | TPSAB1 | TPSAB1 | 1960 | 0.17 | 0.57 | YES |
| 40 | SERPINH1 | SERPINH1 | SERPINH1 | 2009 | 0.17 | 0.58 | YES |
| 41 | ELANE | ELANE | ELANE | 2014 | 0.17 | 0.59 | YES |
| 42 | COL11A2 | COL11A2 | COL11A2 | 2027 | 0.17 | 0.6 | YES |
| 43 | COL28A1 | COL28A1 | COL28A1 | 2047 | 0.16 | 0.6 | YES |
| 44 | MMP24 | MMP24 | MMP24 | 2100 | 0.16 | 0.61 | YES |
| 45 | TIMP2 | TIMP2 | TIMP2 | 2208 | 0.16 | 0.61 | YES |
| 46 | ADAMTS14 | ADAMTS14 | ADAMTS14 | 2235 | 0.15 | 0.62 | YES |
| 47 | COL4A4 | COL4A4 | COL4A4 | 2360 | 0.15 | 0.62 | YES |
| 48 | COL22A1 | COL22A1 | COL22A1 | 2429 | 0.14 | 0.62 | YES |
| 49 | COL14A1 | COL14A1 | COL14A1 | 2478 | 0.14 | 0.62 | YES |
| 50 | COL9A2 | COL9A2 | COL9A2 | 2512 | 0.14 | 0.63 | YES |
| 51 | PRSS1 | PRSS1 | PRSS1 | 2518 | 0.14 | 0.64 | YES |
| 52 | TIMP1 | TIMP1 | TIMP1 | 2613 | 0.13 | 0.64 | YES |
| 53 | COL6A1 | COL6A1 | COL6A1 | 2630 | 0.13 | 0.64 | YES |
| 54 | PLOD1 | PLOD1 | PLOD1 | 2854 | 0.12 | 0.64 | NO |
| 55 | COL6A3 | COL6A3 | COL6A3 | 3018 | 0.12 | 0.63 | NO |
| 56 | COL21A1 | COL21A1 | COL21A1 | 3061 | 0.12 | 0.64 | NO |
| 57 | COL4A5 | COL4A5 | COL4A5 | 3077 | 0.11 | 0.64 | NO |
| 58 | ADAMTS3 | ADAMTS3 | ADAMTS3 | 3541 | 0.1 | 0.62 | NO |
| 59 | MMP16 | MMP16 | MMP16 | 3673 | 0.096 | 0.62 | NO |
| 60 | CRTAP | CRTAP | CRTAP | 4139 | 0.084 | 0.6 | NO |
| 61 | COL4A2 | COL4A2 | COL4A2 | 4195 | 0.082 | 0.6 | NO |
| 62 | COL24A1 | COL24A1 | COL24A1 | 4718 | 0.07 | 0.57 | NO |
| 63 | PPIB | PPIB | PPIB | 4728 | 0.07 | 0.57 | NO |
| 64 | COL4A1 | COL4A1 | COL4A1 | 4785 | 0.069 | 0.57 | NO |
| 65 | P4HB | P4HB | P4HB | 5450 | 0.055 | 0.54 | NO |
| 66 | FURIN | FURIN | FURIN | 5503 | 0.054 | 0.54 | NO |
| 67 | PLOD3 | PLOD3 | PLOD3 | 5970 | 0.045 | 0.51 | NO |
| 68 | GLT25D1 | GLT25D1 | GLT25D1 | 6260 | 0.04 | 0.5 | NO |
| 69 | COL27A1 | COL27A1 | COL27A1 | 7053 | 0.025 | 0.46 | NO |
| 70 | MMP25 | MMP25 | MMP25 | 9840 | -0.028 | 0.3 | NO |
| 71 | LEPREL1 | LEPREL1 | LEPREL1 | 10678 | -0.046 | 0.25 | NO |
| 72 | CMA1 | CMA1 | CMA1 | 10875 | -0.05 | 0.24 | NO |
| 73 | CTSG | CTSG | CTSG | 11496 | -0.065 | 0.21 | NO |
| 74 | KLKB1 | KLKB1 | KLKB1 | 11625 | -0.068 | 0.21 | NO |
| 75 | CTRB1 | CTRB1 | CTRB1 | 12665 | -0.095 | 0.15 | NO |
| 76 | TLL2 | TLL2 | TLL2 | 13401 | -0.12 | 0.12 | NO |
| 77 | COL9A1 | COL9A1 | COL9A1 | 13620 | -0.12 | 0.11 | NO |
| 78 | MMP10 | MMP10 | MMP10 | 14597 | -0.16 | 0.065 | NO |
| 79 | TLL1 | TLL1 | TLL1 | 15574 | -0.22 | 0.02 | NO |
| 80 | COL9A3 | COL9A3 | COL9A3 | 15754 | -0.23 | 0.022 | NO |
| 81 | CTRB2 | CTRB2 | CTRB2 | 16365 | -0.28 | 0.0016 | NO |
| 82 | COL19A1 | COL19A1 | COL19A1 | 16458 | -0.29 | 0.011 | NO |
| 83 | GLT25D2 | GLT25D2 | GLT25D2 | 16778 | -0.33 | 0.0096 | NO |
| 84 | COL25A1 | COL25A1 | COL25A1 | 17043 | -0.38 | 0.014 | NO |
| 85 | PCOLCE2 | PCOLCE2 | PCOLCE2 | 17268 | -0.43 | 0.023 | NO |
Figure S13. Get High-res Image This plot shows mRNAseq_cNMF expression data heatmap (on the left) a RunningEnrichmentScore(RES) plot (on the top right) and a Signal2Noise(S2N) plot (on the bottom right) of genes in the pathway: PID AVB3 INTEGRIN PATHWAY.
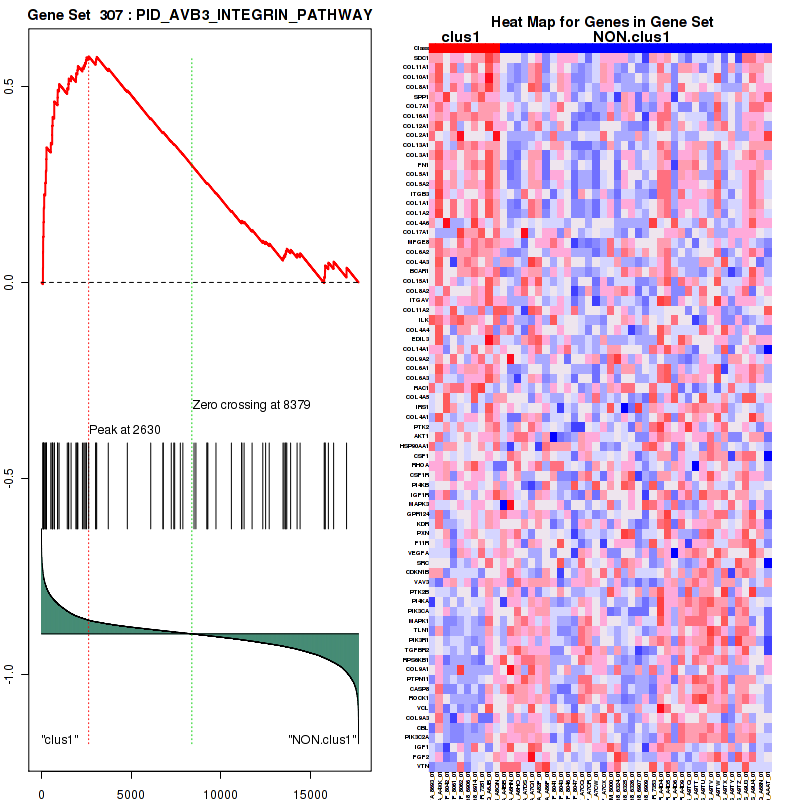
Figure S14. Get High-res Image For the top 5 core enriched genes in the pathway: PID AVB3 INTEGRIN PATHWAY, this volcano plot shows how much they are up/down-regulated and significant. The significance was calculated by empirical bayesian fit
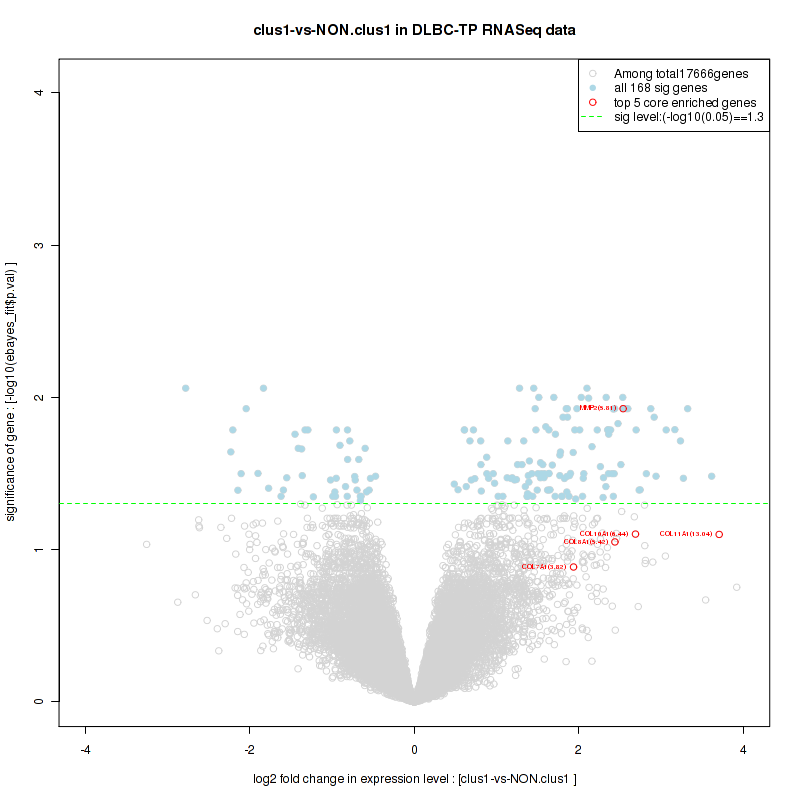
Table S8. Get Full Table This table shows a Running Enrichment Score (RES) of each gene in this pathway, that is, the enrichment score at this point in the ranked list of genes. All genes are ranked by Signal-to-Noise (S2N), a measure of similarity as default and are used to obtain ES matrix of all genes. In this way, GSEA tool uses expression pattern of not only overlapped genes but also not-overlapped genes to produce ES matrix.
| Rank | GENE | SYMBOL | DESC | LIST.LOC | S2N | RES | CORE_ENRICHMENT |
|---|---|---|---|---|---|---|---|
| 1 | GPC6 | GPC6 | GPC6 | 49 | 0.65 | 0.078 | YES |
| 2 | SDC1 | SDC1 | SDC1 | 83 | 0.6 | 0.15 | YES |
| 3 | GXYLT2 | GXYLT2 | GXYLT2 | 132 | 0.53 | 0.21 | YES |
| 4 | DCN | DCN | DCN | 161 | 0.51 | 0.27 | YES |
| 5 | HS6ST3 | HS6ST3 | HS6ST3 | 450 | 0.38 | 0.3 | YES |
| 6 | CSPG4 | CSPG4 | CSPG4 | 520 | 0.36 | 0.35 | YES |
| 7 | HS3ST2 | HS3ST2 | HS3ST2 | 710 | 0.32 | 0.38 | YES |
| 8 | GPC3 | GPC3 | GPC3 | 910 | 0.29 | 0.4 | YES |
| 9 | BCAN | BCAN | BCAN | 1024 | 0.27 | 0.43 | YES |
| 10 | HS6ST2 | HS6ST2 | HS6ST2 | 1028 | 0.27 | 0.46 | YES |
| 11 | GPC4 | GPC4 | GPC4 | 1039 | 0.27 | 0.49 | YES |
| 12 | VCAN | VCAN | VCAN | 1151 | 0.25 | 0.52 | YES |
| 13 | BGN | BGN | BGN | 1260 | 0.24 | 0.54 | YES |
| 14 | GPC1 | GPC1 | GPC1 | 1331 | 0.23 | 0.57 | YES |
| 15 | SDC2 | SDC2 | SDC2 | 1707 | 0.19 | 0.57 | YES |
| 16 | HS3ST4 | HS3ST4 | HS3ST4 | 2094 | 0.16 | 0.57 | YES |
| 17 | AGRN | AGRN | AGRN | 2480 | 0.14 | 0.56 | YES |
| 18 | SDC4 | SDC4 | SDC4 | 2581 | 0.13 | 0.57 | YES |
| 19 | NAGLU | NAGLU | NAGLU | 3130 | 0.11 | 0.56 | NO |
| 20 | B3GAT3 | B3GAT3 | B3GAT3 | 3196 | 0.11 | 0.57 | NO |
| 21 | NDST3 | NDST3 | NDST3 | 3363 | 0.1 | 0.57 | NO |
| 22 | B4GALT7 | B4GALT7 | B4GALT7 | 3711 | 0.095 | 0.56 | NO |
| 23 | HSPG2 | HSPG2 | HSPG2 | 4100 | 0.085 | 0.55 | NO |
| 24 | IDUA | IDUA | IDUA | 6493 | 0.035 | 0.42 | NO |
| 25 | GUSB | GUSB | GUSB | 6945 | 0.027 | 0.4 | NO |
| 26 | GLB1 | GLB1 | GLB1 | 7507 | 0.016 | 0.37 | NO |
| 27 | EXT1 | EXT1 | EXT1 | 7830 | 0.0098 | 0.35 | NO |
| 28 | GPC2 | GPC2 | GPC2 | 8170 | 0.0037 | 0.33 | NO |
| 29 | HPSE2 | HPSE2 | HPSE2 | 8247 | 0.0024 | 0.33 | NO |
| 30 | GLCE | GLCE | GLCE | 8360 | 0.00053 | 0.32 | NO |
| 31 | IDS | IDS | IDS | 8525 | -0.0028 | 0.31 | NO |
| 32 | HS2ST1 | HS2ST1 | HS2ST1 | 8730 | -0.0068 | 0.3 | NO |
| 33 | SGSH | SGSH | SGSH | 9037 | -0.013 | 0.28 | NO |
| 34 | B3GALT6 | B3GALT6 | B3GALT6 | 9200 | -0.016 | 0.28 | NO |
| 35 | EXT2 | EXT2 | EXT2 | 10435 | -0.04 | 0.21 | NO |
| 36 | NCAN | NCAN | NCAN | 11068 | -0.055 | 0.18 | NO |
| 37 | NDST1 | NDST1 | NDST1 | 11296 | -0.06 | 0.18 | NO |
| 38 | HS3ST1 | HS3ST1 | HS3ST1 | 11329 | -0.06 | 0.18 | NO |
| 39 | HS3ST3A1 | HS3ST3A1 | HS3ST3A1 | 11522 | -0.065 | 0.18 | NO |
| 40 | GXYLT1 | GXYLT1 | GXYLT1 | 12479 | -0.091 | 0.14 | NO |
| 41 | HPSE | HPSE | HPSE | 12815 | -0.099 | 0.13 | NO |
| 42 | HS6ST1 | HS6ST1 | HS6ST1 | 13305 | -0.11 | 0.12 | NO |
| 43 | NDST2 | NDST2 | NDST2 | 13725 | -0.13 | 0.11 | NO |
| 44 | SDC3 | SDC3 | SDC3 | 14038 | -0.14 | 0.11 | NO |
| 45 | B3GAT1 | B3GAT1 | B3GAT1 | 14847 | -0.18 | 0.084 | NO |
| 46 | GPC5 | GPC5 | GPC5 | 14870 | -0.18 | 0.1 | NO |
| 47 | B3GAT2 | B3GAT2 | B3GAT2 | 14876 | -0.18 | 0.13 | NO |
| 48 | HS3ST3B1 | HS3ST3B1 | HS3ST3B1 | 16092 | -0.26 | 0.089 | NO |
Figure S15. Get High-res Image This plot shows mRNAseq_cNMF expression data heatmap (on the left) a RunningEnrichmentScore(RES) plot (on the top right) and a Signal2Noise(S2N) plot (on the bottom right) of genes in the pathway: PID SYNDECAN 1 PATHWAY.

Figure S16. Get High-res Image For the top 5 core enriched genes in the pathway: PID SYNDECAN 1 PATHWAY, this volcano plot shows how much they are up/down-regulated and significant. The significance was calculated by empirical bayesian fit
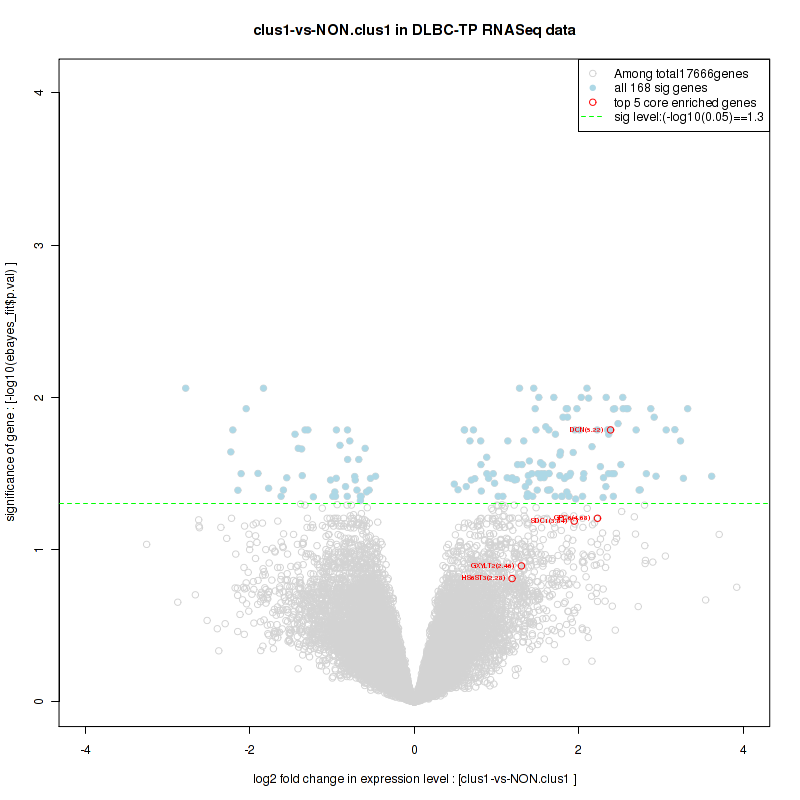
Table S9. Get Full Table This table shows a Running Enrichment Score (RES) of each gene in this pathway, that is, the enrichment score at this point in the ranked list of genes. All genes are ranked by Signal-to-Noise (S2N), a measure of similarity as default and are used to obtain ES matrix of all genes. In this way, GSEA tool uses expression pattern of not only overlapped genes but also not-overlapped genes to produce ES matrix.
| Rank | GENE | SYMBOL | DESC | LIST.LOC | S2N | RES | CORE_ENRICHMENT |
|---|---|---|---|---|---|---|---|
| 1 | SPP1 | SPP1 | SPP1 | 129 | 0.54 | 0.13 | YES |
| 2 | THBS2 | THBS2 | THBS2 | 222 | 0.48 | 0.25 | YES |
| 3 | FN1 | FN1 | FN1 | 597 | 0.35 | 0.31 | YES |
| 4 | ADAM28 | ADAM28 | ADAM28 | 980 | 0.28 | 0.36 | YES |
| 5 | THBS1 | THBS1 | THBS1 | 1167 | 0.25 | 0.42 | YES |
| 6 | BCAR1 | BCAR1 | BCAR1 | 1651 | 0.2 | 0.44 | YES |
| 7 | PRKAR1B | PRKAR1B | PRKAR1B | 1883 | 0.18 | 0.47 | YES |
| 8 | CD14 | CD14 | CD14 | 2304 | 0.15 | 0.48 | YES |
| 9 | MDK | MDK | MDK | 2684 | 0.13 | 0.5 | YES |
| 10 | RAC1 | RAC1 | RAC1 | 3042 | 0.12 | 0.5 | YES |
| 11 | CD81 | CD81 | CD81 | 4011 | 0.087 | 0.47 | NO |
| 12 | JAM2 | JAM2 | JAM2 | 4314 | 0.08 | 0.48 | NO |
| 13 | ITGB1 | ITGB1 | ITGB1 | 5411 | 0.056 | 0.43 | NO |
| 14 | PTK2 | PTK2 | PTK2 | 6087 | 0.043 | 0.4 | NO |
| 15 | IGSF8 | IGSF8 | IGSF8 | 6235 | 0.04 | 0.4 | NO |
| 16 | AMICA1 | AMICA1 | AMICA1 | 6593 | 0.033 | 0.39 | NO |
| 17 | DOCK1 | DOCK1 | DOCK1 | 6823 | 0.029 | 0.38 | NO |
| 18 | ARF6 | ARF6 | ARF6 | 7454 | 0.017 | 0.35 | NO |
| 19 | CRK | CRK | CRK | 7582 | 0.014 | 0.35 | NO |
| 20 | PTPRA | PTPRA | PTPRA | 9198 | -0.016 | 0.26 | NO |
| 21 | PXN | PXN | PXN | 9225 | -0.016 | 0.27 | NO |
| 22 | YWHAZ | YWHAZ | YWHAZ | 9431 | -0.02 | 0.26 | NO |
| 23 | PRKAR1A | PRKAR1A | PRKAR1A | 9562 | -0.023 | 0.26 | NO |
| 24 | PRKACB | PRKACB | PRKACB | 9968 | -0.031 | 0.24 | NO |
| 25 | SRC | SRC | SRC | 10582 | -0.044 | 0.22 | NO |
| 26 | VCAM1 | VCAM1 | VCAM1 | 10596 | -0.044 | 0.23 | NO |
| 27 | GIT1 | GIT1 | GIT1 | 10598 | -0.044 | 0.24 | NO |
| 28 | PTK2B | PTK2B | PTK2B | 11290 | -0.06 | 0.22 | NO |
| 29 | ABI1 | ABI1 | ABI1 | 11996 | -0.078 | 0.2 | NO |
| 30 | TLN1 | TLN1 | TLN1 | 12690 | -0.096 | 0.18 | NO |
| 31 | PRKACA | PRKACA | PRKACA | 13292 | -0.11 | 0.18 | NO |
| 32 | ITGA4 | ITGA4 | ITGA4 | 16322 | -0.28 | 0.076 | NO |
Figure S17. Get High-res Image This plot shows mRNAseq_cNMF expression data heatmap (on the left) a RunningEnrichmentScore(RES) plot (on the top right) and a Signal2Noise(S2N) plot (on the bottom right) of genes in the pathway: PID INTEGRIN A4B1 PATHWAY.
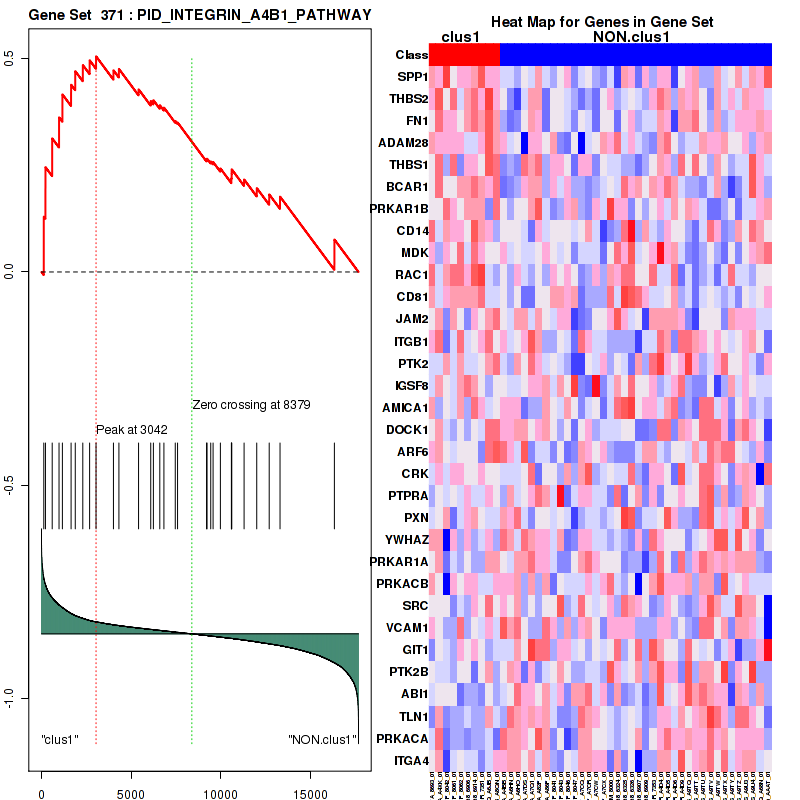
Figure S18. Get High-res Image For the top 5 core enriched genes in the pathway: PID INTEGRIN A4B1 PATHWAY, this volcano plot shows how much they are up/down-regulated and significant. The significance was calculated by empirical bayesian fit
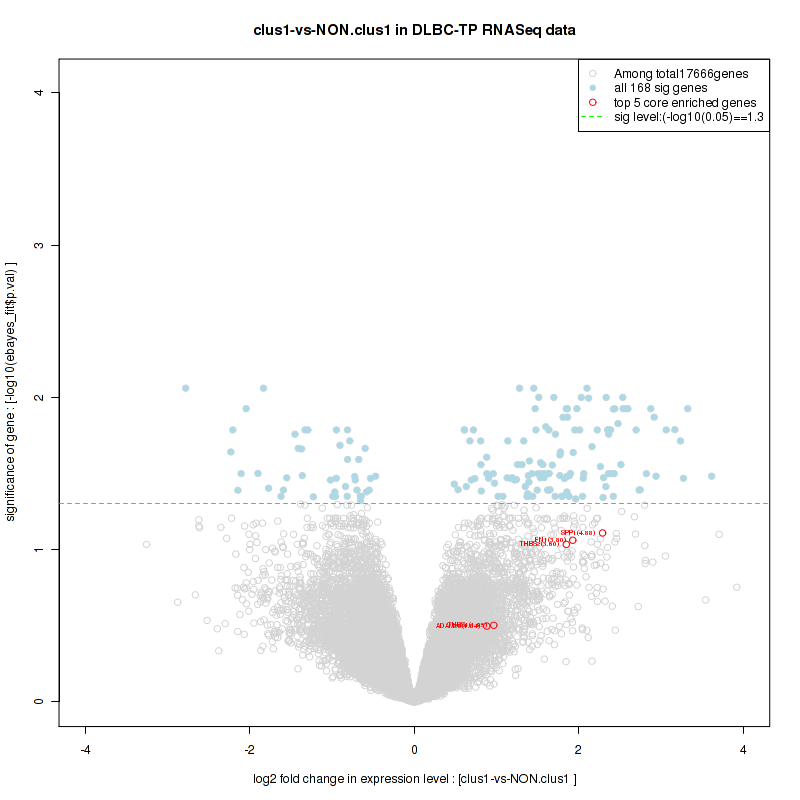
Table S10. Get Full Table This table shows a Running Enrichment Score (RES) of each gene in this pathway, that is, the enrichment score at this point in the ranked list of genes. All genes are ranked by Signal-to-Noise (S2N), a measure of similarity as default and are used to obtain ES matrix of all genes. In this way, GSEA tool uses expression pattern of not only overlapped genes but also not-overlapped genes to produce ES matrix.
| Rank | GENE | SYMBOL | DESC | LIST.LOC | S2N | RES | CORE_ENRICHMENT |
|---|---|---|---|---|---|---|---|
| 1 | MMP2 | MMP2 | MMP2 | 142 | 0.53 | 0.083 | YES |
| 2 | MMP8 | MMP8 | MMP8 | 254 | 0.46 | 0.16 | YES |
| 3 | MMP13 | MMP13 | MMP13 | 336 | 0.42 | 0.22 | YES |
| 4 | MMP11 | MMP11 | MMP11 | 374 | 0.4 | 0.29 | YES |
| 5 | MMP1 | MMP1 | MMP1 | 586 | 0.35 | 0.34 | YES |
| 6 | MMP14 | MMP14 | MMP14 | 753 | 0.32 | 0.38 | YES |
| 7 | MMP7 | MMP7 | MMP7 | 872 | 0.3 | 0.43 | YES |
| 8 | MMP3 | MMP3 | MMP3 | 921 | 0.29 | 0.48 | YES |
| 9 | MMP15 | MMP15 | MMP15 | 1158 | 0.25 | 0.5 | YES |
| 10 | MMP17 | MMP17 | MMP17 | 1176 | 0.25 | 0.55 | YES |
| 11 | MMP9 | MMP9 | MMP9 | 1326 | 0.23 | 0.58 | YES |
| 12 | KLK2 | KLK2 | KLK2 | 1778 | 0.18 | 0.58 | YES |
| 13 | TPSAB1 | TPSAB1 | TPSAB1 | 1960 | 0.17 | 0.6 | YES |
| 14 | ELANE | ELANE | ELANE | 2014 | 0.17 | 0.63 | YES |
| 15 | MMP24 | MMP24 | MMP24 | 2100 | 0.16 | 0.65 | YES |
| 16 | TIMP2 | TIMP2 | TIMP2 | 2208 | 0.16 | 0.67 | YES |
| 17 | PRSS1 | PRSS1 | PRSS1 | 2518 | 0.14 | 0.68 | YES |
| 18 | TIMP1 | TIMP1 | TIMP1 | 2613 | 0.13 | 0.7 | YES |
| 19 | MMP16 | MMP16 | MMP16 | 3673 | 0.096 | 0.65 | NO |
| 20 | FURIN | FURIN | FURIN | 5503 | 0.054 | 0.56 | NO |
| 21 | MMP25 | MMP25 | MMP25 | 9840 | -0.028 | 0.32 | NO |
| 22 | CMA1 | CMA1 | CMA1 | 10875 | -0.05 | 0.27 | NO |
| 23 | CTSG | CTSG | CTSG | 11496 | -0.065 | 0.24 | NO |
| 24 | KLKB1 | KLKB1 | KLKB1 | 11625 | -0.068 | 0.25 | NO |
| 25 | CTRB1 | CTRB1 | CTRB1 | 12665 | -0.095 | 0.21 | NO |
| 26 | MMP10 | MMP10 | MMP10 | 14597 | -0.16 | 0.12 | NO |
| 27 | CTRB2 | CTRB2 | CTRB2 | 16365 | -0.28 | 0.074 | NO |
Figure S19. Get High-res Image This plot shows mRNAseq_cNMF expression data heatmap (on the left) a RunningEnrichmentScore(RES) plot (on the top right) and a Signal2Noise(S2N) plot (on the bottom right) of genes in the pathway: REACTOME ANTIGEN PROCESSING CROSS PRESENTATION.
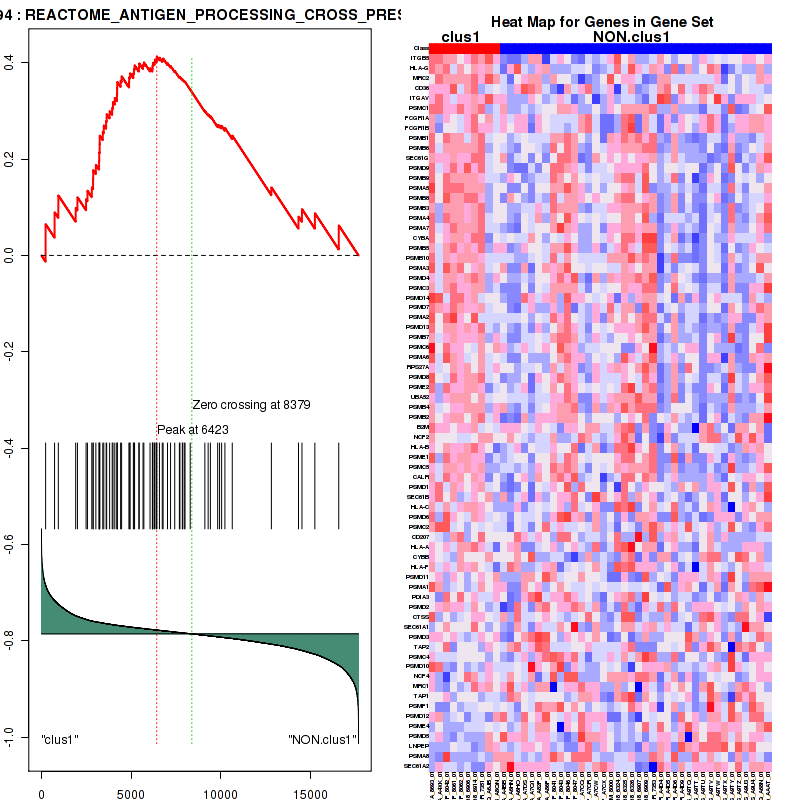
Figure S20. Get High-res Image For the top 5 core enriched genes in the pathway: REACTOME ANTIGEN PROCESSING CROSS PRESENTATION, this volcano plot shows how much they are up/down-regulated and significant. The significance was calculated by empirical bayesian fit

For the top enriched genes, if you want to check whether they are
-
up-regulated, please check the list of up-regulated genes
-
down-regulated, please check the list of down-regulated genes
For the top enriched genes, if you want to check whether they are
-
highly expressed genes, please check the list of high (top 30%) expressed genes
-
low expressed genes, please check the list of low (bottom 30%) expressed genes
An expression pattern of top(30%)/middle(30%)/low(30%) in this subtype against other subtypes is available in a heatmap
For the top enriched genes, if you want to check whether they are
-
significantly differently expressed genes by eBayes lm fit, please check the list of significant genes
Table 4. Get Full Table This table shows top 10 pathways which are significantly enriched in cluster clus2. It displays only significant gene sets satisfying nom.p.val.threshold (-1), fwer.p.val.threshold (-1) , fdr.q.val.threshold (0.25) and the default table is sorted by Normalized Enrichment Score (NES). Further details on NES statistics, please visit The Broad GSEA website.
| GeneSet(GS) | Size(#genes) | genes.ES.table | ES | NES | NOM.p.val | FDR.q.val | FWER.p.val | Tag.. | Gene.. | Signal | FDR..median. | glob.p.val |
|---|---|---|---|---|---|---|---|---|---|---|---|---|
| KEGG NOTCH SIGNALING PATHWAY | 47 | genes.ES.table | 0.44 | 1.6 | 0.016 | 0.91 | 0.95 | 0.53 | 0.41 | 0.32 | 0.52 | 0.28 |
| KEGG T CELL RECEPTOR SIGNALING PATHWAY | 105 | genes.ES.table | 0.56 | 1.7 | 0.0065 | 1 | 0.67 | 0.36 | 0.25 | 0.27 | 0.35 | 0.24 |
| KEGG THYROID CANCER | 29 | genes.ES.table | 0.65 | 1.9 | 0.0061 | 1 | 0.31 | 0.21 | 0.06 | 0.2 | 0 | 0.25 |
| KEGG PRIMARY IMMUNODEFICIENCY | 34 | genes.ES.table | 0.65 | 1.8 | 0.0082 | 1 | 0.57 | 0.32 | 0.1 | 0.29 | 0.5 | 0.36 |
| BIOCARTA DEATH PATHWAY | 33 | genes.ES.table | 0.48 | 1.7 | 0.017 | 1 | 0.72 | 0.21 | 0.2 | 0.17 | 0.35 | 0.24 |
| BIOCARTA VIP PATHWAY | 25 | genes.ES.table | 0.53 | 1.6 | 0.0061 | 0.9 | 0.91 | 0.28 | 0.21 | 0.22 | 0.47 | 0.25 |
| BIOCARTA TCR PATHWAY | 44 | genes.ES.table | 0.52 | 1.7 | 0.016 | 1 | 0.79 | 0.27 | 0.18 | 0.22 | 0.4 | 0.25 |
| ST T CELL SIGNAL TRANSDUCTION | 43 | genes.ES.table | 0.59 | 1.7 | 0.0086 | 1 | 0.65 | 0.4 | 0.2 | 0.32 | 0.41 | 0.27 |
| PID TCR PATHWAY | 66 | genes.ES.table | 0.57 | 1.7 | 0.0062 | 1 | 0.64 | 0.33 | 0.21 | 0.27 | 0.54 | 0.35 |
| PID CD8TCRPATHWAY | 53 | genes.ES.table | 0.58 | 1.6 | 0.036 | 0.94 | 0.94 | 0.28 | 0.14 | 0.24 | 0.51 | 0.29 |
Table S11. Get Full Table This table shows a Running Enrichment Score (RES) of each gene in this pathway, that is, the enrichment score at this point in the ranked list of genes. All genes are ranked by Signal-to-Noise (S2N), a measure of similarity as default and are used to obtain ES matrix of all genes. In this way, GSEA tool uses expression pattern of not only overlapped genes but also not-overlapped genes to produce ES matrix.
| Rank | GENE | SYMBOL | DESC | LIST.LOC | S2N | RES | CORE_ENRICHMENT |
|---|---|---|---|---|---|---|---|
| 1 | TCF7 | TCF7 | TCF7 | 155 | 0.68 | 0.15 | YES |
| 2 | CDH1 | CDH1 | CDH1 | 268 | 0.6 | 0.29 | YES |
| 3 | LEF1 | LEF1 | LEF1 | 479 | 0.51 | 0.4 | YES |
| 4 | RET | RET | RET | 668 | 0.45 | 0.5 | YES |
| 5 | NTRK1 | NTRK1 | NTRK1 | 1011 | 0.38 | 0.57 | YES |
| 6 | TCF7L1 | TCF7L1 | TCF7L1 | 1058 | 0.37 | 0.65 | YES |
| 7 | TCF7L2 | TCF7L2 | TCF7L2 | 2754 | 0.21 | 0.61 | NO |
| 8 | RXRG | RXRG | RXRG | 4297 | 0.13 | 0.55 | NO |
| 9 | BRAF | BRAF | BRAF | 4932 | 0.11 | 0.54 | NO |
| 10 | TFG | TFG | TFG | 6824 | 0.065 | 0.45 | NO |
| 11 | TPR | TPR | TPR | 7613 | 0.049 | 0.42 | NO |
| 12 | PPARG | PPARG | PPARG | 7751 | 0.047 | 0.42 | NO |
| 13 | NCOA4 | NCOA4 | NCOA4 | 7783 | 0.046 | 0.43 | NO |
| 14 | MYC | MYC | MYC | 8279 | 0.037 | 0.41 | NO |
| 15 | RXRB | RXRB | RXRB | 8355 | 0.036 | 0.42 | NO |
| 16 | MAPK1 | MAPK1 | MAPK1 | 8468 | 0.034 | 0.42 | NO |
| 17 | PAX8 | PAX8 | PAX8 | 8685 | 0.03 | 0.41 | NO |
| 18 | CTNNB1 | CTNNB1 | CTNNB1 | 9192 | 0.022 | 0.39 | NO |
| 19 | RXRA | RXRA | RXRA | 9705 | 0.014 | 0.36 | NO |
| 20 | CCND1 | CCND1 | CCND1 | 10059 | 0.0071 | 0.34 | NO |
| 21 | TPM3 | TPM3 | TPM3 | 10722 | -0.0039 | 0.31 | NO |
| 22 | KRAS | KRAS | KRAS | 11266 | -0.013 | 0.28 | NO |
| 23 | MAPK3 | MAPK3 | MAPK3 | 11930 | -0.023 | 0.25 | NO |
| 24 | CCDC6 | CCDC6 | CCDC6 | 12099 | -0.026 | 0.24 | NO |
| 25 | NRAS | NRAS | NRAS | 12193 | -0.027 | 0.24 | NO |
| 26 | MAP2K1 | MAP2K1 | MAP2K1 | 13053 | -0.042 | 0.21 | NO |
| 27 | TP53 | TP53 | TP53 | 13471 | -0.051 | 0.2 | NO |
| 28 | MAP2K2 | MAP2K2 | MAP2K2 | 13955 | -0.061 | 0.18 | NO |
| 29 | HRAS | HRAS | HRAS | 15727 | -0.12 | 0.11 | NO |
Figure S21. Get High-res Image This plot shows mRNAseq_cNMF expression data heatmap (on the left) a RunningEnrichmentScore(RES) plot (on the top right) and a Signal2Noise(S2N) plot (on the bottom right) of genes in the pathway: KEGG NOTCH SIGNALING PATHWAY.
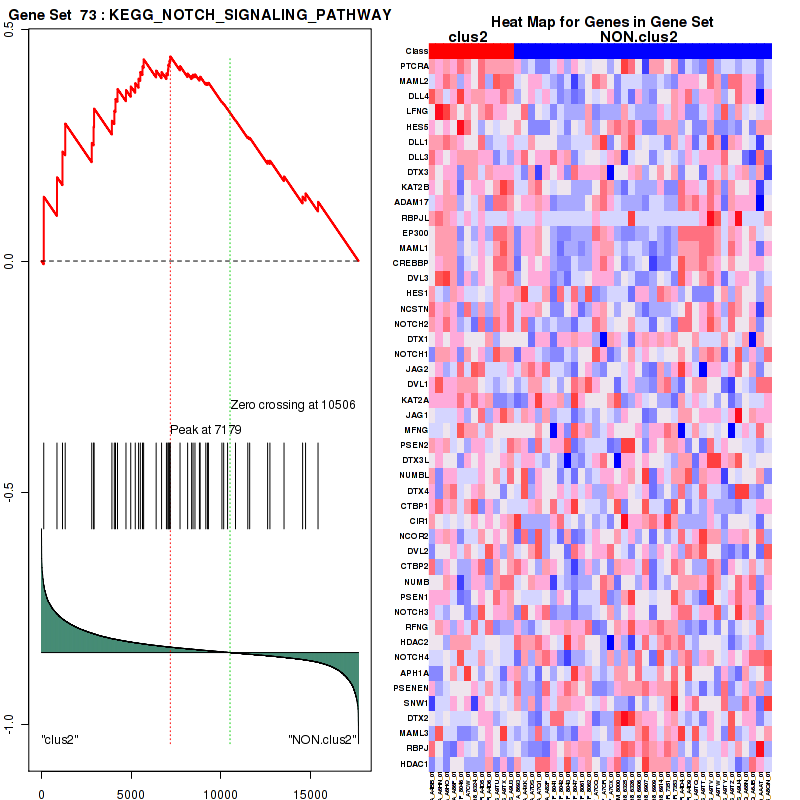
Figure S22. Get High-res Image For the top 5 core enriched genes in the pathway: KEGG NOTCH SIGNALING PATHWAY, this volcano plot shows how much they are up/down-regulated and significant. The significance was calculated by empirical bayesian fit
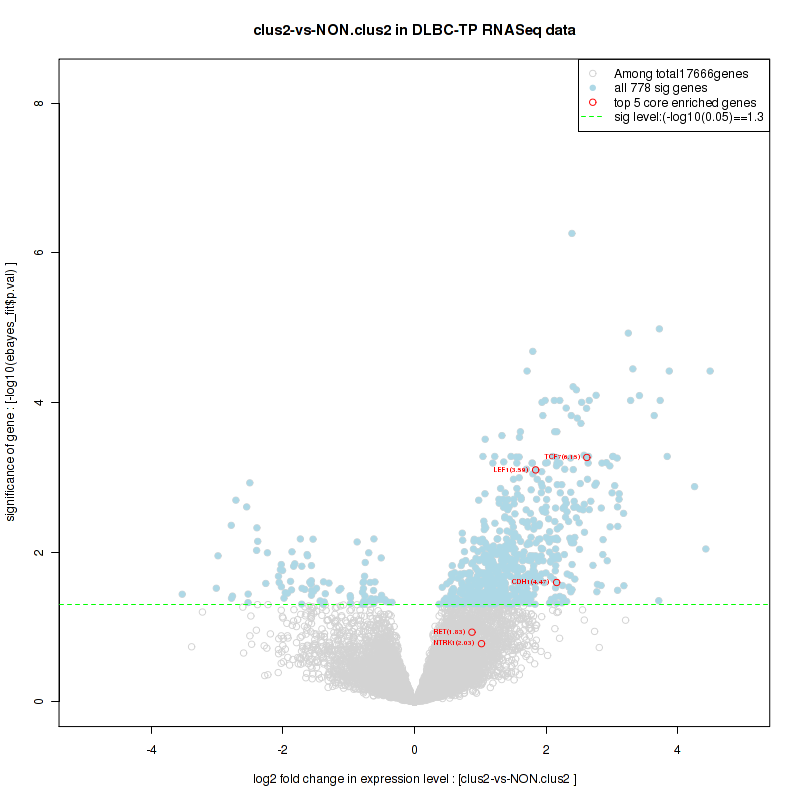
Table S12. Get Full Table This table shows a Running Enrichment Score (RES) of each gene in this pathway, that is, the enrichment score at this point in the ranked list of genes. All genes are ranked by Signal-to-Noise (S2N), a measure of similarity as default and are used to obtain ES matrix of all genes. In this way, GSEA tool uses expression pattern of not only overlapped genes but also not-overlapped genes to produce ES matrix.
| Rank | GENE | SYMBOL | DESC | LIST.LOC | S2N | RES | CORE_ENRICHMENT |
|---|---|---|---|---|---|---|---|
| 1 | CD40LG | CD40LG | CD40LG | 8 | 1.1 | 0.16 | YES |
| 2 | AIRE | AIRE | AIRE | 83 | 0.78 | 0.26 | YES |
| 3 | ICOS | ICOS | ICOS | 114 | 0.73 | 0.36 | YES |
| 4 | CD3E | CD3E | CD3E | 641 | 0.46 | 0.4 | YES |
| 5 | CD3D | CD3D | CD3D | 997 | 0.38 | 0.43 | YES |
| 6 | ZAP70 | ZAP70 | ZAP70 | 1002 | 0.38 | 0.48 | YES |
| 7 | CD8B | CD8B | CD8B | 1449 | 0.32 | 0.5 | YES |
| 8 | CD8A | CD8A | CD8A | 1526 | 0.31 | 0.54 | YES |
| 9 | AICDA | AICDA | AICDA | 1660 | 0.3 | 0.57 | YES |
| 10 | IL7R | IL7R | IL7R | 1738 | 0.29 | 0.61 | YES |
| 11 | TNFRSF13B | TNFRSF13B | TNFRSF13B | 1804 | 0.28 | 0.65 | YES |
| 12 | IGLL1 | IGLL1 | IGLL1 | 3371 | 0.17 | 0.58 | NO |
| 13 | RAG1 | RAG1 | RAG1 | 3408 | 0.17 | 0.6 | NO |
| 14 | CD4 | CD4 | CD4 | 3441 | 0.17 | 0.63 | NO |
| 15 | RFXAP | RFXAP | RFXAP | 4282 | 0.14 | 0.6 | NO |
| 16 | LCK | LCK | LCK | 4686 | 0.12 | 0.59 | NO |
| 17 | TNFRSF13C | TNFRSF13C | TNFRSF13C | 6288 | 0.076 | 0.51 | NO |
| 18 | JAK3 | JAK3 | JAK3 | 6567 | 0.07 | 0.5 | NO |
| 19 | PTPRC | PTPRC | PTPRC | 6889 | 0.063 | 0.5 | NO |
| 20 | CD79A | CD79A | CD79A | 6958 | 0.062 | 0.5 | NO |
| 21 | IL2RG | IL2RG | IL2RG | 7444 | 0.052 | 0.48 | NO |
| 22 | RFX5 | RFX5 | RFX5 | 7829 | 0.045 | 0.46 | NO |
| 23 | TAP2 | TAP2 | TAP2 | 8779 | 0.028 | 0.42 | NO |
| 24 | BLNK | BLNK | BLNK | 9521 | 0.016 | 0.38 | NO |
| 25 | IKBKG | IKBKG | IKBKG | 10038 | 0.0074 | 0.35 | NO |
| 26 | TAP1 | TAP1 | TAP1 | 10144 | 0.0058 | 0.34 | NO |
| 27 | BTK | BTK | BTK | 10738 | -0.0042 | 0.31 | NO |
| 28 | CIITA | CIITA | CIITA | 10806 | -0.0054 | 0.31 | NO |
| 29 | DCLRE1C | DCLRE1C | DCLRE1C | 12137 | -0.026 | 0.23 | NO |
| 30 | CD19 | CD19 | CD19 | 13163 | -0.044 | 0.18 | NO |
| 31 | UNG | UNG | UNG | 15005 | -0.088 | 0.09 | NO |
| 32 | CD40 | CD40 | CD40 | 15144 | -0.093 | 0.096 | NO |
| 33 | RFXANK | RFXANK | RFXANK | 15475 | -0.11 | 0.092 | NO |
| 34 | ADA | ADA | ADA | 16835 | -0.23 | 0.047 | NO |
Figure S23. Get High-res Image This plot shows mRNAseq_cNMF expression data heatmap (on the left) a RunningEnrichmentScore(RES) plot (on the top right) and a Signal2Noise(S2N) plot (on the bottom right) of genes in the pathway: KEGG T CELL RECEPTOR SIGNALING PATHWAY.
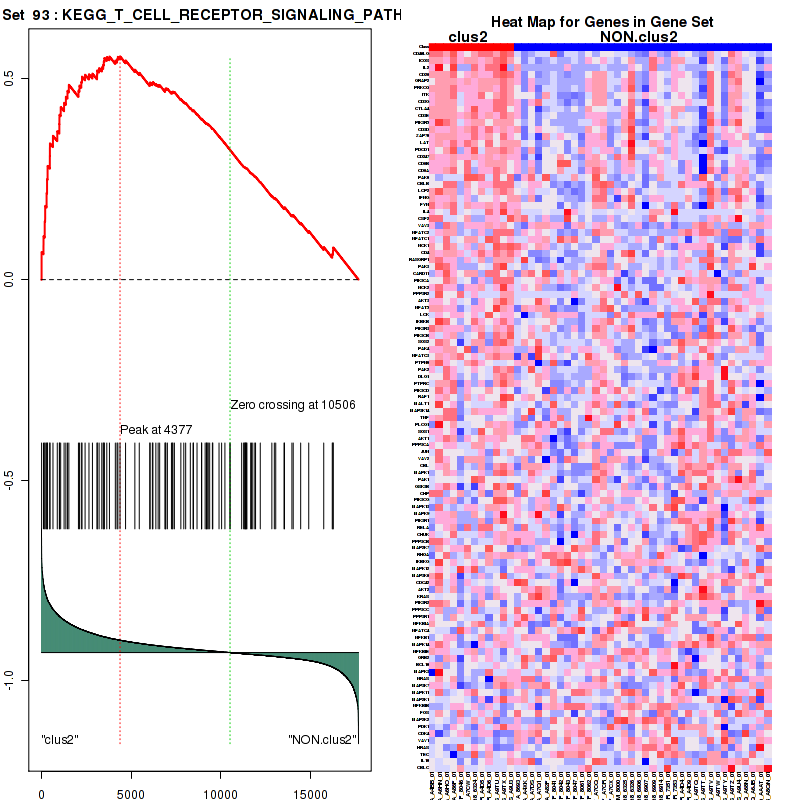
Figure S24. Get High-res Image For the top 5 core enriched genes in the pathway: KEGG T CELL RECEPTOR SIGNALING PATHWAY, this volcano plot shows how much they are up/down-regulated and significant. The significance was calculated by empirical bayesian fit
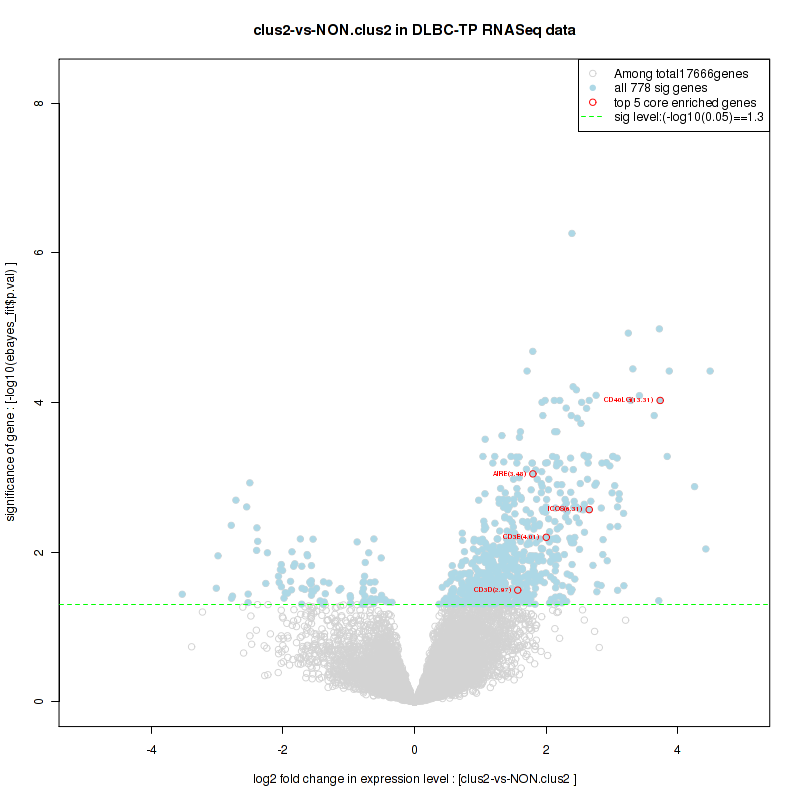
Table S13. Get Full Table This table shows a Running Enrichment Score (RES) of each gene in this pathway, that is, the enrichment score at this point in the ranked list of genes. All genes are ranked by Signal-to-Noise (S2N), a measure of similarity as default and are used to obtain ES matrix of all genes. In this way, GSEA tool uses expression pattern of not only overlapped genes but also not-overlapped genes to produce ES matrix.
| Rank | GENE | SYMBOL | DESC | LIST.LOC | S2N | RES | CORE_ENRICHMENT |
|---|---|---|---|---|---|---|---|
| 1 | CD28 | CD28 | CD28 | 206 | 0.64 | 0.056 | YES |
| 2 | GRAP2 | GRAP2 | GRAP2 | 286 | 0.59 | 0.11 | YES |
| 3 | PRKCQ | PRKCQ | PRKCQ | 313 | 0.57 | 0.17 | YES |
| 4 | ITK | ITK | ITK | 341 | 0.56 | 0.23 | YES |
| 5 | CD3G | CD3G | CD3G | 467 | 0.51 | 0.28 | YES |
| 6 | CD3E | CD3E | CD3E | 641 | 0.46 | 0.31 | YES |
| 7 | CD3D | CD3D | CD3D | 997 | 0.38 | 0.33 | YES |
| 8 | ZAP70 | ZAP70 | ZAP70 | 1002 | 0.38 | 0.37 | YES |
| 9 | LAT | LAT | LAT | 1072 | 0.37 | 0.41 | YES |
| 10 | CD247 | CD247 | CD247 | 1360 | 0.33 | 0.43 | YES |
| 11 | SLA2 | SLA2 | SLA2 | 1391 | 0.33 | 0.46 | YES |
| 12 | FYB | FYB | FYB | 1656 | 0.3 | 0.48 | YES |
| 13 | RASGRP2 | RASGRP2 | RASGRP2 | 1887 | 0.27 | 0.49 | YES |
| 14 | LCP2 | LCP2 | LCP2 | 2221 | 0.24 | 0.5 | YES |
| 15 | PRKCA | PRKCA | PRKCA | 2350 | 0.24 | 0.52 | YES |
| 16 | FYN | FYN | FYN | 2430 | 0.23 | 0.54 | YES |
| 17 | PRKCB | PRKCB | PRKCB | 2919 | 0.2 | 0.53 | YES |
| 18 | NCK1 | NCK1 | NCK1 | 3363 | 0.17 | 0.52 | YES |
| 19 | CD4 | CD4 | CD4 | 3441 | 0.17 | 0.53 | YES |
| 20 | GAB2 | GAB2 | GAB2 | 3447 | 0.17 | 0.55 | YES |
| 21 | RASGRP1 | RASGRP1 | RASGRP1 | 3473 | 0.17 | 0.57 | YES |
| 22 | CARD11 | CARD11 | CARD11 | 3641 | 0.16 | 0.57 | YES |
| 23 | RASSF5 | RASSF5 | RASSF5 | 4302 | 0.13 | 0.55 | NO |
| 24 | LCK | LCK | LCK | 4686 | 0.12 | 0.54 | NO |
| 25 | TRAF6 | TRAF6 | TRAF6 | 5034 | 0.11 | 0.53 | NO |
| 26 | IKBKB | IKBKB | IKBKB | 5205 | 0.1 | 0.54 | NO |
| 27 | PRKCE | PRKCE | PRKCE | 5427 | 0.098 | 0.53 | NO |
| 28 | PDPK1 | PDPK1 | PDPK1 | 5886 | 0.086 | 0.52 | NO |
| 29 | PTPN6 | PTPN6 | PTPN6 | 6375 | 0.075 | 0.5 | NO |
| 30 | FLNA | FLNA | FLNA | 6550 | 0.07 | 0.49 | NO |
| 31 | SH3BP2 | SH3BP2 | SH3BP2 | 6574 | 0.07 | 0.5 | NO |
| 32 | PTPRC | PTPRC | PTPRC | 6889 | 0.063 | 0.49 | NO |
| 33 | MALT1 | MALT1 | MALT1 | 7016 | 0.061 | 0.49 | NO |
| 34 | HLA-DRA | HLA-DRA | HLA-DRA | 7216 | 0.057 | 0.48 | NO |
| 35 | MAP3K14 | MAP3K14 | MAP3K14 | 7242 | 0.056 | 0.49 | NO |
| 36 | PLCG1 | PLCG1 | PLCG1 | 7325 | 0.054 | 0.49 | NO |
| 37 | SOS1 | SOS1 | SOS1 | 7405 | 0.053 | 0.49 | NO |
| 38 | INPP5D | INPP5D | INPP5D | 7696 | 0.048 | 0.48 | NO |
| 39 | AKT1 | AKT1 | AKT1 | 7767 | 0.046 | 0.48 | NO |
| 40 | STIM1 | STIM1 | STIM1 | 7774 | 0.046 | 0.48 | NO |
| 41 | PTPN11 | PTPN11 | PTPN11 | 7833 | 0.045 | 0.48 | NO |
| 42 | HLA-DRB1 | HLA-DRB1 | HLA-DRB1 | 8177 | 0.039 | 0.47 | NO |
| 43 | CBL | CBL | CBL | 8450 | 0.035 | 0.46 | NO |
| 44 | RAP1A | RAP1A | RAP1A | 8950 | 0.025 | 0.43 | NO |
| 45 | PAG1 | PAG1 | PAG1 | 9199 | 0.022 | 0.42 | NO |
| 46 | CHUK | CHUK | CHUK | 9374 | 0.019 | 0.41 | NO |
| 47 | TRPV6 | TRPV6 | TRPV6 | 9394 | 0.019 | 0.41 | NO |
| 48 | SHC1 | SHC1 | SHC1 | 9836 | 0.011 | 0.39 | NO |
| 49 | ORAI1 | ORAI1 | ORAI1 | 9996 | 0.0082 | 0.38 | NO |
| 50 | IKBKG | IKBKG | IKBKG | 10038 | 0.0074 | 0.38 | NO |
| 51 | MAP3K8 | MAP3K8 | MAP3K8 | 10502 | 0.000048 | 0.35 | NO |
| 52 | CDC42 | CDC42 | CDC42 | 10510 | -0.000065 | 0.35 | NO |
| 53 | CD80 | CD80 | CD80 | 10787 | -0.0051 | 0.34 | NO |
| 54 | CSK | CSK | CSK | 11086 | -0.01 | 0.32 | NO |
| 55 | CD86 | CD86 | CD86 | 11126 | -0.011 | 0.32 | NO |
| 56 | DBNL | DBNL | DBNL | 11216 | -0.012 | 0.32 | NO |
| 57 | KRAS | KRAS | KRAS | 11266 | -0.013 | 0.32 | NO |
| 58 | GRB2 | GRB2 | GRB2 | 11774 | -0.021 | 0.29 | NO |
| 59 | PTEN | PTEN | PTEN | 11843 | -0.022 | 0.29 | NO |
| 60 | BCL10 | BCL10 | BCL10 | 11889 | -0.023 | 0.29 | NO |
| 61 | MAP4K1 | MAP4K1 | MAP4K1 | 12177 | -0.027 | 0.27 | NO |
| 62 | NRAS | NRAS | NRAS | 12193 | -0.027 | 0.28 | NO |
| 63 | WAS | WAS | WAS | 13459 | -0.05 | 0.21 | NO |
| 64 | VAV1 | VAV1 | VAV1 | 14891 | -0.085 | 0.14 | NO |
| 65 | STK39 | STK39 | STK39 | 15035 | -0.089 | 0.14 | NO |
| 66 | HRAS | HRAS | HRAS | 15727 | -0.12 | 0.11 | NO |
Figure S25. Get High-res Image This plot shows mRNAseq_cNMF expression data heatmap (on the left) a RunningEnrichmentScore(RES) plot (on the top right) and a Signal2Noise(S2N) plot (on the bottom right) of genes in the pathway: KEGG THYROID CANCER.
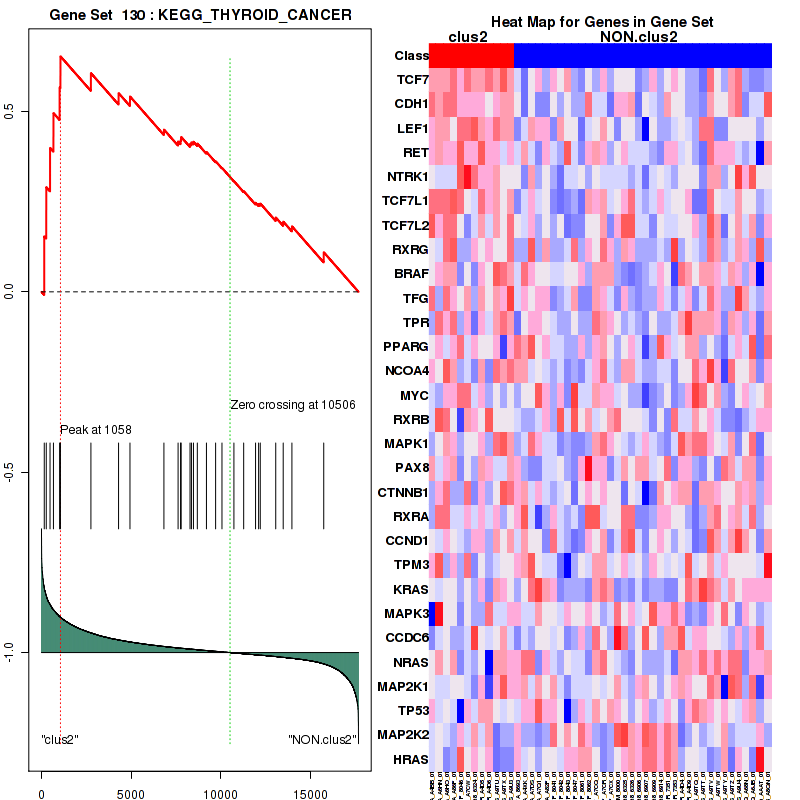
Figure S26. Get High-res Image For the top 5 core enriched genes in the pathway: KEGG THYROID CANCER, this volcano plot shows how much they are up/down-regulated and significant. The significance was calculated by empirical bayesian fit

Table S14. Get Full Table This table shows a Running Enrichment Score (RES) of each gene in this pathway, that is, the enrichment score at this point in the ranked list of genes. All genes are ranked by Signal-to-Noise (S2N), a measure of similarity as default and are used to obtain ES matrix of all genes. In this way, GSEA tool uses expression pattern of not only overlapped genes but also not-overlapped genes to produce ES matrix.
| Rank | GENE | SYMBOL | DESC | LIST.LOC | S2N | RES | CORE_ENRICHMENT |
|---|---|---|---|---|---|---|---|
| 1 | CD28 | CD28 | CD28 | 206 | 0.64 | 0.078 | YES |
| 2 | GRAP2 | GRAP2 | GRAP2 | 286 | 0.59 | 0.16 | YES |
| 3 | ITK | ITK | ITK | 341 | 0.56 | 0.23 | YES |
| 4 | CTLA4 | CTLA4 | CTLA4 | 471 | 0.51 | 0.3 | YES |
| 5 | CD3D | CD3D | CD3D | 997 | 0.38 | 0.32 | YES |
| 6 | ZAP70 | ZAP70 | ZAP70 | 1002 | 0.38 | 0.37 | YES |
| 7 | LAT | LAT | LAT | 1072 | 0.37 | 0.42 | YES |
| 8 | ITPKA | ITPKA | ITPKA | 1725 | 0.29 | 0.42 | YES |
| 9 | RASGRP4 | RASGRP4 | RASGRP4 | 1867 | 0.28 | 0.45 | YES |
| 10 | RASGRP2 | RASGRP2 | RASGRP2 | 1887 | 0.27 | 0.49 | YES |
| 11 | PAK6 | PAK6 | PAK6 | 2062 | 0.26 | 0.52 | YES |
| 12 | LCP2 | LCP2 | LCP2 | 2221 | 0.24 | 0.54 | YES |
| 13 | EPHB2 | EPHB2 | EPHB2 | 2278 | 0.24 | 0.57 | YES |
| 14 | NCK1 | NCK1 | NCK1 | 3363 | 0.17 | 0.54 | YES |
| 15 | RASGRP1 | RASGRP1 | RASGRP1 | 3473 | 0.17 | 0.55 | YES |
| 16 | PAK3 | PAK3 | PAK3 | 3506 | 0.17 | 0.57 | YES |
| 17 | DAG1 | DAG1 | DAG1 | 3578 | 0.16 | 0.59 | YES |
| 18 | NFAT5 | NFAT5 | NFAT5 | 4377 | 0.13 | 0.56 | NO |
| 19 | LCK | LCK | LCK | 4686 | 0.12 | 0.56 | NO |
| 20 | SOS2 | SOS2 | SOS2 | 6052 | 0.082 | 0.5 | NO |
| 21 | PAK4 | PAK4 | PAK4 | 6180 | 0.079 | 0.5 | NO |
| 22 | PAK2 | PAK2 | PAK2 | 6502 | 0.072 | 0.49 | NO |
| 23 | PTPRC | PTPRC | PTPRC | 6889 | 0.063 | 0.48 | NO |
| 24 | RAF1 | RAF1 | RAF1 | 6931 | 0.063 | 0.49 | NO |
| 25 | PLCG1 | PLCG1 | PLCG1 | 7325 | 0.054 | 0.47 | NO |
| 26 | SOS1 | SOS1 | SOS1 | 7405 | 0.053 | 0.48 | NO |
| 27 | RASGRP3 | RASGRP3 | RASGRP3 | 8093 | 0.041 | 0.44 | NO |
| 28 | FBXW7 | FBXW7 | FBXW7 | 8285 | 0.037 | 0.44 | NO |
| 29 | CBL | CBL | CBL | 8450 | 0.035 | 0.43 | NO |
| 30 | MAPK1 | MAPK1 | MAPK1 | 8468 | 0.034 | 0.44 | NO |
| 31 | PAK1 | PAK1 | PAK1 | 8668 | 0.03 | 0.43 | NO |
| 32 | CSK | CSK | CSK | 11086 | -0.01 | 0.29 | NO |
| 33 | NFKBIA | NFKBIA | NFKBIA | 11383 | -0.015 | 0.28 | NO |
| 34 | NFKB1 | NFKB1 | NFKB1 | 11447 | -0.016 | 0.28 | NO |
| 35 | NFKBIE | NFKBIE | NFKBIE | 11705 | -0.02 | 0.26 | NO |
| 36 | GRB2 | GRB2 | GRB2 | 11774 | -0.021 | 0.26 | NO |
| 37 | ITPKB | ITPKB | ITPKB | 11834 | -0.022 | 0.26 | NO |
| 38 | NFKB2 | NFKB2 | NFKB2 | 12764 | -0.037 | 0.22 | NO |
| 39 | NFKBIB | NFKBIB | NFKBIB | 13517 | -0.052 | 0.18 | NO |
| 40 | NFKBIL1 | NFKBIL1 | NFKBIL1 | 14446 | -0.072 | 0.14 | NO |
| 41 | VAV1 | VAV1 | VAV1 | 14891 | -0.085 | 0.12 | NO |
| 42 | PRDX1 | PRDX1 | PRDX1 | 15198 | -0.095 | 0.12 | NO |
| 43 | DTYMK | DTYMK | DTYMK | 16003 | -0.14 | 0.094 | NO |
Figure S27. Get High-res Image This plot shows mRNAseq_cNMF expression data heatmap (on the left) a RunningEnrichmentScore(RES) plot (on the top right) and a Signal2Noise(S2N) plot (on the bottom right) of genes in the pathway: KEGG PRIMARY IMMUNODEFICIENCY.
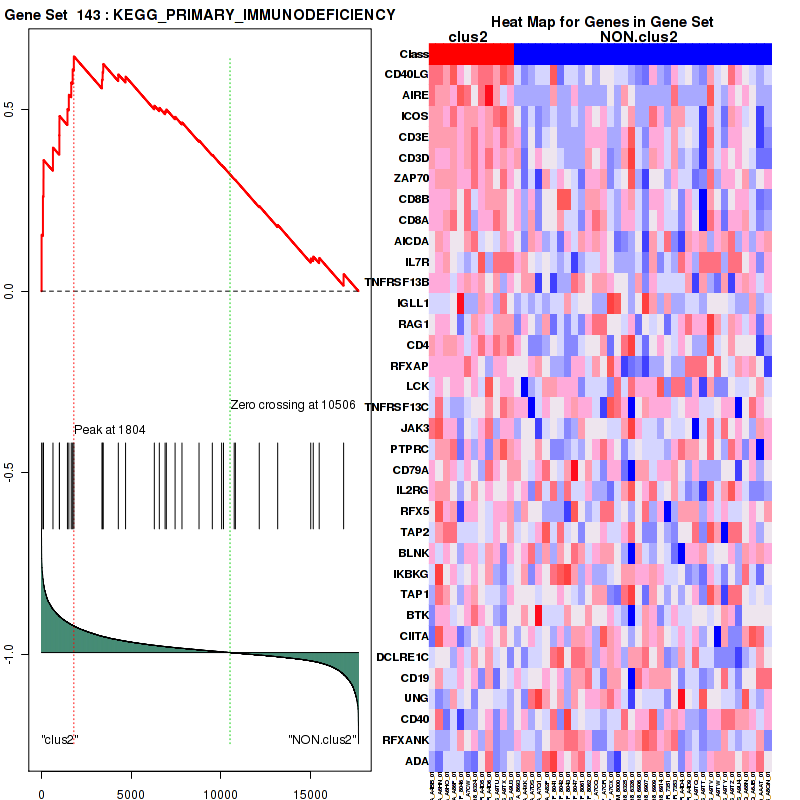
Figure S28. Get High-res Image For the top 5 core enriched genes in the pathway: KEGG PRIMARY IMMUNODEFICIENCY, this volcano plot shows how much they are up/down-regulated and significant. The significance was calculated by empirical bayesian fit
Table S15. Get Full Table This table shows a Running Enrichment Score (RES) of each gene in this pathway, that is, the enrichment score at this point in the ranked list of genes. All genes are ranked by Signal-to-Noise (S2N), a measure of similarity as default and are used to obtain ES matrix of all genes. In this way, GSEA tool uses expression pattern of not only overlapped genes but also not-overlapped genes to produce ES matrix.
| Rank | GENE | SYMBOL | DESC | LIST.LOC | S2N | RES | CORE_ENRICHMENT |
|---|---|---|---|---|---|---|---|
| 1 | CD40LG | CD40LG | CD40LG | 8 | 1.1 | 0.069 | YES |
| 2 | ICOS | ICOS | ICOS | 114 | 0.73 | 0.11 | YES |
| 3 | IL2 | IL2 | IL2 | 181 | 0.66 | 0.14 | YES |
| 4 | CD28 | CD28 | CD28 | 206 | 0.64 | 0.18 | YES |
| 5 | GRAP2 | GRAP2 | GRAP2 | 286 | 0.59 | 0.22 | YES |
| 6 | PRKCQ | PRKCQ | PRKCQ | 313 | 0.57 | 0.25 | YES |
| 7 | ITK | ITK | ITK | 341 | 0.56 | 0.28 | YES |
| 8 | CD3G | CD3G | CD3G | 467 | 0.51 | 0.31 | YES |
| 9 | CTLA4 | CTLA4 | CTLA4 | 471 | 0.51 | 0.34 | YES |
| 10 | CD3E | CD3E | CD3E | 641 | 0.46 | 0.36 | YES |
| 11 | PIK3R5 | PIK3R5 | PIK3R5 | 882 | 0.41 | 0.37 | YES |
| 12 | CD3D | CD3D | CD3D | 997 | 0.38 | 0.39 | YES |
| 13 | ZAP70 | ZAP70 | ZAP70 | 1002 | 0.38 | 0.41 | YES |
| 14 | LAT | LAT | LAT | 1072 | 0.37 | 0.43 | YES |
| 15 | PDCD1 | PDCD1 | PDCD1 | 1261 | 0.34 | 0.44 | YES |
| 16 | CD247 | CD247 | CD247 | 1360 | 0.33 | 0.46 | YES |
| 17 | CD8B | CD8B | CD8B | 1449 | 0.32 | 0.47 | YES |
| 18 | CD8A | CD8A | CD8A | 1526 | 0.31 | 0.49 | YES |
| 19 | PAK6 | PAK6 | PAK6 | 2062 | 0.26 | 0.47 | YES |
| 20 | CBLB | CBLB | CBLB | 2117 | 0.25 | 0.48 | YES |
| 21 | LCP2 | LCP2 | LCP2 | 2221 | 0.24 | 0.49 | YES |
| 22 | IFNG | IFNG | IFNG | 2260 | 0.24 | 0.51 | YES |
| 23 | FYN | FYN | FYN | 2430 | 0.23 | 0.51 | YES |
| 24 | IL4 | IL4 | IL4 | 2646 | 0.22 | 0.51 | YES |
| 25 | CSF2 | CSF2 | CSF2 | 2839 | 0.2 | 0.51 | YES |
| 26 | VAV3 | VAV3 | VAV3 | 3097 | 0.19 | 0.51 | YES |
| 27 | NFATC2 | NFATC2 | NFATC2 | 3109 | 0.19 | 0.52 | YES |
| 28 | NFATC1 | NFATC1 | NFATC1 | 3210 | 0.18 | 0.53 | YES |
| 29 | NCK1 | NCK1 | NCK1 | 3363 | 0.17 | 0.53 | YES |
| 30 | CD4 | CD4 | CD4 | 3441 | 0.17 | 0.54 | YES |
| 31 | RASGRP1 | RASGRP1 | RASGRP1 | 3473 | 0.17 | 0.54 | YES |
| 32 | PAK3 | PAK3 | PAK3 | 3506 | 0.17 | 0.55 | YES |
| 33 | CARD11 | CARD11 | CARD11 | 3641 | 0.16 | 0.56 | YES |
| 34 | PIK3CA | PIK3CA | PIK3CA | 3787 | 0.15 | 0.56 | YES |
| 35 | NCK2 | NCK2 | NCK2 | 4117 | 0.14 | 0.55 | YES |
| 36 | PPP3R2 | PPP3R2 | PPP3R2 | 4212 | 0.14 | 0.55 | YES |
| 37 | AKT3 | AKT3 | AKT3 | 4255 | 0.14 | 0.56 | YES |
| 38 | NFAT5 | NFAT5 | NFAT5 | 4377 | 0.13 | 0.56 | YES |
| 39 | LCK | LCK | LCK | 4686 | 0.12 | 0.55 | NO |
| 40 | IKBKB | IKBKB | IKBKB | 5205 | 0.1 | 0.52 | NO |
| 41 | PIK3R3 | PIK3R3 | PIK3R3 | 5451 | 0.097 | 0.52 | NO |
| 42 | PIK3CB | PIK3CB | PIK3CB | 6037 | 0.082 | 0.49 | NO |
| 43 | SOS2 | SOS2 | SOS2 | 6052 | 0.082 | 0.49 | NO |
| 44 | PAK4 | PAK4 | PAK4 | 6180 | 0.079 | 0.49 | NO |
| 45 | NFATC3 | NFATC3 | NFATC3 | 6209 | 0.078 | 0.49 | NO |
| 46 | PTPN6 | PTPN6 | PTPN6 | 6375 | 0.075 | 0.49 | NO |
| 47 | PAK2 | PAK2 | PAK2 | 6502 | 0.072 | 0.48 | NO |
| 48 | DLG1 | DLG1 | DLG1 | 6587 | 0.07 | 0.48 | NO |
| 49 | PTPRC | PTPRC | PTPRC | 6889 | 0.063 | 0.47 | NO |
| 50 | PIK3CD | PIK3CD | PIK3CD | 6895 | 0.063 | 0.48 | NO |
| 51 | RAF1 | RAF1 | RAF1 | 6931 | 0.063 | 0.48 | NO |
| 52 | MALT1 | MALT1 | MALT1 | 7016 | 0.061 | 0.48 | NO |
| 53 | MAP3K14 | MAP3K14 | MAP3K14 | 7242 | 0.056 | 0.47 | NO |
| 54 | TNF | TNF | TNF | 7293 | 0.055 | 0.47 | NO |
| 55 | PLCG1 | PLCG1 | PLCG1 | 7325 | 0.054 | 0.47 | NO |
| 56 | SOS1 | SOS1 | SOS1 | 7405 | 0.053 | 0.47 | NO |
| 57 | AKT1 | AKT1 | AKT1 | 7767 | 0.046 | 0.45 | NO |
| 58 | PPP3CA | PPP3CA | PPP3CA | 7929 | 0.044 | 0.44 | NO |
| 59 | JUN | JUN | JUN | 8034 | 0.042 | 0.44 | NO |
| 60 | VAV2 | VAV2 | VAV2 | 8294 | 0.037 | 0.43 | NO |
| 61 | CBL | CBL | CBL | 8450 | 0.035 | 0.42 | NO |
| 62 | MAPK1 | MAPK1 | MAPK1 | 8468 | 0.034 | 0.42 | NO |
| 63 | PAK1 | PAK1 | PAK1 | 8668 | 0.03 | 0.41 | NO |
| 64 | GSK3B | GSK3B | GSK3B | 8917 | 0.026 | 0.4 | NO |
| 65 | CHP | CHP | CHP | 8929 | 0.026 | 0.4 | NO |
| 66 | PIK3CG | PIK3CG | PIK3CG | 9121 | 0.023 | 0.39 | NO |
| 67 | MAPK13 | MAPK13 | MAPK13 | 9196 | 0.022 | 0.39 | NO |
| 68 | MAPK9 | MAPK9 | MAPK9 | 9208 | 0.021 | 0.39 | NO |
| 69 | PIK3R1 | PIK3R1 | PIK3R1 | 9278 | 0.02 | 0.39 | NO |
| 70 | RELA | RELA | RELA | 9280 | 0.02 | 0.39 | NO |
| 71 | CHUK | CHUK | CHUK | 9374 | 0.019 | 0.38 | NO |
| 72 | PPP3CB | PPP3CB | PPP3CB | 9524 | 0.016 | 0.38 | NO |
| 73 | MAP2K7 | MAP2K7 | MAP2K7 | 9547 | 0.016 | 0.38 | NO |
| 74 | RHOA | RHOA | RHOA | 9893 | 0.01 | 0.36 | NO |
| 75 | IKBKG | IKBKG | IKBKG | 10038 | 0.0074 | 0.35 | NO |
| 76 | MAPK12 | MAPK12 | MAPK12 | 10221 | 0.0046 | 0.34 | NO |
| 77 | MAP3K8 | MAP3K8 | MAP3K8 | 10502 | 0.000048 | 0.32 | NO |
| 78 | CDC42 | CDC42 | CDC42 | 10510 | -0.000065 | 0.32 | NO |
| 79 | AKT2 | AKT2 | AKT2 | 11156 | -0.011 | 0.29 | NO |
| 80 | KRAS | KRAS | KRAS | 11266 | -0.013 | 0.28 | NO |
| 81 | PIK3R2 | PIK3R2 | PIK3R2 | 11301 | -0.013 | 0.28 | NO |
| 82 | PPP3CC | PPP3CC | PPP3CC | 11339 | -0.014 | 0.28 | NO |
| 83 | PPP3R1 | PPP3R1 | PPP3R1 | 11369 | -0.014 | 0.28 | NO |
| 84 | NFKBIA | NFKBIA | NFKBIA | 11383 | -0.015 | 0.28 | NO |
| 85 | NFATC4 | NFATC4 | NFATC4 | 11422 | -0.015 | 0.28 | NO |
| 86 | NFKB1 | NFKB1 | NFKB1 | 11447 | -0.016 | 0.28 | NO |
| 87 | MAPK14 | MAPK14 | MAPK14 | 11658 | -0.019 | 0.27 | NO |
| 88 | NFKBIE | NFKBIE | NFKBIE | 11705 | -0.02 | 0.26 | NO |
| 89 | GRB2 | GRB2 | GRB2 | 11774 | -0.021 | 0.26 | NO |
| 90 | BCL10 | BCL10 | BCL10 | 11889 | -0.023 | 0.26 | NO |
| 91 | MAPK3 | MAPK3 | MAPK3 | 11930 | -0.023 | 0.26 | NO |
| 92 | NRAS | NRAS | NRAS | 12193 | -0.027 | 0.24 | NO |
| 93 | MAP3K7 | MAP3K7 | MAP3K7 | 12836 | -0.039 | 0.21 | NO |
| 94 | MAPK11 | MAPK11 | MAPK11 | 12975 | -0.041 | 0.2 | NO |
| 95 | MAP2K1 | MAP2K1 | MAP2K1 | 13053 | -0.042 | 0.2 | NO |
| 96 | NFKBIB | NFKBIB | NFKBIB | 13517 | -0.052 | 0.18 | NO |
| 97 | FOS | FOS | FOS | 13543 | -0.052 | 0.18 | NO |
| 98 | MAP2K2 | MAP2K2 | MAP2K2 | 13955 | -0.061 | 0.16 | NO |
| 99 | PDK1 | PDK1 | PDK1 | 14026 | -0.062 | 0.16 | NO |
| 100 | CDK4 | CDK4 | CDK4 | 14442 | -0.072 | 0.14 | NO |
| 101 | VAV1 | VAV1 | VAV1 | 14891 | -0.085 | 0.12 | NO |
| 102 | HRAS | HRAS | HRAS | 15727 | -0.12 | 0.081 | NO |
| 103 | TEC | TEC | TEC | 16202 | -0.15 | 0.064 | NO |
| 104 | IL10 | IL10 | IL10 | 16240 | -0.16 | 0.071 | NO |
| 105 | CBLC | CBLC | CBLC | 16256 | -0.16 | 0.08 | NO |
Figure S29. Get High-res Image This plot shows mRNAseq_cNMF expression data heatmap (on the left) a RunningEnrichmentScore(RES) plot (on the top right) and a Signal2Noise(S2N) plot (on the bottom right) of genes in the pathway: BIOCARTA DEATH PATHWAY.
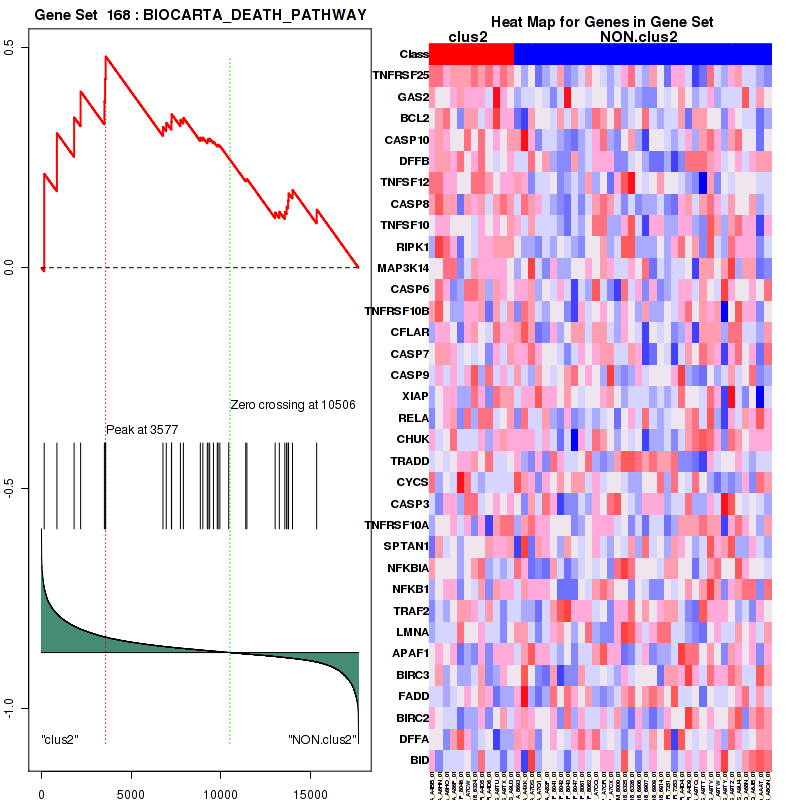
Figure S30. Get High-res Image For the top 5 core enriched genes in the pathway: BIOCARTA DEATH PATHWAY, this volcano plot shows how much they are up/down-regulated and significant. The significance was calculated by empirical bayesian fit

Table S16. Get Full Table This table shows a Running Enrichment Score (RES) of each gene in this pathway, that is, the enrichment score at this point in the ranked list of genes. All genes are ranked by Signal-to-Noise (S2N), a measure of similarity as default and are used to obtain ES matrix of all genes. In this way, GSEA tool uses expression pattern of not only overlapped genes but also not-overlapped genes to produce ES matrix.
| Rank | GENE | SYMBOL | DESC | LIST.LOC | S2N | RES | CORE_ENRICHMENT |
|---|---|---|---|---|---|---|---|
| 1 | TNFRSF25 | TNFRSF25 | TNFRSF25 | 152 | 0.69 | 0.21 | YES |
| 2 | GAS2 | GAS2 | GAS2 | 860 | 0.41 | 0.3 | YES |
| 3 | BCL2 | BCL2 | BCL2 | 1819 | 0.28 | 0.34 | YES |
| 4 | CASP10 | CASP10 | CASP10 | 2181 | 0.25 | 0.4 | YES |
| 5 | DFFB | DFFB | DFFB | 3507 | 0.17 | 0.38 | YES |
| 6 | TNFSF12 | TNFSF12 | TNFSF12 | 3546 | 0.16 | 0.43 | YES |
| 7 | CASP8 | CASP8 | CASP8 | 3577 | 0.16 | 0.48 | YES |
| 8 | TNFSF10 | TNFSF10 | TNFSF10 | 6769 | 0.066 | 0.32 | NO |
| 9 | RIPK1 | RIPK1 | RIPK1 | 6954 | 0.062 | 0.33 | NO |
| 10 | MAP3K14 | MAP3K14 | MAP3K14 | 7242 | 0.056 | 0.33 | NO |
| 11 | CASP6 | CASP6 | CASP6 | 7252 | 0.056 | 0.35 | NO |
| 12 | TNFRSF10B | TNFRSF10B | TNFRSF10B | 7742 | 0.047 | 0.34 | NO |
| 13 | CFLAR | CFLAR | CFLAR | 7907 | 0.044 | 0.34 | NO |
| 14 | CASP7 | CASP7 | CASP7 | 8853 | 0.027 | 0.3 | NO |
| 15 | CASP9 | CASP9 | CASP9 | 8991 | 0.025 | 0.3 | NO |
| 16 | XIAP | XIAP | XIAP | 9239 | 0.021 | 0.29 | NO |
| 17 | RELA | RELA | RELA | 9280 | 0.02 | 0.29 | NO |
| 18 | CHUK | CHUK | CHUK | 9374 | 0.019 | 0.29 | NO |
| 19 | TRADD | TRADD | TRADD | 9581 | 0.015 | 0.29 | NO |
| 20 | CYCS | CYCS | CYCS | 9797 | 0.012 | 0.28 | NO |
| 21 | CASP3 | CASP3 | CASP3 | 9840 | 0.011 | 0.28 | NO |
| 22 | TNFRSF10A | TNFRSF10A | TNFRSF10A | 9941 | 0.0092 | 0.28 | NO |
| 23 | SPTAN1 | SPTAN1 | SPTAN1 | 10433 | 0.00097 | 0.25 | NO |
| 24 | NFKBIA | NFKBIA | NFKBIA | 11383 | -0.015 | 0.2 | NO |
| 25 | NFKB1 | NFKB1 | NFKB1 | 11447 | -0.016 | 0.2 | NO |
| 26 | TRAF2 | TRAF2 | TRAF2 | 13022 | -0.042 | 0.13 | NO |
| 27 | LMNA | LMNA | LMNA | 13253 | -0.046 | 0.13 | NO |
| 28 | APAF1 | APAF1 | APAF1 | 13560 | -0.052 | 0.13 | NO |
| 29 | BIRC3 | BIRC3 | BIRC3 | 13660 | -0.055 | 0.14 | NO |
| 30 | FADD | FADD | FADD | 13744 | -0.056 | 0.15 | NO |
| 31 | BIRC2 | BIRC2 | BIRC2 | 13768 | -0.057 | 0.17 | NO |
| 32 | DFFA | DFFA | DFFA | 13987 | -0.061 | 0.18 | NO |
| 33 | BID | BID | BID | 15334 | -0.1 | 0.13 | NO |
Figure S31. Get High-res Image This plot shows mRNAseq_cNMF expression data heatmap (on the left) a RunningEnrichmentScore(RES) plot (on the top right) and a Signal2Noise(S2N) plot (on the bottom right) of genes in the pathway: BIOCARTA VIP PATHWAY.
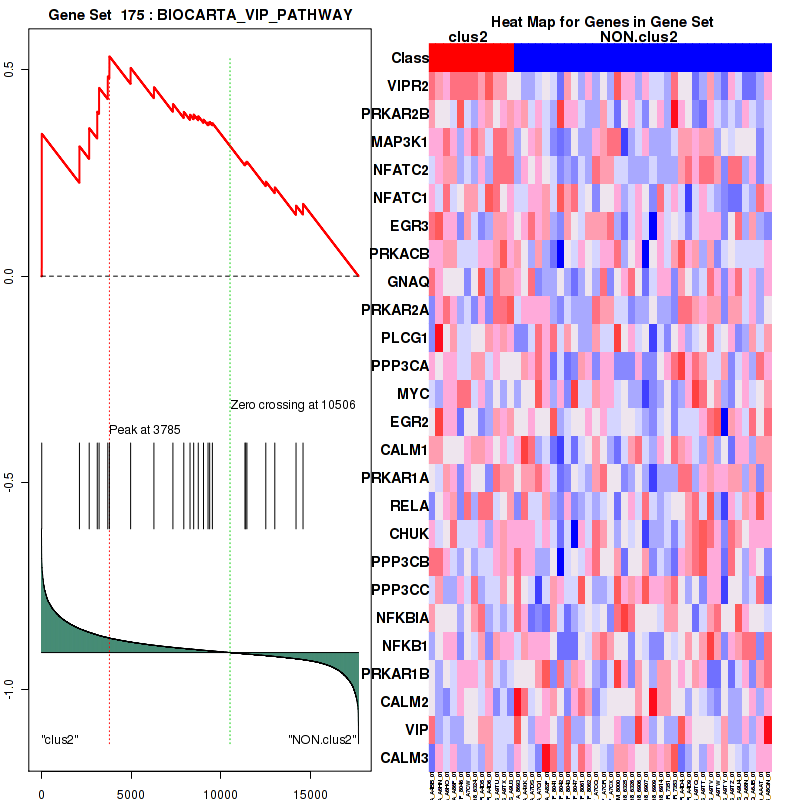
Figure S32. Get High-res Image For the top 5 core enriched genes in the pathway: BIOCARTA VIP PATHWAY, this volcano plot shows how much they are up/down-regulated and significant. The significance was calculated by empirical bayesian fit
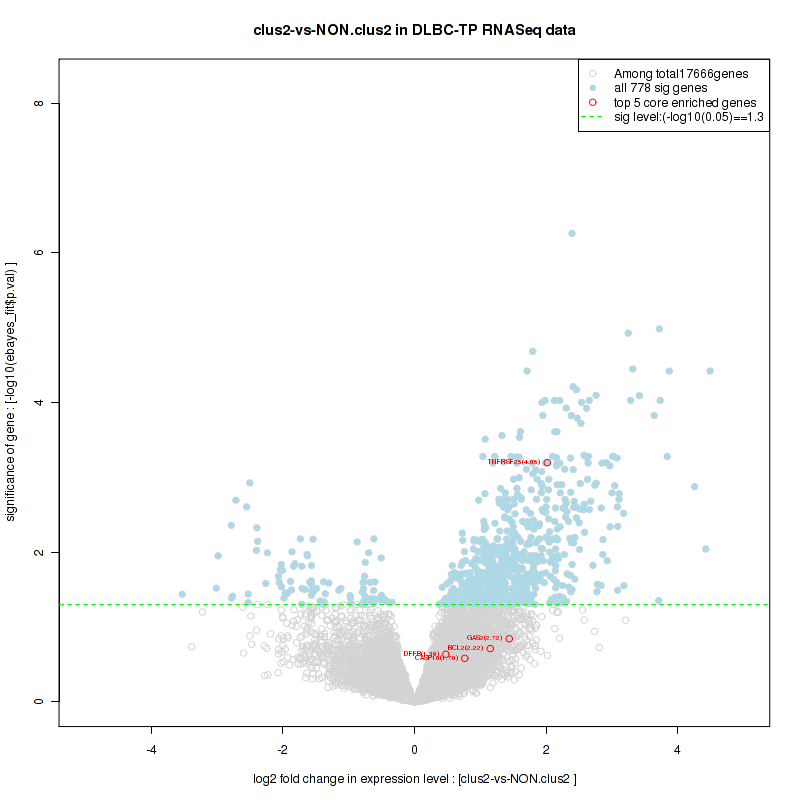
Table S17. Get Full Table This table shows a Running Enrichment Score (RES) of each gene in this pathway, that is, the enrichment score at this point in the ranked list of genes. All genes are ranked by Signal-to-Noise (S2N), a measure of similarity as default and are used to obtain ES matrix of all genes. In this way, GSEA tool uses expression pattern of not only overlapped genes but also not-overlapped genes to produce ES matrix.
| Rank | GENE | SYMBOL | DESC | LIST.LOC | S2N | RES | CORE_ENRICHMENT |
|---|---|---|---|---|---|---|---|
| 1 | VIPR2 | VIPR2 | VIPR2 | 16 | 0.99 | 0.18 | YES |
| 2 | VIPR1 | VIPR1 | VIPR1 | 70 | 0.81 | 0.32 | YES |
| 3 | GNG4 | GNG4 | GNG4 | 81 | 0.78 | 0.46 | YES |
| 4 | GCGR | GCGR | GCGR | 298 | 0.58 | 0.55 | YES |
| 5 | GNG7 | GNG7 | GNG7 | 570 | 0.48 | 0.62 | YES |
| 6 | GIPR | GIPR | GIPR | 1280 | 0.34 | 0.64 | YES |
| 7 | ADCYAP1 | ADCYAP1 | ADCYAP1 | 1686 | 0.29 | 0.68 | YES |
| 8 | SCT | SCT | SCT | 2768 | 0.21 | 0.65 | NO |
| 9 | GNG12 | GNG12 | GNG12 | 5916 | 0.085 | 0.49 | NO |
| 10 | GNG2 | GNG2 | GNG2 | 7084 | 0.06 | 0.43 | NO |
| 11 | GNB5 | GNB5 | GNB5 | 8087 | 0.041 | 0.38 | NO |
| 12 | GNB3 | GNB3 | GNB3 | 9392 | 0.019 | 0.31 | NO |
| 13 | GNG3 | GNG3 | GNG3 | 9493 | 0.017 | 0.31 | NO |
| 14 | GNAS | GNAS | GNAS | 9553 | 0.016 | 0.31 | NO |
| 15 | GNB4 | GNB4 | GNB4 | 11500 | -0.016 | 0.2 | NO |
| 16 | GNB1 | GNB1 | GNB1 | 12548 | -0.033 | 0.15 | NO |
| 17 | GNG13 | GNG13 | GNG13 | 12680 | -0.036 | 0.15 | NO |
| 18 | GNG10 | GNG10 | GNG10 | 12936 | -0.04 | 0.14 | NO |
| 19 | GNG11 | GNG11 | GNG11 | 13228 | -0.045 | 0.13 | NO |
| 20 | GNB2 | GNB2 | GNB2 | 13288 | -0.047 | 0.14 | NO |
| 21 | GNGT2 | GNGT2 | GNGT2 | 13779 | -0.057 | 0.12 | NO |
| 22 | GNG5 | GNG5 | GNG5 | 14070 | -0.063 | 0.12 | NO |
| 23 | VIP | VIP | VIP | 14184 | -0.065 | 0.12 | NO |
| 24 | GLP1R | GLP1R | GLP1R | 15318 | -0.1 | 0.074 | NO |
| 25 | GNG8 | GNG8 | GNG8 | 15447 | -0.1 | 0.085 | NO |
| 26 | SCTR | SCTR | SCTR | 16801 | -0.22 | 0.049 | NO |
Figure S33. Get High-res Image This plot shows mRNAseq_cNMF expression data heatmap (on the left) a RunningEnrichmentScore(RES) plot (on the top right) and a Signal2Noise(S2N) plot (on the bottom right) of genes in the pathway: BIOCARTA TCR PATHWAY.
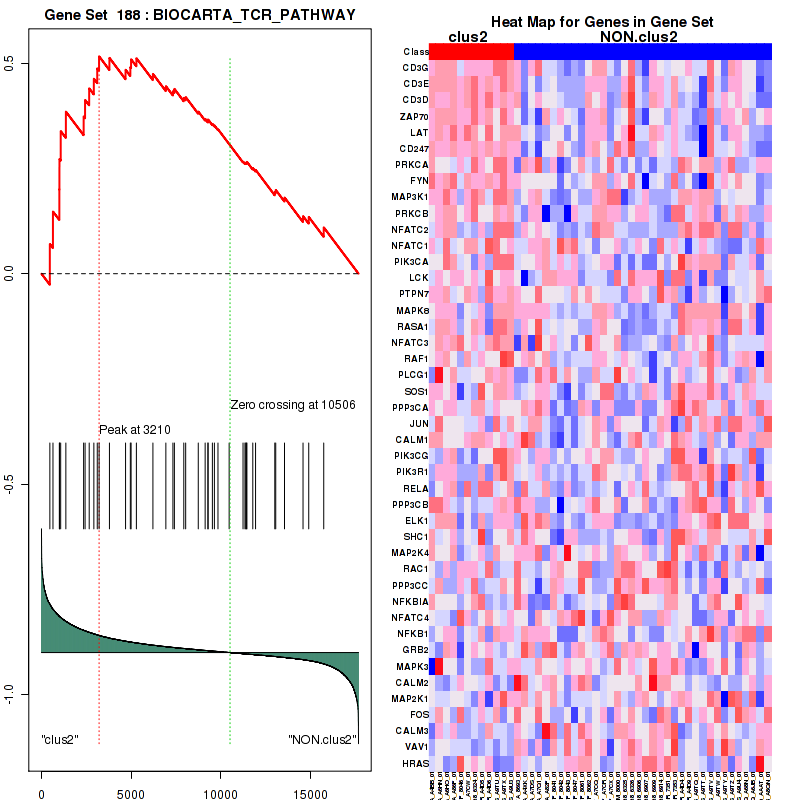
Figure S34. Get High-res Image For the top 5 core enriched genes in the pathway: BIOCARTA TCR PATHWAY, this volcano plot shows how much they are up/down-regulated and significant. The significance was calculated by empirical bayesian fit
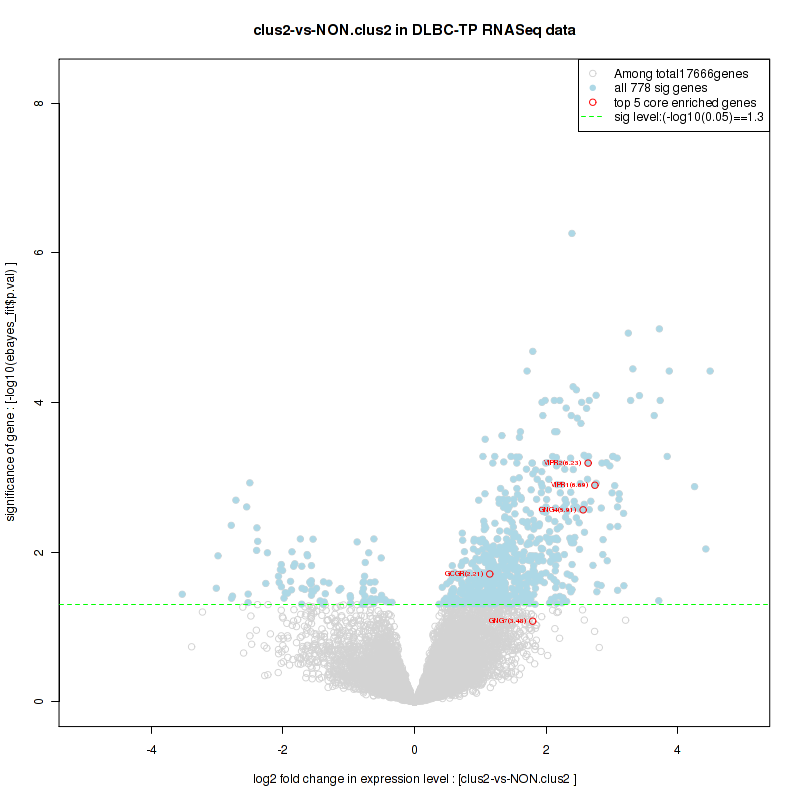
Table S18. Get Full Table This table shows a Running Enrichment Score (RES) of each gene in this pathway, that is, the enrichment score at this point in the ranked list of genes. All genes are ranked by Signal-to-Noise (S2N), a measure of similarity as default and are used to obtain ES matrix of all genes. In this way, GSEA tool uses expression pattern of not only overlapped genes but also not-overlapped genes to produce ES matrix.
| Rank | GENE | SYMBOL | DESC | LIST.LOC | S2N | RES | CORE_ENRICHMENT |
|---|---|---|---|---|---|---|---|
| 1 | CD3G | CD3G | CD3G | 467 | 0.51 | 0.07 | YES |
| 2 | CD3E | CD3E | CD3E | 641 | 0.46 | 0.15 | YES |
| 3 | CD3D | CD3D | CD3D | 997 | 0.38 | 0.2 | YES |
| 4 | ZAP70 | ZAP70 | ZAP70 | 1002 | 0.38 | 0.27 | YES |
| 5 | LAT | LAT | LAT | 1072 | 0.37 | 0.34 | YES |
| 6 | CD247 | CD247 | CD247 | 1360 | 0.33 | 0.38 | YES |
| 7 | PRKCA | PRKCA | PRKCA | 2350 | 0.24 | 0.37 | YES |
| 8 | FYN | FYN | FYN | 2430 | 0.23 | 0.41 | YES |
| 9 | MAP3K1 | MAP3K1 | MAP3K1 | 2659 | 0.21 | 0.44 | YES |
| 10 | PRKCB | PRKCB | PRKCB | 2919 | 0.2 | 0.46 | YES |
| 11 | NFATC2 | NFATC2 | NFATC2 | 3109 | 0.19 | 0.49 | YES |
| 12 | NFATC1 | NFATC1 | NFATC1 | 3210 | 0.18 | 0.52 | YES |
| 13 | PIK3CA | PIK3CA | PIK3CA | 3787 | 0.15 | 0.51 | NO |
| 14 | LCK | LCK | LCK | 4686 | 0.12 | 0.48 | NO |
| 15 | PTPN7 | PTPN7 | PTPN7 | 4952 | 0.11 | 0.49 | NO |
| 16 | MAPK8 | MAPK8 | MAPK8 | 4993 | 0.11 | 0.51 | NO |
| 17 | RASA1 | RASA1 | RASA1 | 5290 | 0.1 | 0.51 | NO |
| 18 | NFATC3 | NFATC3 | NFATC3 | 6209 | 0.078 | 0.47 | NO |
| 19 | RAF1 | RAF1 | RAF1 | 6931 | 0.063 | 0.44 | NO |
| 20 | PLCG1 | PLCG1 | PLCG1 | 7325 | 0.054 | 0.43 | NO |
| 21 | SOS1 | SOS1 | SOS1 | 7405 | 0.053 | 0.44 | NO |
| 22 | PPP3CA | PPP3CA | PPP3CA | 7929 | 0.044 | 0.42 | NO |
| 23 | JUN | JUN | JUN | 8034 | 0.042 | 0.42 | NO |
| 24 | CALM1 | CALM1 | CALM1 | 8736 | 0.029 | 0.38 | NO |
| 25 | PIK3CG | PIK3CG | PIK3CG | 9121 | 0.023 | 0.37 | NO |
| 26 | PIK3R1 | PIK3R1 | PIK3R1 | 9278 | 0.02 | 0.36 | NO |
| 27 | RELA | RELA | RELA | 9280 | 0.02 | 0.37 | NO |
| 28 | PPP3CB | PPP3CB | PPP3CB | 9524 | 0.016 | 0.36 | NO |
| 29 | ELK1 | ELK1 | ELK1 | 9635 | 0.014 | 0.35 | NO |
| 30 | SHC1 | SHC1 | SHC1 | 9836 | 0.011 | 0.34 | NO |
| 31 | MAP2K4 | MAP2K4 | MAP2K4 | 10459 | 0.00064 | 0.31 | NO |
| 32 | RAC1 | RAC1 | RAC1 | 11232 | -0.012 | 0.27 | NO |
| 33 | PPP3CC | PPP3CC | PPP3CC | 11339 | -0.014 | 0.26 | NO |
| 34 | NFKBIA | NFKBIA | NFKBIA | 11383 | -0.015 | 0.26 | NO |
| 35 | NFATC4 | NFATC4 | NFATC4 | 11422 | -0.015 | 0.26 | NO |
| 36 | NFKB1 | NFKB1 | NFKB1 | 11447 | -0.016 | 0.27 | NO |
| 37 | GRB2 | GRB2 | GRB2 | 11774 | -0.021 | 0.25 | NO |
| 38 | MAPK3 | MAPK3 | MAPK3 | 11930 | -0.023 | 0.25 | NO |
| 39 | CALM2 | CALM2 | CALM2 | 13001 | -0.041 | 0.19 | NO |
| 40 | MAP2K1 | MAP2K1 | MAP2K1 | 13053 | -0.042 | 0.2 | NO |
| 41 | FOS | FOS | FOS | 13543 | -0.052 | 0.18 | NO |
| 42 | CALM3 | CALM3 | CALM3 | 14574 | -0.075 | 0.14 | NO |
| 43 | VAV1 | VAV1 | VAV1 | 14891 | -0.085 | 0.14 | NO |
| 44 | HRAS | HRAS | HRAS | 15727 | -0.12 | 0.11 | NO |
Figure S35. Get High-res Image This plot shows mRNAseq_cNMF expression data heatmap (on the left) a RunningEnrichmentScore(RES) plot (on the top right) and a Signal2Noise(S2N) plot (on the bottom right) of genes in the pathway: ST T CELL SIGNAL TRANSDUCTION.
Figure S36. Get High-res Image For the top 5 core enriched genes in the pathway: ST T CELL SIGNAL TRANSDUCTION, this volcano plot shows how much they are up/down-regulated and significant. The significance was calculated by empirical bayesian fit
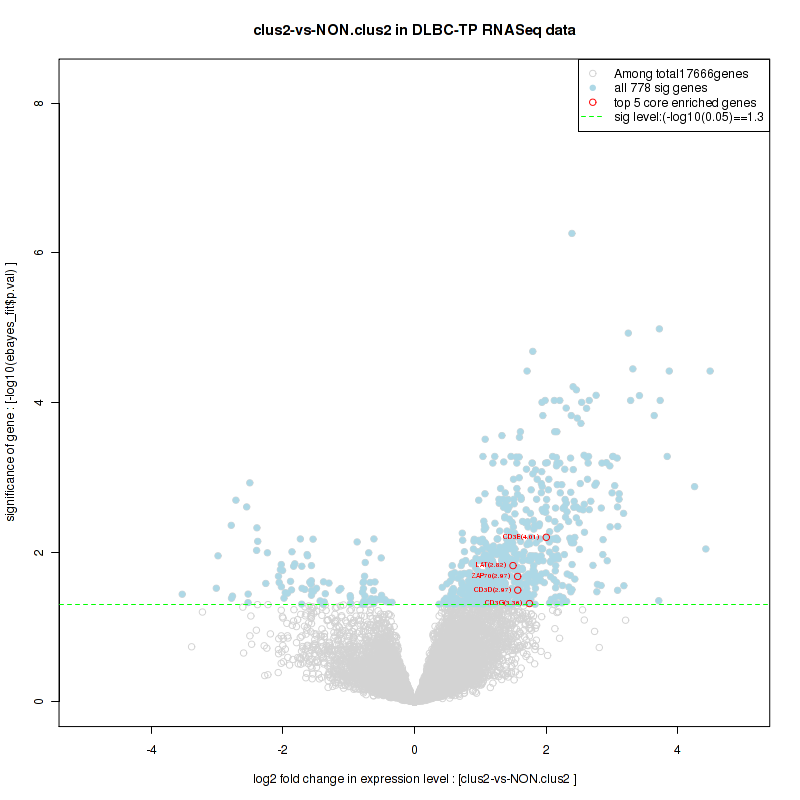
Table S19. Get Full Table This table shows a Running Enrichment Score (RES) of each gene in this pathway, that is, the enrichment score at this point in the ranked list of genes. All genes are ranked by Signal-to-Noise (S2N), a measure of similarity as default and are used to obtain ES matrix of all genes. In this way, GSEA tool uses expression pattern of not only overlapped genes but also not-overlapped genes to produce ES matrix.
| Rank | GENE | SYMBOL | DESC | LIST.LOC | S2N | RES | CORE_ENRICHMENT |
|---|---|---|---|---|---|---|---|
| 1 | ADCY5 | ADCY5 | ADCY5 | 14 | 0.99 | 0.17 | YES |
| 2 | GNG4 | GNG4 | GNG4 | 81 | 0.78 | 0.29 | YES |
| 3 | MYO5B | MYO5B | MYO5B | 555 | 0.48 | 0.35 | YES |
| 4 | GNG7 | GNG7 | GNG7 | 570 | 0.48 | 0.43 | YES |
| 5 | ADCY1 | ADCY1 | ADCY1 | 1394 | 0.33 | 0.44 | YES |
| 6 | AVPR2 | AVPR2 | AVPR2 | 1756 | 0.29 | 0.46 | YES |
| 7 | PRKAR2B | PRKAR2B | PRKAR2B | 2116 | 0.25 | 0.49 | YES |
| 8 | ADCY6 | ADCY6 | ADCY6 | 2425 | 0.23 | 0.51 | YES |
| 9 | AQP1 | AQP1 | AQP1 | 2836 | 0.2 | 0.52 | YES |
| 10 | AQP3 | AQP3 | AQP3 | 3386 | 0.17 | 0.52 | YES |
| 11 | ADCY7 | ADCY7 | ADCY7 | 3681 | 0.16 | 0.53 | YES |
| 12 | ADCY4 | ADCY4 | ADCY4 | 3755 | 0.16 | 0.55 | YES |
| 13 | PRKACB | PRKACB | PRKACB | 3785 | 0.15 | 0.57 | YES |
| 14 | RAB11FIP2 | RAB11FIP2 | RAB11FIP2 | 4455 | 0.13 | 0.56 | NO |
| 15 | ADCY9 | ADCY9 | ADCY9 | 4640 | 0.12 | 0.57 | NO |
| 16 | GNG12 | GNG12 | GNG12 | 5916 | 0.085 | 0.51 | NO |
| 17 | PRKAR2A | PRKAR2A | PRKAR2A | 6267 | 0.077 | 0.5 | NO |
| 18 | GNG2 | GNG2 | GNG2 | 7084 | 0.06 | 0.46 | NO |
| 19 | PRKACA | PRKACA | PRKACA | 7784 | 0.046 | 0.43 | NO |
| 20 | GNB5 | GNB5 | GNB5 | 8087 | 0.041 | 0.42 | NO |
| 21 | PRKAR1A | PRKAR1A | PRKAR1A | 9030 | 0.024 | 0.37 | NO |
| 22 | GNB3 | GNB3 | GNB3 | 9392 | 0.019 | 0.36 | NO |
| 23 | GNG3 | GNG3 | GNG3 | 9493 | 0.017 | 0.35 | NO |
| 24 | GNAS | GNAS | GNAS | 9553 | 0.016 | 0.35 | NO |
| 25 | GNB4 | GNB4 | GNB4 | 11500 | -0.016 | 0.24 | NO |
| 26 | AQP4 | AQP4 | AQP4 | 11632 | -0.019 | 0.24 | NO |
| 27 | ADCY2 | ADCY2 | ADCY2 | 12287 | -0.029 | 0.21 | NO |
| 28 | PRKAR1B | PRKAR1B | PRKAR1B | 12501 | -0.032 | 0.2 | NO |
| 29 | GNB1 | GNB1 | GNB1 | 12548 | -0.033 | 0.2 | NO |
| 30 | RAB11A | RAB11A | RAB11A | 12641 | -0.035 | 0.2 | NO |
| 31 | GNG13 | GNG13 | GNG13 | 12680 | -0.036 | 0.21 | NO |
| 32 | GNG10 | GNG10 | GNG10 | 12936 | -0.04 | 0.2 | NO |
| 33 | GNG11 | GNG11 | GNG11 | 13228 | -0.045 | 0.19 | NO |
| 34 | GNB2 | GNB2 | GNB2 | 13288 | -0.047 | 0.2 | NO |
| 35 | GNGT2 | GNGT2 | GNGT2 | 13779 | -0.057 | 0.18 | NO |
| 36 | GNG5 | GNG5 | GNG5 | 14070 | -0.063 | 0.17 | NO |
| 37 | ADCY3 | ADCY3 | ADCY3 | 14827 | -0.083 | 0.14 | NO |
| 38 | GNG8 | GNG8 | GNG8 | 15447 | -0.1 | 0.13 | NO |
Figure S37. Get High-res Image This plot shows mRNAseq_cNMF expression data heatmap (on the left) a RunningEnrichmentScore(RES) plot (on the top right) and a Signal2Noise(S2N) plot (on the bottom right) of genes in the pathway: PID TCR PATHWAY.
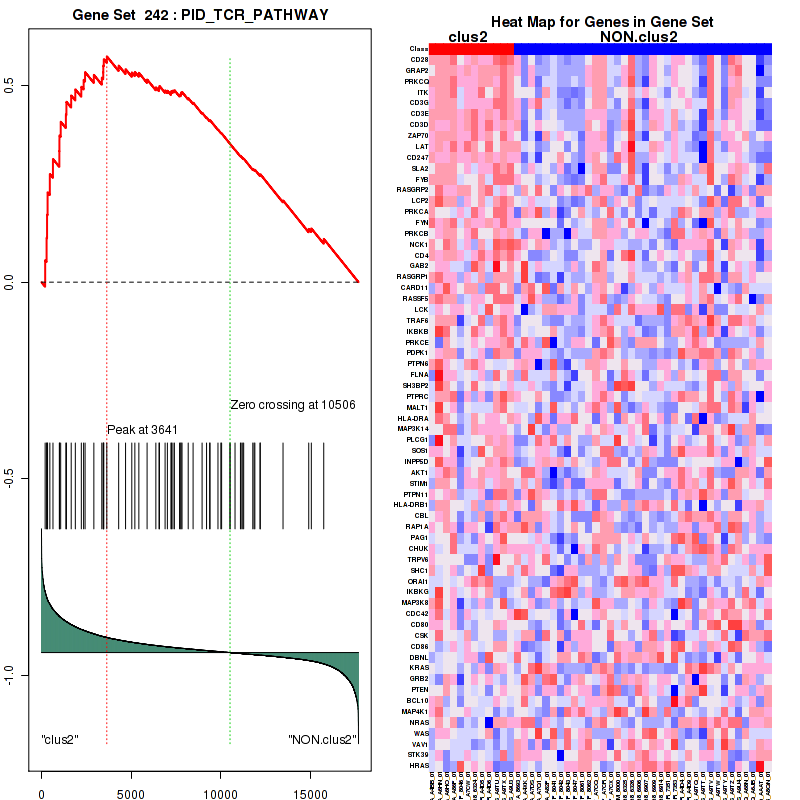
Figure S38. Get High-res Image For the top 5 core enriched genes in the pathway: PID TCR PATHWAY, this volcano plot shows how much they are up/down-regulated and significant. The significance was calculated by empirical bayesian fit
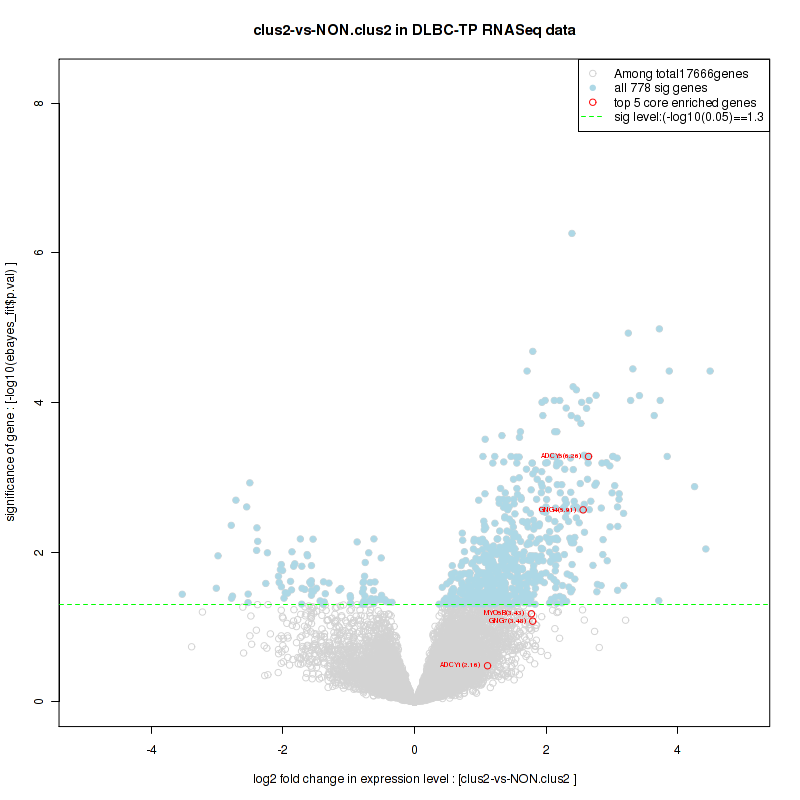
Table S20. Get Full Table This table shows a Running Enrichment Score (RES) of each gene in this pathway, that is, the enrichment score at this point in the ranked list of genes. All genes are ranked by Signal-to-Noise (S2N), a measure of similarity as default and are used to obtain ES matrix of all genes. In this way, GSEA tool uses expression pattern of not only overlapped genes but also not-overlapped genes to produce ES matrix.
| Rank | GENE | SYMBOL | DESC | LIST.LOC | S2N | RES | CORE_ENRICHMENT |
|---|---|---|---|---|---|---|---|
| 1 | ADCY5 | ADCY5 | ADCY5 | 14 | 0.99 | 0.13 | YES |
| 2 | GNG4 | GNG4 | GNG4 | 81 | 0.78 | 0.23 | YES |
| 3 | ADRA2A | ADRA2A | ADRA2A | 279 | 0.59 | 0.3 | YES |
| 4 | PRKCQ | PRKCQ | PRKCQ | 313 | 0.57 | 0.37 | YES |
| 5 | GNG7 | GNG7 | GNG7 | 570 | 0.48 | 0.42 | YES |
| 6 | RGS4 | RGS4 | RGS4 | 680 | 0.45 | 0.47 | YES |
| 7 | ADCY1 | ADCY1 | ADCY1 | 1394 | 0.33 | 0.47 | YES |
| 8 | PRKCH | PRKCH | PRKCH | 1929 | 0.27 | 0.48 | YES |
| 9 | GNAZ | GNAZ | GNAZ | 2110 | 0.25 | 0.5 | YES |
| 10 | PRKCA | PRKCA | PRKCA | 2350 | 0.24 | 0.52 | YES |
| 11 | ADCY6 | ADCY6 | ADCY6 | 2425 | 0.23 | 0.55 | YES |
| 12 | GNAI1 | GNAI1 | GNAI1 | 2567 | 0.22 | 0.57 | YES |
| 13 | RGS17 | RGS17 | RGS17 | 2892 | 0.2 | 0.57 | YES |
| 14 | PRKCB | PRKCB | PRKCB | 2919 | 0.2 | 0.6 | YES |
| 15 | ADCY7 | ADCY7 | ADCY7 | 3681 | 0.16 | 0.58 | NO |
| 16 | ADCY4 | ADCY4 | ADCY4 | 3755 | 0.16 | 0.59 | NO |
| 17 | ADCY9 | ADCY9 | ADCY9 | 4640 | 0.12 | 0.56 | NO |
| 18 | PRKCE | PRKCE | PRKCE | 5427 | 0.098 | 0.53 | NO |
| 19 | GNG12 | GNG12 | GNG12 | 5916 | 0.085 | 0.51 | NO |
| 20 | ADRA2B | ADRA2B | ADRA2B | 6200 | 0.079 | 0.5 | NO |
| 21 | GNG2 | GNG2 | GNG2 | 7084 | 0.06 | 0.46 | NO |
| 22 | PRKCG | PRKCG | PRKCG | 7761 | 0.046 | 0.43 | NO |
| 23 | GNB5 | GNB5 | GNB5 | 8087 | 0.041 | 0.42 | NO |
| 24 | GNAI2 | GNAI2 | GNAI2 | 8565 | 0.033 | 0.39 | NO |
| 25 | RGS19 | RGS19 | RGS19 | 8894 | 0.026 | 0.38 | NO |
| 26 | GNB3 | GNB3 | GNB3 | 9392 | 0.019 | 0.35 | NO |
| 27 | GNG3 | GNG3 | GNG3 | 9493 | 0.017 | 0.35 | NO |
| 28 | GNAS | GNAS | GNAS | 9553 | 0.016 | 0.35 | NO |
| 29 | PRKCD | PRKCD | PRKCD | 10801 | -0.0053 | 0.28 | NO |
| 30 | GNB4 | GNB4 | GNB4 | 11500 | -0.016 | 0.24 | NO |
| 31 | ADCY2 | ADCY2 | ADCY2 | 12287 | -0.029 | 0.2 | NO |
| 32 | GNB1 | GNB1 | GNB1 | 12548 | -0.033 | 0.19 | NO |
| 33 | GNG13 | GNG13 | GNG13 | 12680 | -0.036 | 0.19 | NO |
| 34 | GNG10 | GNG10 | GNG10 | 12936 | -0.04 | 0.18 | NO |
| 35 | GNG11 | GNG11 | GNG11 | 13228 | -0.045 | 0.17 | NO |
| 36 | GNB2 | GNB2 | GNB2 | 13288 | -0.047 | 0.17 | NO |
| 37 | GNGT2 | GNGT2 | GNGT2 | 13779 | -0.057 | 0.15 | NO |
| 38 | GNG5 | GNG5 | GNG5 | 14070 | -0.063 | 0.14 | NO |
| 39 | GNAI3 | GNAI3 | GNAI3 | 14781 | -0.081 | 0.11 | NO |
| 40 | ADCY3 | ADCY3 | ADCY3 | 14827 | -0.083 | 0.12 | NO |
| 41 | GNG8 | GNG8 | GNG8 | 15447 | -0.1 | 0.098 | NO |
| 42 | RGS20 | RGS20 | RGS20 | 16690 | -0.21 | 0.055 | NO |
Figure S39. Get High-res Image This plot shows mRNAseq_cNMF expression data heatmap (on the left) a RunningEnrichmentScore(RES) plot (on the top right) and a Signal2Noise(S2N) plot (on the bottom right) of genes in the pathway: PID CD8TCRPATHWAY.

Figure S40. Get High-res Image For the top 5 core enriched genes in the pathway: PID CD8TCRPATHWAY, this volcano plot shows how much they are up/down-regulated and significant. The significance was calculated by empirical bayesian fit
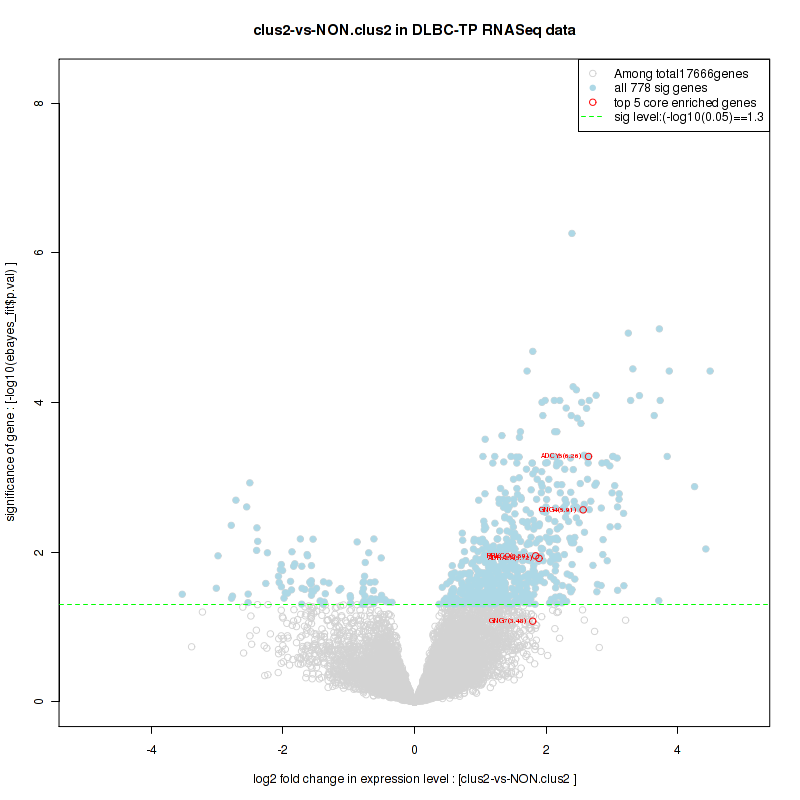
For the top enriched genes, if you want to check whether they are
-
up-regulated, please check the list of up-regulated genes
-
down-regulated, please check the list of down-regulated genes
For the top enriched genes, if you want to check whether they are
-
highly expressed genes, please check the list of high (top 30%) expressed genes
-
low expressed genes, please check the list of low (bottom 30%) expressed genes
An expression pattern of top(30%)/middle(30%)/low(30%) in this subtype against other subtypes is available in a heatmap
For the top enriched genes, if you want to check whether they are
-
significantly differently expressed genes by eBayes lm fit, please check the list of significant genes
Table 5. Get Full Table This table shows top 10 pathways which are significantly enriched in cluster clus3. It displays only significant gene sets satisfying nom.p.val.threshold (-1), fwer.p.val.threshold (-1) , fdr.q.val.threshold (0.25) and the default table is sorted by Normalized Enrichment Score (NES). Further details on NES statistics, please visit The Broad GSEA website.
| GeneSet(GS) | Size(#genes) | genes.ES.table | ES | NES | NOM.p.val | FDR.q.val | FWER.p.val | Tag.. | Gene.. | Signal | FDR..median. | glob.p.val |
|---|---|---|---|---|---|---|---|---|---|---|---|---|
| PID AURORA B PATHWAY | 39 | genes.ES.table | 0.55 | 1.7 | 0.045 | 0.28 | 0.73 | 0.56 | 0.27 | 0.41 | 0.11 | 0.062 |
| PID ATR PATHWAY | 39 | genes.ES.table | 0.57 | 1.8 | 0.023 | 0.36 | 0.65 | 0.49 | 0.2 | 0.39 | 0.12 | 0.085 |
| PID CDC42 REG PATHWAY | 29 | genes.ES.table | 0.66 | 1.8 | 0.002 | 0.41 | 0.56 | 0.38 | 0.16 | 0.32 | 0.11 | 0.088 |
| PID ATM PATHWAY | 34 | genes.ES.table | 0.59 | 2 | 0.0019 | 0.4 | 0.12 | 0.56 | 0.26 | 0.42 | 0 | 0.081 |
| PID BARD1PATHWAY | 29 | genes.ES.table | 0.67 | 1.8 | 0.0038 | 0.57 | 0.4 | 0.62 | 0.22 | 0.48 | 0 | 0.12 |
| REACTOME METABOLISM OF NON CODING RNA | 47 | genes.ES.table | 0.54 | 1.9 | 0.028 | 0.8 | 0.38 | 0.62 | 0.33 | 0.42 | 0 | 0.15 |
| REACTOME TRANSPORT OF MATURE TRANSCRIPT TO CYTOPLASM | 44 | genes.ES.table | 0.56 | 1.8 | 0.019 | 0.54 | 0.47 | 0.68 | 0.37 | 0.43 | 0 | 0.11 |
| REACTOME RNA POL II TRANSCRIPTION | 93 | genes.ES.table | 0.39 | 1.7 | 0.053 | 0.36 | 0.68 | 0.41 | 0.32 | 0.28 | 0.12 | 0.089 |
| REACTOME CELL CYCLE MITOTIC | 297 | genes.ES.table | 0.45 | 1.8 | 0.056 | 0.39 | 0.63 | 0.46 | 0.28 | 0.34 | 0.12 | 0.089 |
| REACTOME RECRUITMENT OF MITOTIC CENTROSOME PROTEINS AND COMPLEXES | 59 | genes.ES.table | 0.44 | 1.8 | 0.03 | 0.38 | 0.58 | 0.51 | 0.3 | 0.36 | 0.11 | 0.084 |
Table S21. Get Full Table This table shows a Running Enrichment Score (RES) of each gene in this pathway, that is, the enrichment score at this point in the ranked list of genes. All genes are ranked by Signal-to-Noise (S2N), a measure of similarity as default and are used to obtain ES matrix of all genes. In this way, GSEA tool uses expression pattern of not only overlapped genes but also not-overlapped genes to produce ES matrix.
| Rank | GENE | SYMBOL | DESC | LIST.LOC | S2N | RES | CORE_ENRICHMENT |
|---|---|---|---|---|---|---|---|
| 1 | RBBP8 | RBBP8 | RBBP8 | 1232 | 0.24 | 0.009 | YES |
| 2 | BLM | BLM | BLM | 1306 | 0.23 | 0.081 | YES |
| 3 | BRCA1 | BRCA1 | BRCA1 | 1830 | 0.19 | 0.12 | YES |
| 4 | ABL1 | ABL1 | ABL1 | 1886 | 0.19 | 0.17 | YES |
| 5 | SMC3 | SMC3 | SMC3 | 2150 | 0.17 | 0.22 | YES |
| 6 | MRE11A | MRE11A | MRE11A | 2511 | 0.15 | 0.24 | YES |
| 7 | FANCD2 | FANCD2 | FANCD2 | 3059 | 0.13 | 0.26 | YES |
| 8 | UBE2N | UBE2N | UBE2N | 3131 | 0.13 | 0.3 | YES |
| 9 | BID | BID | BID | 3302 | 0.12 | 0.33 | YES |
| 10 | CDC25A | CDC25A | CDC25A | 3313 | 0.12 | 0.37 | YES |
| 11 | TP53BP1 | TP53BP1 | TP53BP1 | 3398 | 0.12 | 0.4 | YES |
| 12 | RAD50 | RAD50 | RAD50 | 3727 | 0.11 | 0.42 | YES |
| 13 | ATM | ATM | ATM | 3740 | 0.11 | 0.45 | YES |
| 14 | FAM175A | FAM175A | FAM175A | 3957 | 0.1 | 0.47 | YES |
| 15 | UIMC1 | UIMC1 | UIMC1 | 3963 | 0.1 | 0.5 | YES |
| 16 | SMC1A | SMC1A | SMC1A | 4019 | 0.098 | 0.53 | YES |
| 17 | TOP3A | TOP3A | TOP3A | 4160 | 0.094 | 0.56 | YES |
| 18 | MDC1 | MDC1 | MDC1 | 4331 | 0.089 | 0.58 | YES |
| 19 | CDC25C | CDC25C | CDC25C | 4536 | 0.084 | 0.59 | YES |
| 20 | TRIM28 | TRIM28 | TRIM28 | 6207 | 0.041 | 0.51 | NO |
| 21 | CHEK2 | CHEK2 | CHEK2 | 7077 | 0.02 | 0.47 | NO |
| 22 | RNF8 | RNF8 | RNF8 | 7213 | 0.017 | 0.47 | NO |
| 23 | H2AFX | H2AFX | H2AFX | 7256 | 0.016 | 0.47 | NO |
| 24 | RAD9A | RAD9A | RAD9A | 7617 | 0.0075 | 0.45 | NO |
| 25 | NBN | NBN | NBN | 7675 | 0.0062 | 0.45 | NO |
| 26 | DCLRE1C | DCLRE1C | DCLRE1C | 7947 | 0.00021 | 0.44 | NO |
| 27 | CTBP1 | CTBP1 | CTBP1 | 8829 | -0.02 | 0.39 | NO |
| 28 | RAD17 | RAD17 | RAD17 | 8879 | -0.021 | 0.4 | NO |
| 29 | KAT5 | KAT5 | KAT5 | 8979 | -0.023 | 0.4 | NO |
| 30 | XRCC4 | XRCC4 | XRCC4 | 9069 | -0.025 | 0.4 | NO |
| 31 | MDM2 | MDM2 | MDM2 | 9372 | -0.032 | 0.4 | NO |
| 32 | YWHAB | YWHAB | YWHAB | 10212 | -0.052 | 0.36 | NO |
| 33 | RFWD2 | RFWD2 | RFWD2 | 11383 | -0.084 | 0.33 | NO |
| 34 | TERF2 | TERF2 | TERF2 | 11651 | -0.092 | 0.34 | NO |
Figure S41. Get High-res Image This plot shows mRNAseq_cNMF expression data heatmap (on the left) a RunningEnrichmentScore(RES) plot (on the top right) and a Signal2Noise(S2N) plot (on the bottom right) of genes in the pathway: PID AURORA B PATHWAY.
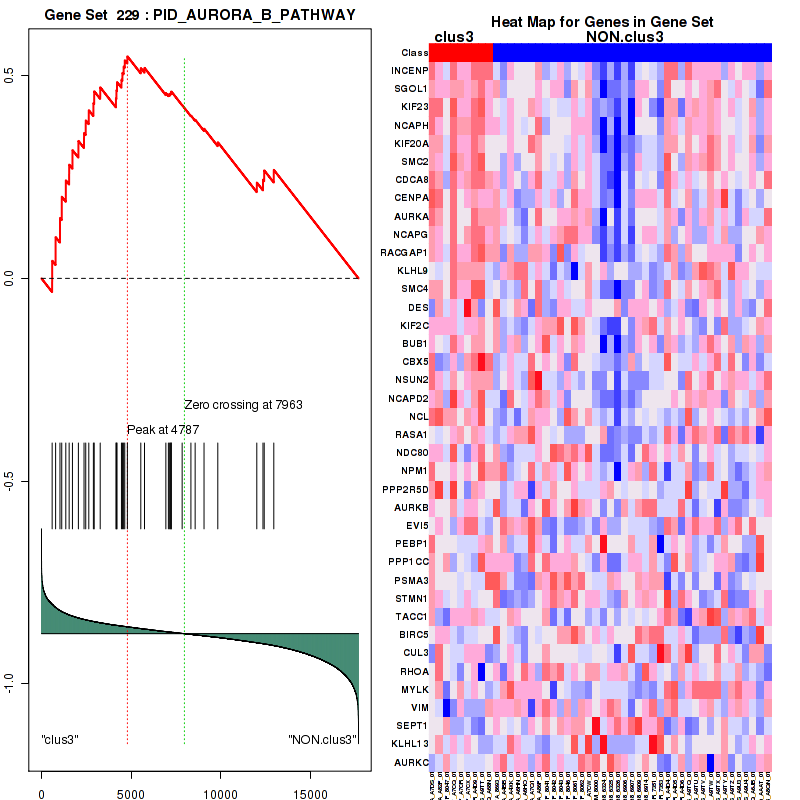
Figure S42. Get High-res Image For the top 5 core enriched genes in the pathway: PID AURORA B PATHWAY, this volcano plot shows how much they are up/down-regulated and significant. The significance was calculated by empirical bayesian fit
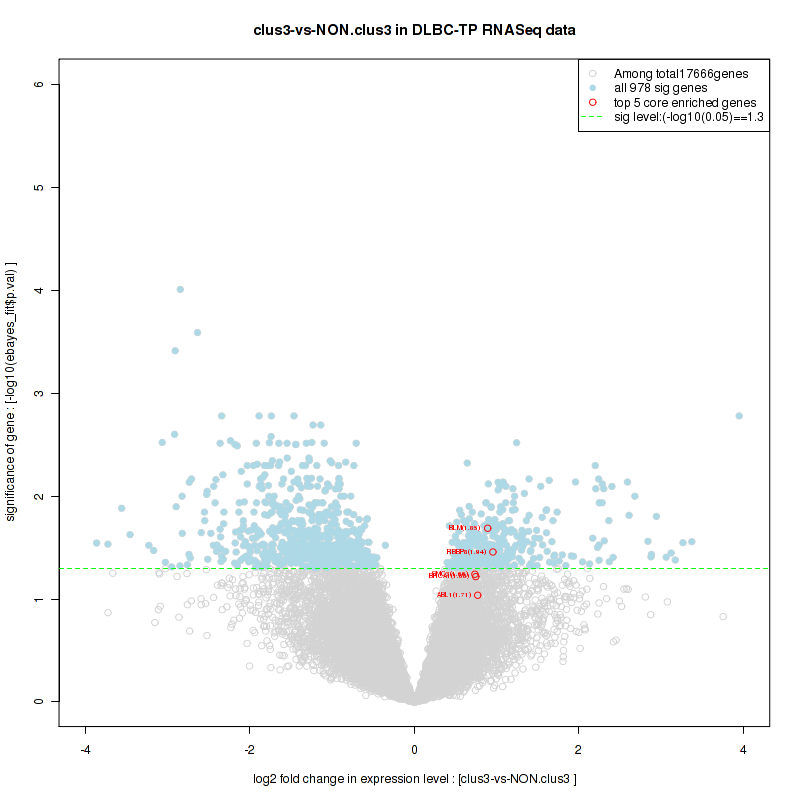
Table S22. Get Full Table This table shows a Running Enrichment Score (RES) of each gene in this pathway, that is, the enrichment score at this point in the ranked list of genes. All genes are ranked by Signal-to-Noise (S2N), a measure of similarity as default and are used to obtain ES matrix of all genes. In this way, GSEA tool uses expression pattern of not only overlapped genes but also not-overlapped genes to produce ES matrix.
| Rank | GENE | SYMBOL | DESC | LIST.LOC | S2N | RES | CORE_ENRICHMENT |
|---|---|---|---|---|---|---|---|
| 1 | NUP153 | NUP153 | NUP153 | 1937 | 0.18 | -0.058 | YES |
| 2 | NUP205 | NUP205 | NUP205 | 2200 | 0.17 | -0.026 | YES |
| 3 | NUP155 | NUP155 | NUP155 | 2210 | 0.17 | 0.021 | YES |
| 4 | NUPL1 | NUPL1 | NUPL1 | 2229 | 0.17 | 0.067 | YES |
| 5 | TGS1 | TGS1 | TGS1 | 2359 | 0.16 | 0.1 | YES |
| 6 | GEMIN5 | GEMIN5 | GEMIN5 | 2452 | 0.16 | 0.14 | YES |
| 7 | NUP107 | NUP107 | NUP107 | 2585 | 0.15 | 0.18 | YES |
| 8 | NUP188 | NUP188 | NUP188 | 2627 | 0.15 | 0.22 | YES |
| 9 | NUPL2 | NUPL2 | NUPL2 | 3358 | 0.12 | 0.21 | YES |
| 10 | NUP54 | NUP54 | NUP54 | 3540 | 0.11 | 0.23 | YES |
| 11 | NUP210 | NUP210 | NUP210 | 3614 | 0.11 | 0.26 | YES |
| 12 | SEH1L | SEH1L | SEH1L | 3638 | 0.11 | 0.29 | YES |
| 13 | PRMT5 | PRMT5 | PRMT5 | 3704 | 0.11 | 0.32 | YES |
| 14 | POM121 | POM121 | POM121 | 3910 | 0.1 | 0.33 | YES |
| 15 | TPR | TPR | TPR | 3958 | 0.1 | 0.36 | YES |
| 16 | NUP37 | NUP37 | NUP37 | 4051 | 0.098 | 0.38 | YES |
| 17 | NUP50 | NUP50 | NUP50 | 4084 | 0.096 | 0.4 | YES |
| 18 | SMN1 | SMN1 | SMN1 | 4198 | 0.093 | 0.42 | YES |
| 19 | NUP35 | NUP35 | NUP35 | 4283 | 0.091 | 0.44 | YES |
| 20 | SMN2 | SMN2 | SMN2 | 4754 | 0.078 | 0.44 | YES |
| 21 | NCBP1 | NCBP1 | NCBP1 | 4755 | 0.078 | 0.46 | YES |
| 22 | DDX20 | DDX20 | DDX20 | 4762 | 0.078 | 0.48 | YES |
| 23 | GEMIN4 | GEMIN4 | GEMIN4 | 4897 | 0.074 | 0.5 | YES |
| 24 | SNRPF | SNRPF | SNRPF | 4937 | 0.073 | 0.52 | YES |
| 25 | NUP85 | NUP85 | NUP85 | 5100 | 0.069 | 0.52 | YES |
| 26 | NUP88 | NUP88 | NUP88 | 5604 | 0.056 | 0.51 | YES |
| 27 | PHAX | PHAX | PHAX | 5715 | 0.053 | 0.52 | YES |
| 28 | WDR77 | WDR77 | WDR77 | 5738 | 0.052 | 0.53 | YES |
| 29 | NUP214 | NUP214 | NUP214 | 5814 | 0.05 | 0.54 | YES |
| 30 | NUP62 | NUP62 | NUP62 | 6143 | 0.042 | 0.54 | NO |
| 31 | AAAS | AAAS | AAAS | 6464 | 0.034 | 0.53 | NO |
| 32 | SNRPD1 | SNRPD1 | SNRPD1 | 6519 | 0.033 | 0.53 | NO |
| 33 | SNRPG | SNRPG | SNRPG | 6609 | 0.031 | 0.54 | NO |
| 34 | RAE1 | RAE1 | RAE1 | 6799 | 0.026 | 0.53 | NO |
| 35 | NCBP2 | NCBP2 | NCBP2 | 7291 | 0.015 | 0.51 | NO |
| 36 | CLNS1A | CLNS1A | CLNS1A | 7500 | 0.01 | 0.5 | NO |
| 37 | RANBP2 | RANBP2 | RANBP2 | 7636 | 0.0071 | 0.5 | NO |
| 38 | SNUPN | SNUPN | SNUPN | 7744 | 0.0046 | 0.49 | NO |
| 39 | NUP133 | NUP133 | NUP133 | 7789 | 0.0036 | 0.49 | NO |
| 40 | SNRPB | SNRPB | SNRPB | 8280 | -0.0072 | 0.46 | NO |
| 41 | NUP93 | NUP93 | NUP93 | 8348 | -0.0087 | 0.46 | NO |
| 42 | SNRPD3 | SNRPD3 | SNRPD3 | 8533 | -0.013 | 0.46 | NO |
| 43 | NUP43 | NUP43 | NUP43 | 8706 | -0.017 | 0.45 | NO |
| 44 | SNRPE | SNRPE | SNRPE | 8710 | -0.017 | 0.46 | NO |
| 45 | SNRPD2 | SNRPD2 | SNRPD2 | 9410 | -0.033 | 0.42 | NO |
| 46 | GEMIN6 | GEMIN6 | GEMIN6 | 9837 | -0.043 | 0.41 | NO |
| 47 | GEMIN7 | GEMIN7 | GEMIN7 | 12306 | -0.11 | 0.3 | NO |
Figure S43. Get High-res Image This plot shows mRNAseq_cNMF expression data heatmap (on the left) a RunningEnrichmentScore(RES) plot (on the top right) and a Signal2Noise(S2N) plot (on the bottom right) of genes in the pathway: PID ATR PATHWAY.
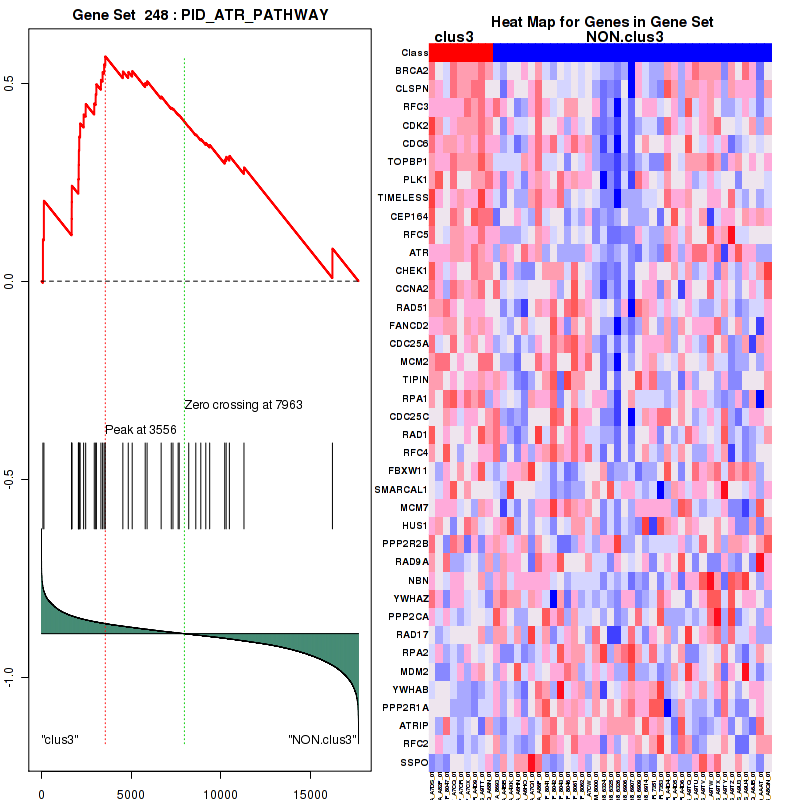
Figure S44. Get High-res Image For the top 5 core enriched genes in the pathway: PID ATR PATHWAY, this volcano plot shows how much they are up/down-regulated and significant. The significance was calculated by empirical bayesian fit
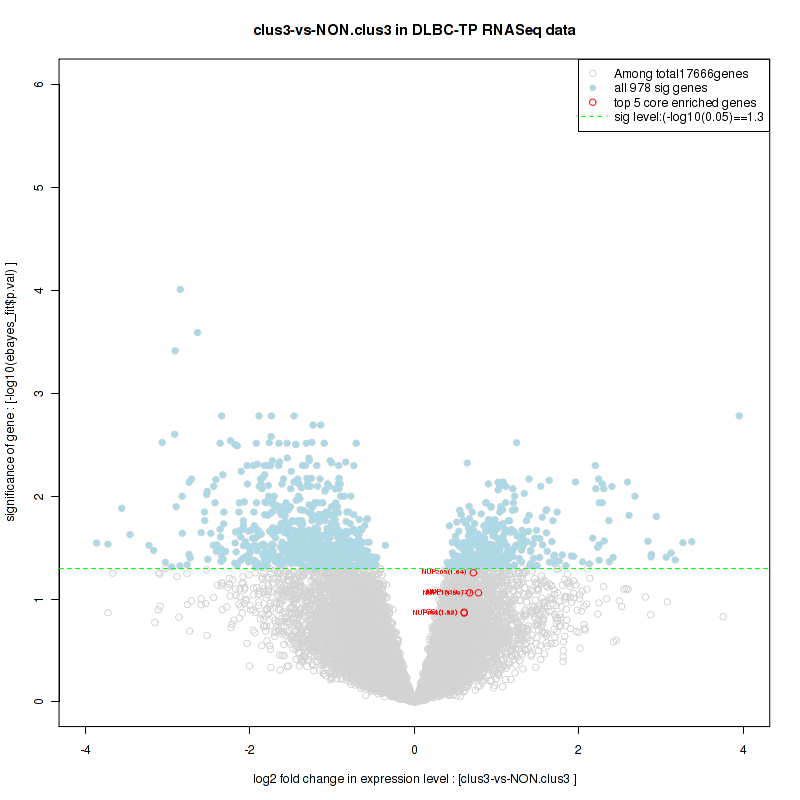
Table S23. Get Full Table This table shows a Running Enrichment Score (RES) of each gene in this pathway, that is, the enrichment score at this point in the ranked list of genes. All genes are ranked by Signal-to-Noise (S2N), a measure of similarity as default and are used to obtain ES matrix of all genes. In this way, GSEA tool uses expression pattern of not only overlapped genes but also not-overlapped genes to produce ES matrix.
| Rank | GENE | SYMBOL | DESC | LIST.LOC | S2N | RES | CORE_ENRICHMENT |
|---|---|---|---|---|---|---|---|
| 1 | BARD1 | BARD1 | BARD1 | 248 | 0.42 | 0.12 | YES |
| 2 | RBBP8 | RBBP8 | RBBP8 | 1232 | 0.24 | 0.14 | YES |
| 3 | CDK2 | CDK2 | CDK2 | 1687 | 0.2 | 0.17 | YES |
| 4 | BRCA1 | BRCA1 | BRCA1 | 1830 | 0.19 | 0.22 | YES |
| 5 | TOPBP1 | TOPBP1 | TOPBP1 | 2056 | 0.18 | 0.26 | YES |
| 6 | ATR | ATR | ATR | 2350 | 0.16 | 0.3 | YES |
| 7 | MRE11A | MRE11A | MRE11A | 2511 | 0.15 | 0.34 | YES |
| 8 | FANCF | FANCF | FANCF | 2868 | 0.14 | 0.36 | YES |
| 9 | FANCC | FANCC | FANCC | 2892 | 0.14 | 0.4 | YES |
| 10 | RAD51 | RAD51 | RAD51 | 3021 | 0.13 | 0.44 | YES |
| 11 | FANCD2 | FANCD2 | FANCD2 | 3059 | 0.13 | 0.47 | YES |
| 12 | PRKDC | PRKDC | PRKDC | 3061 | 0.13 | 0.52 | YES |
| 13 | FANCA | FANCA | FANCA | 3151 | 0.13 | 0.55 | YES |
| 14 | CCNE1 | CCNE1 | CCNE1 | 3414 | 0.12 | 0.57 | YES |
| 15 | FANCG | FANCG | FANCG | 3628 | 0.11 | 0.59 | YES |
| 16 | RAD50 | RAD50 | RAD50 | 3727 | 0.11 | 0.62 | YES |
| 17 | ATM | ATM | ATM | 3740 | 0.11 | 0.65 | YES |
| 18 | TP53 | TP53 | TP53 | 3938 | 0.1 | 0.67 | YES |
| 19 | NPM1 | NPM1 | NPM1 | 5534 | 0.057 | 0.6 | NO |
| 20 | FANCE | FANCE | FANCE | 5767 | 0.052 | 0.6 | NO |
| 21 | PCNA | PCNA | PCNA | 6202 | 0.041 | 0.59 | NO |
| 22 | EWSR1 | EWSR1 | EWSR1 | 6426 | 0.035 | 0.59 | NO |
| 23 | XRCC5 | XRCC5 | XRCC5 | 6495 | 0.033 | 0.6 | NO |
| 24 | FANCL | FANCL | FANCL | 6546 | 0.032 | 0.6 | NO |
| 25 | CSTF1 | CSTF1 | CSTF1 | 7011 | 0.022 | 0.58 | NO |
| 26 | NBN | NBN | NBN | 7675 | 0.0062 | 0.55 | NO |
| 27 | XRCC6 | XRCC6 | XRCC6 | 8132 | -0.0035 | 0.52 | NO |
| 28 | UBE2D3 | UBE2D3 | UBE2D3 | 8191 | -0.0047 | 0.52 | NO |
| 29 | UBE2L3 | UBE2L3 | UBE2L3 | 10038 | -0.048 | 0.43 | NO |
Figure S45. Get High-res Image This plot shows mRNAseq_cNMF expression data heatmap (on the left) a RunningEnrichmentScore(RES) plot (on the top right) and a Signal2Noise(S2N) plot (on the bottom right) of genes in the pathway: PID CDC42 REG PATHWAY.
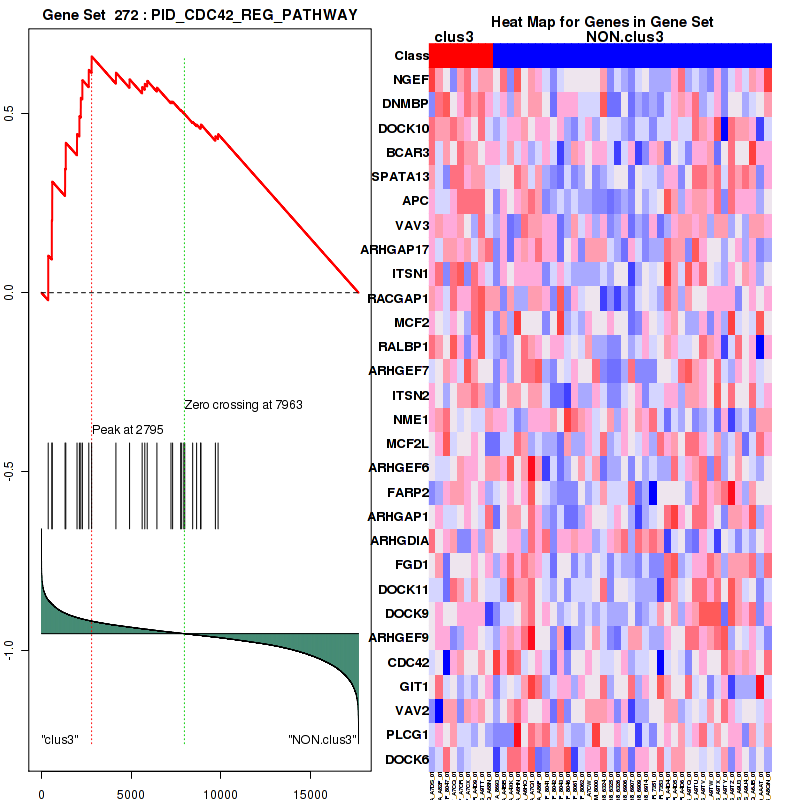
Figure S46. Get High-res Image For the top 5 core enriched genes in the pathway: PID CDC42 REG PATHWAY, this volcano plot shows how much they are up/down-regulated and significant. The significance was calculated by empirical bayesian fit
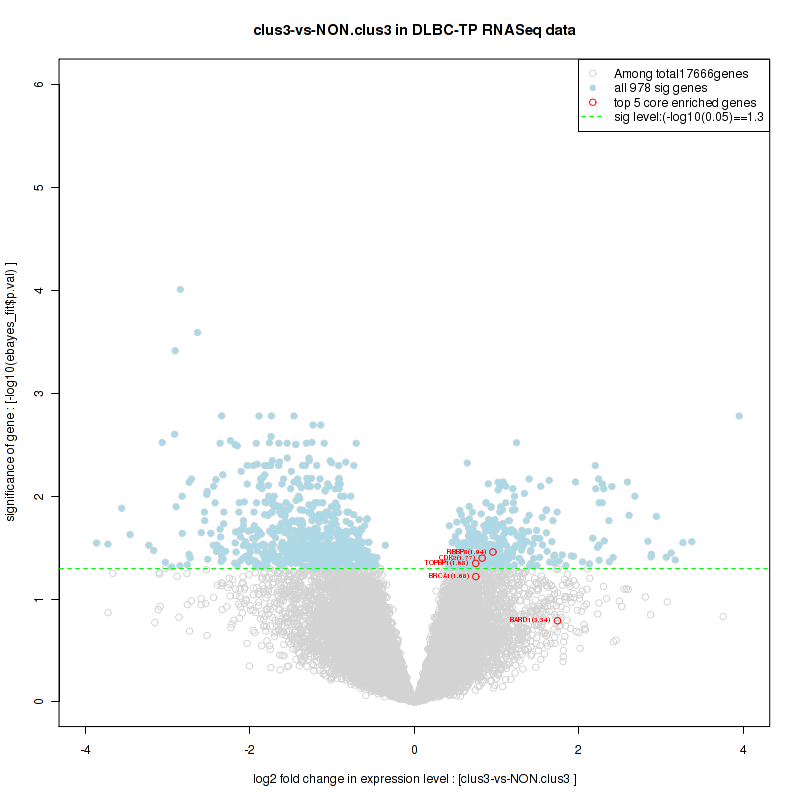
Table S24. Get Full Table This table shows a Running Enrichment Score (RES) of each gene in this pathway, that is, the enrichment score at this point in the ranked list of genes. All genes are ranked by Signal-to-Noise (S2N), a measure of similarity as default and are used to obtain ES matrix of all genes. In this way, GSEA tool uses expression pattern of not only overlapped genes but also not-overlapped genes to produce ES matrix.
| Rank | GENE | SYMBOL | DESC | LIST.LOC | S2N | RES | CORE_ENRICHMENT |
|---|---|---|---|---|---|---|---|
| 1 | NUP153 | NUP153 | NUP153 | 1937 | 0.18 | -0.052 | YES |
| 2 | NUP205 | NUP205 | NUP205 | 2200 | 0.17 | -0.014 | YES |
| 3 | NUP155 | NUP155 | NUP155 | 2210 | 0.17 | 0.038 | YES |
| 4 | NUPL1 | NUPL1 | NUPL1 | 2229 | 0.17 | 0.09 | YES |
| 5 | NUP107 | NUP107 | NUP107 | 2585 | 0.15 | 0.12 | YES |
| 6 | NUP188 | NUP188 | NUP188 | 2627 | 0.15 | 0.16 | YES |
| 7 | U2AF2 | U2AF2 | U2AF2 | 2994 | 0.13 | 0.18 | YES |
| 8 | SRRM1 | SRRM1 | SRRM1 | 3200 | 0.13 | 0.21 | YES |
| 9 | NUPL2 | NUPL2 | NUPL2 | 3358 | 0.12 | 0.24 | YES |
| 10 | NUP54 | NUP54 | NUP54 | 3540 | 0.11 | 0.26 | YES |
| 11 | NUP210 | NUP210 | NUP210 | 3614 | 0.11 | 0.3 | YES |
| 12 | SEH1L | SEH1L | SEH1L | 3638 | 0.11 | 0.33 | YES |
| 13 | NFX1 | NFX1 | NFX1 | 3836 | 0.1 | 0.35 | YES |
| 14 | POM121 | POM121 | POM121 | 3910 | 0.1 | 0.38 | YES |
| 15 | TPR | TPR | TPR | 3958 | 0.1 | 0.41 | YES |
| 16 | NUP37 | NUP37 | NUP37 | 4051 | 0.098 | 0.43 | YES |
| 17 | NUP50 | NUP50 | NUP50 | 4084 | 0.096 | 0.46 | YES |
| 18 | NUP35 | NUP35 | NUP35 | 4283 | 0.091 | 0.48 | YES |
| 19 | NCBP1 | NCBP1 | NCBP1 | 4755 | 0.078 | 0.48 | YES |
| 20 | CPSF2 | CPSF2 | CPSF2 | 4976 | 0.072 | 0.49 | YES |
| 21 | SLBP | SLBP | SLBP | 5016 | 0.071 | 0.51 | YES |
| 22 | NUP85 | NUP85 | NUP85 | 5100 | 0.069 | 0.52 | YES |
| 23 | UPF3B | UPF3B | UPF3B | 5540 | 0.057 | 0.52 | YES |
| 24 | NUP88 | NUP88 | NUP88 | 5604 | 0.056 | 0.53 | YES |
| 25 | NUP214 | NUP214 | NUP214 | 5814 | 0.05 | 0.53 | YES |
| 26 | NUP62 | NUP62 | NUP62 | 6143 | 0.042 | 0.53 | YES |
| 27 | RNPS1 | RNPS1 | RNPS1 | 6324 | 0.038 | 0.53 | YES |
| 28 | EIF4E | EIF4E | EIF4E | 6341 | 0.037 | 0.54 | YES |
| 29 | CDC40 | CDC40 | CDC40 | 6458 | 0.034 | 0.55 | YES |
| 30 | AAAS | AAAS | AAAS | 6464 | 0.034 | 0.56 | YES |
| 31 | RAE1 | RAE1 | RAE1 | 6799 | 0.026 | 0.55 | NO |
| 32 | MAGOH | MAGOH | MAGOH | 6831 | 0.025 | 0.55 | NO |
| 33 | DHX38 | DHX38 | DHX38 | 7094 | 0.02 | 0.54 | NO |
| 34 | NCBP2 | NCBP2 | NCBP2 | 7291 | 0.015 | 0.54 | NO |
| 35 | NXF1 | NXF1 | NXF1 | 7371 | 0.013 | 0.54 | NO |
| 36 | THOC4 | THOC4 | THOC4 | 7460 | 0.011 | 0.53 | NO |
| 37 | RANBP2 | RANBP2 | RANBP2 | 7636 | 0.0071 | 0.53 | NO |
| 38 | NUP133 | NUP133 | NUP133 | 7789 | 0.0036 | 0.52 | NO |
| 39 | U2AF1 | U2AF1 | U2AF1 | 8030 | -0.0015 | 0.51 | NO |
| 40 | NUP93 | NUP93 | NUP93 | 8348 | -0.0087 | 0.49 | NO |
| 41 | NUP43 | NUP43 | NUP43 | 8706 | -0.017 | 0.48 | NO |
| 42 | RBM8A | RBM8A | RBM8A | 9175 | -0.028 | 0.46 | NO |
| 43 | CPSF1 | CPSF1 | CPSF1 | 9309 | -0.031 | 0.46 | NO |
| 44 | CPSF3 | CPSF3 | CPSF3 | 9918 | -0.045 | 0.44 | NO |
Figure S47. Get High-res Image This plot shows mRNAseq_cNMF expression data heatmap (on the left) a RunningEnrichmentScore(RES) plot (on the top right) and a Signal2Noise(S2N) plot (on the bottom right) of genes in the pathway: PID ATM PATHWAY.
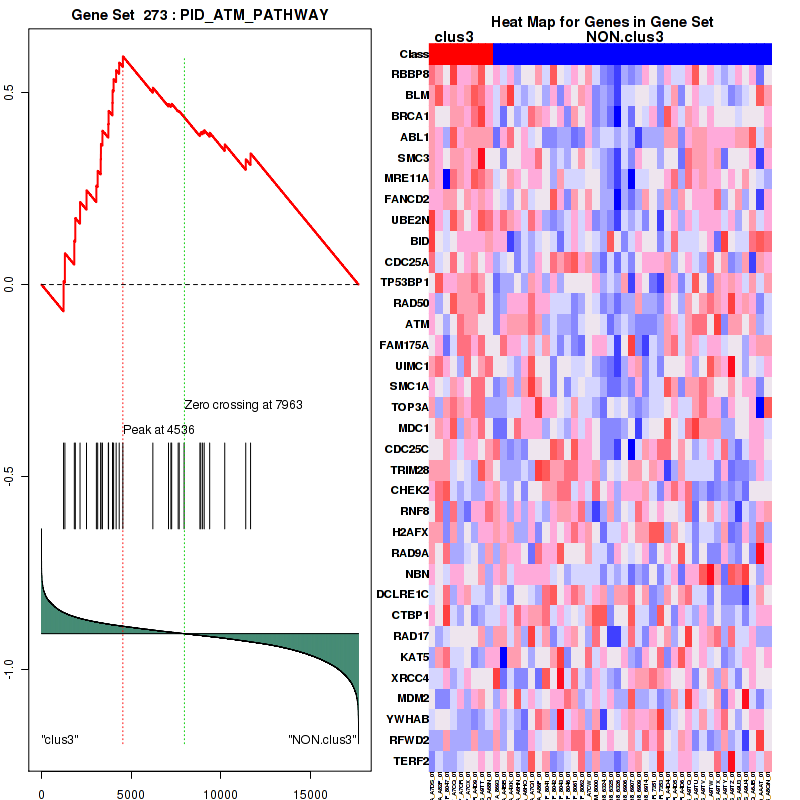
Figure S48. Get High-res Image For the top 5 core enriched genes in the pathway: PID ATM PATHWAY, this volcano plot shows how much they are up/down-regulated and significant. The significance was calculated by empirical bayesian fit
Table S25. Get Full Table This table shows a Running Enrichment Score (RES) of each gene in this pathway, that is, the enrichment score at this point in the ranked list of genes. All genes are ranked by Signal-to-Noise (S2N), a measure of similarity as default and are used to obtain ES matrix of all genes. In this way, GSEA tool uses expression pattern of not only overlapped genes but also not-overlapped genes to produce ES matrix.
| Rank | GENE | SYMBOL | DESC | LIST.LOC | S2N | RES | CORE_ENRICHMENT |
|---|---|---|---|---|---|---|---|
| 1 | CEP70 | CEP70 | CEP70 | 388 | 0.38 | 0.026 | YES |
| 2 | PLK4 | PLK4 | PLK4 | 702 | 0.31 | 0.047 | YES |
| 3 | CEP72 | CEP72 | CEP72 | 965 | 0.27 | 0.066 | YES |
| 4 | CEP76 | CEP76 | CEP76 | 1203 | 0.24 | 0.084 | YES |
| 5 | CEP290 | CEP290 | CEP290 | 1464 | 0.22 | 0.096 | YES |
| 6 | CDK2 | CDK2 | CDK2 | 1687 | 0.2 | 0.11 | YES |
| 7 | CENPJ | CENPJ | CENPJ | 1690 | 0.2 | 0.14 | YES |
| 8 | TUBGCP5 | TUBGCP5 | TUBGCP5 | 1745 | 0.2 | 0.16 | YES |
| 9 | NEDD1 | NEDD1 | NEDD1 | 1770 | 0.2 | 0.18 | YES |
| 10 | TUBGCP3 | TUBGCP3 | TUBGCP3 | 1872 | 0.19 | 0.2 | YES |
| 11 | HAUS2 | HAUS2 | HAUS2 | 2073 | 0.18 | 0.21 | YES |
| 12 | PLK1 | PLK1 | PLK1 | 2076 | 0.18 | 0.23 | YES |
| 13 | CEP164 | CEP164 | CEP164 | 2105 | 0.18 | 0.25 | YES |
| 14 | E2F3 | E2F3 | E2F3 | 2122 | 0.17 | 0.27 | YES |
| 15 | CKAP5 | CKAP5 | CKAP5 | 2181 | 0.17 | 0.29 | YES |
| 16 | FGFR1OP | FGFR1OP | FGFR1OP | 2301 | 0.16 | 0.3 | YES |
| 17 | CEP192 | CEP192 | CEP192 | 2455 | 0.16 | 0.32 | YES |
| 18 | AKAP9 | AKAP9 | AKAP9 | 2664 | 0.15 | 0.32 | YES |
| 19 | NEK2 | NEK2 | NEK2 | 2817 | 0.14 | 0.33 | YES |
| 20 | CCNA2 | CCNA2 | CCNA2 | 2941 | 0.14 | 0.34 | YES |
| 21 | PCNT | PCNT | PCNT | 3071 | 0.13 | 0.35 | YES |
| 22 | CLASP1 | CLASP1 | CLASP1 | 3137 | 0.13 | 0.36 | YES |
| 23 | CDC25A | CDC25A | CDC25A | 3313 | 0.12 | 0.37 | YES |
| 24 | CSNK1E | CSNK1E | CSNK1E | 3319 | 0.12 | 0.38 | YES |
| 25 | TUBGCP6 | TUBGCP6 | TUBGCP6 | 3476 | 0.12 | 0.39 | YES |
| 26 | CCNB2 | CCNB2 | CCNB2 | 3624 | 0.11 | 0.4 | YES |
| 27 | ALMS1 | ALMS1 | ALMS1 | 3948 | 0.1 | 0.39 | YES |
| 28 | WEE1 | WEE1 | WEE1 | 3965 | 0.1 | 0.4 | YES |
| 29 | TUBG1 | TUBG1 | TUBG1 | 4009 | 0.099 | 0.41 | YES |
| 30 | CDK1 | CDK1 | CDK1 | 4363 | 0.088 | 0.4 | YES |
| 31 | YWHAG | YWHAG | YWHAG | 4423 | 0.087 | 0.41 | YES |
| 32 | XPO1 | XPO1 | XPO1 | 4477 | 0.086 | 0.42 | YES |
| 33 | CEP57 | CEP57 | CEP57 | 4507 | 0.085 | 0.43 | YES |
| 34 | CDC25C | CDC25C | CDC25C | 4536 | 0.084 | 0.44 | YES |
| 35 | CCNB1 | CCNB1 | CCNB1 | 4844 | 0.075 | 0.43 | YES |
| 36 | E2F1 | E2F1 | E2F1 | 4874 | 0.075 | 0.44 | YES |
| 37 | TUBG2 | TUBG2 | TUBG2 | 4950 | 0.073 | 0.44 | YES |
| 38 | CEP135 | CEP135 | CEP135 | 5110 | 0.069 | 0.44 | YES |
| 39 | NUMA1 | NUMA1 | NUMA1 | 5241 | 0.065 | 0.44 | YES |
| 40 | PKMYT1 | PKMYT1 | PKMYT1 | 5532 | 0.057 | 0.43 | NO |
| 41 | PRKACA | PRKACA | PRKACA | 5583 | 0.056 | 0.44 | NO |
| 42 | DYNC1I2 | DYNC1I2 | DYNC1I2 | 5793 | 0.051 | 0.43 | NO |
| 43 | CDK5RAP2 | CDK5RAP2 | CDK5RAP2 | 6315 | 0.038 | 0.41 | NO |
| 44 | TUBB | TUBB | TUBB | 6322 | 0.038 | 0.41 | NO |
| 45 | CEP63 | CEP63 | CEP63 | 6325 | 0.038 | 0.42 | NO |
| 46 | PCM1 | PCM1 | PCM1 | 6975 | 0.022 | 0.38 | NO |
| 47 | MAPRE1 | MAPRE1 | MAPRE1 | 7057 | 0.021 | 0.38 | NO |
| 48 | NINL | NINL | NINL | 7347 | 0.014 | 0.36 | NO |
| 49 | DCTN1 | DCTN1 | DCTN1 | 7408 | 0.013 | 0.36 | NO |
| 50 | CEP250 | CEP250 | CEP250 | 7424 | 0.012 | 0.36 | NO |
| 51 | YWHAE | YWHAE | YWHAE | 7585 | 0.0083 | 0.36 | NO |
| 52 | DYNC1H1 | DYNC1H1 | DYNC1H1 | 7589 | 0.0082 | 0.36 | NO |
| 53 | CDK7 | CDK7 | CDK7 | 7633 | 0.0072 | 0.36 | NO |
| 54 | CDC25B | CDC25B | CDC25B | 8007 | -0.00092 | 0.33 | NO |
| 55 | HSP90AA1 | HSP90AA1 | HSP90AA1 | 8014 | -0.0011 | 0.33 | NO |
| 56 | PAFAH1B1 | PAFAH1B1 | PAFAH1B1 | 8831 | -0.02 | 0.29 | NO |
| 57 | CCNH | CCNH | CCNH | 9108 | -0.026 | 0.28 | NO |
| 58 | DCTN2 | DCTN2 | DCTN2 | 9154 | -0.027 | 0.28 | NO |
| 59 | TUBGCP2 | TUBGCP2 | TUBGCP2 | 9425 | -0.033 | 0.27 | NO |
| 60 | CSNK1D | CSNK1D | CSNK1D | 9594 | -0.037 | 0.26 | NO |
| 61 | MNAT1 | MNAT1 | MNAT1 | 9799 | -0.042 | 0.26 | NO |
| 62 | PPP2R1A | PPP2R1A | PPP2R1A | 10291 | -0.055 | 0.24 | NO |
| 63 | ACTR1A | ACTR1A | ACTR1A | 10361 | -0.056 | 0.24 | NO |
| 64 | DYNLL1 | DYNLL1 | DYNLL1 | 11169 | -0.079 | 0.2 | NO |
| 65 | OFD1 | OFD1 | OFD1 | 11329 | -0.083 | 0.2 | NO |
| 66 | AZI1 | AZI1 | AZI1 | 11542 | -0.089 | 0.2 | NO |
| 67 | SSNA1 | SSNA1 | SSNA1 | 11827 | -0.098 | 0.2 | NO |
| 68 | TUBA1A | TUBA1A | TUBA1A | 12345 | -0.11 | 0.18 | NO |
| 69 | CETN2 | CETN2 | CETN2 | 12620 | -0.12 | 0.18 | NO |
| 70 | DCTN3 | DCTN3 | DCTN3 | 12646 | -0.12 | 0.2 | NO |
| 71 | TUBA4A | TUBA4A | TUBA4A | 13422 | -0.16 | 0.17 | NO |
| 72 | PRKAR2B | PRKAR2B | PRKAR2B | 13454 | -0.16 | 0.19 | NO |
| 73 | SDCCAG8 | SDCCAG8 | SDCCAG8 | 13524 | -0.16 | 0.21 | NO |
| 74 | CCNA1 | CCNA1 | CCNA1 | 14502 | -0.21 | 0.18 | NO |
Figure S49. Get High-res Image This plot shows mRNAseq_cNMF expression data heatmap (on the left) a RunningEnrichmentScore(RES) plot (on the top right) and a Signal2Noise(S2N) plot (on the bottom right) of genes in the pathway: PID BARD1PATHWAY.
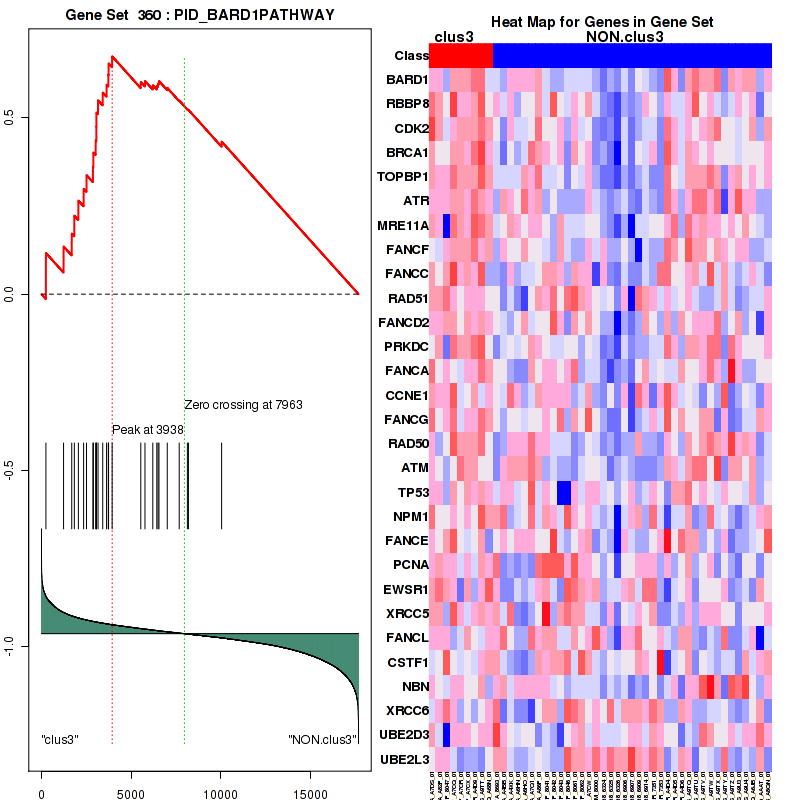
Figure S50. Get High-res Image For the top 5 core enriched genes in the pathway: PID BARD1PATHWAY, this volcano plot shows how much they are up/down-regulated and significant. The significance was calculated by empirical bayesian fit

Table S26. Get Full Table This table shows a Running Enrichment Score (RES) of each gene in this pathway, that is, the enrichment score at this point in the ranked list of genes. All genes are ranked by Signal-to-Noise (S2N), a measure of similarity as default and are used to obtain ES matrix of all genes. In this way, GSEA tool uses expression pattern of not only overlapped genes but also not-overlapped genes to produce ES matrix.
| Rank | GENE | SYMBOL | DESC | LIST.LOC | S2N | RES | CORE_ENRICHMENT |
|---|---|---|---|---|---|---|---|
| 1 | CASC5 | CASC5 | CASC5 | 63 | 0.55 | 0.05 | YES |
| 2 | BUB1B | BUB1B | BUB1B | 519 | 0.35 | 0.058 | YES |
| 3 | INCENP | INCENP | INCENP | 596 | 0.33 | 0.086 | YES |
| 4 | STAG1 | STAG1 | STAG1 | 694 | 0.31 | 0.11 | YES |
| 5 | CENPI | CENPI | CENPI | 737 | 0.3 | 0.14 | YES |
| 6 | SGOL1 | SGOL1 | SGOL1 | 787 | 0.3 | 0.16 | YES |
| 7 | CENPK | CENPK | CENPK | 841 | 0.29 | 0.19 | YES |
| 8 | KIF18A | KIF18A | KIF18A | 959 | 0.27 | 0.21 | YES |
| 9 | KNTC1 | KNTC1 | KNTC1 | 974 | 0.27 | 0.23 | YES |
| 10 | TAOK1 | TAOK1 | TAOK1 | 1073 | 0.26 | 0.25 | YES |
| 11 | ZWINT | ZWINT | ZWINT | 1262 | 0.24 | 0.27 | YES |
| 12 | CENPQ | CENPQ | CENPQ | 1319 | 0.23 | 0.28 | YES |
| 13 | MAD2L1 | MAD2L1 | MAD2L1 | 1533 | 0.21 | 0.29 | YES |
| 14 | ZWILCH | ZWILCH | ZWILCH | 1554 | 0.21 | 0.31 | YES |
| 15 | CDCA8 | CDCA8 | CDCA8 | 1727 | 0.2 | 0.32 | YES |
| 16 | SPC24 | SPC24 | SPC24 | 1778 | 0.2 | 0.34 | YES |
| 17 | SGOL2 | SGOL2 | SGOL2 | 1906 | 0.19 | 0.35 | YES |
| 18 | PPP2R5E | PPP2R5E | PPP2R5E | 1935 | 0.18 | 0.36 | YES |
| 19 | CENPA | CENPA | CENPA | 2058 | 0.18 | 0.38 | YES |
| 20 | CCDC99 | CCDC99 | CCDC99 | 2069 | 0.18 | 0.39 | YES |
| 21 | PLK1 | PLK1 | PLK1 | 2076 | 0.18 | 0.41 | YES |
| 22 | ERCC6L | ERCC6L | ERCC6L | 2102 | 0.18 | 0.42 | YES |
| 23 | SMC3 | SMC3 | SMC3 | 2150 | 0.17 | 0.44 | YES |
| 24 | CKAP5 | CKAP5 | CKAP5 | 2181 | 0.17 | 0.45 | YES |
| 25 | NUF2 | NUF2 | NUF2 | 2208 | 0.17 | 0.47 | YES |
| 26 | SKA1 | SKA1 | SKA1 | 2219 | 0.17 | 0.48 | YES |
| 27 | CENPL | CENPL | CENPL | 2278 | 0.16 | 0.5 | YES |
| 28 | SPC25 | SPC25 | SPC25 | 2328 | 0.16 | 0.51 | YES |
| 29 | AHCTF1 | AHCTF1 | AHCTF1 | 2494 | 0.15 | 0.52 | YES |
| 30 | NUP107 | NUP107 | NUP107 | 2585 | 0.15 | 0.52 | YES |
| 31 | CLIP1 | CLIP1 | CLIP1 | 2797 | 0.14 | 0.53 | YES |
| 32 | CENPO | CENPO | CENPO | 2882 | 0.14 | 0.54 | YES |
| 33 | CENPC1 | CENPC1 | CENPC1 | 3040 | 0.13 | 0.54 | YES |
| 34 | CLASP1 | CLASP1 | CLASP1 | 3137 | 0.13 | 0.55 | YES |
| 35 | ZW10 | ZW10 | ZW10 | 3232 | 0.12 | 0.55 | YES |
| 36 | BUB3 | BUB3 | BUB3 | 3239 | 0.12 | 0.56 | YES |
| 37 | PPP2R1B | PPP2R1B | PPP2R1B | 3425 | 0.12 | 0.56 | YES |
| 38 | KIF2A | KIF2A | KIF2A | 3582 | 0.11 | 0.57 | YES |
| 39 | SEH1L | SEH1L | SEH1L | 3638 | 0.11 | 0.57 | YES |
| 40 | SMC1A | SMC1A | SMC1A | 4019 | 0.098 | 0.56 | YES |
| 41 | NUP37 | NUP37 | NUP37 | 4051 | 0.098 | 0.57 | YES |
| 42 | KIF2C | KIF2C | KIF2C | 4151 | 0.095 | 0.57 | YES |
| 43 | BUB1 | BUB1 | BUB1 | 4178 | 0.094 | 0.58 | YES |
| 44 | XPO1 | XPO1 | XPO1 | 4477 | 0.086 | 0.57 | YES |
| 45 | APITD1 | APITD1 | APITD1 | 4541 | 0.084 | 0.58 | YES |
| 46 | NSL1 | NSL1 | NSL1 | 4582 | 0.083 | 0.58 | YES |
| 47 | PPP2R5B | PPP2R5B | PPP2R5B | 4603 | 0.082 | 0.59 | YES |
| 48 | NDC80 | NDC80 | NDC80 | 4787 | 0.077 | 0.59 | NO |
| 49 | CENPN | CENPN | CENPN | 4944 | 0.073 | 0.59 | NO |
| 50 | NUP85 | NUP85 | NUP85 | 5100 | 0.069 | 0.58 | NO |
| 51 | STAG2 | STAG2 | STAG2 | 5210 | 0.066 | 0.58 | NO |
| 52 | RAD21 | RAD21 | RAD21 | 5516 | 0.058 | 0.57 | NO |
| 53 | PPP2R5D | PPP2R5D | PPP2R5D | 5741 | 0.052 | 0.56 | NO |
| 54 | CDC20 | CDC20 | CDC20 | 5777 | 0.051 | 0.57 | NO |
| 55 | MIS12 | MIS12 | MIS12 | 5824 | 0.05 | 0.57 | NO |
| 56 | ITGB3BP | ITGB3BP | ITGB3BP | 5844 | 0.05 | 0.57 | NO |
| 57 | RCC2 | RCC2 | RCC2 | 5921 | 0.048 | 0.57 | NO |
| 58 | AURKB | AURKB | AURKB | 6932 | 0.023 | 0.52 | NO |
| 59 | MAPRE1 | MAPRE1 | MAPRE1 | 7057 | 0.021 | 0.51 | NO |
| 60 | PPP1CC | PPP1CC | PPP1CC | 7181 | 0.018 | 0.51 | NO |
| 61 | PPP2R5A | PPP2R5A | PPP2R5A | 7355 | 0.014 | 0.5 | NO |
| 62 | PPP2CB | PPP2CB | PPP2CB | 7426 | 0.012 | 0.5 | NO |
| 63 | DSN1 | DSN1 | DSN1 | 7435 | 0.012 | 0.5 | NO |
| 64 | CENPH | CENPH | CENPH | 7542 | 0.0094 | 0.49 | NO |
| 65 | RANBP2 | RANBP2 | RANBP2 | 7636 | 0.0071 | 0.49 | NO |
| 66 | NUP133 | NUP133 | NUP133 | 7789 | 0.0036 | 0.48 | NO |
| 67 | CENPT | CENPT | CENPT | 7929 | 0.00054 | 0.47 | NO |
| 68 | PPP2R5C | PPP2R5C | PPP2R5C | 8016 | -0.0011 | 0.47 | NO |
| 69 | SKA2 | SKA2 | SKA2 | 8169 | -0.0043 | 0.46 | NO |
| 70 | BIRC5 | BIRC5 | BIRC5 | 8327 | -0.0082 | 0.45 | NO |
| 71 | PPP2CA | PPP2CA | PPP2CA | 8600 | -0.014 | 0.44 | NO |
| 72 | NDEL1 | NDEL1 | NDEL1 | 8702 | -0.017 | 0.43 | NO |
| 73 | NUP43 | NUP43 | NUP43 | 8706 | -0.017 | 0.43 | NO |
| 74 | PAFAH1B1 | PAFAH1B1 | PAFAH1B1 | 8831 | -0.02 | 0.43 | NO |
| 75 | SEC13 | SEC13 | SEC13 | 8894 | -0.021 | 0.43 | NO |
| 76 | MLF1IP | MLF1IP | MLF1IP | 8915 | -0.021 | 0.43 | NO |
| 77 | PMF1 | PMF1 | PMF1 | 9272 | -0.03 | 0.41 | NO |
| 78 | CENPP | CENPP | CENPP | 9381 | -0.033 | 0.41 | NO |
| 79 | RANGAP1 | RANGAP1 | RANGAP1 | 9833 | -0.043 | 0.39 | NO |
| 80 | NUDC | NUDC | NUDC | 10185 | -0.051 | 0.37 | NO |
| 81 | PPP2R1A | PPP2R1A | PPP2R1A | 10291 | -0.055 | 0.37 | NO |
| 82 | CENPM | CENPM | CENPM | 10468 | -0.059 | 0.37 | NO |
| 83 | RPS27 | RPS27 | RPS27 | 12095 | -0.11 | 0.28 | NO |
| 84 | B9D2 | B9D2 | B9D2 | 13158 | -0.14 | 0.24 | NO |
| 85 | MAD1L1 | MAD1L1 | MAD1L1 | 14137 | -0.19 | 0.2 | NO |
Figure S51. Get High-res Image This plot shows mRNAseq_cNMF expression data heatmap (on the left) a RunningEnrichmentScore(RES) plot (on the top right) and a Signal2Noise(S2N) plot (on the bottom right) of genes in the pathway: REACTOME METABOLISM OF NON CODING RNA.
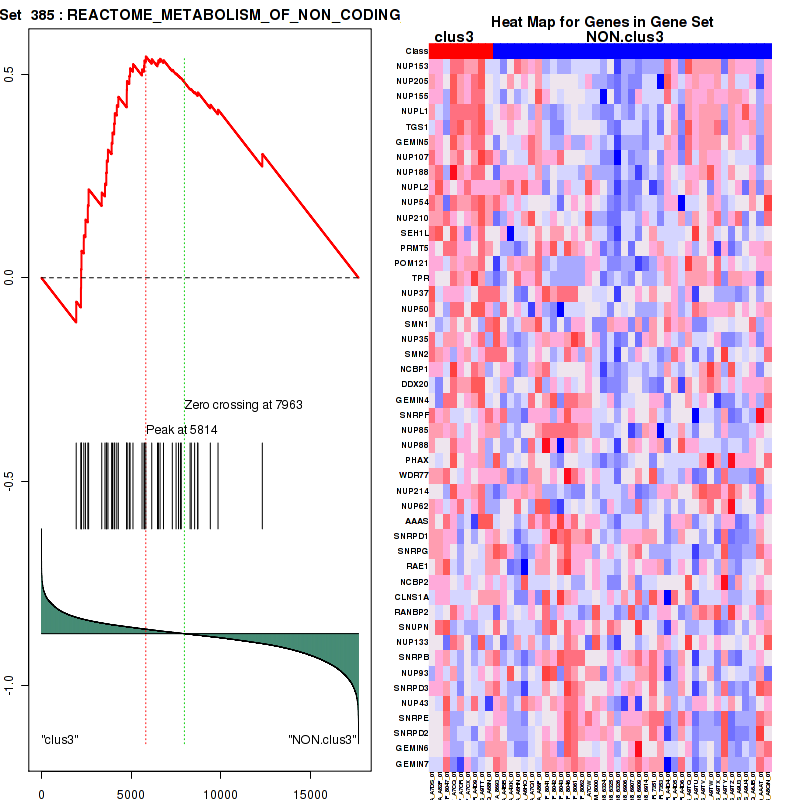
Figure S52. Get High-res Image For the top 5 core enriched genes in the pathway: REACTOME METABOLISM OF NON CODING RNA, this volcano plot shows how much they are up/down-regulated and significant. The significance was calculated by empirical bayesian fit

Table S27. Get Full Table This table shows a Running Enrichment Score (RES) of each gene in this pathway, that is, the enrichment score at this point in the ranked list of genes. All genes are ranked by Signal-to-Noise (S2N), a measure of similarity as default and are used to obtain ES matrix of all genes. In this way, GSEA tool uses expression pattern of not only overlapped genes but also not-overlapped genes to produce ES matrix.
| Rank | GENE | SYMBOL | DESC | LIST.LOC | S2N | RES | CORE_ENRICHMENT |
|---|---|---|---|---|---|---|---|
| 1 | NGEF | NGEF | NGEF | 377 | 0.38 | 0.1 | YES |
| 2 | DNMBP | DNMBP | DNMBP | 578 | 0.33 | 0.2 | YES |
| 3 | DOCK10 | DOCK10 | DOCK10 | 599 | 0.33 | 0.31 | YES |
| 4 | BCAR3 | BCAR3 | BCAR3 | 1317 | 0.23 | 0.35 | YES |
| 5 | SPATA13 | SPATA13 | SPATA13 | 1355 | 0.23 | 0.42 | YES |
| 6 | APC | APC | APC | 1982 | 0.18 | 0.44 | YES |
| 7 | VAV3 | VAV3 | VAV3 | 2114 | 0.17 | 0.49 | YES |
| 8 | ARHGAP17 | ARHGAP17 | ARHGAP17 | 2192 | 0.17 | 0.55 | YES |
| 9 | ITSN1 | ITSN1 | ITSN1 | 2280 | 0.16 | 0.6 | YES |
| 10 | RACGAP1 | RACGAP1 | RACGAP1 | 2637 | 0.15 | 0.62 | YES |
| 11 | MCF2 | MCF2 | MCF2 | 2795 | 0.14 | 0.66 | YES |
| 12 | RALBP1 | RALBP1 | RALBP1 | 4149 | 0.095 | 0.62 | NO |
| 13 | ARHGEF7 | ARHGEF7 | ARHGEF7 | 4907 | 0.074 | 0.6 | NO |
| 14 | ITSN2 | ITSN2 | ITSN2 | 5610 | 0.056 | 0.58 | NO |
| 15 | NME1 | NME1 | NME1 | 5756 | 0.052 | 0.58 | NO |
| 16 | MCF2L | MCF2L | MCF2L | 5893 | 0.049 | 0.59 | NO |
| 17 | ARHGEF6 | ARHGEF6 | ARHGEF6 | 6432 | 0.035 | 0.57 | NO |
| 18 | FARP2 | FARP2 | FARP2 | 7216 | 0.017 | 0.54 | NO |
| 19 | ARHGAP1 | ARHGAP1 | ARHGAP1 | 7308 | 0.015 | 0.54 | NO |
| 20 | ARHGDIA | ARHGDIA | ARHGDIA | 7756 | 0.0044 | 0.51 | NO |
| 21 | FGD1 | FGD1 | FGD1 | 7814 | 0.003 | 0.51 | NO |
| 22 | DOCK11 | DOCK11 | DOCK11 | 7933 | 0.00043 | 0.5 | NO |
| 23 | DOCK9 | DOCK9 | DOCK9 | 7982 | -0.00033 | 0.5 | NO |
| 24 | ARHGEF9 | ARHGEF9 | ARHGEF9 | 8424 | -0.011 | 0.48 | NO |
| 25 | CDC42 | CDC42 | CDC42 | 8646 | -0.015 | 0.47 | NO |
| 26 | GIT1 | GIT1 | GIT1 | 8867 | -0.02 | 0.46 | NO |
| 27 | VAV2 | VAV2 | VAV2 | 8884 | -0.021 | 0.47 | NO |
| 28 | PLCG1 | PLCG1 | PLCG1 | 9692 | -0.04 | 0.44 | NO |
| 29 | DOCK6 | DOCK6 | DOCK6 | 9842 | -0.043 | 0.44 | NO |
Figure S53. Get High-res Image This plot shows mRNAseq_cNMF expression data heatmap (on the left) a RunningEnrichmentScore(RES) plot (on the top right) and a Signal2Noise(S2N) plot (on the bottom right) of genes in the pathway: REACTOME TRANSPORT OF MATURE TRANSCRIPT TO CYTOPLASM.
Figure S54. Get High-res Image For the top 5 core enriched genes in the pathway: REACTOME TRANSPORT OF MATURE TRANSCRIPT TO CYTOPLASM, this volcano plot shows how much they are up/down-regulated and significant. The significance was calculated by empirical bayesian fit

Table S28. Get Full Table This table shows a Running Enrichment Score (RES) of each gene in this pathway, that is, the enrichment score at this point in the ranked list of genes. All genes are ranked by Signal-to-Noise (S2N), a measure of similarity as default and are used to obtain ES matrix of all genes. In this way, GSEA tool uses expression pattern of not only overlapped genes but also not-overlapped genes to produce ES matrix.
| Rank | GENE | SYMBOL | DESC | LIST.LOC | S2N | RES | CORE_ENRICHMENT |
|---|---|---|---|---|---|---|---|
| 1 | CEP70 | CEP70 | CEP70 | 388 | 0.38 | 0.036 | YES |
| 2 | PLK4 | PLK4 | PLK4 | 702 | 0.31 | 0.066 | YES |
| 3 | CEP72 | CEP72 | CEP72 | 965 | 0.27 | 0.093 | YES |
| 4 | CEP76 | CEP76 | CEP76 | 1203 | 0.24 | 0.12 | YES |
| 5 | CEP290 | CEP290 | CEP290 | 1464 | 0.22 | 0.14 | YES |
| 6 | CENPJ | CENPJ | CENPJ | 1690 | 0.2 | 0.15 | YES |
| 7 | TUBGCP5 | TUBGCP5 | TUBGCP5 | 1745 | 0.2 | 0.18 | YES |
| 8 | NEDD1 | NEDD1 | NEDD1 | 1770 | 0.2 | 0.21 | YES |
| 9 | TUBGCP3 | TUBGCP3 | TUBGCP3 | 1872 | 0.19 | 0.23 | YES |
| 10 | HAUS2 | HAUS2 | HAUS2 | 2073 | 0.18 | 0.25 | YES |
| 11 | PLK1 | PLK1 | PLK1 | 2076 | 0.18 | 0.28 | YES |
| 12 | CEP164 | CEP164 | CEP164 | 2105 | 0.18 | 0.3 | YES |
| 13 | CKAP5 | CKAP5 | CKAP5 | 2181 | 0.17 | 0.32 | YES |
| 14 | FGFR1OP | FGFR1OP | FGFR1OP | 2301 | 0.16 | 0.34 | YES |
| 15 | CEP192 | CEP192 | CEP192 | 2455 | 0.16 | 0.36 | YES |
| 16 | AKAP9 | AKAP9 | AKAP9 | 2664 | 0.15 | 0.37 | YES |
| 17 | NEK2 | NEK2 | NEK2 | 2817 | 0.14 | 0.38 | YES |
| 18 | PCNT | PCNT | PCNT | 3071 | 0.13 | 0.39 | YES |
| 19 | CLASP1 | CLASP1 | CLASP1 | 3137 | 0.13 | 0.4 | YES |
| 20 | CSNK1E | CSNK1E | CSNK1E | 3319 | 0.12 | 0.41 | YES |
| 21 | TUBGCP6 | TUBGCP6 | TUBGCP6 | 3476 | 0.12 | 0.42 | YES |
| 22 | ALMS1 | ALMS1 | ALMS1 | 3948 | 0.1 | 0.41 | YES |
| 23 | TUBG1 | TUBG1 | TUBG1 | 4009 | 0.099 | 0.42 | YES |
| 24 | CDK1 | CDK1 | CDK1 | 4363 | 0.088 | 0.42 | YES |
| 25 | YWHAG | YWHAG | YWHAG | 4423 | 0.087 | 0.43 | YES |
| 26 | CEP57 | CEP57 | CEP57 | 4507 | 0.085 | 0.44 | YES |
| 27 | CCNB1 | CCNB1 | CCNB1 | 4844 | 0.075 | 0.43 | YES |
| 28 | TUBG2 | TUBG2 | TUBG2 | 4950 | 0.073 | 0.43 | YES |
| 29 | CEP135 | CEP135 | CEP135 | 5110 | 0.069 | 0.43 | YES |
| 30 | NUMA1 | NUMA1 | NUMA1 | 5241 | 0.065 | 0.44 | YES |
| 31 | PRKACA | PRKACA | PRKACA | 5583 | 0.056 | 0.43 | NO |
| 32 | DYNC1I2 | DYNC1I2 | DYNC1I2 | 5793 | 0.051 | 0.42 | NO |
| 33 | CDK5RAP2 | CDK5RAP2 | CDK5RAP2 | 6315 | 0.038 | 0.4 | NO |
| 34 | TUBB | TUBB | TUBB | 6322 | 0.038 | 0.4 | NO |
| 35 | CEP63 | CEP63 | CEP63 | 6325 | 0.038 | 0.41 | NO |
| 36 | PCM1 | PCM1 | PCM1 | 6975 | 0.022 | 0.38 | NO |
| 37 | MAPRE1 | MAPRE1 | MAPRE1 | 7057 | 0.021 | 0.38 | NO |
| 38 | NINL | NINL | NINL | 7347 | 0.014 | 0.36 | NO |
| 39 | DCTN1 | DCTN1 | DCTN1 | 7408 | 0.013 | 0.36 | NO |
| 40 | CEP250 | CEP250 | CEP250 | 7424 | 0.012 | 0.36 | NO |
| 41 | YWHAE | YWHAE | YWHAE | 7585 | 0.0083 | 0.35 | NO |
| 42 | DYNC1H1 | DYNC1H1 | DYNC1H1 | 7589 | 0.0082 | 0.35 | NO |
| 43 | HSP90AA1 | HSP90AA1 | HSP90AA1 | 8014 | -0.0011 | 0.33 | NO |
| 44 | PAFAH1B1 | PAFAH1B1 | PAFAH1B1 | 8831 | -0.02 | 0.29 | NO |
| 45 | DCTN2 | DCTN2 | DCTN2 | 9154 | -0.027 | 0.27 | NO |
| 46 | TUBGCP2 | TUBGCP2 | TUBGCP2 | 9425 | -0.033 | 0.26 | NO |
| 47 | CSNK1D | CSNK1D | CSNK1D | 9594 | -0.037 | 0.26 | NO |
| 48 | PPP2R1A | PPP2R1A | PPP2R1A | 10291 | -0.055 | 0.23 | NO |
| 49 | ACTR1A | ACTR1A | ACTR1A | 10361 | -0.056 | 0.23 | NO |
| 50 | DYNLL1 | DYNLL1 | DYNLL1 | 11169 | -0.079 | 0.2 | NO |
| 51 | OFD1 | OFD1 | OFD1 | 11329 | -0.083 | 0.2 | NO |
| 52 | AZI1 | AZI1 | AZI1 | 11542 | -0.089 | 0.2 | NO |
| 53 | SSNA1 | SSNA1 | SSNA1 | 11827 | -0.098 | 0.2 | NO |
| 54 | TUBA1A | TUBA1A | TUBA1A | 12345 | -0.11 | 0.19 | NO |
| 55 | CETN2 | CETN2 | CETN2 | 12620 | -0.12 | 0.2 | NO |
| 56 | DCTN3 | DCTN3 | DCTN3 | 12646 | -0.12 | 0.21 | NO |
| 57 | TUBA4A | TUBA4A | TUBA4A | 13422 | -0.16 | 0.19 | NO |
| 58 | PRKAR2B | PRKAR2B | PRKAR2B | 13454 | -0.16 | 0.22 | NO |
| 59 | SDCCAG8 | SDCCAG8 | SDCCAG8 | 13524 | -0.16 | 0.24 | NO |
Figure S55. Get High-res Image This plot shows mRNAseq_cNMF expression data heatmap (on the left) a RunningEnrichmentScore(RES) plot (on the top right) and a Signal2Noise(S2N) plot (on the bottom right) of genes in the pathway: REACTOME RNA POL II TRANSCRIPTION.
Figure S56. Get High-res Image For the top 5 core enriched genes in the pathway: REACTOME RNA POL II TRANSCRIPTION, this volcano plot shows how much they are up/down-regulated and significant. The significance was calculated by empirical bayesian fit

Table S29. Get Full Table This table shows a Running Enrichment Score (RES) of each gene in this pathway, that is, the enrichment score at this point in the ranked list of genes. All genes are ranked by Signal-to-Noise (S2N), a measure of similarity as default and are used to obtain ES matrix of all genes. In this way, GSEA tool uses expression pattern of not only overlapped genes but also not-overlapped genes to produce ES matrix.
| Rank | GENE | SYMBOL | DESC | LIST.LOC | S2N | RES | CORE_ENRICHMENT |
|---|---|---|---|---|---|---|---|
| 1 | CASC5 | CASC5 | CASC5 | 63 | 0.55 | 0.013 | YES |
| 2 | DNA2 | DNA2 | DNA2 | 132 | 0.48 | 0.024 | YES |
| 3 | RBL1 | RBL1 | RBL1 | 168 | 0.46 | 0.036 | YES |
| 4 | CEP70 | CEP70 | CEP70 | 388 | 0.38 | 0.034 | YES |
| 5 | RB1 | RB1 | RB1 | 439 | 0.36 | 0.042 | YES |
| 6 | BUB1B | BUB1B | BUB1B | 519 | 0.35 | 0.048 | YES |
| 7 | INCENP | INCENP | INCENP | 596 | 0.33 | 0.054 | YES |
| 8 | STAG1 | STAG1 | STAG1 | 694 | 0.31 | 0.058 | YES |
| 9 | PLK4 | PLK4 | PLK4 | 702 | 0.31 | 0.067 | YES |
| 10 | MCM8 | MCM8 | MCM8 | 709 | 0.31 | 0.076 | YES |
| 11 | CENPI | CENPI | CENPI | 737 | 0.3 | 0.083 | YES |
| 12 | SGOL1 | SGOL1 | SGOL1 | 787 | 0.3 | 0.089 | YES |
| 13 | POLE2 | POLE2 | POLE2 | 793 | 0.3 | 0.098 | YES |
| 14 | CENPK | CENPK | CENPK | 841 | 0.29 | 0.1 | YES |
| 15 | MCM10 | MCM10 | MCM10 | 863 | 0.28 | 0.11 | YES |
| 16 | CCND2 | CCND2 | CCND2 | 873 | 0.28 | 0.12 | YES |
| 17 | ANAPC1 | ANAPC1 | ANAPC1 | 912 | 0.28 | 0.12 | YES |
| 18 | KIF18A | KIF18A | KIF18A | 959 | 0.27 | 0.13 | YES |
| 19 | CEP72 | CEP72 | CEP72 | 965 | 0.27 | 0.14 | YES |
| 20 | KNTC1 | KNTC1 | KNTC1 | 974 | 0.27 | 0.15 | YES |
| 21 | KIF23 | KIF23 | KIF23 | 1032 | 0.26 | 0.15 | YES |
| 22 | LIN52 | LIN52 | LIN52 | 1039 | 0.26 | 0.16 | YES |
| 23 | TAOK1 | TAOK1 | TAOK1 | 1073 | 0.26 | 0.16 | YES |
| 24 | RPA4 | RPA4 | RPA4 | 1076 | 0.26 | 0.17 | YES |
| 25 | CEP76 | CEP76 | CEP76 | 1203 | 0.24 | 0.17 | YES |
| 26 | ZWINT | ZWINT | ZWINT | 1262 | 0.24 | 0.18 | YES |
| 27 | GINS4 | GINS4 | GINS4 | 1295 | 0.23 | 0.18 | YES |
| 28 | CENPQ | CENPQ | CENPQ | 1319 | 0.23 | 0.19 | YES |
| 29 | KIF20A | KIF20A | KIF20A | 1357 | 0.23 | 0.19 | YES |
| 30 | PSMD5 | PSMD5 | PSMD5 | 1416 | 0.22 | 0.2 | YES |
| 31 | CEP290 | CEP290 | CEP290 | 1464 | 0.22 | 0.2 | YES |
| 32 | E2F5 | E2F5 | E2F5 | 1473 | 0.22 | 0.2 | YES |
| 33 | MYC | MYC | MYC | 1529 | 0.21 | 0.21 | YES |
| 34 | MAD2L1 | MAD2L1 | MAD2L1 | 1533 | 0.21 | 0.21 | YES |
| 35 | MCM4 | MCM4 | MCM4 | 1546 | 0.21 | 0.22 | YES |
| 36 | ZWILCH | ZWILCH | ZWILCH | 1554 | 0.21 | 0.23 | YES |
| 37 | SKP2 | SKP2 | SKP2 | 1633 | 0.2 | 0.23 | YES |
| 38 | RFC3 | RFC3 | RFC3 | 1682 | 0.2 | 0.23 | YES |
| 39 | CDK2 | CDK2 | CDK2 | 1687 | 0.2 | 0.24 | YES |
| 40 | CENPJ | CENPJ | CENPJ | 1690 | 0.2 | 0.24 | YES |
| 41 | CDC6 | CDC6 | CDC6 | 1691 | 0.2 | 0.25 | YES |
| 42 | LIN9 | LIN9 | LIN9 | 1711 | 0.2 | 0.25 | YES |
| 43 | CDCA8 | CDCA8 | CDCA8 | 1727 | 0.2 | 0.26 | YES |
| 44 | TUBGCP5 | TUBGCP5 | TUBGCP5 | 1745 | 0.2 | 0.26 | YES |
| 45 | NEDD1 | NEDD1 | NEDD1 | 1770 | 0.2 | 0.27 | YES |
| 46 | SPC24 | SPC24 | SPC24 | 1778 | 0.2 | 0.27 | YES |
| 47 | CDC7 | CDC7 | CDC7 | 1825 | 0.19 | 0.28 | YES |
| 48 | TFDP1 | TFDP1 | TFDP1 | 1863 | 0.19 | 0.28 | YES |
| 49 | TUBGCP3 | TUBGCP3 | TUBGCP3 | 1872 | 0.19 | 0.28 | YES |
| 50 | CCNE2 | CCNE2 | CCNE2 | 1876 | 0.19 | 0.29 | YES |
| 51 | SGOL2 | SGOL2 | SGOL2 | 1906 | 0.19 | 0.3 | YES |
| 52 | PPP2R5E | PPP2R5E | PPP2R5E | 1935 | 0.18 | 0.3 | YES |
| 53 | CENPA | CENPA | CENPA | 2058 | 0.18 | 0.3 | YES |
| 54 | CCDC99 | CCDC99 | CCDC99 | 2069 | 0.18 | 0.3 | YES |
| 55 | HAUS2 | HAUS2 | HAUS2 | 2073 | 0.18 | 0.31 | YES |
| 56 | PLK1 | PLK1 | PLK1 | 2076 | 0.18 | 0.31 | YES |
| 57 | ERCC6L | ERCC6L | ERCC6L | 2102 | 0.18 | 0.32 | YES |
| 58 | CEP164 | CEP164 | CEP164 | 2105 | 0.18 | 0.32 | YES |
| 59 | FBXO5 | FBXO5 | FBXO5 | 2115 | 0.17 | 0.33 | YES |
| 60 | E2F3 | E2F3 | E2F3 | 2122 | 0.17 | 0.33 | YES |
| 61 | SMC3 | SMC3 | SMC3 | 2150 | 0.17 | 0.33 | YES |
| 62 | RFC5 | RFC5 | RFC5 | 2155 | 0.17 | 0.34 | YES |
| 63 | POLE | POLE | POLE | 2161 | 0.17 | 0.34 | YES |
| 64 | CKAP5 | CKAP5 | CKAP5 | 2181 | 0.17 | 0.35 | YES |
| 65 | GINS1 | GINS1 | GINS1 | 2206 | 0.17 | 0.35 | YES |
| 66 | NUF2 | NUF2 | NUF2 | 2208 | 0.17 | 0.36 | YES |
| 67 | SKA1 | SKA1 | SKA1 | 2219 | 0.17 | 0.36 | YES |
| 68 | CDC45 | CDC45 | CDC45 | 2241 | 0.17 | 0.36 | YES |
| 69 | CENPL | CENPL | CENPL | 2278 | 0.16 | 0.37 | YES |
| 70 | FGFR1OP | FGFR1OP | FGFR1OP | 2301 | 0.16 | 0.37 | YES |
| 71 | SPC25 | SPC25 | SPC25 | 2328 | 0.16 | 0.38 | YES |
| 72 | AURKA | AURKA | AURKA | 2372 | 0.16 | 0.38 | YES |
| 73 | PRIM2 | PRIM2 | PRIM2 | 2385 | 0.16 | 0.38 | YES |
| 74 | POLD3 | POLD3 | POLD3 | 2414 | 0.16 | 0.38 | YES |
| 75 | CEP192 | CEP192 | CEP192 | 2455 | 0.16 | 0.39 | YES |
| 76 | AHCTF1 | AHCTF1 | AHCTF1 | 2494 | 0.15 | 0.39 | YES |
| 77 | NUP107 | NUP107 | NUP107 | 2585 | 0.15 | 0.39 | YES |
| 78 | DHFR | DHFR | DHFR | 2648 | 0.15 | 0.39 | YES |
| 79 | AKAP9 | AKAP9 | AKAP9 | 2664 | 0.15 | 0.39 | YES |
| 80 | POLA1 | POLA1 | POLA1 | 2690 | 0.15 | 0.4 | YES |
| 81 | CDC23 | CDC23 | CDC23 | 2767 | 0.14 | 0.4 | YES |
| 82 | CLIP1 | CLIP1 | CLIP1 | 2797 | 0.14 | 0.4 | YES |
| 83 | LIN54 | LIN54 | LIN54 | 2815 | 0.14 | 0.4 | YES |
| 84 | NEK2 | NEK2 | NEK2 | 2817 | 0.14 | 0.41 | YES |
| 85 | CENPO | CENPO | CENPO | 2882 | 0.14 | 0.41 | YES |
| 86 | CCNA2 | CCNA2 | CCNA2 | 2941 | 0.14 | 0.41 | YES |
| 87 | MYBL2 | MYBL2 | MYBL2 | 3033 | 0.13 | 0.41 | YES |
| 88 | CENPC1 | CENPC1 | CENPC1 | 3040 | 0.13 | 0.41 | YES |
| 89 | PCNT | PCNT | PCNT | 3071 | 0.13 | 0.41 | YES |
| 90 | CLASP1 | CLASP1 | CLASP1 | 3137 | 0.13 | 0.41 | YES |
| 91 | PRIM1 | PRIM1 | PRIM1 | 3231 | 0.12 | 0.41 | YES |
| 92 | ZW10 | ZW10 | ZW10 | 3232 | 0.12 | 0.41 | YES |
| 93 | BUB3 | BUB3 | BUB3 | 3239 | 0.12 | 0.42 | YES |
| 94 | CDC25A | CDC25A | CDC25A | 3313 | 0.12 | 0.42 | YES |
| 95 | CSNK1E | CSNK1E | CSNK1E | 3319 | 0.12 | 0.42 | YES |
| 96 | RRM2 | RRM2 | RRM2 | 3328 | 0.12 | 0.42 | YES |
| 97 | RBBP4 | RBBP4 | RBBP4 | 3339 | 0.12 | 0.43 | YES |
| 98 | TYMS | TYMS | TYMS | 3368 | 0.12 | 0.43 | YES |
| 99 | MCM2 | MCM2 | MCM2 | 3406 | 0.12 | 0.43 | YES |
| 100 | CCNE1 | CCNE1 | CCNE1 | 3414 | 0.12 | 0.43 | YES |
| 101 | PPP2R1B | PPP2R1B | PPP2R1B | 3425 | 0.12 | 0.44 | YES |
| 102 | TUBGCP6 | TUBGCP6 | TUBGCP6 | 3476 | 0.12 | 0.44 | YES |
| 103 | PSMD12 | PSMD12 | PSMD12 | 3497 | 0.12 | 0.44 | YES |
| 104 | RBL2 | RBL2 | RBL2 | 3510 | 0.12 | 0.44 | YES |
| 105 | RPA1 | RPA1 | RPA1 | 3556 | 0.11 | 0.44 | YES |
| 106 | POLD1 | POLD1 | POLD1 | 3566 | 0.11 | 0.44 | YES |
| 107 | KIF2A | KIF2A | KIF2A | 3582 | 0.11 | 0.45 | YES |
| 108 | CCNB2 | CCNB2 | CCNB2 | 3624 | 0.11 | 0.45 | YES |
| 109 | SEH1L | SEH1L | SEH1L | 3638 | 0.11 | 0.45 | YES |
| 110 | PSME4 | PSME4 | PSME4 | 3802 | 0.1 | 0.44 | YES |
| 111 | ALMS1 | ALMS1 | ALMS1 | 3948 | 0.1 | 0.44 | YES |
| 112 | WEE1 | WEE1 | WEE1 | 3965 | 0.1 | 0.44 | YES |
| 113 | TUBG1 | TUBG1 | TUBG1 | 4009 | 0.099 | 0.44 | YES |
| 114 | SMC1A | SMC1A | SMC1A | 4019 | 0.098 | 0.44 | YES |
| 115 | NUP37 | NUP37 | NUP37 | 4051 | 0.098 | 0.45 | YES |
| 116 | KIF2C | KIF2C | KIF2C | 4151 | 0.095 | 0.44 | YES |
| 117 | BUB1 | BUB1 | BUB1 | 4178 | 0.094 | 0.44 | YES |
| 118 | CDC27 | CDC27 | CDC27 | 4294 | 0.09 | 0.44 | YES |
| 119 | CDK1 | CDK1 | CDK1 | 4363 | 0.088 | 0.44 | YES |
| 120 | YWHAG | YWHAG | YWHAG | 4423 | 0.087 | 0.44 | YES |
| 121 | XPO1 | XPO1 | XPO1 | 4477 | 0.086 | 0.44 | YES |
| 122 | CEP57 | CEP57 | CEP57 | 4507 | 0.085 | 0.44 | YES |
| 123 | CDC25C | CDC25C | CDC25C | 4536 | 0.084 | 0.44 | YES |
| 124 | APITD1 | APITD1 | APITD1 | 4541 | 0.084 | 0.44 | YES |
| 125 | MCM6 | MCM6 | MCM6 | 4544 | 0.084 | 0.44 | YES |
| 126 | NSL1 | NSL1 | NSL1 | 4582 | 0.083 | 0.44 | YES |
| 127 | UBE2C | UBE2C | UBE2C | 4594 | 0.082 | 0.45 | YES |
| 128 | PPP2R5B | PPP2R5B | PPP2R5B | 4603 | 0.082 | 0.45 | YES |
| 129 | E2F2 | E2F2 | E2F2 | 4677 | 0.08 | 0.45 | YES |
| 130 | CUL1 | CUL1 | CUL1 | 4750 | 0.078 | 0.44 | YES |
| 131 | NDC80 | NDC80 | NDC80 | 4787 | 0.077 | 0.45 | YES |
| 132 | GMNN | GMNN | GMNN | 4811 | 0.076 | 0.45 | YES |
| 133 | CCNB1 | CCNB1 | CCNB1 | 4844 | 0.075 | 0.45 | YES |
| 134 | PSMD3 | PSMD3 | PSMD3 | 4852 | 0.075 | 0.45 | YES |
| 135 | CDC14A | CDC14A | CDC14A | 4853 | 0.075 | 0.45 | YES |
| 136 | E2F1 | E2F1 | E2F1 | 4874 | 0.075 | 0.45 | YES |
| 137 | CENPN | CENPN | CENPN | 4944 | 0.073 | 0.45 | YES |
| 138 | TUBG2 | TUBG2 | TUBG2 | 4950 | 0.073 | 0.45 | YES |
| 139 | RFC4 | RFC4 | RFC4 | 5056 | 0.07 | 0.45 | NO |
| 140 | LIG1 | LIG1 | LIG1 | 5096 | 0.069 | 0.45 | NO |
| 141 | NUP85 | NUP85 | NUP85 | 5100 | 0.069 | 0.45 | NO |
| 142 | CEP135 | CEP135 | CEP135 | 5110 | 0.069 | 0.45 | NO |
| 143 | MCM3 | MCM3 | MCM3 | 5201 | 0.066 | 0.45 | NO |
| 144 | STAG2 | STAG2 | STAG2 | 5210 | 0.066 | 0.45 | NO |
| 145 | NUMA1 | NUMA1 | NUMA1 | 5241 | 0.065 | 0.45 | NO |
| 146 | DBF4 | DBF4 | DBF4 | 5349 | 0.062 | 0.45 | NO |
| 147 | MCM5 | MCM5 | MCM5 | 5483 | 0.059 | 0.44 | NO |
| 148 | RAD21 | RAD21 | RAD21 | 5516 | 0.058 | 0.44 | NO |
| 149 | PKMYT1 | PKMYT1 | PKMYT1 | 5532 | 0.057 | 0.44 | NO |
| 150 | FEN1 | FEN1 | FEN1 | 5563 | 0.057 | 0.44 | NO |
| 151 | PRKACA | PRKACA | PRKACA | 5583 | 0.056 | 0.44 | NO |
| 152 | PSMA8 | PSMA8 | PSMA8 | 5618 | 0.055 | 0.44 | NO |
| 153 | PPP2R5D | PPP2R5D | PPP2R5D | 5741 | 0.052 | 0.44 | NO |
| 154 | CDC20 | CDC20 | CDC20 | 5777 | 0.051 | 0.44 | NO |
| 155 | DYNC1I2 | DYNC1I2 | DYNC1I2 | 5793 | 0.051 | 0.44 | NO |
| 156 | ANAPC10 | ANAPC10 | ANAPC10 | 5810 | 0.05 | 0.44 | NO |
| 157 | MIS12 | MIS12 | MIS12 | 5824 | 0.05 | 0.44 | NO |
| 158 | ITGB3BP | ITGB3BP | ITGB3BP | 5844 | 0.05 | 0.44 | NO |
| 159 | PSMD11 | PSMD11 | PSMD11 | 5889 | 0.049 | 0.44 | NO |
| 160 | RCC2 | RCC2 | RCC2 | 5921 | 0.048 | 0.44 | NO |
| 161 | DYRK1A | DYRK1A | DYRK1A | 6039 | 0.045 | 0.43 | NO |
| 162 | CDK4 | CDK4 | CDK4 | 6052 | 0.045 | 0.43 | NO |
| 163 | PCNA | PCNA | PCNA | 6202 | 0.041 | 0.42 | NO |
| 164 | CDK5RAP2 | CDK5RAP2 | CDK5RAP2 | 6315 | 0.038 | 0.42 | NO |
| 165 | TUBB | TUBB | TUBB | 6322 | 0.038 | 0.42 | NO |
| 166 | CEP63 | CEP63 | CEP63 | 6325 | 0.038 | 0.42 | NO |
| 167 | MCM7 | MCM7 | MCM7 | 6668 | 0.029 | 0.4 | NO |
| 168 | PSMD14 | PSMD14 | PSMD14 | 6682 | 0.029 | 0.4 | NO |
| 169 | ANAPC4 | ANAPC4 | ANAPC4 | 6782 | 0.026 | 0.4 | NO |
| 170 | PSMA1 | PSMA1 | PSMA1 | 6801 | 0.026 | 0.4 | NO |
| 171 | AURKB | AURKB | AURKB | 6932 | 0.023 | 0.39 | NO |
| 172 | PCM1 | PCM1 | PCM1 | 6975 | 0.022 | 0.39 | NO |
| 173 | MAPRE1 | MAPRE1 | MAPRE1 | 7057 | 0.021 | 0.38 | NO |
| 174 | POLA2 | POLA2 | POLA2 | 7093 | 0.02 | 0.38 | NO |
| 175 | CDKN1B | CDKN1B | CDKN1B | 7102 | 0.02 | 0.38 | NO |
| 176 | PPP1CC | PPP1CC | PPP1CC | 7181 | 0.018 | 0.38 | NO |
| 177 | PSMC6 | PSMC6 | PSMC6 | 7218 | 0.017 | 0.38 | NO |
| 178 | PSMA3 | PSMA3 | PSMA3 | 7220 | 0.017 | 0.38 | NO |
| 179 | PSMD2 | PSMD2 | PSMD2 | 7254 | 0.016 | 0.38 | NO |
| 180 | ANAPC5 | ANAPC5 | ANAPC5 | 7266 | 0.016 | 0.38 | NO |
| 181 | CDC16 | CDC16 | CDC16 | 7269 | 0.016 | 0.38 | NO |
| 182 | NINL | NINL | NINL | 7347 | 0.014 | 0.37 | NO |
| 183 | PPP2R5A | PPP2R5A | PPP2R5A | 7355 | 0.014 | 0.37 | NO |
| 184 | PSMB2 | PSMB2 | PSMB2 | 7365 | 0.014 | 0.37 | NO |
| 185 | DCTN1 | DCTN1 | DCTN1 | 7408 | 0.013 | 0.37 | NO |
| 186 | CEP250 | CEP250 | CEP250 | 7424 | 0.012 | 0.37 | NO |
| 187 | PPP2CB | PPP2CB | PPP2CB | 7426 | 0.012 | 0.37 | NO |
| 188 | DSN1 | DSN1 | DSN1 | 7435 | 0.012 | 0.37 | NO |
| 189 | ANAPC7 | ANAPC7 | ANAPC7 | 7526 | 0.0099 | 0.36 | NO |
| 190 | CENPH | CENPH | CENPH | 7542 | 0.0094 | 0.36 | NO |
| 191 | E2F4 | E2F4 | E2F4 | 7543 | 0.0094 | 0.36 | NO |
| 192 | YWHAE | YWHAE | YWHAE | 7585 | 0.0083 | 0.36 | NO |
| 193 | DYNC1H1 | DYNC1H1 | DYNC1H1 | 7589 | 0.0082 | 0.36 | NO |
| 194 | CDK7 | CDK7 | CDK7 | 7633 | 0.0072 | 0.36 | NO |
| 195 | RANBP2 | RANBP2 | RANBP2 | 7636 | 0.0071 | 0.36 | NO |
| 196 | CKS1B | CKS1B | CKS1B | 7642 | 0.0068 | 0.36 | NO |
| 197 | NUP133 | NUP133 | NUP133 | 7789 | 0.0036 | 0.35 | NO |
| 198 | UBE2D1 | UBE2D1 | UBE2D1 | 7800 | 0.0034 | 0.35 | NO |
| 199 | BTRC | BTRC | BTRC | 7821 | 0.0029 | 0.35 | NO |
| 200 | PPP2R2A | PPP2R2A | PPP2R2A | 7902 | 0.001 | 0.35 | NO |
| 201 | CENPT | CENPT | CENPT | 7929 | 0.00054 | 0.34 | NO |
| 202 | MAX | MAX | MAX | 7954 | 0.0001 | 0.34 | NO |
| 203 | POLD2 | POLD2 | POLD2 | 7999 | -0.00077 | 0.34 | NO |
| 204 | PSMF1 | PSMF1 | PSMF1 | 8006 | -0.0009 | 0.34 | NO |
| 205 | CDC25B | CDC25B | CDC25B | 8007 | -0.00092 | 0.34 | NO |
| 206 | HSP90AA1 | HSP90AA1 | HSP90AA1 | 8014 | -0.0011 | 0.34 | NO |
| 207 | PPP2R5C | PPP2R5C | PPP2R5C | 8016 | -0.0011 | 0.34 | NO |
| 208 | PSMD1 | PSMD1 | PSMD1 | 8043 | -0.0018 | 0.34 | NO |
| 209 | PSMA4 | PSMA4 | PSMA4 | 8137 | -0.0036 | 0.33 | NO |
| 210 | SKA2 | SKA2 | SKA2 | 8169 | -0.0043 | 0.33 | NO |
| 211 | BIRC5 | BIRC5 | BIRC5 | 8327 | -0.0082 | 0.32 | NO |
| 212 | GINS2 | GINS2 | GINS2 | 8428 | -0.011 | 0.32 | NO |
| 213 | PSMD6 | PSMD6 | PSMD6 | 8462 | -0.012 | 0.32 | NO |
| 214 | PSMC4 | PSMC4 | PSMC4 | 8531 | -0.013 | 0.31 | NO |
| 215 | GORASP1 | GORASP1 | GORASP1 | 8594 | -0.014 | 0.31 | NO |
| 216 | PPP2CA | PPP2CA | PPP2CA | 8600 | -0.014 | 0.31 | NO |
| 217 | NDEL1 | NDEL1 | NDEL1 | 8702 | -0.017 | 0.3 | NO |
| 218 | NUP43 | NUP43 | NUP43 | 8706 | -0.017 | 0.3 | NO |
| 219 | ANAPC2 | ANAPC2 | ANAPC2 | 8781 | -0.018 | 0.3 | NO |
| 220 | PAFAH1B1 | PAFAH1B1 | PAFAH1B1 | 8831 | -0.02 | 0.3 | NO |
| 221 | SEC13 | SEC13 | SEC13 | 8894 | -0.021 | 0.3 | NO |
| 222 | MLF1IP | MLF1IP | MLF1IP | 8915 | -0.021 | 0.3 | NO |
| 223 | CCNH | CCNH | CCNH | 9108 | -0.026 | 0.28 | NO |
| 224 | PSME1 | PSME1 | PSME1 | 9126 | -0.026 | 0.28 | NO |
| 225 | DCTN2 | DCTN2 | DCTN2 | 9154 | -0.027 | 0.28 | NO |
| 226 | RPA2 | RPA2 | RPA2 | 9157 | -0.027 | 0.28 | NO |
| 227 | PSMD8 | PSMD8 | PSMD8 | 9204 | -0.029 | 0.28 | NO |
| 228 | PSMD10 | PSMD10 | PSMD10 | 9241 | -0.03 | 0.28 | NO |
| 229 | PMF1 | PMF1 | PMF1 | 9272 | -0.03 | 0.28 | NO |
| 230 | PSMA6 | PSMA6 | PSMA6 | 9361 | -0.032 | 0.28 | NO |
| 231 | CENPP | CENPP | CENPP | 9381 | -0.033 | 0.28 | NO |
| 232 | TUBGCP2 | TUBGCP2 | TUBGCP2 | 9425 | -0.033 | 0.28 | NO |
| 233 | PSMC3 | PSMC3 | PSMC3 | 9428 | -0.034 | 0.28 | NO |
| 234 | CDK6 | CDK6 | CDK6 | 9455 | -0.034 | 0.28 | NO |
| 235 | CDKN2D | CDKN2D | CDKN2D | 9468 | -0.034 | 0.28 | NO |
| 236 | PSMC2 | PSMC2 | PSMC2 | 9475 | -0.035 | 0.28 | NO |
| 237 | PSMA5 | PSMA5 | PSMA5 | 9483 | -0.035 | 0.28 | NO |
| 238 | CDT1 | CDT1 | CDT1 | 9511 | -0.035 | 0.28 | NO |
| 239 | CSNK1D | CSNK1D | CSNK1D | 9594 | -0.037 | 0.27 | NO |
| 240 | MNAT1 | MNAT1 | MNAT1 | 9799 | -0.042 | 0.26 | NO |
| 241 | RANGAP1 | RANGAP1 | RANGAP1 | 9833 | -0.043 | 0.26 | NO |
| 242 | HDAC1 | HDAC1 | HDAC1 | 9937 | -0.046 | 0.26 | NO |
| 243 | CDKN2C | CDKN2C | CDKN2C | 10106 | -0.049 | 0.25 | NO |
| 244 | NUDC | NUDC | NUDC | 10185 | -0.051 | 0.25 | NO |
| 245 | CDC26 | CDC26 | CDC26 | 10237 | -0.053 | 0.24 | NO |
| 246 | PSMA2 | PSMA2 | PSMA2 | 10281 | -0.054 | 0.24 | NO |
| 247 | PPP2R1A | PPP2R1A | PPP2R1A | 10291 | -0.055 | 0.25 | NO |
| 248 | PSMB7 | PSMB7 | PSMB7 | 10348 | -0.056 | 0.24 | NO |
| 249 | ACTR1A | ACTR1A | ACTR1A | 10361 | -0.056 | 0.24 | NO |
| 250 | PSME2 | PSME2 | PSME2 | 10395 | -0.057 | 0.24 | NO |
| 251 | PSMD7 | PSMD7 | PSMD7 | 10401 | -0.058 | 0.25 | NO |
| 252 | CENPM | CENPM | CENPM | 10468 | -0.059 | 0.24 | NO |
| 253 | PSMD13 | PSMD13 | PSMD13 | 10524 | -0.061 | 0.24 | NO |
| 254 | PSMC5 | PSMC5 | PSMC5 | 10640 | -0.064 | 0.24 | NO |
| 255 | PSMB4 | PSMB4 | PSMB4 | 10654 | -0.064 | 0.24 | NO |
| 256 | PSMB8 | PSMB8 | PSMB8 | 10880 | -0.071 | 0.23 | NO |
| 257 | PSMA7 | PSMA7 | PSMA7 | 11165 | -0.079 | 0.22 | NO |
| 258 | DYNLL1 | DYNLL1 | DYNLL1 | 11169 | -0.079 | 0.22 | NO |
| 259 | RFC2 | RFC2 | RFC2 | 11284 | -0.082 | 0.21 | NO |
| 260 | PSMB5 | PSMB5 | PSMB5 | 11287 | -0.082 | 0.22 | NO |
| 261 | OFD1 | OFD1 | OFD1 | 11329 | -0.083 | 0.22 | NO |
| 262 | PPP2R3B | PPP2R3B | PPP2R3B | 11364 | -0.084 | 0.22 | NO |
| 263 | SKP1 | SKP1 | SKP1 | 11367 | -0.084 | 0.22 | NO |
| 264 | UBE2E1 | UBE2E1 | UBE2E1 | 11491 | -0.088 | 0.21 | NO |
| 265 | PSMD9 | PSMD9 | PSMD9 | 11539 | -0.089 | 0.21 | NO |
| 266 | AZI1 | AZI1 | AZI1 | 11542 | -0.089 | 0.22 | NO |
| 267 | RPS27A | RPS27A | RPS27A | 11679 | -0.093 | 0.21 | NO |
| 268 | RPA3 | RPA3 | RPA3 | 11772 | -0.096 | 0.21 | NO |
| 269 | SSNA1 | SSNA1 | SSNA1 | 11827 | -0.098 | 0.21 | NO |
| 270 | PSMD4 | PSMD4 | PSMD4 | 11940 | -0.1 | 0.2 | NO |
| 271 | PSMB6 | PSMB6 | PSMB6 | 11991 | -0.1 | 0.2 | NO |
| 272 | PSMB3 | PSMB3 | PSMB3 | 12094 | -0.11 | 0.2 | NO |
| 273 | RPS27 | RPS27 | RPS27 | 12095 | -0.11 | 0.21 | NO |
| 274 | UBA52 | UBA52 | UBA52 | 12149 | -0.11 | 0.21 | NO |
| 275 | PSMB10 | PSMB10 | PSMB10 | 12233 | -0.11 | 0.2 | NO |
| 276 | TUBA1A | TUBA1A | TUBA1A | 12345 | -0.11 | 0.2 | NO |
| 277 | PSMB1 | PSMB1 | PSMB1 | 12434 | -0.12 | 0.2 | NO |
| 278 | CDKN1A | CDKN1A | CDKN1A | 12530 | -0.12 | 0.2 | NO |
| 279 | CETN2 | CETN2 | CETN2 | 12620 | -0.12 | 0.2 | NO |
| 280 | DCTN3 | DCTN3 | DCTN3 | 12646 | -0.12 | 0.2 | NO |
| 281 | CCND1 | CCND1 | CCND1 | 12655 | -0.12 | 0.2 | NO |
| 282 | PSMB9 | PSMB9 | PSMB9 | 13034 | -0.14 | 0.18 | NO |
| 283 | PTTG1 | PTTG1 | PTTG1 | 13057 | -0.14 | 0.19 | NO |
| 284 | B9D2 | B9D2 | B9D2 | 13158 | -0.14 | 0.19 | NO |
| 285 | PSMC1 | PSMC1 | PSMC1 | 13176 | -0.14 | 0.19 | NO |
| 286 | CCND3 | CCND3 | CCND3 | 13276 | -0.15 | 0.19 | NO |
| 287 | CDKN2B | CDKN2B | CDKN2B | 13326 | -0.15 | 0.19 | NO |
| 288 | ANAPC11 | ANAPC11 | ANAPC11 | 13403 | -0.15 | 0.19 | NO |
| 289 | TUBA4A | TUBA4A | TUBA4A | 13422 | -0.16 | 0.19 | NO |
| 290 | PRKAR2B | PRKAR2B | PRKAR2B | 13454 | -0.16 | 0.2 | NO |
| 291 | SDCCAG8 | SDCCAG8 | SDCCAG8 | 13524 | -0.16 | 0.2 | NO |
| 292 | TK2 | TK2 | TK2 | 13681 | -0.17 | 0.19 | NO |
| 293 | LIN37 | LIN37 | LIN37 | 13951 | -0.18 | 0.18 | NO |
| 294 | MAD1L1 | MAD1L1 | MAD1L1 | 14137 | -0.19 | 0.18 | NO |
| 295 | CCNA1 | CCNA1 | CCNA1 | 14502 | -0.21 | 0.16 | NO |
| 296 | POLD4 | POLD4 | POLD4 | 15128 | -0.25 | 0.14 | NO |
| 297 | CDKN2A | CDKN2A | CDKN2A | 16095 | -0.34 | 0.09 | NO |
Figure S57. Get High-res Image This plot shows mRNAseq_cNMF expression data heatmap (on the left) a RunningEnrichmentScore(RES) plot (on the top right) and a Signal2Noise(S2N) plot (on the bottom right) of genes in the pathway: REACTOME CELL CYCLE MITOTIC.
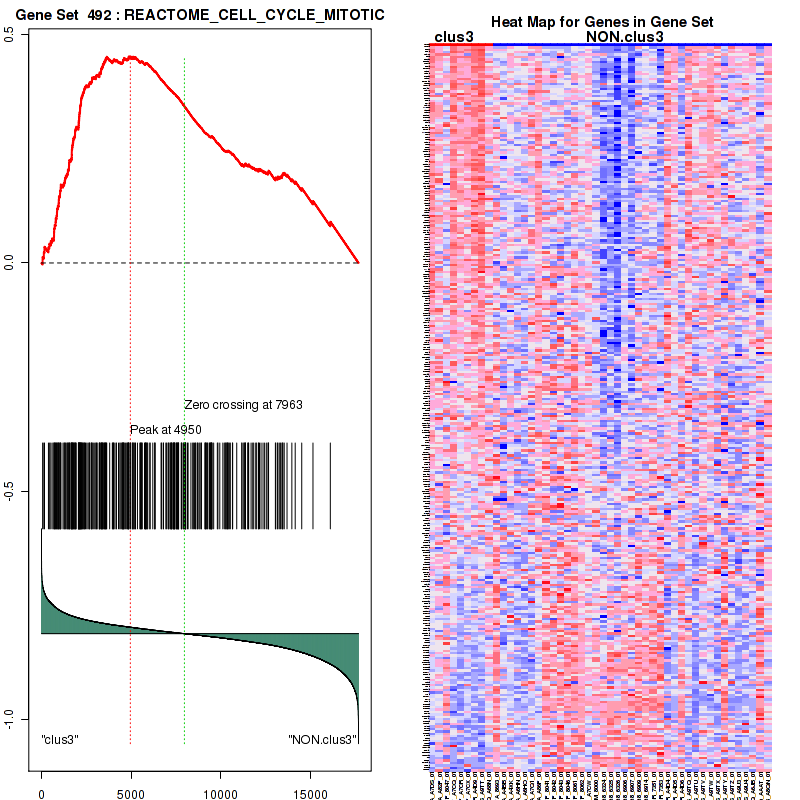
Figure S58. Get High-res Image For the top 5 core enriched genes in the pathway: REACTOME CELL CYCLE MITOTIC, this volcano plot shows how much they are up/down-regulated and significant. The significance was calculated by empirical bayesian fit
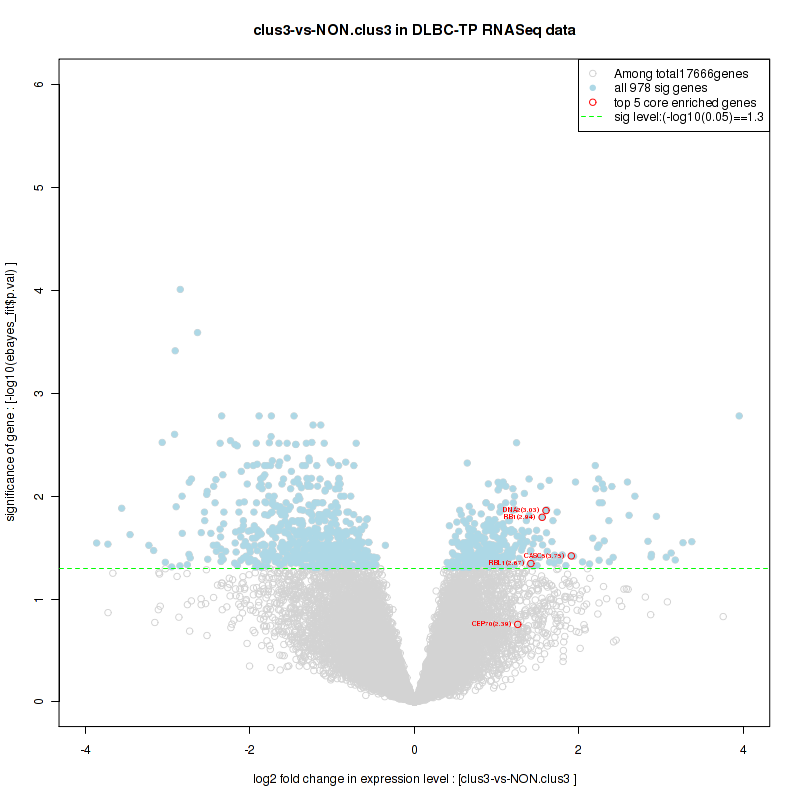
Table S30. Get Full Table This table shows a Running Enrichment Score (RES) of each gene in this pathway, that is, the enrichment score at this point in the ranked list of genes. All genes are ranked by Signal-to-Noise (S2N), a measure of similarity as default and are used to obtain ES matrix of all genes. In this way, GSEA tool uses expression pattern of not only overlapped genes but also not-overlapped genes to produce ES matrix.
| Rank | GENE | SYMBOL | DESC | LIST.LOC | S2N | RES | CORE_ENRICHMENT |
|---|---|---|---|---|---|---|---|
| 1 | BRCA2 | BRCA2 | BRCA2 | 82 | 0.53 | 0.11 | YES |
| 2 | CLSPN | CLSPN | CLSPN | 135 | 0.48 | 0.2 | YES |
| 3 | RFC3 | RFC3 | RFC3 | 1682 | 0.2 | 0.16 | YES |
| 4 | CDK2 | CDK2 | CDK2 | 1687 | 0.2 | 0.2 | YES |
| 5 | CDC6 | CDC6 | CDC6 | 1691 | 0.2 | 0.24 | YES |
| 6 | TOPBP1 | TOPBP1 | TOPBP1 | 2056 | 0.18 | 0.26 | YES |
| 7 | PLK1 | PLK1 | PLK1 | 2076 | 0.18 | 0.29 | YES |
| 8 | TIMELESS | TIMELESS | TIMELESS | 2084 | 0.18 | 0.33 | YES |
| 9 | CEP164 | CEP164 | CEP164 | 2105 | 0.18 | 0.36 | YES |
| 10 | RFC5 | RFC5 | RFC5 | 2155 | 0.17 | 0.4 | YES |
| 11 | ATR | ATR | ATR | 2350 | 0.16 | 0.42 | YES |
| 12 | CHEK1 | CHEK1 | CHEK1 | 2464 | 0.16 | 0.45 | YES |
| 13 | CCNA2 | CCNA2 | CCNA2 | 2941 | 0.14 | 0.45 | YES |
| 14 | RAD51 | RAD51 | RAD51 | 3021 | 0.13 | 0.47 | YES |
| 15 | FANCD2 | FANCD2 | FANCD2 | 3059 | 0.13 | 0.5 | YES |
| 16 | CDC25A | CDC25A | CDC25A | 3313 | 0.12 | 0.51 | YES |
| 17 | MCM2 | MCM2 | MCM2 | 3406 | 0.12 | 0.53 | YES |
| 18 | TIPIN | TIPIN | TIPIN | 3492 | 0.12 | 0.55 | YES |
| 19 | RPA1 | RPA1 | RPA1 | 3556 | 0.11 | 0.57 | YES |
| 20 | CDC25C | CDC25C | CDC25C | 4536 | 0.084 | 0.53 | NO |
| 21 | RAD1 | RAD1 | RAD1 | 4837 | 0.075 | 0.53 | NO |
| 22 | RFC4 | RFC4 | RFC4 | 5056 | 0.07 | 0.53 | NO |
| 23 | FBXW11 | FBXW11 | FBXW11 | 5779 | 0.051 | 0.5 | NO |
| 24 | SMARCAL1 | SMARCAL1 | SMARCAL1 | 5884 | 0.049 | 0.5 | NO |
| 25 | MCM7 | MCM7 | MCM7 | 6668 | 0.029 | 0.47 | NO |
| 26 | HUS1 | HUS1 | HUS1 | 7232 | 0.016 | 0.44 | NO |
| 27 | PPP2R2B | PPP2R2B | PPP2R2B | 7327 | 0.014 | 0.44 | NO |
| 28 | RAD9A | RAD9A | RAD9A | 7617 | 0.0075 | 0.42 | NO |
| 29 | NBN | NBN | NBN | 7675 | 0.0062 | 0.42 | NO |
| 30 | YWHAZ | YWHAZ | YWHAZ | 8205 | -0.0051 | 0.39 | NO |
| 31 | PPP2CA | PPP2CA | PPP2CA | 8600 | -0.014 | 0.37 | NO |
| 32 | RAD17 | RAD17 | RAD17 | 8879 | -0.021 | 0.36 | NO |
| 33 | RPA2 | RPA2 | RPA2 | 9157 | -0.027 | 0.35 | NO |
| 34 | MDM2 | MDM2 | MDM2 | 9372 | -0.032 | 0.34 | NO |
| 35 | YWHAB | YWHAB | YWHAB | 10212 | -0.052 | 0.31 | NO |
| 36 | PPP2R1A | PPP2R1A | PPP2R1A | 10291 | -0.055 | 0.31 | NO |
| 37 | ATRIP | ATRIP | ATRIP | 10471 | -0.059 | 0.32 | NO |
| 38 | RFC2 | RFC2 | RFC2 | 11284 | -0.082 | 0.29 | NO |
| 39 | SSPO | SSPO | SSPO | 16212 | -0.36 | 0.082 | NO |
Figure S59. Get High-res Image This plot shows mRNAseq_cNMF expression data heatmap (on the left) a RunningEnrichmentScore(RES) plot (on the top right) and a Signal2Noise(S2N) plot (on the bottom right) of genes in the pathway: REACTOME RECRUITMENT OF MITOTIC CENTROSOME PROTEINS AND COMPLEXES.
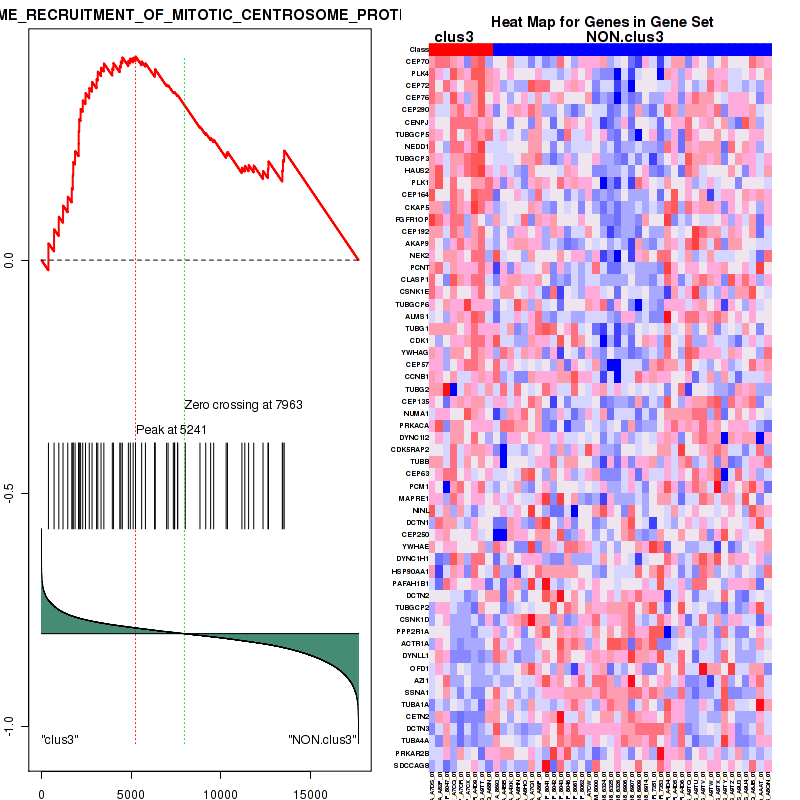
Figure S60. Get High-res Image For the top 5 core enriched genes in the pathway: REACTOME RECRUITMENT OF MITOTIC CENTROSOME PROTEINS AND COMPLEXES, this volcano plot shows how much they are up/down-regulated and significant. The significance was calculated by empirical bayesian fit
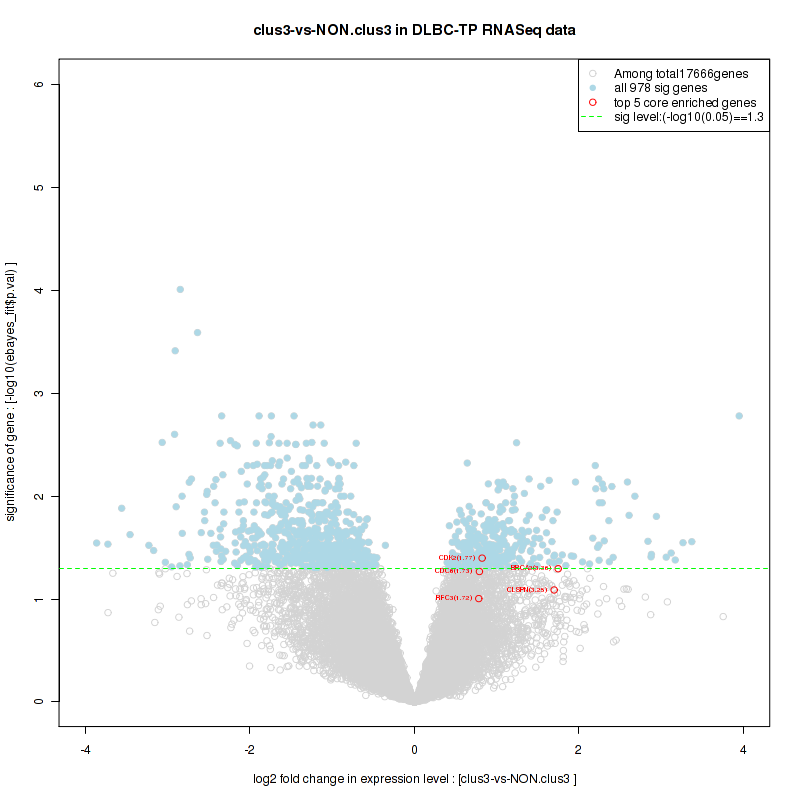
For the top enriched genes, if you want to check whether they are
-
up-regulated, please check the list of up-regulated genes
-
down-regulated, please check the list of down-regulated genes
For the top enriched genes, if you want to check whether they are
-
highly expressed genes, please check the list of high (top 30%) expressed genes
-
low expressed genes, please check the list of low (bottom 30%) expressed genes
An expression pattern of top(30%)/middle(30%)/low(30%) in this subtype against other subtypes is available in a heatmap
For the top enriched genes, if you want to check whether they are
-
significantly differently expressed genes by eBayes lm fit, please check the list of significant genes
Table 6. Get Full Table This table shows top 10 pathways which are significantly enriched in cluster clus4. It displays only significant gene sets satisfying nom.p.val.threshold (-1), fwer.p.val.threshold (-1) , fdr.q.val.threshold (0.25) and the default table is sorted by Normalized Enrichment Score (NES). Further details on NES statistics, please visit The Broad GSEA website.
| GeneSet(GS) | Size(#genes) | genes.ES.table | ES | NES | NOM.p.val | FDR.q.val | FWER.p.val | Tag.. | Gene.. | Signal | FDR..median. | glob.p.val |
|---|---|---|---|---|---|---|---|---|---|---|---|---|
| KEGG BASAL TRANSCRIPTION FACTORS | 34 | genes.ES.table | 0.56 | 1.5 | 0.061 | 1 | 0.96 | 0.35 | 0.15 | 0.3 | 1 | 0.51 |
| BIOCARTA CARM ER PATHWAY | 34 | genes.ES.table | 0.38 | 1.5 | 0.068 | 1 | 0.98 | 0.35 | 0.25 | 0.27 | 1 | 0.55 |
| BIOCARTA CREB PATHWAY | 26 | genes.ES.table | 0.47 | 1.4 | 0.068 | 1 | 0.99 | 0.5 | 0.24 | 0.38 | 1 | 0.53 |
| BIOCARTA VEGF PATHWAY | 29 | genes.ES.table | 0.43 | 1.5 | 0.084 | 1 | 0.97 | 0.41 | 0.25 | 0.31 | 1 | 0.51 |
| SIG BCR SIGNALING PATHWAY | 46 | genes.ES.table | 0.46 | 1.8 | 0.022 | 1 | 0.62 | 0.39 | 0.23 | 0.3 | 1 | 0.52 |
| PID FANCONI PATHWAY | 46 | genes.ES.table | 0.53 | 1.6 | 0.035 | 1 | 0.86 | 0.5 | 0.25 | 0.38 | 0.94 | 0.48 |
| PID E2F PATHWAY | 69 | genes.ES.table | 0.48 | 1.6 | 0.079 | 1 | 0.91 | 0.55 | 0.3 | 0.39 | 1 | 0.53 |
| PID ATM PATHWAY | 34 | genes.ES.table | 0.45 | 1.5 | 0.098 | 1 | 0.96 | 0.62 | 0.36 | 0.4 | 1 | 0.51 |
| PID HDAC CLASSI PATHWAY | 65 | genes.ES.table | 0.29 | 1.5 | 0.086 | 1 | 0.98 | 0.28 | 0.24 | 0.21 | 1 | 0.52 |
| PID PLK1 PATHWAY | 45 | genes.ES.table | 0.55 | 1.6 | 0.059 | 1 | 0.92 | 0.64 | 0.32 | 0.44 | 0.94 | 0.48 |
Table S31. Get Full Table This table shows a Running Enrichment Score (RES) of each gene in this pathway, that is, the enrichment score at this point in the ranked list of genes. All genes are ranked by Signal-to-Noise (S2N), a measure of similarity as default and are used to obtain ES matrix of all genes. In this way, GSEA tool uses expression pattern of not only overlapped genes but also not-overlapped genes to produce ES matrix.
| Rank | GENE | SYMBOL | DESC | LIST.LOC | S2N | RES | CORE_ENRICHMENT |
|---|---|---|---|---|---|---|---|
| 1 | NFATC2 | NFATC2 | NFATC2 | 579 | 0.49 | 0.033 | YES |
| 2 | CR2 | CR2 | CR2 | 691 | 0.46 | 0.088 | YES |
| 3 | AKT3 | AKT3 | AKT3 | 782 | 0.44 | 0.14 | YES |
| 4 | ITPR3 | ITPR3 | ITPR3 | 967 | 0.4 | 0.18 | YES |
| 5 | PPP3CA | PPP3CA | PPP3CA | 1187 | 0.36 | 0.22 | YES |
| 6 | CD22 | CD22 | CD22 | 1248 | 0.35 | 0.26 | YES |
| 7 | PIK3CA | PIK3CA | PIK3CA | 1455 | 0.32 | 0.3 | YES |
| 8 | ITPR1 | ITPR1 | ITPR1 | 1631 | 0.3 | 0.33 | YES |
| 9 | PPP1R13B | PPP1R13B | PPP1R13B | 1943 | 0.27 | 0.35 | YES |
| 10 | PDK1 | PDK1 | PDK1 | 2139 | 0.26 | 0.37 | YES |
| 11 | SOS2 | SOS2 | SOS2 | 2404 | 0.23 | 0.39 | YES |
| 12 | BCL2 | BCL2 | BCL2 | 2503 | 0.23 | 0.41 | YES |
| 13 | PTPRC | PTPRC | PTPRC | 2646 | 0.22 | 0.43 | YES |
| 14 | DAG1 | DAG1 | DAG1 | 3146 | 0.18 | 0.43 | YES |
| 15 | SOS1 | SOS1 | SOS1 | 3231 | 0.18 | 0.45 | YES |
| 16 | MAPK1 | MAPK1 | MAPK1 | 3817 | 0.15 | 0.44 | YES |
| 17 | PIK3R1 | PIK3R1 | PIK3R1 | 3860 | 0.15 | 0.45 | YES |
| 18 | BTK | BTK | BTK | 4097 | 0.14 | 0.46 | YES |
| 19 | BCR | BCR | BCR | 4418 | 0.12 | 0.46 | NO |
| 20 | NR0B2 | NR0B2 | NR0B2 | 5204 | 0.096 | 0.43 | NO |
| 21 | ITPR2 | ITPR2 | ITPR2 | 5364 | 0.09 | 0.43 | NO |
| 22 | SHC1 | SHC1 | SHC1 | 5806 | 0.075 | 0.42 | NO |
| 23 | AKT1 | AKT1 | AKT1 | 6343 | 0.059 | 0.39 | NO |
| 24 | PLCG2 | PLCG2 | PLCG2 | 6446 | 0.055 | 0.39 | NO |
| 25 | LYN | LYN | LYN | 6620 | 0.05 | 0.39 | NO |
| 26 | AKT2 | AKT2 | AKT2 | 6704 | 0.048 | 0.39 | NO |
| 27 | GSK3B | GSK3B | GSK3B | 7214 | 0.034 | 0.37 | NO |
| 28 | SYK | SYK | SYK | 7228 | 0.034 | 0.37 | NO |
| 29 | MAPK3 | MAPK3 | MAPK3 | 7325 | 0.031 | 0.37 | NO |
| 30 | INPP5D | INPP5D | INPP5D | 7509 | 0.025 | 0.36 | NO |
| 31 | FLOT2 | FLOT2 | FLOT2 | 7562 | 0.024 | 0.36 | NO |
| 32 | PPP3CB | PPP3CB | PPP3CB | 7644 | 0.021 | 0.36 | NO |
| 33 | RAF1 | RAF1 | RAF1 | 8671 | -0.0073 | 0.3 | NO |
| 34 | GSK3A | GSK3A | GSK3A | 8985 | -0.016 | 0.29 | NO |
| 35 | VAV1 | VAV1 | VAV1 | 9375 | -0.026 | 0.27 | NO |
| 36 | NFATC1 | NFATC1 | NFATC1 | 10294 | -0.054 | 0.23 | NO |
| 37 | FLOT1 | FLOT1 | FLOT1 | 10657 | -0.066 | 0.21 | NO |
| 38 | PIK3CD | PIK3CD | PIK3CD | 11309 | -0.086 | 0.19 | NO |
| 39 | GRB2 | GRB2 | GRB2 | 11755 | -0.1 | 0.18 | NO |
| 40 | CD19 | CD19 | CD19 | 12041 | -0.11 | 0.18 | NO |
| 41 | CD81 | CD81 | CD81 | 12179 | -0.12 | 0.18 | NO |
| 42 | PPP3CC | PPP3CC | PPP3CC | 12400 | -0.13 | 0.19 | NO |
| 43 | MAP4K1 | MAP4K1 | MAP4K1 | 12508 | -0.13 | 0.2 | NO |
| 44 | CSK | CSK | CSK | 12963 | -0.15 | 0.2 | NO |
| 45 | BAD | BAD | BAD | 14232 | -0.22 | 0.15 | NO |
| 46 | BLNK | BLNK | BLNK | 15173 | -0.3 | 0.14 | NO |
Figure S61. Get High-res Image This plot shows mRNAseq_cNMF expression data heatmap (on the left) a RunningEnrichmentScore(RES) plot (on the top right) and a Signal2Noise(S2N) plot (on the bottom right) of genes in the pathway: KEGG BASAL TRANSCRIPTION FACTORS.
Figure S62. Get High-res Image For the top 5 core enriched genes in the pathway: KEGG BASAL TRANSCRIPTION FACTORS, this volcano plot shows how much they are up/down-regulated and significant. The significance was calculated by empirical bayesian fit
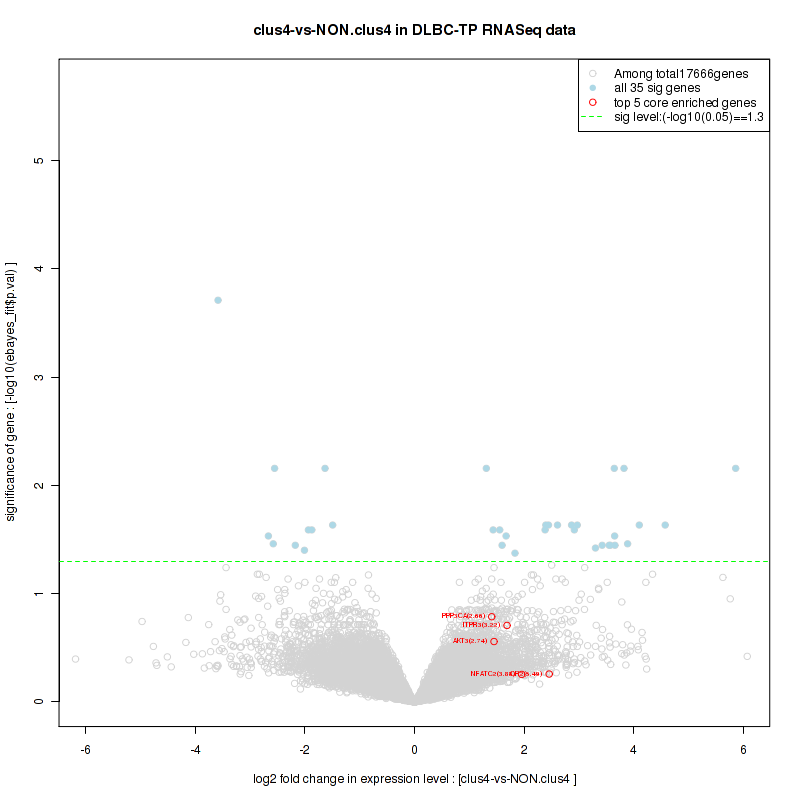
Table S32. Get Full Table This table shows a Running Enrichment Score (RES) of each gene in this pathway, that is, the enrichment score at this point in the ranked list of genes. All genes are ranked by Signal-to-Noise (S2N), a measure of similarity as default and are used to obtain ES matrix of all genes. In this way, GSEA tool uses expression pattern of not only overlapped genes but also not-overlapped genes to produce ES matrix.
| Rank | GENE | SYMBOL | DESC | LIST.LOC | S2N | RES | CORE_ENRICHMENT |
|---|---|---|---|---|---|---|---|
| 1 | MAPK10 | MAPK10 | MAPK10 | 6 | 1.3 | 0.16 | YES |
| 2 | G6PC | G6PC | G6PC | 348 | 0.57 | 0.21 | YES |
| 3 | MAPK8 | MAPK8 | MAPK8 | 593 | 0.48 | 0.25 | YES |
| 4 | SKP2 | SKP2 | SKP2 | 1064 | 0.38 | 0.27 | YES |
| 5 | EP300 | EP300 | EP300 | 1226 | 0.35 | 0.3 | YES |
| 6 | SIRT1 | SIRT1 | SIRT1 | 1420 | 0.33 | 0.34 | YES |
| 7 | BCL6 | BCL6 | BCL6 | 2044 | 0.26 | 0.33 | YES |
| 8 | CSNK1G3 | CSNK1G3 | CSNK1G3 | 2067 | 0.26 | 0.36 | YES |
| 9 | KAT2B | KAT2B | KAT2B | 2458 | 0.23 | 0.37 | YES |
| 10 | RBL2 | RBL2 | RBL2 | 2650 | 0.22 | 0.38 | YES |
| 11 | FOXO1 | FOXO1 | FOXO1 | 3082 | 0.19 | 0.38 | YES |
| 12 | FOXO3 | FOXO3 | FOXO3 | 3178 | 0.18 | 0.4 | YES |
| 13 | CREBBP | CREBBP | CREBBP | 3335 | 0.17 | 0.41 | YES |
| 14 | YWHAG | YWHAG | YWHAG | 3682 | 0.16 | 0.41 | YES |
| 15 | MAPK9 | MAPK9 | MAPK9 | 3819 | 0.15 | 0.42 | YES |
| 16 | CDK2 | CDK2 | CDK2 | 3853 | 0.15 | 0.44 | YES |
| 17 | USP7 | USP7 | USP7 | 3997 | 0.14 | 0.45 | YES |
| 18 | PLK1 | PLK1 | PLK1 | 4476 | 0.12 | 0.44 | NO |
| 19 | IKBKB | IKBKB | IKBKB | 4945 | 0.11 | 0.42 | NO |
| 20 | CCNB1 | CCNB1 | CCNB1 | 5315 | 0.091 | 0.41 | NO |
| 21 | FOXO4 | FOXO4 | FOXO4 | 5499 | 0.085 | 0.41 | NO |
| 22 | XPO1 | XPO1 | XPO1 | 5528 | 0.084 | 0.42 | NO |
| 23 | CAT | CAT | CAT | 5745 | 0.077 | 0.42 | NO |
| 24 | AKT1 | AKT1 | AKT1 | 6343 | 0.059 | 0.39 | NO |
| 25 | YWHAH | YWHAH | YWHAH | 6463 | 0.055 | 0.39 | NO |
| 26 | CSNK1G2 | CSNK1G2 | CSNK1G2 | 6616 | 0.05 | 0.39 | NO |
| 27 | SGK1 | SGK1 | SGK1 | 6881 | 0.042 | 0.38 | NO |
| 28 | RAN | RAN | RAN | 7489 | 0.026 | 0.35 | NO |
| 29 | CSNK1D | CSNK1D | CSNK1D | 7500 | 0.026 | 0.35 | NO |
| 30 | CHUK | CHUK | CHUK | 7629 | 0.022 | 0.35 | NO |
| 31 | FBXO32 | FBXO32 | FBXO32 | 8006 | 0.011 | 0.33 | NO |
| 32 | CSNK1A1 | CSNK1A1 | CSNK1A1 | 8174 | 0.0062 | 0.32 | NO |
| 33 | RALA | RALA | RALA | 8361 | 0.00063 | 0.31 | NO |
| 34 | YWHAZ | YWHAZ | YWHAZ | 8485 | -0.0023 | 0.3 | NO |
| 35 | CTNNB1 | CTNNB1 | CTNNB1 | 8685 | -0.0078 | 0.29 | NO |
| 36 | YWHAE | YWHAE | YWHAE | 8705 | -0.0082 | 0.29 | NO |
| 37 | YWHAB | YWHAB | YWHAB | 8857 | -0.012 | 0.28 | NO |
| 38 | CSNK1G1 | CSNK1G1 | CSNK1G1 | 9086 | -0.019 | 0.27 | NO |
| 39 | YWHAQ | YWHAQ | YWHAQ | 9420 | -0.028 | 0.26 | NO |
| 40 | ZFAND5 | ZFAND5 | ZFAND5 | 10130 | -0.05 | 0.22 | NO |
| 41 | CSNK1E | CSNK1E | CSNK1E | 10679 | -0.066 | 0.2 | NO |
| 42 | BCL2L11 | BCL2L11 | BCL2L11 | 11610 | -0.097 | 0.16 | NO |
| 43 | RALB | RALB | RALB | 11690 | -0.1 | 0.17 | NO |
| 44 | MST1 | MST1 | MST1 | 11701 | -0.1 | 0.18 | NO |
| 45 | CDKN1B | CDKN1B | CDKN1B | 12309 | -0.12 | 0.16 | NO |
| 46 | GADD45A | GADD45A | GADD45A | 12487 | -0.13 | 0.16 | NO |
| 47 | SOD2 | SOD2 | SOD2 | 14611 | -0.25 | 0.076 | NO |
| 48 | FASLG | FASLG | FASLG | 15744 | -0.37 | 0.057 | NO |
| 49 | SFN | SFN | SFN | 16150 | -0.43 | 0.086 | NO |
Figure S63. Get High-res Image This plot shows mRNAseq_cNMF expression data heatmap (on the left) a RunningEnrichmentScore(RES) plot (on the top right) and a Signal2Noise(S2N) plot (on the bottom right) of genes in the pathway: BIOCARTA CARM ER PATHWAY.
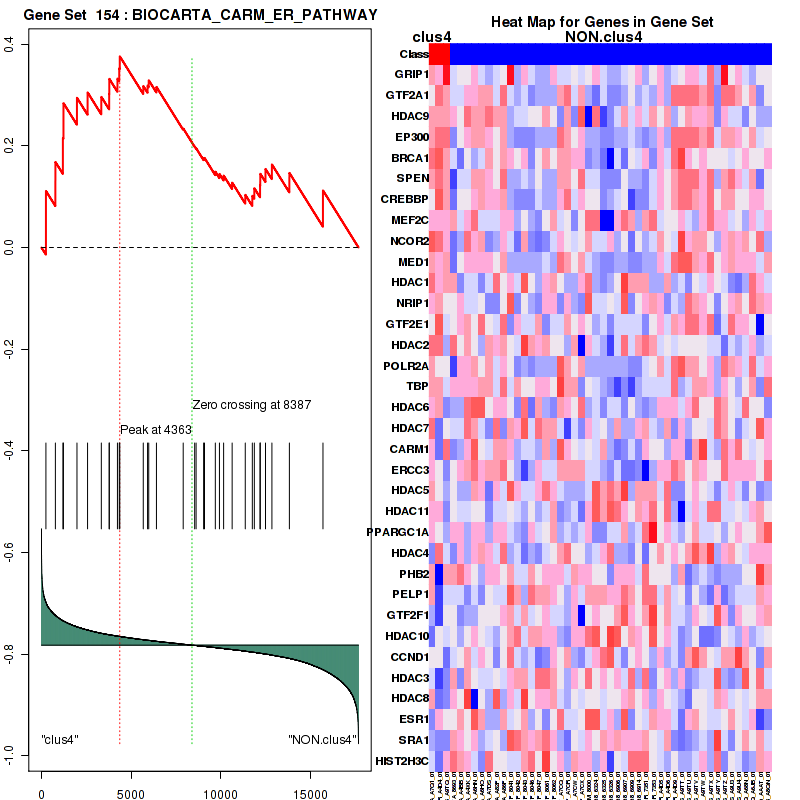
Figure S64. Get High-res Image For the top 5 core enriched genes in the pathway: BIOCARTA CARM ER PATHWAY, this volcano plot shows how much they are up/down-regulated and significant. The significance was calculated by empirical bayesian fit
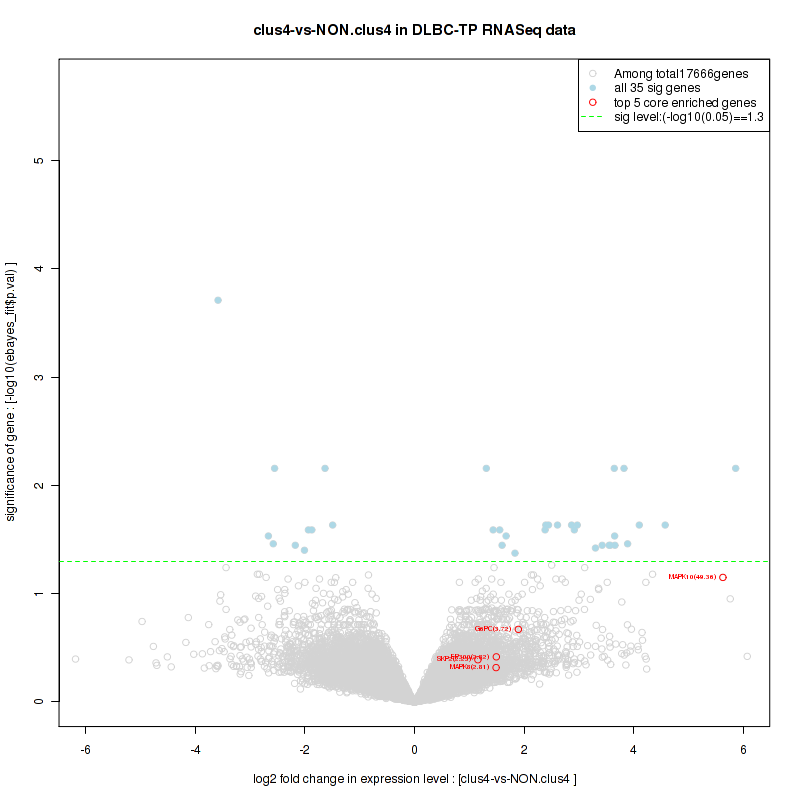
Table S33. Get Full Table This table shows a Running Enrichment Score (RES) of each gene in this pathway, that is, the enrichment score at this point in the ranked list of genes. All genes are ranked by Signal-to-Noise (S2N), a measure of similarity as default and are used to obtain ES matrix of all genes. In this way, GSEA tool uses expression pattern of not only overlapped genes but also not-overlapped genes to produce ES matrix.
| Rank | GENE | SYMBOL | DESC | LIST.LOC | S2N | RES | CORE_ENRICHMENT |
|---|---|---|---|---|---|---|---|
| 1 | MAPK8 | MAPK8 | MAPK8 | 593 | 0.48 | 0.031 | YES |
| 2 | SKP2 | SKP2 | SKP2 | 1064 | 0.38 | 0.054 | YES |
| 3 | EP300 | EP300 | EP300 | 1226 | 0.35 | 0.092 | YES |
| 4 | PPM1D | PPM1D | PPM1D | 2041 | 0.26 | 0.081 | YES |
| 5 | CSNK1G3 | CSNK1G3 | CSNK1G3 | 2067 | 0.26 | 0.11 | YES |
| 6 | ATM | ATM | ATM | 2105 | 0.26 | 0.15 | YES |
| 7 | SETD7 | SETD7 | SETD7 | 2207 | 0.25 | 0.17 | YES |
| 8 | KAT2B | KAT2B | KAT2B | 2458 | 0.23 | 0.19 | YES |
| 9 | PPP1R13L | PPP1R13L | PPP1R13L | 2656 | 0.22 | 0.21 | YES |
| 10 | DYRK2 | DYRK2 | DYRK2 | 2718 | 0.21 | 0.23 | YES |
| 11 | MDM4 | MDM4 | MDM4 | 2823 | 0.2 | 0.25 | YES |
| 12 | HIPK2 | HIPK2 | HIPK2 | 2950 | 0.2 | 0.27 | YES |
| 13 | CREBBP | CREBBP | CREBBP | 3335 | 0.17 | 0.27 | YES |
| 14 | SETD8 | SETD8 | SETD8 | 3440 | 0.17 | 0.29 | YES |
| 15 | CHEK2 | CHEK2 | CHEK2 | 3697 | 0.16 | 0.3 | YES |
| 16 | MAPK9 | MAPK9 | MAPK9 | 3819 | 0.15 | 0.31 | YES |
| 17 | CDK2 | CDK2 | CDK2 | 3853 | 0.15 | 0.33 | YES |
| 18 | USP7 | USP7 | USP7 | 3997 | 0.14 | 0.34 | YES |
| 19 | ATR | ATR | ATR | 4182 | 0.14 | 0.34 | YES |
| 20 | TTC5 | TTC5 | TTC5 | 4194 | 0.13 | 0.36 | YES |
| 21 | MAPK14 | MAPK14 | MAPK14 | 4199 | 0.13 | 0.38 | YES |
| 22 | TP53 | TP53 | TP53 | 4205 | 0.13 | 0.4 | YES |
| 23 | FBXO11 | FBXO11 | FBXO11 | 4488 | 0.12 | 0.4 | YES |
| 24 | SMYD2 | SMYD2 | SMYD2 | 4667 | 0.12 | 0.4 | YES |
| 25 | CCNG1 | CCNG1 | CCNG1 | 5184 | 0.096 | 0.39 | YES |
| 26 | DAXX | DAXX | DAXX | 5229 | 0.095 | 0.4 | YES |
| 27 | CCNA2 | CCNA2 | CCNA2 | 5270 | 0.093 | 0.41 | YES |
| 28 | HUWE1 | HUWE1 | HUWE1 | 5422 | 0.087 | 0.41 | YES |
| 29 | MDM2 | MDM2 | MDM2 | 5458 | 0.086 | 0.42 | YES |
| 30 | CSE1L | CSE1L | CSE1L | 5915 | 0.072 | 0.4 | NO |
| 31 | ABL1 | ABL1 | ABL1 | 6142 | 0.065 | 0.4 | NO |
| 32 | YY1 | YY1 | YY1 | 6326 | 0.059 | 0.4 | NO |
| 33 | AKT1 | AKT1 | AKT1 | 6343 | 0.059 | 0.4 | NO |
| 34 | CSNK1G2 | CSNK1G2 | CSNK1G2 | 6616 | 0.05 | 0.39 | NO |
| 35 | UBE2D1 | UBE2D1 | UBE2D1 | 6972 | 0.04 | 0.38 | NO |
| 36 | RFWD2 | RFWD2 | RFWD2 | 7079 | 0.037 | 0.38 | NO |
| 37 | GSK3B | GSK3B | GSK3B | 7214 | 0.034 | 0.38 | NO |
| 38 | CSNK1D | CSNK1D | CSNK1D | 7500 | 0.026 | 0.36 | NO |
| 39 | CSNK1A1 | CSNK1A1 | CSNK1A1 | 8174 | 0.0062 | 0.32 | NO |
| 40 | PRMT5 | PRMT5 | PRMT5 | 8348 | 0.00081 | 0.32 | NO |
| 41 | RCHY1 | RCHY1 | RCHY1 | 8430 | -0.00095 | 0.31 | NO |
| 42 | CHEK1 | CHEK1 | CHEK1 | 8721 | -0.0086 | 0.3 | NO |
| 43 | CSNK1G1 | CSNK1G1 | CSNK1G1 | 9086 | -0.019 | 0.28 | NO |
| 44 | PPP2CA | PPP2CA | PPP2CA | 9437 | -0.028 | 0.26 | NO |
| 45 | E4F1 | E4F1 | E4F1 | 9569 | -0.032 | 0.26 | NO |
| 46 | PRKCD | PRKCD | PRKCD | 9603 | -0.033 | 0.26 | NO |
| 47 | RPL23 | RPL23 | RPL23 | 10319 | -0.055 | 0.23 | NO |
| 48 | RPL5 | RPL5 | RPL5 | 10509 | -0.061 | 0.22 | NO |
| 49 | CSNK1E | CSNK1E | CSNK1E | 10679 | -0.066 | 0.22 | NO |
| 50 | KAT5 | KAT5 | KAT5 | 10995 | -0.076 | 0.22 | NO |
| 51 | NEDD8 | NEDD8 | NEDD8 | 11238 | -0.083 | 0.21 | NO |
| 52 | PPP2R4 | PPP2R4 | PPP2R4 | 12088 | -0.11 | 0.18 | NO |
| 53 | TRIM28 | TRIM28 | TRIM28 | 12336 | -0.12 | 0.18 | NO |
| 54 | RASSF1 | RASSF1 | RASSF1 | 12440 | -0.13 | 0.19 | NO |
| 55 | RPL11 | RPL11 | RPL11 | 13582 | -0.18 | 0.15 | NO |
| 56 | PIN1 | PIN1 | PIN1 | 13800 | -0.19 | 0.17 | NO |
| 57 | CDKN2A | CDKN2A | CDKN2A | 15948 | -0.4 | 0.098 | NO |
Figure S65. Get High-res Image This plot shows mRNAseq_cNMF expression data heatmap (on the left) a RunningEnrichmentScore(RES) plot (on the top right) and a Signal2Noise(S2N) plot (on the bottom right) of genes in the pathway: BIOCARTA CREB PATHWAY.

Figure S66. Get High-res Image For the top 5 core enriched genes in the pathway: BIOCARTA CREB PATHWAY, this volcano plot shows how much they are up/down-regulated and significant. The significance was calculated by empirical bayesian fit
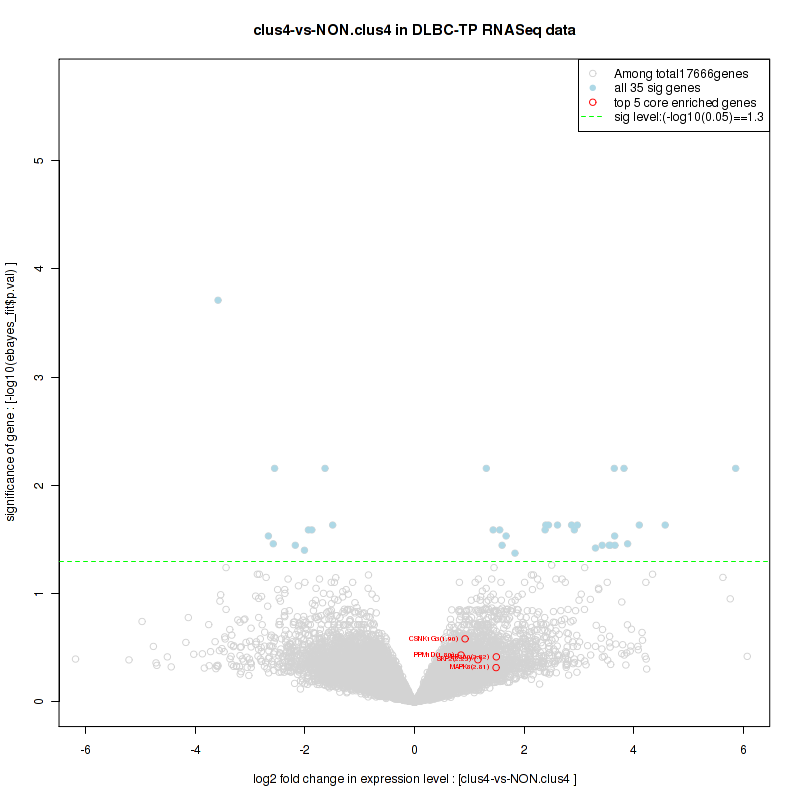
Table S34. Get Full Table This table shows a Running Enrichment Score (RES) of each gene in this pathway, that is, the enrichment score at this point in the ranked list of genes. All genes are ranked by Signal-to-Noise (S2N), a measure of similarity as default and are used to obtain ES matrix of all genes. In this way, GSEA tool uses expression pattern of not only overlapped genes but also not-overlapped genes to produce ES matrix.
| Rank | GENE | SYMBOL | DESC | LIST.LOC | S2N | RES | CORE_ENRICHMENT |
|---|---|---|---|---|---|---|---|
| 1 | BRIP1 | BRIP1 | BRIP1 | 92 | 0.79 | 0.11 | YES |
| 2 | SSPO | SSPO | SSPO | 775 | 0.44 | 0.13 | YES |
| 3 | BRCA2 | BRCA2 | BRCA2 | 1603 | 0.31 | 0.13 | YES |
| 4 | PALB2 | PALB2 | PALB2 | 1961 | 0.27 | 0.14 | YES |
| 5 | BRCA1 | BRCA1 | BRCA1 | 1977 | 0.27 | 0.18 | YES |
| 6 | FANCB | FANCB | FANCB | 2074 | 0.26 | 0.21 | YES |
| 7 | ATM | ATM | ATM | 2105 | 0.26 | 0.25 | YES |
| 8 | RMI1 | RMI1 | RMI1 | 2250 | 0.25 | 0.27 | YES |
| 9 | FANCM | FANCM | FANCM | 2251 | 0.25 | 0.31 | YES |
| 10 | FANCE | FANCE | FANCE | 2294 | 0.24 | 0.34 | YES |
| 11 | FANCF | FANCF | FANCF | 2732 | 0.21 | 0.35 | YES |
| 12 | RAD17 | RAD17 | RAD17 | 2764 | 0.21 | 0.37 | YES |
| 13 | RFC3 | RFC3 | RFC3 | 2802 | 0.2 | 0.4 | YES |
| 14 | APITD1 | APITD1 | APITD1 | 3240 | 0.18 | 0.4 | YES |
| 15 | FBXW11 | FBXW11 | FBXW11 | 3346 | 0.17 | 0.42 | YES |
| 16 | RAD50 | RAD50 | RAD50 | 3364 | 0.17 | 0.44 | YES |
| 17 | UBE2T | UBE2T | UBE2T | 3425 | 0.17 | 0.46 | YES |
| 18 | MRE11A | MRE11A | MRE11A | 3634 | 0.16 | 0.48 | YES |
| 19 | C19orf40 | C19orf40 | C19orf40 | 3798 | 0.15 | 0.49 | YES |
| 20 | TOPBP1 | TOPBP1 | TOPBP1 | 3846 | 0.15 | 0.5 | YES |
| 21 | ATR | ATR | ATR | 4182 | 0.14 | 0.5 | YES |
| 22 | RFC5 | RFC5 | RFC5 | 4333 | 0.13 | 0.52 | YES |
| 23 | FANCL | FANCL | FANCL | 4384 | 0.13 | 0.53 | YES |
| 24 | XRCC3 | XRCC3 | XRCC3 | 4814 | 0.11 | 0.52 | NO |
| 25 | USP1 | USP1 | USP1 | 5577 | 0.083 | 0.49 | NO |
| 26 | FANCI | FANCI | FANCI | 6076 | 0.067 | 0.47 | NO |
| 27 | RAD1 | RAD1 | RAD1 | 6262 | 0.061 | 0.47 | NO |
| 28 | FANCG | FANCG | FANCG | 6410 | 0.056 | 0.47 | NO |
| 29 | FANCC | FANCC | FANCC | 6498 | 0.053 | 0.47 | NO |
| 30 | NBN | NBN | NBN | 7047 | 0.038 | 0.45 | NO |
| 31 | HUS1 | HUS1 | HUS1 | 7131 | 0.036 | 0.45 | NO |
| 32 | FANCD2 | FANCD2 | FANCD2 | 7194 | 0.034 | 0.45 | NO |
| 33 | FANCA | FANCA | FANCA | 7561 | 0.024 | 0.43 | NO |
| 34 | RFC2 | RFC2 | RFC2 | 7942 | 0.013 | 0.41 | NO |
| 35 | RPA1 | RPA1 | RPA1 | 8119 | 0.0076 | 0.4 | NO |
| 36 | RFC4 | RFC4 | RFC4 | 8277 | 0.003 | 0.39 | NO |
| 37 | TOP3A | TOP3A | TOP3A | 8474 | -0.0021 | 0.38 | NO |
| 38 | CHEK1 | CHEK1 | CHEK1 | 8721 | -0.0086 | 0.37 | NO |
| 39 | WDR48 | WDR48 | WDR48 | 9268 | -0.024 | 0.34 | NO |
| 40 | C17orf70 | C17orf70 | C17orf70 | 9365 | -0.026 | 0.34 | NO |
| 41 | BLM | BLM | BLM | 10652 | -0.066 | 0.28 | NO |
| 42 | RAD9A | RAD9A | RAD9A | 11080 | -0.078 | 0.26 | NO |
| 43 | H2AFX | H2AFX | H2AFX | 11087 | -0.078 | 0.27 | NO |
| 44 | RPA2 | RPA2 | RPA2 | 11841 | -0.1 | 0.25 | NO |
| 45 | ATRIP | ATRIP | ATRIP | 12590 | -0.13 | 0.22 | NO |
| 46 | HES1 | HES1 | HES1 | 16335 | -0.46 | 0.076 | NO |
Figure S67. Get High-res Image This plot shows mRNAseq_cNMF expression data heatmap (on the left) a RunningEnrichmentScore(RES) plot (on the top right) and a Signal2Noise(S2N) plot (on the bottom right) of genes in the pathway: BIOCARTA VEGF PATHWAY.
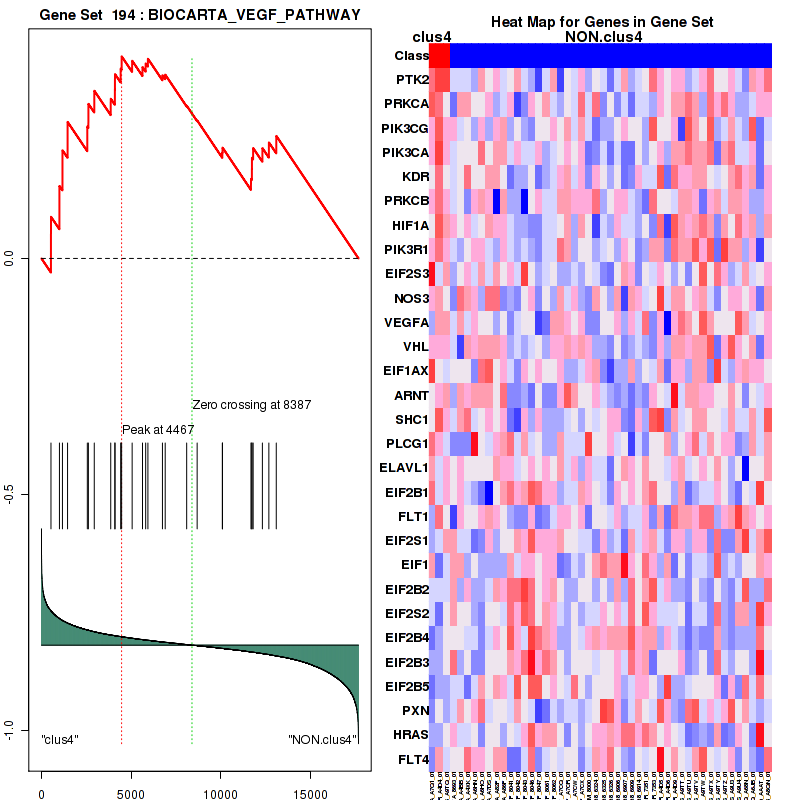
Figure S68. Get High-res Image For the top 5 core enriched genes in the pathway: BIOCARTA VEGF PATHWAY, this volcano plot shows how much they are up/down-regulated and significant. The significance was calculated by empirical bayesian fit
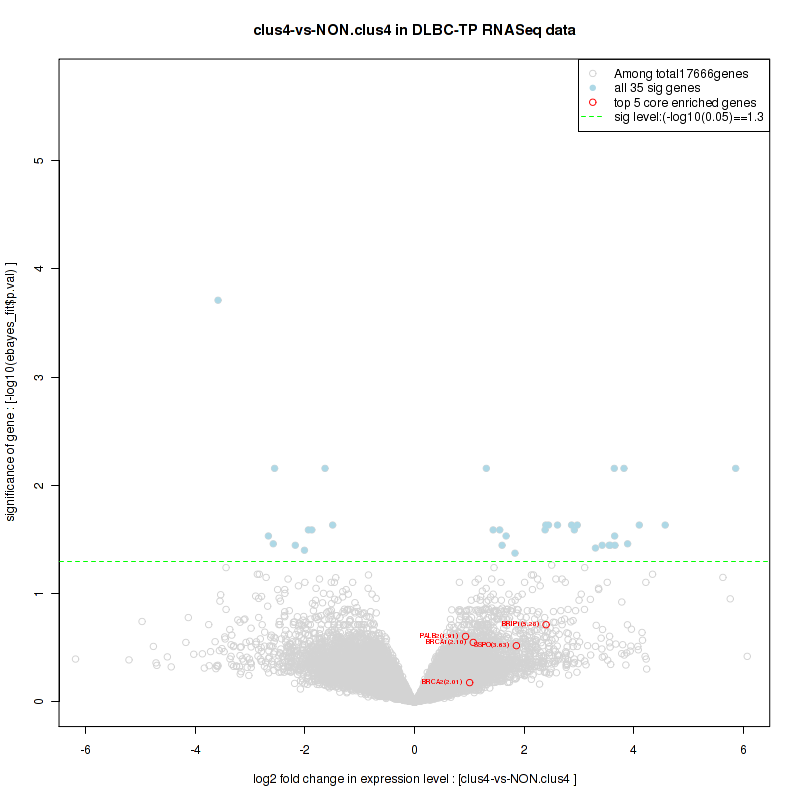
Table S35. Get Full Table This table shows a Running Enrichment Score (RES) of each gene in this pathway, that is, the enrichment score at this point in the ranked list of genes. All genes are ranked by Signal-to-Noise (S2N), a measure of similarity as default and are used to obtain ES matrix of all genes. In this way, GSEA tool uses expression pattern of not only overlapped genes but also not-overlapped genes to produce ES matrix.
| Rank | GENE | SYMBOL | DESC | LIST.LOC | S2N | RES | CORE_ENRICHMENT |
|---|---|---|---|---|---|---|---|
| 1 | WASF1 | WASF1 | WASF1 | 69 | 0.84 | 0.069 | YES |
| 2 | E2F7 | E2F7 | E2F7 | 250 | 0.63 | 0.11 | YES |
| 3 | CCNE2 | CCNE2 | CCNE2 | 842 | 0.42 | 0.12 | YES |
| 4 | RBL1 | RBL1 | RBL1 | 855 | 0.42 | 0.15 | YES |
| 5 | DHFR | DHFR | DHFR | 1028 | 0.39 | 0.17 | YES |
| 6 | EP300 | EP300 | EP300 | 1226 | 0.35 | 0.19 | YES |
| 7 | SIRT1 | SIRT1 | SIRT1 | 1420 | 0.33 | 0.21 | YES |
| 8 | E2F5 | E2F5 | E2F5 | 1421 | 0.33 | 0.24 | YES |
| 9 | APAF1 | APAF1 | APAF1 | 1820 | 0.28 | 0.24 | YES |
| 10 | BRCA1 | BRCA1 | BRCA1 | 1977 | 0.27 | 0.26 | YES |
| 11 | MYC | MYC | MYC | 2029 | 0.26 | 0.27 | YES |
| 12 | ATM | ATM | ATM | 2105 | 0.26 | 0.29 | YES |
| 13 | TRRAP | TRRAP | TRRAP | 2132 | 0.26 | 0.31 | YES |
| 14 | E2F3 | E2F3 | E2F3 | 2230 | 0.25 | 0.33 | YES |
| 15 | POLA1 | POLA1 | POLA1 | 2430 | 0.23 | 0.34 | YES |
| 16 | KAT2B | KAT2B | KAT2B | 2458 | 0.23 | 0.36 | YES |
| 17 | RBL2 | RBL2 | RBL2 | 2650 | 0.22 | 0.36 | YES |
| 18 | CDK1 | CDK1 | CDK1 | 2791 | 0.21 | 0.37 | YES |
| 19 | CDKN2C | CDKN2C | CDKN2C | 3035 | 0.19 | 0.38 | YES |
| 20 | TFDP1 | TFDP1 | TFDP1 | 3087 | 0.19 | 0.39 | YES |
| 21 | RB1 | RB1 | RB1 | 3108 | 0.19 | 0.4 | YES |
| 22 | KAT2A | KAT2A | KAT2A | 3318 | 0.18 | 0.41 | YES |
| 23 | CREBBP | CREBBP | CREBBP | 3335 | 0.17 | 0.42 | YES |
| 24 | RBBP4 | RBBP4 | RBBP4 | 3352 | 0.17 | 0.44 | YES |
| 25 | CDC6 | CDC6 | CDC6 | 3530 | 0.16 | 0.44 | YES |
| 26 | HBP1 | HBP1 | HBP1 | 3617 | 0.16 | 0.45 | YES |
| 27 | TOPBP1 | TOPBP1 | TOPBP1 | 3846 | 0.15 | 0.45 | YES |
| 28 | CDK2 | CDK2 | CDK2 | 3853 | 0.15 | 0.46 | YES |
| 29 | SP1 | SP1 | SP1 | 4209 | 0.13 | 0.45 | YES |
| 30 | HDAC1 | HDAC1 | HDAC1 | 4334 | 0.13 | 0.46 | YES |
| 31 | CBX5 | CBX5 | CBX5 | 4514 | 0.12 | 0.46 | YES |
| 32 | CCNE1 | CCNE1 | CCNE1 | 4581 | 0.12 | 0.46 | YES |
| 33 | E2F2 | E2F2 | E2F2 | 4679 | 0.12 | 0.47 | YES |
| 34 | MCM3 | MCM3 | MCM3 | 4917 | 0.11 | 0.46 | YES |
| 35 | E2F1 | E2F1 | E2F1 | 5123 | 0.099 | 0.46 | YES |
| 36 | RRM1 | RRM1 | RRM1 | 5130 | 0.098 | 0.47 | YES |
| 37 | RBBP8 | RBBP8 | RBBP8 | 5198 | 0.096 | 0.47 | YES |
| 38 | CCNA2 | CCNA2 | CCNA2 | 5270 | 0.093 | 0.48 | YES |
| 39 | YY1 | YY1 | YY1 | 6326 | 0.059 | 0.42 | NO |
| 40 | SERPINE1 | SERPINE1 | SERPINE1 | 6724 | 0.047 | 0.4 | NO |
| 41 | TK1 | TK1 | TK1 | 6838 | 0.044 | 0.4 | NO |
| 42 | CDC25A | CDC25A | CDC25A | 6989 | 0.04 | 0.39 | NO |
| 43 | CASP7 | CASP7 | CASP7 | 7123 | 0.036 | 0.39 | NO |
| 44 | HIC1 | HIC1 | HIC1 | 8113 | 0.0077 | 0.33 | NO |
| 45 | CES2 | CES2 | CES2 | 8341 | 0.00088 | 0.32 | NO |
| 46 | PRMT5 | PRMT5 | PRMT5 | 8348 | 0.00081 | 0.32 | NO |
| 47 | MYBL2 | MYBL2 | MYBL2 | 8362 | 0.00062 | 0.32 | NO |
| 48 | PLAU | PLAU | PLAU | 8425 | -0.0009 | 0.32 | NO |
| 49 | TYMS | TYMS | TYMS | 8463 | -0.0017 | 0.32 | NO |
| 50 | SMARCA2 | SMARCA2 | SMARCA2 | 8726 | -0.0087 | 0.3 | NO |
| 51 | TFE3 | TFE3 | TFE3 | 9248 | -0.023 | 0.27 | NO |
| 52 | CCND3 | CCND3 | CCND3 | 9374 | -0.026 | 0.27 | NO |
| 53 | XRCC1 | XRCC1 | XRCC1 | 9903 | -0.042 | 0.24 | NO |
| 54 | RANBP1 | RANBP1 | RANBP1 | 9947 | -0.044 | 0.24 | NO |
| 55 | E2F4 | E2F4 | E2F4 | 10656 | -0.066 | 0.21 | NO |
| 56 | RRM2 | RRM2 | RRM2 | 10670 | -0.066 | 0.21 | NO |
| 57 | MCL1 | MCL1 | MCL1 | 11172 | -0.081 | 0.19 | NO |
| 58 | RYBP | RYBP | RYBP | 11485 | -0.093 | 0.18 | NO |
| 59 | CES3 | CES3 | CES3 | 11765 | -0.1 | 0.18 | NO |
| 60 | TFDP2 | TFDP2 | TFDP2 | 11941 | -0.11 | 0.18 | NO |
| 61 | UXT | UXT | UXT | 12072 | -0.11 | 0.18 | NO |
| 62 | CDKN1B | CDKN1B | CDKN1B | 12309 | -0.12 | 0.18 | NO |
| 63 | TRIM28 | TRIM28 | TRIM28 | 12336 | -0.12 | 0.18 | NO |
| 64 | CES1 | CES1 | CES1 | 12635 | -0.14 | 0.18 | NO |
| 65 | CEBPA | CEBPA | CEBPA | 13430 | -0.17 | 0.15 | NO |
| 66 | E2F6 | E2F6 | E2F6 | 13858 | -0.2 | 0.14 | NO |
| 67 | TP73 | TP73 | TP73 | 14150 | -0.22 | 0.14 | NO |
| 68 | CDKN1A | CDKN1A | CDKN1A | 14776 | -0.26 | 0.13 | NO |
| 69 | CDKN2A | CDKN2A | CDKN2A | 15948 | -0.4 | 0.098 | NO |
Figure S69. Get High-res Image This plot shows mRNAseq_cNMF expression data heatmap (on the left) a RunningEnrichmentScore(RES) plot (on the top right) and a Signal2Noise(S2N) plot (on the bottom right) of genes in the pathway: SIG BCR SIGNALING PATHWAY.
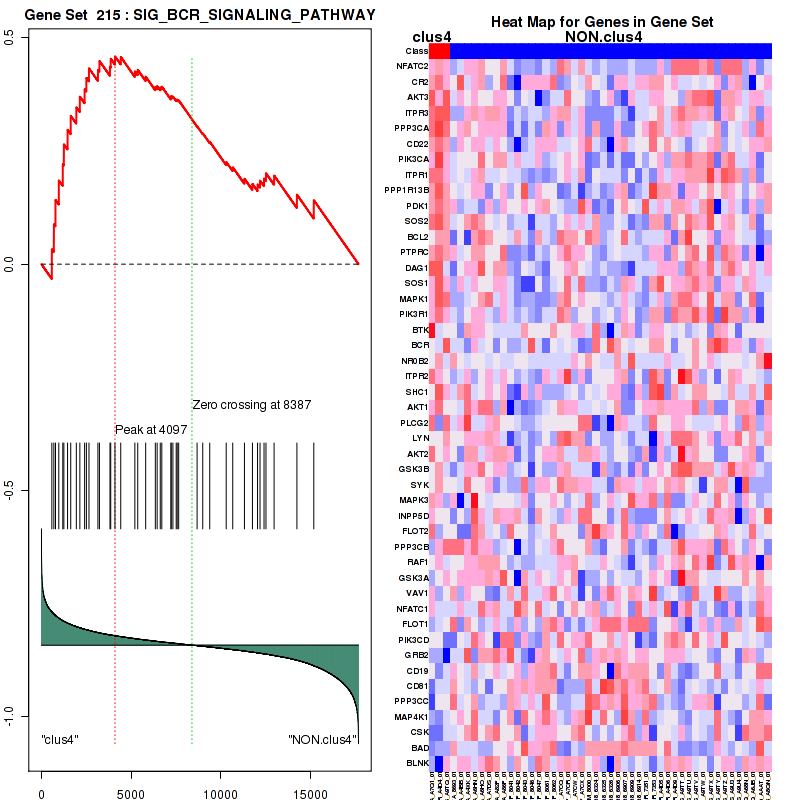
Figure S70. Get High-res Image For the top 5 core enriched genes in the pathway: SIG BCR SIGNALING PATHWAY, this volcano plot shows how much they are up/down-regulated and significant. The significance was calculated by empirical bayesian fit
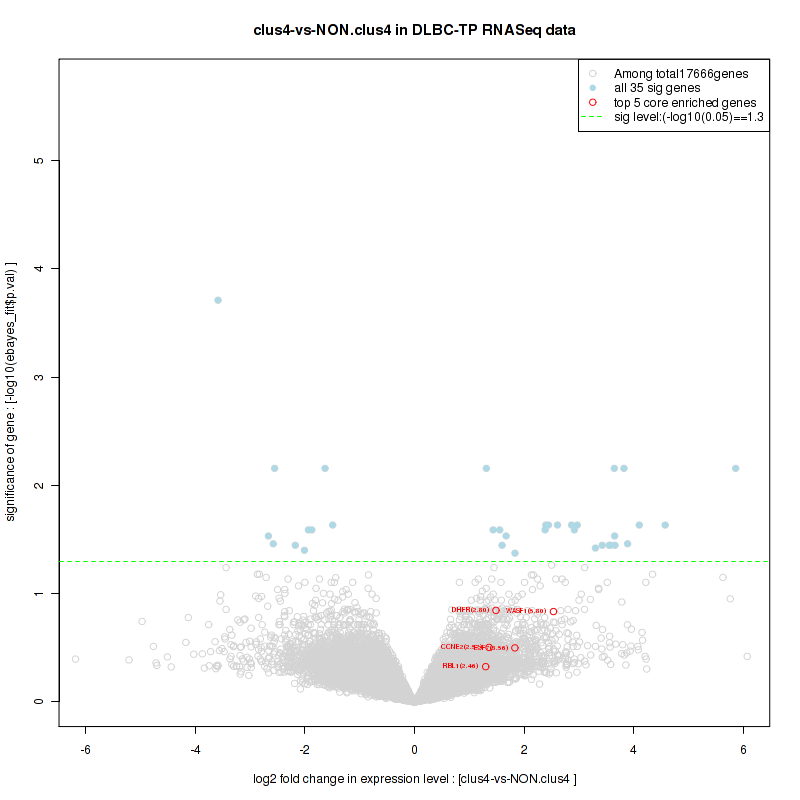
Table S36. Get Full Table This table shows a Running Enrichment Score (RES) of each gene in this pathway, that is, the enrichment score at this point in the ranked list of genes. All genes are ranked by Signal-to-Noise (S2N), a measure of similarity as default and are used to obtain ES matrix of all genes. In this way, GSEA tool uses expression pattern of not only overlapped genes but also not-overlapped genes to produce ES matrix.
| Rank | GENE | SYMBOL | DESC | LIST.LOC | S2N | RES | CORE_ENRICHMENT |
|---|---|---|---|---|---|---|---|
| 1 | CCNT1 | CCNT1 | CCNT1 | 437 | 0.54 | 0.069 | YES |
| 2 | CDKN2B | CDKN2B | CDKN2B | 706 | 0.45 | 0.13 | YES |
| 3 | RBL1 | RBL1 | RBL1 | 855 | 0.42 | 0.2 | YES |
| 4 | E2F5 | E2F5 | E2F5 | 1421 | 0.33 | 0.22 | YES |
| 5 | CDK8 | CDK8 | CDK8 | 1586 | 0.31 | 0.27 | YES |
| 6 | MYC | MYC | MYC | 2029 | 0.26 | 0.29 | YES |
| 7 | WWTR1 | WWTR1 | WWTR1 | 2046 | 0.26 | 0.33 | YES |
| 8 | SMURF2 | SMURF2 | SMURF2 | 2331 | 0.24 | 0.36 | YES |
| 9 | USP9X | USP9X | USP9X | 2635 | 0.22 | 0.38 | YES |
| 10 | TFDP1 | TFDP1 | TFDP1 | 3087 | 0.19 | 0.39 | YES |
| 11 | SKIL | SKIL | SKIL | 3288 | 0.18 | 0.41 | YES |
| 12 | MEN1 | MEN1 | MEN1 | 3333 | 0.17 | 0.44 | YES |
| 13 | PARP1 | PARP1 | PARP1 | 3666 | 0.16 | 0.44 | YES |
| 14 | CCNT2 | CCNT2 | CCNT2 | 3690 | 0.16 | 0.47 | YES |
| 15 | NCOR2 | NCOR2 | NCOR2 | 3779 | 0.15 | 0.49 | YES |
| 16 | TRIM33 | TRIM33 | TRIM33 | 4039 | 0.14 | 0.5 | YES |
| 17 | NCOR1 | NCOR1 | NCOR1 | 4057 | 0.14 | 0.53 | YES |
| 18 | SMAD3 | SMAD3 | SMAD3 | 4146 | 0.14 | 0.54 | YES |
| 19 | SP1 | SP1 | SP1 | 4209 | 0.13 | 0.56 | YES |
| 20 | HDAC1 | HDAC1 | HDAC1 | 4334 | 0.13 | 0.58 | YES |
| 21 | SMAD4 | SMAD4 | SMAD4 | 5657 | 0.08 | 0.52 | NO |
| 22 | PPM1A | PPM1A | PPM1A | 6369 | 0.058 | 0.49 | NO |
| 23 | SERPINE1 | SERPINE1 | SERPINE1 | 6724 | 0.047 | 0.48 | NO |
| 24 | UBE2D1 | UBE2D1 | UBE2D1 | 6972 | 0.04 | 0.47 | NO |
| 25 | SMAD2 | SMAD2 | SMAD2 | 7334 | 0.03 | 0.46 | NO |
| 26 | TGIF2 | TGIF2 | TGIF2 | 7405 | 0.028 | 0.46 | NO |
| 27 | SKI | SKI | SKI | 8070 | 0.0091 | 0.42 | NO |
| 28 | SMAD7 | SMAD7 | SMAD7 | 8366 | 0.00058 | 0.4 | NO |
| 29 | UBE2D3 | UBE2D3 | UBE2D3 | 8737 | -0.0089 | 0.38 | NO |
| 30 | CCNC | CCNC | CCNC | 9988 | -0.045 | 0.32 | NO |
| 31 | E2F4 | E2F4 | E2F4 | 10656 | -0.066 | 0.29 | NO |
| 32 | RPS27A | RPS27A | RPS27A | 10878 | -0.072 | 0.29 | NO |
| 33 | TGIF1 | TGIF1 | TGIF1 | 10953 | -0.074 | 0.3 | NO |
| 34 | CDK9 | CDK9 | CDK9 | 12592 | -0.13 | 0.23 | NO |
| 35 | UBA52 | UBA52 | UBA52 | 12778 | -0.14 | 0.25 | NO |
| 36 | JUNB | JUNB | JUNB | 13228 | -0.16 | 0.25 | NO |
Figure S71. Get High-res Image This plot shows mRNAseq_cNMF expression data heatmap (on the left) a RunningEnrichmentScore(RES) plot (on the top right) and a Signal2Noise(S2N) plot (on the bottom right) of genes in the pathway: PID FANCONI PATHWAY.
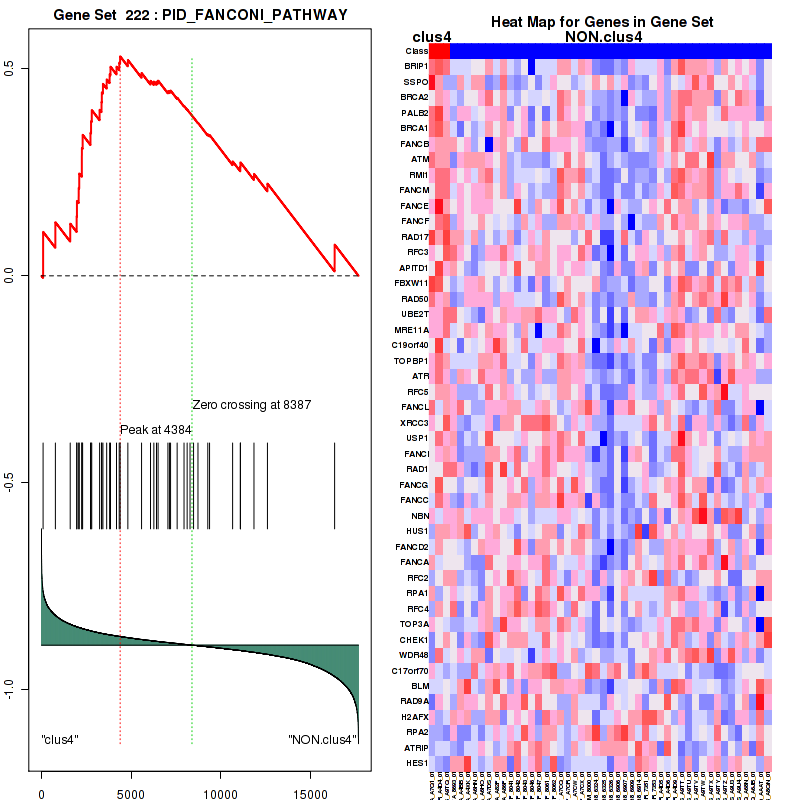
Figure S72. Get High-res Image For the top 5 core enriched genes in the pathway: PID FANCONI PATHWAY, this volcano plot shows how much they are up/down-regulated and significant. The significance was calculated by empirical bayesian fit
Table S37. Get Full Table This table shows a Running Enrichment Score (RES) of each gene in this pathway, that is, the enrichment score at this point in the ranked list of genes. All genes are ranked by Signal-to-Noise (S2N), a measure of similarity as default and are used to obtain ES matrix of all genes. In this way, GSEA tool uses expression pattern of not only overlapped genes but also not-overlapped genes to produce ES matrix.
| Rank | GENE | SYMBOL | DESC | LIST.LOC | S2N | RES | CORE_ENRICHMENT |
|---|---|---|---|---|---|---|---|
| 1 | CLSPN | CLSPN | CLSPN | 496 | 0.52 | 0.048 | YES |
| 2 | ROCK2 | ROCK2 | ROCK2 | 529 | 0.5 | 0.12 | YES |
| 3 | SSPO | SSPO | SSPO | 775 | 0.44 | 0.17 | YES |
| 4 | KIF20A | KIF20A | KIF20A | 1386 | 0.33 | 0.18 | YES |
| 5 | WEE1 | WEE1 | WEE1 | 1587 | 0.31 | 0.22 | YES |
| 6 | INCENP | INCENP | INCENP | 2065 | 0.26 | 0.23 | YES |
| 7 | CENPE | CENPE | CENPE | 2231 | 0.25 | 0.26 | YES |
| 8 | NINL | NINL | NINL | 2504 | 0.23 | 0.28 | YES |
| 9 | SGOL1 | SGOL1 | SGOL1 | 2742 | 0.21 | 0.29 | YES |
| 10 | CDK1 | CDK1 | CDK1 | 2791 | 0.21 | 0.32 | YES |
| 11 | ECT2 | ECT2 | ECT2 | 2885 | 0.2 | 0.35 | YES |
| 12 | KIF2A | KIF2A | KIF2A | 3110 | 0.19 | 0.36 | YES |
| 13 | ERCC6L | ERCC6L | ERCC6L | 3323 | 0.18 | 0.37 | YES |
| 14 | SPC24 | SPC24 | SPC24 | 3332 | 0.17 | 0.4 | YES |
| 15 | FBXW11 | FBXW11 | FBXW11 | 3346 | 0.17 | 0.42 | YES |
| 16 | STAG2 | STAG2 | STAG2 | 3808 | 0.15 | 0.42 | YES |
| 17 | CDC25C | CDC25C | CDC25C | 3891 | 0.15 | 0.44 | YES |
| 18 | FBXO5 | FBXO5 | FBXO5 | 3980 | 0.14 | 0.45 | YES |
| 19 | CDC14B | CDC14B | CDC14B | 4021 | 0.14 | 0.47 | YES |
| 20 | PLK1S1 | PLK1S1 | PLK1S1 | 4159 | 0.14 | 0.48 | YES |
| 21 | PPP1R12A | PPP1R12A | PPP1R12A | 4437 | 0.12 | 0.49 | YES |
| 22 | MLF1IP | MLF1IP | MLF1IP | 4462 | 0.12 | 0.5 | YES |
| 23 | PLK1 | PLK1 | PLK1 | 4476 | 0.12 | 0.52 | YES |
| 24 | GOLGA2 | GOLGA2 | GOLGA2 | 4505 | 0.12 | 0.54 | YES |
| 25 | PRC1 | PRC1 | PRC1 | 5121 | 0.099 | 0.52 | YES |
| 26 | TPX2 | TPX2 | TPX2 | 5134 | 0.098 | 0.53 | YES |
| 27 | CCNB1 | CCNB1 | CCNB1 | 5315 | 0.091 | 0.54 | YES |
| 28 | BUB1B | BUB1B | BUB1B | 5373 | 0.089 | 0.55 | YES |
| 29 | TUBG1 | TUBG1 | TUBG1 | 5584 | 0.083 | 0.55 | YES |
| 30 | ODF2 | ODF2 | ODF2 | 5948 | 0.071 | 0.54 | NO |
| 31 | AURKA | AURKA | AURKA | 6324 | 0.059 | 0.52 | NO |
| 32 | BUB1 | BUB1 | BUB1 | 7280 | 0.032 | 0.47 | NO |
| 33 | PPP1CB | PPP1CB | PPP1CB | 7492 | 0.026 | 0.46 | NO |
| 34 | NDC80 | NDC80 | NDC80 | 7502 | 0.026 | 0.47 | NO |
| 35 | RHOA | RHOA | RHOA | 8307 | 0.0019 | 0.42 | NO |
| 36 | CDC25B | CDC25B | CDC25B | 8343 | 0.00084 | 0.42 | NO |
| 37 | PPP2CA | PPP2CA | PPP2CA | 9437 | -0.028 | 0.36 | NO |
| 38 | TPT1 | TPT1 | TPT1 | 9797 | -0.039 | 0.35 | NO |
| 39 | RAB1A | RAB1A | RAB1A | 10074 | -0.048 | 0.34 | NO |
| 40 | GORASP1 | GORASP1 | GORASP1 | 10438 | -0.059 | 0.33 | NO |
| 41 | CDC20 | CDC20 | CDC20 | 10913 | -0.073 | 0.31 | NO |
| 42 | FZR1 | FZR1 | FZR1 | 11382 | -0.089 | 0.3 | NO |
| 43 | NUDC | NUDC | NUDC | 11772 | -0.1 | 0.29 | NO |
| 44 | PPP2R1A | PPP2R1A | PPP2R1A | 12313 | -0.12 | 0.28 | NO |
| 45 | PAK1 | PAK1 | PAK1 | 13199 | -0.16 | 0.25 | NO |
Figure S73. Get High-res Image This plot shows mRNAseq_cNMF expression data heatmap (on the left) a RunningEnrichmentScore(RES) plot (on the top right) and a Signal2Noise(S2N) plot (on the bottom right) of genes in the pathway: PID E2F PATHWAY.
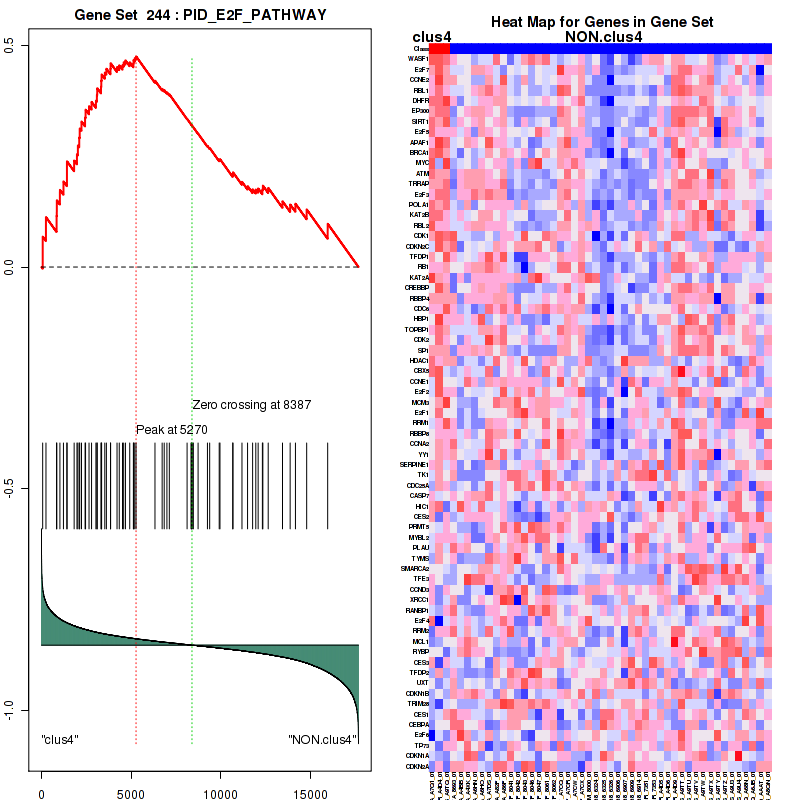
Figure S74. Get High-res Image For the top 5 core enriched genes in the pathway: PID E2F PATHWAY, this volcano plot shows how much they are up/down-regulated and significant. The significance was calculated by empirical bayesian fit

Table S38. Get Full Table This table shows a Running Enrichment Score (RES) of each gene in this pathway, that is, the enrichment score at this point in the ranked list of genes. All genes are ranked by Signal-to-Noise (S2N), a measure of similarity as default and are used to obtain ES matrix of all genes. In this way, GSEA tool uses expression pattern of not only overlapped genes but also not-overlapped genes to produce ES matrix.
| Rank | GENE | SYMBOL | DESC | LIST.LOC | S2N | RES | CORE_ENRICHMENT |
|---|---|---|---|---|---|---|---|
| 1 | PDK4 | PDK4 | PDK4 | 898 | 0.41 | 0.037 | YES |
| 2 | PDPR | PDPR | PDPR | 1450 | 0.32 | 0.075 | YES |
| 3 | NNT | NNT | NNT | 1657 | 0.3 | 0.13 | YES |
| 4 | L2HGDH | L2HGDH | L2HGDH | 1725 | 0.29 | 0.19 | YES |
| 5 | PDP1 | PDP1 | PDP1 | 1841 | 0.28 | 0.24 | YES |
| 6 | PDK1 | PDK1 | PDK1 | 2139 | 0.26 | 0.28 | YES |
| 7 | SLC16A1 | SLC16A1 | SLC16A1 | 2244 | 0.25 | 0.32 | YES |
| 8 | PDP2 | PDP2 | PDP2 | 2411 | 0.23 | 0.36 | YES |
| 9 | DLAT | DLAT | DLAT | 3899 | 0.15 | 0.31 | NO |
| 10 | CS | CS | CS | 4327 | 0.13 | 0.32 | NO |
| 11 | DLD | DLD | DLD | 4967 | 0.1 | 0.3 | NO |
| 12 | FH | FH | FH | 5178 | 0.096 | 0.31 | NO |
| 13 | SUCLA2 | SUCLA2 | SUCLA2 | 5298 | 0.092 | 0.32 | NO |
| 14 | ACO2 | ACO2 | ACO2 | 5495 | 0.085 | 0.33 | NO |
| 15 | PDHA1 | PDHA1 | PDHA1 | 5541 | 0.084 | 0.34 | NO |
| 16 | PDK2 | PDK2 | PDK2 | 5832 | 0.075 | 0.34 | NO |
| 17 | PDK3 | PDK3 | PDK3 | 5952 | 0.071 | 0.35 | NO |
| 18 | SUCLG2 | SUCLG2 | SUCLG2 | 6361 | 0.058 | 0.34 | NO |
| 19 | OGDH | OGDH | OGDH | 6737 | 0.047 | 0.33 | NO |
| 20 | PDHX | PDHX | PDHX | 7027 | 0.038 | 0.32 | NO |
| 21 | IDH3A | IDH3A | IDH3A | 7070 | 0.038 | 0.33 | NO |
| 22 | SDHC | SDHC | SDHC | 7103 | 0.037 | 0.33 | NO |
| 23 | IDH1 | IDH1 | IDH1 | 7241 | 0.033 | 0.33 | NO |
| 24 | SDHD | SDHD | SDHD | 7636 | 0.022 | 0.32 | NO |
| 25 | LDHA | LDHA | LDHA | 7751 | 0.018 | 0.31 | NO |
| 26 | SDHA | SDHA | SDHA | 8234 | 0.0046 | 0.29 | NO |
| 27 | IDH2 | IDH2 | IDH2 | 8257 | 0.004 | 0.29 | NO |
| 28 | MDH2 | MDH2 | MDH2 | 8572 | -0.0044 | 0.27 | NO |
| 29 | DLST | DLST | DLST | 8692 | -0.008 | 0.26 | NO |
| 30 | D2HGDH | D2HGDH | D2HGDH | 9358 | -0.026 | 0.23 | NO |
| 31 | SUCLG1 | SUCLG1 | SUCLG1 | 9448 | -0.029 | 0.23 | NO |
| 32 | LDHB | LDHB | LDHB | 9614 | -0.034 | 0.23 | NO |
| 33 | SLC16A3 | SLC16A3 | SLC16A3 | 10255 | -0.053 | 0.21 | NO |
| 34 | PDHB | PDHB | PDHB | 10740 | -0.068 | 0.19 | NO |
| 35 | SLC16A8 | SLC16A8 | SLC16A8 | 10742 | -0.068 | 0.21 | NO |
| 36 | BSG | BSG | BSG | 11400 | -0.09 | 0.19 | NO |
| 37 | IDH3B | IDH3B | IDH3B | 11927 | -0.11 | 0.18 | NO |
| 38 | SDHB | SDHB | SDHB | 12187 | -0.12 | 0.19 | NO |
| 39 | IDH3G | IDH3G | IDH3G | 12230 | -0.12 | 0.22 | NO |
| 40 | ADHFE1 | ADHFE1 | ADHFE1 | 16148 | -0.43 | 0.086 | NO |
Figure S75. Get High-res Image This plot shows mRNAseq_cNMF expression data heatmap (on the left) a RunningEnrichmentScore(RES) plot (on the top right) and a Signal2Noise(S2N) plot (on the bottom right) of genes in the pathway: PID ATM PATHWAY.
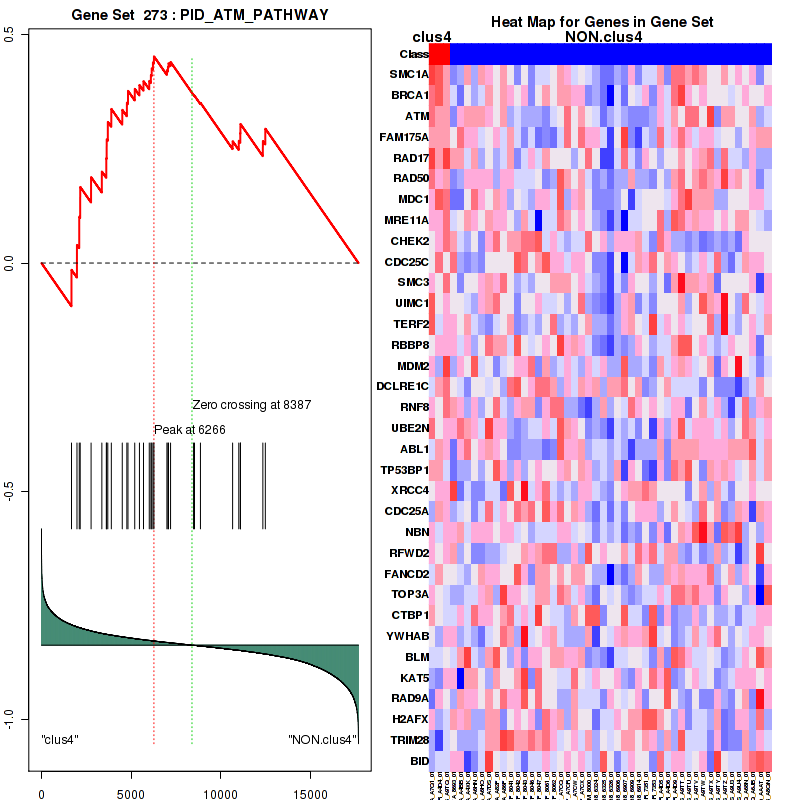
Figure S76. Get High-res Image For the top 5 core enriched genes in the pathway: PID ATM PATHWAY, this volcano plot shows how much they are up/down-regulated and significant. The significance was calculated by empirical bayesian fit

Table S39. Get Full Table This table shows a Running Enrichment Score (RES) of each gene in this pathway, that is, the enrichment score at this point in the ranked list of genes. All genes are ranked by Signal-to-Noise (S2N), a measure of similarity as default and are used to obtain ES matrix of all genes. In this way, GSEA tool uses expression pattern of not only overlapped genes but also not-overlapped genes to produce ES matrix.
| Rank | GENE | SYMBOL | DESC | LIST.LOC | S2N | RES | CORE_ENRICHMENT |
|---|---|---|---|---|---|---|---|
| 1 | GLI2 | GLI2 | GLI2 | 386 | 0.55 | 0.056 | YES |
| 2 | PTCH1 | PTCH1 | PTCH1 | 429 | 0.54 | 0.13 | YES |
| 3 | SSPO | SSPO | SSPO | 775 | 0.44 | 0.17 | YES |
| 4 | STK36 | STK36 | STK36 | 1057 | 0.38 | 0.21 | YES |
| 5 | RAB23 | RAB23 | RAB23 | 1413 | 0.33 | 0.24 | YES |
| 6 | SMO | SMO | SMO | 1831 | 0.28 | 0.25 | YES |
| 7 | KIF3A | KIF3A | KIF3A | 1893 | 0.28 | 0.29 | YES |
| 8 | CSNK1G3 | CSNK1G3 | CSNK1G3 | 2067 | 0.26 | 0.32 | YES |
| 9 | GLI1 | GLI1 | GLI1 | 2129 | 0.26 | 0.35 | YES |
| 10 | RBBP7 | RBBP7 | RBBP7 | 2552 | 0.22 | 0.36 | YES |
| 11 | IFT88 | IFT88 | IFT88 | 3166 | 0.18 | 0.35 | YES |
| 12 | SAP30 | SAP30 | SAP30 | 3234 | 0.18 | 0.37 | YES |
| 13 | IFT172 | IFT172 | IFT172 | 3285 | 0.18 | 0.39 | YES |
| 14 | CREBBP | CREBBP | CREBBP | 3335 | 0.17 | 0.41 | YES |
| 15 | FBXW11 | FBXW11 | FBXW11 | 3346 | 0.17 | 0.44 | YES |
| 16 | RBBP4 | RBBP4 | RBBP4 | 3352 | 0.17 | 0.46 | YES |
| 17 | HDAC1 | HDAC1 | HDAC1 | 4334 | 0.13 | 0.42 | NO |
| 18 | MAP2K1 | MAP2K1 | MAP2K1 | 4974 | 0.1 | 0.4 | NO |
| 19 | GLI3 | GLI3 | GLI3 | 4983 | 0.1 | 0.42 | NO |
| 20 | SIN3B | SIN3B | SIN3B | 5049 | 0.1 | 0.43 | NO |
| 21 | SIN3A | SIN3A | SIN3A | 5469 | 0.086 | 0.42 | NO |
| 22 | XPO1 | XPO1 | XPO1 | 5528 | 0.084 | 0.42 | NO |
| 23 | HDAC2 | HDAC2 | HDAC2 | 5912 | 0.073 | 0.41 | NO |
| 24 | AKT1 | AKT1 | AKT1 | 6343 | 0.059 | 0.4 | NO |
| 25 | CSNK1G2 | CSNK1G2 | CSNK1G2 | 6616 | 0.05 | 0.39 | NO |
| 26 | PRKACA | PRKACA | PRKACA | 6880 | 0.042 | 0.38 | NO |
| 27 | GSK3B | GSK3B | GSK3B | 7214 | 0.034 | 0.37 | NO |
| 28 | FOXA2 | FOXA2 | FOXA2 | 7277 | 0.032 | 0.37 | NO |
| 29 | CSNK1D | CSNK1D | CSNK1D | 7500 | 0.026 | 0.36 | NO |
| 30 | GNB1 | GNB1 | GNB1 | 7715 | 0.019 | 0.35 | NO |
| 31 | SPOP | SPOP | SPOP | 7985 | 0.011 | 0.34 | NO |
| 32 | PIAS1 | PIAS1 | PIAS1 | 8016 | 0.01 | 0.33 | NO |
| 33 | CSNK1A1 | CSNK1A1 | CSNK1A1 | 8174 | 0.0062 | 0.33 | NO |
| 34 | GNAI1 | GNAI1 | GNAI1 | 8943 | -0.015 | 0.28 | NO |
| 35 | CSNK1G1 | CSNK1G1 | CSNK1G1 | 9086 | -0.019 | 0.28 | NO |
| 36 | GNG2 | GNG2 | GNG2 | 9113 | -0.02 | 0.28 | NO |
| 37 | GNAI3 | GNAI3 | GNAI3 | 9187 | -0.021 | 0.28 | NO |
| 38 | SUFU | SUFU | SUFU | 9567 | -0.032 | 0.26 | NO |
| 39 | PRKCD | PRKCD | PRKCD | 9603 | -0.033 | 0.26 | NO |
| 40 | GNAI2 | GNAI2 | GNAI2 | 10588 | -0.064 | 0.22 | NO |
| 41 | CSNK1E | CSNK1E | CSNK1E | 10679 | -0.066 | 0.22 | NO |
| 42 | GNAZ | GNAZ | GNAZ | 12186 | -0.12 | 0.15 | NO |
| 43 | SAP18 | SAP18 | SAP18 | 12697 | -0.14 | 0.14 | NO |
| 44 | ARRB2 | ARRB2 | ARRB2 | 13041 | -0.16 | 0.15 | NO |
| 45 | LGALS3 | LGALS3 | LGALS3 | 13466 | -0.18 | 0.15 | NO |
| 46 | MTSS1 | MTSS1 | MTSS1 | 14822 | -0.27 | 0.11 | NO |
| 47 | GNAO1 | GNAO1 | GNAO1 | 15747 | -0.37 | 0.11 | NO |
Figure S77. Get High-res Image This plot shows mRNAseq_cNMF expression data heatmap (on the left) a RunningEnrichmentScore(RES) plot (on the top right) and a Signal2Noise(S2N) plot (on the bottom right) of genes in the pathway: PID HDAC CLASSI PATHWAY.
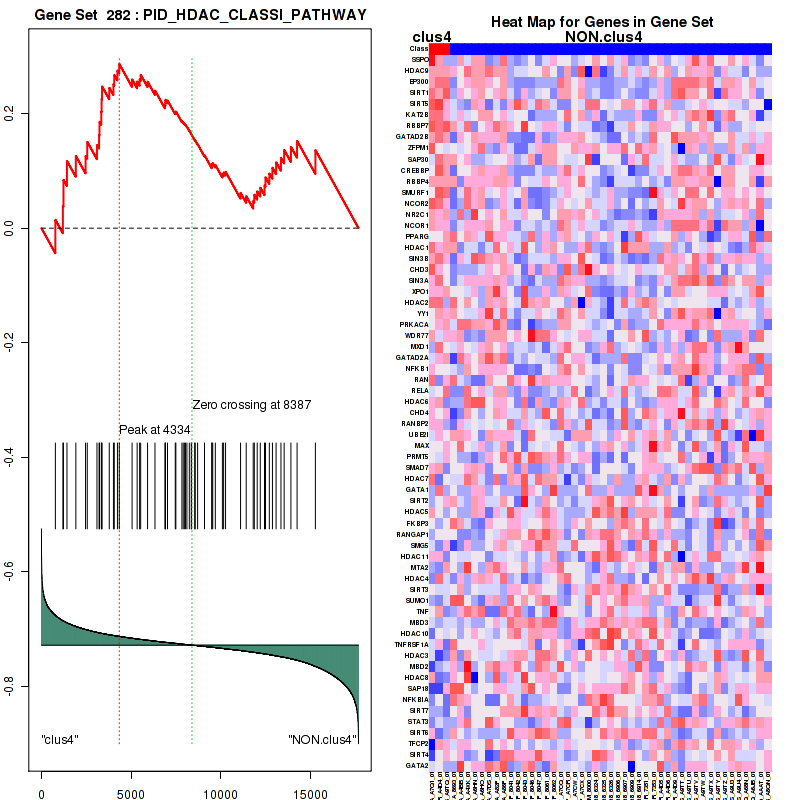
Figure S78. Get High-res Image For the top 5 core enriched genes in the pathway: PID HDAC CLASSI PATHWAY, this volcano plot shows how much they are up/down-regulated and significant. The significance was calculated by empirical bayesian fit

Table S40. Get Full Table This table shows a Running Enrichment Score (RES) of each gene in this pathway, that is, the enrichment score at this point in the ranked list of genes. All genes are ranked by Signal-to-Noise (S2N), a measure of similarity as default and are used to obtain ES matrix of all genes. In this way, GSEA tool uses expression pattern of not only overlapped genes but also not-overlapped genes to produce ES matrix.
| Rank | GENE | SYMBOL | DESC | LIST.LOC | S2N | RES | CORE_ENRICHMENT |
|---|---|---|---|---|---|---|---|
| 1 | SMC1A | SMC1A | SMC1A | 1673 | 0.3 | -0.015 | YES |
| 2 | BRCA1 | BRCA1 | BRCA1 | 1977 | 0.27 | 0.04 | YES |
| 3 | ATM | ATM | ATM | 2105 | 0.26 | 0.1 | YES |
| 4 | FAM175A | FAM175A | FAM175A | 2159 | 0.25 | 0.17 | YES |
| 5 | RAD17 | RAD17 | RAD17 | 2764 | 0.21 | 0.19 | YES |
| 6 | RAD50 | RAD50 | RAD50 | 3364 | 0.17 | 0.2 | YES |
| 7 | MDC1 | MDC1 | MDC1 | 3613 | 0.16 | 0.23 | YES |
| 8 | MRE11A | MRE11A | MRE11A | 3634 | 0.16 | 0.27 | YES |
| 9 | CHEK2 | CHEK2 | CHEK2 | 3697 | 0.16 | 0.31 | YES |
| 10 | CDC25C | CDC25C | CDC25C | 3891 | 0.15 | 0.34 | YES |
| 11 | SMC3 | SMC3 | SMC3 | 4503 | 0.12 | 0.34 | YES |
| 12 | UIMC1 | UIMC1 | UIMC1 | 4759 | 0.11 | 0.35 | YES |
| 13 | TERF2 | TERF2 | TERF2 | 4821 | 0.11 | 0.38 | YES |
| 14 | RBBP8 | RBBP8 | RBBP8 | 5198 | 0.096 | 0.38 | YES |
| 15 | MDM2 | MDM2 | MDM2 | 5458 | 0.086 | 0.39 | YES |
| 16 | DCLRE1C | DCLRE1C | DCLRE1C | 5685 | 0.079 | 0.4 | YES |
| 17 | RNF8 | RNF8 | RNF8 | 6005 | 0.07 | 0.4 | YES |
| 18 | UBE2N | UBE2N | UBE2N | 6097 | 0.066 | 0.41 | YES |
| 19 | ABL1 | ABL1 | ABL1 | 6142 | 0.065 | 0.43 | YES |
| 20 | TP53BP1 | TP53BP1 | TP53BP1 | 6212 | 0.062 | 0.44 | YES |
| 21 | XRCC4 | XRCC4 | XRCC4 | 6266 | 0.061 | 0.45 | YES |
| 22 | CDC25A | CDC25A | CDC25A | 6989 | 0.04 | 0.42 | NO |
| 23 | NBN | NBN | NBN | 7047 | 0.038 | 0.43 | NO |
| 24 | RFWD2 | RFWD2 | RFWD2 | 7079 | 0.037 | 0.44 | NO |
| 25 | FANCD2 | FANCD2 | FANCD2 | 7194 | 0.034 | 0.44 | NO |
| 26 | TOP3A | TOP3A | TOP3A | 8474 | -0.0021 | 0.37 | NO |
| 27 | CTBP1 | CTBP1 | CTBP1 | 8527 | -0.0036 | 0.37 | NO |
| 28 | YWHAB | YWHAB | YWHAB | 8857 | -0.012 | 0.35 | NO |
| 29 | BLM | BLM | BLM | 10652 | -0.066 | 0.27 | NO |
| 30 | KAT5 | KAT5 | KAT5 | 10995 | -0.076 | 0.27 | NO |
| 31 | RAD9A | RAD9A | RAD9A | 11080 | -0.078 | 0.28 | NO |
| 32 | H2AFX | H2AFX | H2AFX | 11087 | -0.078 | 0.3 | NO |
| 33 | TRIM28 | TRIM28 | TRIM28 | 12336 | -0.12 | 0.27 | NO |
| 34 | BID | BID | BID | 12473 | -0.13 | 0.3 | NO |
Figure S79. Get High-res Image This plot shows mRNAseq_cNMF expression data heatmap (on the left) a RunningEnrichmentScore(RES) plot (on the top right) and a Signal2Noise(S2N) plot (on the bottom right) of genes in the pathway: PID PLK1 PATHWAY.

Figure S80. Get High-res Image For the top 5 core enriched genes in the pathway: PID PLK1 PATHWAY, this volcano plot shows how much they are up/down-regulated and significant. The significance was calculated by empirical bayesian fit
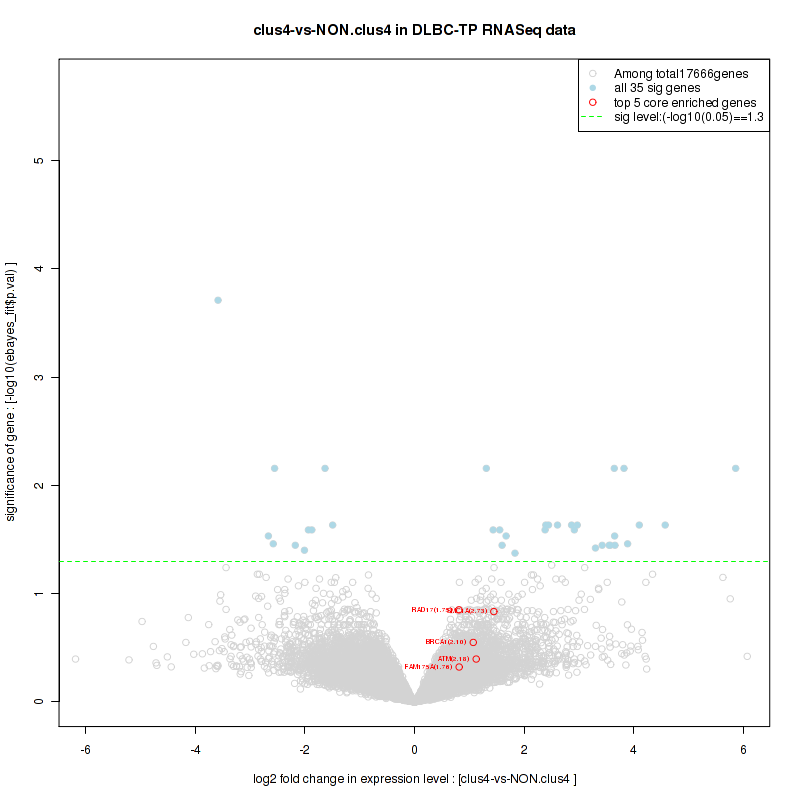
For the top enriched genes, if you want to check whether they are
-
up-regulated, please check the list of up-regulated genes
-
down-regulated, please check the list of down-regulated genes
For the top enriched genes, if you want to check whether they are
-
highly expressed genes, please check the list of high (top 30%) expressed genes
-
low expressed genes, please check the list of low (bottom 30%) expressed genes
An expression pattern of top(30%)/middle(30%)/low(30%) in this subtype against other subtypes is available in a heatmap
For the top enriched genes, if you want to check whether they are
-
significantly differently expressed genes by eBayes lm fit, please check the list of significant genes
Table 7. Get Full Table This table shows top 10 pathways which are significantly enriched in cluster clus5. It displays only significant gene sets satisfying nom.p.val.threshold (-1), fwer.p.val.threshold (-1) , fdr.q.val.threshold (0.25) and the default table is sorted by Normalized Enrichment Score (NES). Further details on NES statistics, please visit The Broad GSEA website.
| GeneSet(GS) | Size(#genes) | genes.ES.table | ES | NES | NOM.p.val | FDR.q.val | FWER.p.val | Tag.. | Gene.. | Signal | FDR..median. | glob.p.val |
|---|---|---|---|---|---|---|---|---|---|---|---|---|
| KEGG OXIDATIVE PHOSPHORYLATION | 111 | genes.ES.table | 0.61 | 1.8 | 0.0043 | 0.99 | 0.49 | 0.6 | 0.2 | 0.48 | 0 | 0.19 |
| KEGG RIBOSOME | 85 | genes.ES.table | 0.73 | 1.6 | 0.036 | 0.35 | 0.93 | 0.91 | 0.24 | 0.7 | 0.2 | 0.071 |
| KEGG PARKINSONS DISEASE | 108 | genes.ES.table | 0.54 | 1.7 | 0.023 | 0.87 | 0.7 | 0.65 | 0.27 | 0.48 | 0.31 | 0.2 |
| KEGG HUNTINGTONS DISEASE | 165 | genes.ES.table | 0.35 | 1.6 | 0.048 | 0.27 | 0.94 | 0.52 | 0.25 | 0.39 | 0.16 | 0.041 |
| REACTOME TRANSLATION | 146 | genes.ES.table | 0.6 | 1.7 | 0.027 | 0.47 | 0.74 | 0.66 | 0.25 | 0.5 | 0.18 | 0.1 |
| REACTOME FORMATION OF THE TERNARY COMPLEX AND SUBSEQUENTLY THE 43S COMPLEX | 49 | genes.ES.table | 0.63 | 1.6 | 0.064 | 0.39 | 0.93 | 0.8 | 0.23 | 0.62 | 0.22 | 0.088 |
| REACTOME TCA CYCLE AND RESPIRATORY ELECTRON TRANSPORT | 115 | genes.ES.table | 0.49 | 1.7 | 0.027 | 0.59 | 0.72 | 0.58 | 0.24 | 0.45 | 0.22 | 0.12 |
| REACTOME SRP DEPENDENT COTRANSLATIONAL PROTEIN TARGETING TO MEMBRANE | 109 | genes.ES.table | 0.65 | 1.7 | 0.026 | 0.45 | 0.83 | 0.72 | 0.24 | 0.56 | 0.21 | 0.11 |
| REACTOME ACTIVATION OF NF KAPPAB IN B CELLS | 61 | genes.ES.table | 0.41 | 1.6 | 0.036 | 0.42 | 0.88 | 0.66 | 0.34 | 0.43 | 0.21 | 0.098 |
| REACTOME ACTIVATION OF THE MRNA UPON BINDING OF THE CAP BINDING COMPLEX AND EIFS AND SUBSEQUENT BINDING TO 43S | 57 | genes.ES.table | 0.58 | 1.6 | 0.091 | 0.3 | 0.94 | 0.68 | 0.23 | 0.53 | 0.17 | 0.057 |
Table S41. Get Full Table This table shows a Running Enrichment Score (RES) of each gene in this pathway, that is, the enrichment score at this point in the ranked list of genes. All genes are ranked by Signal-to-Noise (S2N), a measure of similarity as default and are used to obtain ES matrix of all genes. In this way, GSEA tool uses expression pattern of not only overlapped genes but also not-overlapped genes to produce ES matrix.
| Rank | GENE | SYMBOL | DESC | LIST.LOC | S2N | RES | CORE_ENRICHMENT |
|---|---|---|---|---|---|---|---|
| 1 | COX4I2 | COX4I2 | COX4I2 | 324 | 0.44 | 0.0092 | YES |
| 2 | COX7A1 | COX7A1 | COX7A1 | 368 | 0.42 | 0.033 | YES |
| 3 | NDUFS8 | NDUFS8 | NDUFS8 | 933 | 0.29 | 0.019 | YES |
| 4 | LHPP | LHPP | LHPP | 1002 | 0.28 | 0.033 | YES |
| 5 | NDUFA11 | NDUFA11 | NDUFA11 | 1024 | 0.28 | 0.049 | YES |
| 6 | NDUFA3 | NDUFA3 | NDUFA3 | 1039 | 0.28 | 0.065 | YES |
| 7 | NDUFB7 | NDUFB7 | NDUFB7 | 1044 | 0.28 | 0.082 | YES |
| 8 | NDUFB1 | NDUFB1 | NDUFB1 | 1100 | 0.27 | 0.096 | YES |
| 9 | ATP5D | ATP5D | ATP5D | 1124 | 0.27 | 0.11 | YES |
| 10 | ATP5O | ATP5O | ATP5O | 1217 | 0.26 | 0.12 | YES |
| 11 | NDUFS6 | NDUFS6 | NDUFS6 | 1237 | 0.26 | 0.14 | YES |
| 12 | COX6B1 | COX6B1 | COX6B1 | 1340 | 0.24 | 0.15 | YES |
| 13 | UQCRB | UQCRB | UQCRB | 1443 | 0.24 | 0.16 | YES |
| 14 | NDUFV3 | NDUFV3 | NDUFV3 | 1505 | 0.23 | 0.17 | YES |
| 15 | NDUFS7 | NDUFS7 | NDUFS7 | 1535 | 0.23 | 0.18 | YES |
| 16 | NDUFAB1 | NDUFAB1 | NDUFAB1 | 1549 | 0.23 | 0.19 | YES |
| 17 | ATP5E | ATP5E | ATP5E | 1616 | 0.22 | 0.2 | YES |
| 18 | COX5B | COX5B | COX5B | 1635 | 0.22 | 0.22 | YES |
| 19 | NDUFA1 | NDUFA1 | NDUFA1 | 1670 | 0.22 | 0.23 | YES |
| 20 | COX6C | COX6C | COX6C | 1697 | 0.22 | 0.24 | YES |
| 21 | UQCRQ | UQCRQ | UQCRQ | 1707 | 0.22 | 0.25 | YES |
| 22 | NDUFA2 | NDUFA2 | NDUFA2 | 1724 | 0.21 | 0.26 | YES |
| 23 | NDUFA8 | NDUFA8 | NDUFA8 | 1773 | 0.21 | 0.27 | YES |
| 24 | ATP5J | ATP5J | ATP5J | 1809 | 0.21 | 0.28 | YES |
| 25 | UQCR11 | UQCR11 | UQCR11 | 1908 | 0.2 | 0.29 | YES |
| 26 | NDUFB10 | NDUFB10 | NDUFB10 | 1927 | 0.2 | 0.3 | YES |
| 27 | ATP5I | ATP5I | ATP5I | 1961 | 0.2 | 0.31 | YES |
| 28 | UQCRHL | UQCRHL | UQCRHL | 1964 | 0.2 | 0.33 | YES |
| 29 | NDUFC2 | NDUFC2 | NDUFC2 | 1988 | 0.2 | 0.34 | YES |
| 30 | UQCRH | UQCRH | UQCRH | 2004 | 0.2 | 0.35 | YES |
| 31 | ATP5L | ATP5L | ATP5L | 2044 | 0.19 | 0.36 | YES |
| 32 | COX4I1 | COX4I1 | COX4I1 | 2052 | 0.19 | 0.37 | YES |
| 33 | NDUFS4 | NDUFS4 | NDUFS4 | 2070 | 0.19 | 0.38 | YES |
| 34 | ATP6V1C2 | ATP6V1C2 | ATP6V1C2 | 2129 | 0.19 | 0.39 | YES |
| 35 | NDUFA4L2 | NDUFA4L2 | NDUFA4L2 | 2141 | 0.19 | 0.4 | YES |
| 36 | ATP6V1E2 | ATP6V1E2 | ATP6V1E2 | 2177 | 0.18 | 0.41 | YES |
| 37 | NDUFB9 | NDUFB9 | NDUFB9 | 2180 | 0.18 | 0.42 | YES |
| 38 | NDUFV1 | NDUFV1 | NDUFV1 | 2262 | 0.18 | 0.43 | YES |
| 39 | NDUFS3 | NDUFS3 | NDUFS3 | 2282 | 0.18 | 0.44 | YES |
| 40 | NDUFC1 | NDUFC1 | NDUFC1 | 2391 | 0.17 | 0.44 | YES |
| 41 | COX6A1 | COX6A1 | COX6A1 | 2407 | 0.17 | 0.45 | YES |
| 42 | UQCR10 | UQCR10 | UQCR10 | 2443 | 0.17 | 0.46 | YES |
| 43 | COX17 | COX17 | COX17 | 2472 | 0.17 | 0.47 | YES |
| 44 | COX7C | COX7C | COX7C | 2542 | 0.16 | 0.48 | YES |
| 45 | ATP5G2 | ATP5G2 | ATP5G2 | 2544 | 0.16 | 0.49 | YES |
| 46 | NDUFB2 | NDUFB2 | NDUFB2 | 2565 | 0.16 | 0.5 | YES |
| 47 | COX7A2 | COX7A2 | COX7A2 | 2567 | 0.16 | 0.5 | YES |
| 48 | ATP5H | ATP5H | ATP5H | 2707 | 0.16 | 0.51 | YES |
| 49 | COX7B | COX7B | COX7B | 2719 | 0.16 | 0.52 | YES |
| 50 | COX8A | COX8A | COX8A | 2744 | 0.16 | 0.52 | YES |
| 51 | NDUFS5 | NDUFS5 | NDUFS5 | 2870 | 0.15 | 0.53 | YES |
| 52 | NDUFA7 | NDUFA7 | NDUFA7 | 2877 | 0.15 | 0.54 | YES |
| 53 | ATP6V1G3 | ATP6V1G3 | ATP6V1G3 | 2958 | 0.15 | 0.54 | YES |
| 54 | NDUFA9 | NDUFA9 | NDUFA9 | 2983 | 0.14 | 0.55 | YES |
| 55 | ATP5G1 | ATP5G1 | ATP5G1 | 3106 | 0.14 | 0.55 | YES |
| 56 | ATP6V0D1 | ATP6V0D1 | ATP6V0D1 | 3107 | 0.14 | 0.56 | YES |
| 57 | ATP5J2 | ATP5J2 | ATP5J2 | 3121 | 0.14 | 0.57 | YES |
| 58 | NDUFB5 | NDUFB5 | NDUFB5 | 3316 | 0.13 | 0.56 | YES |
| 59 | UQCRC1 | UQCRC1 | UQCRC1 | 3365 | 0.13 | 0.57 | YES |
| 60 | NDUFA5 | NDUFA5 | NDUFA5 | 3406 | 0.13 | 0.57 | YES |
| 61 | ATP6V1B1 | ATP6V1B1 | ATP6V1B1 | 3502 | 0.12 | 0.58 | YES |
| 62 | NDUFA4 | NDUFA4 | NDUFA4 | 3503 | 0.12 | 0.58 | YES |
| 63 | COX5A | COX5A | COX5A | 3586 | 0.12 | 0.59 | YES |
| 64 | UQCRFS1 | UQCRFS1 | UQCRFS1 | 3618 | 0.12 | 0.59 | YES |
| 65 | NDUFA6 | NDUFA6 | NDUFA6 | 3621 | 0.12 | 0.6 | YES |
| 66 | NDUFB6 | NDUFB6 | NDUFB6 | 3624 | 0.12 | 0.61 | YES |
| 67 | COX7A2L | COX7A2L | COX7A2L | 3845 | 0.11 | 0.6 | NO |
| 68 | NDUFB8 | NDUFB8 | NDUFB8 | 4089 | 0.099 | 0.59 | NO |
| 69 | ATP5F1 | ATP5F1 | ATP5F1 | 4134 | 0.097 | 0.6 | NO |
| 70 | NDUFV2 | NDUFV2 | NDUFV2 | 4209 | 0.095 | 0.6 | NO |
| 71 | ATP6V1E1 | ATP6V1E1 | ATP6V1E1 | 4277 | 0.093 | 0.6 | NO |
| 72 | ATP6V0E1 | ATP6V0E1 | ATP6V0E1 | 4443 | 0.087 | 0.6 | NO |
| 73 | ATP5G3 | ATP5G3 | ATP5G3 | 4470 | 0.086 | 0.6 | NO |
| 74 | ATP6V1D | ATP6V1D | ATP6V1D | 4623 | 0.08 | 0.6 | NO |
| 75 | NDUFB3 | NDUFB3 | NDUFB3 | 4742 | 0.076 | 0.59 | NO |
| 76 | ATP6V0E2 | ATP6V0E2 | ATP6V0E2 | 5048 | 0.066 | 0.58 | NO |
| 77 | ATP6V0B | ATP6V0B | ATP6V0B | 5053 | 0.066 | 0.58 | NO |
| 78 | ATP6V0A1 | ATP6V0A1 | ATP6V0A1 | 5185 | 0.062 | 0.58 | NO |
| 79 | NDUFA10 | NDUFA10 | NDUFA10 | 5207 | 0.062 | 0.58 | NO |
| 80 | ATP6V0C | ATP6V0C | ATP6V0C | 5980 | 0.038 | 0.54 | NO |
| 81 | PPA2 | PPA2 | PPA2 | 6051 | 0.036 | 0.54 | NO |
| 82 | ATP6V1H | ATP6V1H | ATP6V1H | 6153 | 0.033 | 0.54 | NO |
| 83 | NDUFS2 | NDUFS2 | NDUFS2 | 6211 | 0.031 | 0.54 | NO |
| 84 | ATP5C1 | ATP5C1 | ATP5C1 | 6314 | 0.028 | 0.53 | NO |
| 85 | TCIRG1 | TCIRG1 | TCIRG1 | 6317 | 0.028 | 0.53 | NO |
| 86 | ATP6AP1 | ATP6AP1 | ATP6AP1 | 6483 | 0.023 | 0.52 | NO |
| 87 | SDHB | SDHB | SDHB | 6491 | 0.022 | 0.53 | NO |
| 88 | CYC1 | CYC1 | CYC1 | 6495 | 0.022 | 0.53 | NO |
| 89 | SDHC | SDHC | SDHC | 6587 | 0.02 | 0.52 | NO |
| 90 | ATP5B | ATP5B | ATP5B | 6860 | 0.012 | 0.51 | NO |
| 91 | ATP6V1G2 | ATP6V1G2 | ATP6V1G2 | 6934 | 0.0093 | 0.5 | NO |
| 92 | ATP6V1F | ATP6V1F | ATP6V1F | 7266 | -0.00032 | 0.49 | NO |
| 93 | NDUFB4 | NDUFB4 | NDUFB4 | 7271 | -0.00053 | 0.49 | NO |
| 94 | COX15 | COX15 | COX15 | 7621 | -0.011 | 0.47 | NO |
| 95 | PPA1 | PPA1 | PPA1 | 7672 | -0.012 | 0.46 | NO |
| 96 | SDHA | SDHA | SDHA | 7733 | -0.015 | 0.46 | NO |
| 97 | UQCRC2 | UQCRC2 | UQCRC2 | 8306 | -0.033 | 0.43 | NO |
| 98 | ATP5A1 | ATP5A1 | ATP5A1 | 8489 | -0.037 | 0.42 | NO |
| 99 | COX11 | COX11 | COX11 | 8513 | -0.038 | 0.42 | NO |
| 100 | ATP6V1G1 | ATP6V1G1 | ATP6V1G1 | 8609 | -0.04 | 0.42 | NO |
| 101 | ATP4A | ATP4A | ATP4A | 8666 | -0.042 | 0.42 | NO |
| 102 | ATP6V0A2 | ATP6V0A2 | ATP6V0A2 | 9799 | -0.079 | 0.36 | NO |
| 103 | ATP6V1A | ATP6V1A | ATP6V1A | 9802 | -0.079 | 0.37 | NO |
| 104 | SDHD | SDHD | SDHD | 9823 | -0.08 | 0.37 | NO |
| 105 | COX10 | COX10 | COX10 | 10236 | -0.092 | 0.35 | NO |
| 106 | ATP6V0D2 | ATP6V0D2 | ATP6V0D2 | 10657 | -0.1 | 0.34 | NO |
| 107 | ATP6V1C1 | ATP6V1C1 | ATP6V1C1 | 10928 | -0.11 | 0.33 | NO |
| 108 | ATP6V1B2 | ATP6V1B2 | ATP6V1B2 | 11227 | -0.12 | 0.32 | NO |
| 109 | COX6B2 | COX6B2 | COX6B2 | 11541 | -0.13 | 0.31 | NO |
| 110 | NDUFS1 | NDUFS1 | NDUFS1 | 13097 | -0.19 | 0.23 | NO |
| 111 | ATP4B | ATP4B | ATP4B | 16522 | -0.47 | 0.065 | NO |
Figure S81. Get High-res Image This plot shows mRNAseq_cNMF expression data heatmap (on the left) a RunningEnrichmentScore(RES) plot (on the top right) and a Signal2Noise(S2N) plot (on the bottom right) of genes in the pathway: KEGG OXIDATIVE PHOSPHORYLATION.
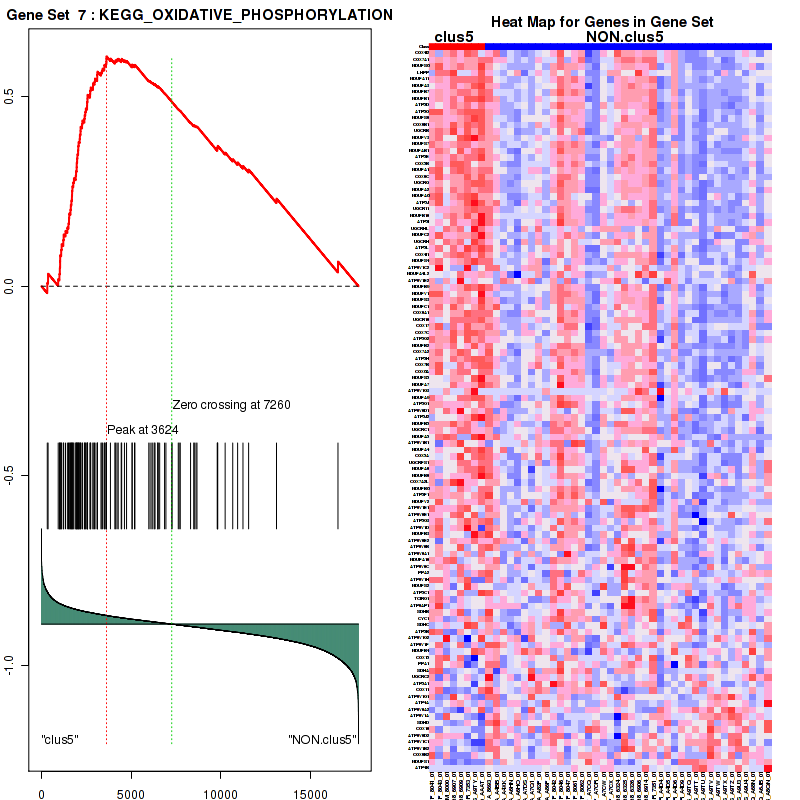
Figure S82. Get High-res Image For the top 5 core enriched genes in the pathway: KEGG OXIDATIVE PHOSPHORYLATION, this volcano plot shows how much they are up/down-regulated and significant. The significance was calculated by empirical bayesian fit
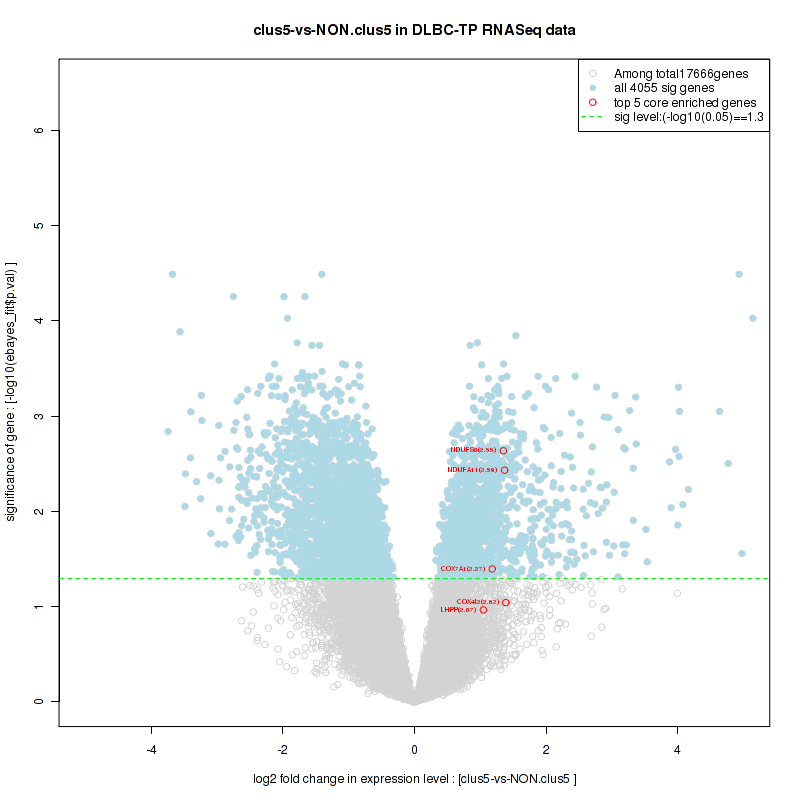
Table S42. Get Full Table This table shows a Running Enrichment Score (RES) of each gene in this pathway, that is, the enrichment score at this point in the ranked list of genes. All genes are ranked by Signal-to-Noise (S2N), a measure of similarity as default and are used to obtain ES matrix of all genes. In this way, GSEA tool uses expression pattern of not only overlapped genes but also not-overlapped genes to produce ES matrix.
| Rank | GENE | SYMBOL | DESC | LIST.LOC | S2N | RES | CORE_ENRICHMENT |
|---|---|---|---|---|---|---|---|
| 1 | COX4I2 | COX4I2 | COX4I2 | 324 | 0.44 | 0.0096 | YES |
| 2 | COX7A1 | COX7A1 | COX7A1 | 368 | 0.42 | 0.034 | YES |
| 3 | SLC25A4 | SLC25A4 | SLC25A4 | 683 | 0.33 | 0.037 | YES |
| 4 | SNCAIP | SNCAIP | SNCAIP | 764 | 0.32 | 0.052 | YES |
| 5 | NDUFS8 | NDUFS8 | NDUFS8 | 933 | 0.29 | 0.061 | YES |
| 6 | NDUFA3 | NDUFA3 | NDUFA3 | 1039 | 0.28 | 0.073 | YES |
| 7 | NDUFB7 | NDUFB7 | NDUFB7 | 1044 | 0.28 | 0.09 | YES |
| 8 | NDUFB1 | NDUFB1 | NDUFB1 | 1100 | 0.27 | 0.1 | YES |
| 9 | ATP5D | ATP5D | ATP5D | 1124 | 0.27 | 0.12 | YES |
| 10 | ATP5O | ATP5O | ATP5O | 1217 | 0.26 | 0.13 | YES |
| 11 | NDUFS6 | NDUFS6 | NDUFS6 | 1237 | 0.26 | 0.14 | YES |
| 12 | COX6B1 | COX6B1 | COX6B1 | 1340 | 0.24 | 0.16 | YES |
| 13 | UQCRB | UQCRB | UQCRB | 1443 | 0.24 | 0.16 | YES |
| 14 | NDUFV3 | NDUFV3 | NDUFV3 | 1505 | 0.23 | 0.18 | YES |
| 15 | NDUFS7 | NDUFS7 | NDUFS7 | 1535 | 0.23 | 0.19 | YES |
| 16 | NDUFAB1 | NDUFAB1 | NDUFAB1 | 1549 | 0.23 | 0.2 | YES |
| 17 | ATP5E | ATP5E | ATP5E | 1616 | 0.22 | 0.21 | YES |
| 18 | COX5B | COX5B | COX5B | 1635 | 0.22 | 0.22 | YES |
| 19 | NDUFA1 | NDUFA1 | NDUFA1 | 1670 | 0.22 | 0.24 | YES |
| 20 | COX6C | COX6C | COX6C | 1697 | 0.22 | 0.25 | YES |
| 21 | UQCRQ | UQCRQ | UQCRQ | 1707 | 0.22 | 0.26 | YES |
| 22 | NDUFA2 | NDUFA2 | NDUFA2 | 1724 | 0.21 | 0.27 | YES |
| 23 | NDUFA8 | NDUFA8 | NDUFA8 | 1773 | 0.21 | 0.28 | YES |
| 24 | ATP5J | ATP5J | ATP5J | 1809 | 0.21 | 0.3 | YES |
| 25 | UQCR11 | UQCR11 | UQCR11 | 1908 | 0.2 | 0.3 | YES |
| 26 | NDUFB10 | NDUFB10 | NDUFB10 | 1927 | 0.2 | 0.32 | YES |
| 27 | UQCRHL | UQCRHL | UQCRHL | 1964 | 0.2 | 0.32 | YES |
| 28 | NDUFC2 | NDUFC2 | NDUFC2 | 1988 | 0.2 | 0.34 | YES |
| 29 | UQCRH | UQCRH | UQCRH | 2004 | 0.2 | 0.35 | YES |
| 30 | COX4I1 | COX4I1 | COX4I1 | 2052 | 0.19 | 0.36 | YES |
| 31 | NDUFS4 | NDUFS4 | NDUFS4 | 2070 | 0.19 | 0.37 | YES |
| 32 | NDUFA4L2 | NDUFA4L2 | NDUFA4L2 | 2141 | 0.19 | 0.38 | YES |
| 33 | NDUFB9 | NDUFB9 | NDUFB9 | 2180 | 0.18 | 0.39 | YES |
| 34 | NDUFV1 | NDUFV1 | NDUFV1 | 2262 | 0.18 | 0.39 | YES |
| 35 | NDUFS3 | NDUFS3 | NDUFS3 | 2282 | 0.18 | 0.4 | YES |
| 36 | NDUFC1 | NDUFC1 | NDUFC1 | 2391 | 0.17 | 0.41 | YES |
| 37 | COX6A1 | COX6A1 | COX6A1 | 2407 | 0.17 | 0.42 | YES |
| 38 | UQCR10 | UQCR10 | UQCR10 | 2443 | 0.17 | 0.43 | YES |
| 39 | COX7C | COX7C | COX7C | 2542 | 0.16 | 0.43 | YES |
| 40 | ATP5G2 | ATP5G2 | ATP5G2 | 2544 | 0.16 | 0.44 | YES |
| 41 | NDUFB2 | NDUFB2 | NDUFB2 | 2565 | 0.16 | 0.45 | YES |
| 42 | COX7A2 | COX7A2 | COX7A2 | 2567 | 0.16 | 0.46 | YES |
| 43 | ATP5H | ATP5H | ATP5H | 2707 | 0.16 | 0.46 | YES |
| 44 | COX7B | COX7B | COX7B | 2719 | 0.16 | 0.47 | YES |
| 45 | COX8A | COX8A | COX8A | 2744 | 0.16 | 0.48 | YES |
| 46 | NDUFS5 | NDUFS5 | NDUFS5 | 2870 | 0.15 | 0.48 | YES |
| 47 | NDUFA7 | NDUFA7 | NDUFA7 | 2877 | 0.15 | 0.49 | YES |
| 48 | NDUFA9 | NDUFA9 | NDUFA9 | 2983 | 0.14 | 0.5 | YES |
| 49 | ATP5G1 | ATP5G1 | ATP5G1 | 3106 | 0.14 | 0.5 | YES |
| 50 | NDUFB5 | NDUFB5 | NDUFB5 | 3316 | 0.13 | 0.49 | YES |
| 51 | UQCRC1 | UQCRC1 | UQCRC1 | 3365 | 0.13 | 0.5 | YES |
| 52 | NDUFA5 | NDUFA5 | NDUFA5 | 3406 | 0.13 | 0.5 | YES |
| 53 | NDUFA4 | NDUFA4 | NDUFA4 | 3503 | 0.12 | 0.51 | YES |
| 54 | COX5A | COX5A | COX5A | 3586 | 0.12 | 0.51 | YES |
| 55 | UQCRFS1 | UQCRFS1 | UQCRFS1 | 3618 | 0.12 | 0.52 | YES |
| 56 | NDUFA6 | NDUFA6 | NDUFA6 | 3621 | 0.12 | 0.52 | YES |
| 57 | NDUFB6 | NDUFB6 | NDUFB6 | 3624 | 0.12 | 0.53 | YES |
| 58 | COX7A2L | COX7A2L | COX7A2L | 3845 | 0.11 | 0.52 | YES |
| 59 | UCHL1 | UCHL1 | UCHL1 | 3870 | 0.11 | 0.53 | YES |
| 60 | SLC25A5 | SLC25A5 | SLC25A5 | 3886 | 0.11 | 0.54 | YES |
| 61 | NDUFB8 | NDUFB8 | NDUFB8 | 4089 | 0.099 | 0.53 | YES |
| 62 | ATP5F1 | ATP5F1 | ATP5F1 | 4134 | 0.097 | 0.53 | YES |
| 63 | HTRA2 | HTRA2 | HTRA2 | 4155 | 0.097 | 0.54 | YES |
| 64 | NDUFV2 | NDUFV2 | NDUFV2 | 4209 | 0.095 | 0.54 | YES |
| 65 | UBE2J2 | UBE2J2 | UBE2J2 | 4351 | 0.09 | 0.54 | YES |
| 66 | ATP5G3 | ATP5G3 | ATP5G3 | 4470 | 0.086 | 0.54 | YES |
| 67 | UBE2L3 | UBE2L3 | UBE2L3 | 4593 | 0.081 | 0.54 | YES |
| 68 | UBB | UBB | UBB | 4601 | 0.081 | 0.54 | YES |
| 69 | PARK7 | PARK7 | PARK7 | 4674 | 0.079 | 0.54 | YES |
| 70 | NDUFB3 | NDUFB3 | NDUFB3 | 4742 | 0.076 | 0.54 | YES |
| 71 | SEPT5 | SEPT5 | SEPT5 | 4907 | 0.07 | 0.54 | NO |
| 72 | NDUFA10 | NDUFA10 | NDUFA10 | 5207 | 0.062 | 0.52 | NO |
| 73 | UBE2J1 | UBE2J1 | UBE2J1 | 5231 | 0.061 | 0.53 | NO |
| 74 | CASP3 | CASP3 | CASP3 | 5254 | 0.06 | 0.53 | NO |
| 75 | VDAC2 | VDAC2 | VDAC2 | 5267 | 0.06 | 0.53 | NO |
| 76 | SLC25A6 | SLC25A6 | SLC25A6 | 5284 | 0.059 | 0.54 | NO |
| 77 | UBE2G2 | UBE2G2 | UBE2G2 | 5324 | 0.058 | 0.54 | NO |
| 78 | GPR37 | GPR37 | GPR37 | 5360 | 0.057 | 0.54 | NO |
| 79 | UBA1 | UBA1 | UBA1 | 6184 | 0.032 | 0.49 | NO |
| 80 | NDUFS2 | NDUFS2 | NDUFS2 | 6211 | 0.031 | 0.49 | NO |
| 81 | ATP5C1 | ATP5C1 | ATP5C1 | 6314 | 0.028 | 0.49 | NO |
| 82 | CYCS | CYCS | CYCS | 6389 | 0.025 | 0.49 | NO |
| 83 | SDHB | SDHB | SDHB | 6491 | 0.022 | 0.48 | NO |
| 84 | CYC1 | CYC1 | CYC1 | 6495 | 0.022 | 0.48 | NO |
| 85 | SDHC | SDHC | SDHC | 6587 | 0.02 | 0.48 | NO |
| 86 | PINK1 | PINK1 | PINK1 | 6629 | 0.019 | 0.48 | NO |
| 87 | ATP5B | ATP5B | ATP5B | 6860 | 0.012 | 0.47 | NO |
| 88 | VDAC3 | VDAC3 | VDAC3 | 7070 | 0.0053 | 0.46 | NO |
| 89 | NDUFB4 | NDUFB4 | NDUFB4 | 7271 | -0.00053 | 0.44 | NO |
| 90 | SDHA | SDHA | SDHA | 7733 | -0.015 | 0.42 | NO |
| 91 | PPID | PPID | PPID | 7919 | -0.02 | 0.41 | NO |
| 92 | UQCRC2 | UQCRC2 | UQCRC2 | 8306 | -0.033 | 0.39 | NO |
| 93 | ATP5A1 | ATP5A1 | ATP5A1 | 8489 | -0.037 | 0.38 | NO |
| 94 | CASP9 | CASP9 | CASP9 | 8491 | -0.037 | 0.38 | NO |
| 95 | VDAC1 | VDAC1 | VDAC1 | 9164 | -0.059 | 0.35 | NO |
| 96 | UBE2L6 | UBE2L6 | UBE2L6 | 9234 | -0.061 | 0.35 | NO |
| 97 | SLC18A1 | SLC18A1 | SLC18A1 | 9677 | -0.075 | 0.33 | NO |
| 98 | SDHD | SDHD | SDHD | 9823 | -0.08 | 0.33 | NO |
| 99 | UBE2G1 | UBE2G1 | UBE2G1 | 10088 | -0.087 | 0.32 | NO |
| 100 | SLC6A3 | SLC6A3 | SLC6A3 | 10598 | -0.1 | 0.29 | NO |
| 101 | UBA7 | UBA7 | UBA7 | 10851 | -0.11 | 0.29 | NO |
| 102 | SNCA | SNCA | SNCA | 11405 | -0.13 | 0.26 | NO |
| 103 | APAF1 | APAF1 | APAF1 | 11509 | -0.13 | 0.26 | NO |
| 104 | COX6B2 | COX6B2 | COX6B2 | 11541 | -0.13 | 0.27 | NO |
| 105 | NDUFS1 | NDUFS1 | NDUFS1 | 13097 | -0.19 | 0.2 | NO |
| 106 | PARK2 | PARK2 | PARK2 | 15178 | -0.31 | 0.097 | NO |
| 107 | SLC18A2 | SLC18A2 | SLC18A2 | 15265 | -0.32 | 0.11 | NO |
| 108 | LRRK2 | LRRK2 | LRRK2 | 16050 | -0.4 | 0.092 | NO |
Figure S83. Get High-res Image This plot shows mRNAseq_cNMF expression data heatmap (on the left) a RunningEnrichmentScore(RES) plot (on the top right) and a Signal2Noise(S2N) plot (on the bottom right) of genes in the pathway: KEGG RIBOSOME.
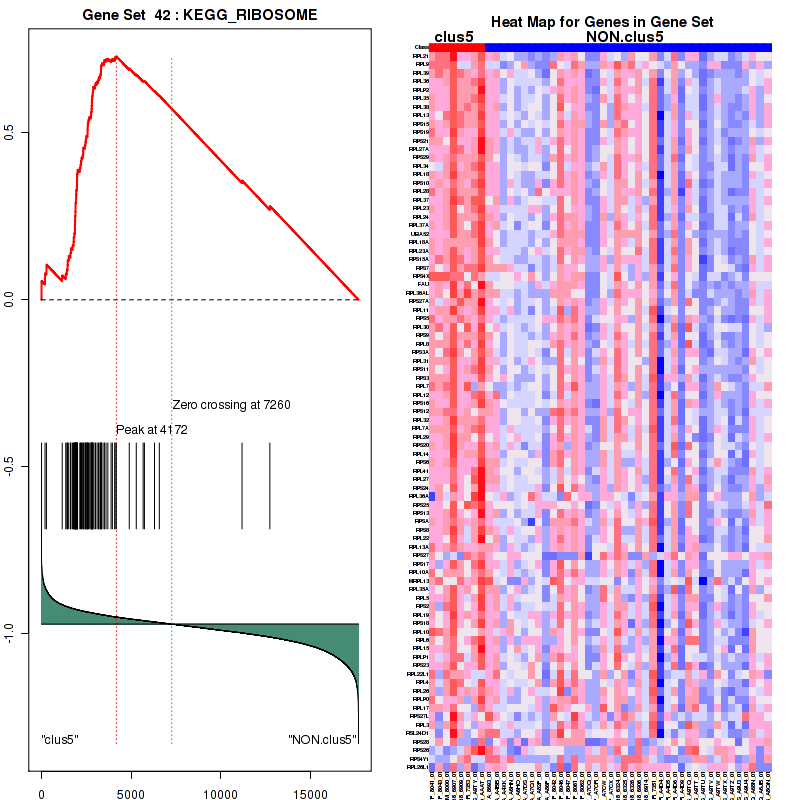
Figure S84. Get High-res Image For the top 5 core enriched genes in the pathway: KEGG RIBOSOME, this volcano plot shows how much they are up/down-regulated and significant. The significance was calculated by empirical bayesian fit
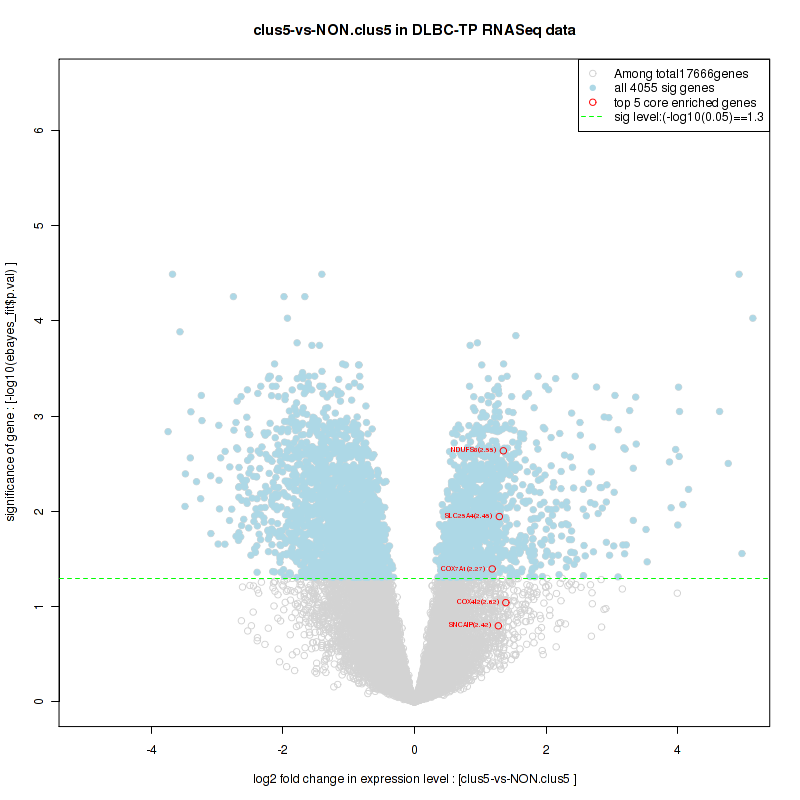
Table S43. Get Full Table This table shows a Running Enrichment Score (RES) of each gene in this pathway, that is, the enrichment score at this point in the ranked list of genes. All genes are ranked by Signal-to-Noise (S2N), a measure of similarity as default and are used to obtain ES matrix of all genes. In this way, GSEA tool uses expression pattern of not only overlapped genes but also not-overlapped genes to produce ES matrix.
| Rank | GENE | SYMBOL | DESC | LIST.LOC | S2N | RES | CORE_ENRICHMENT |
|---|---|---|---|---|---|---|---|
| 1 | SLC16A8 | SLC16A8 | SLC16A8 | 360 | 0.43 | 0.0039 | YES |
| 2 | ETFB | ETFB | ETFB | 682 | 0.33 | 0.0046 | YES |
| 3 | NDUFA13 | NDUFA13 | NDUFA13 | 792 | 0.31 | 0.016 | YES |
| 4 | PDK3 | PDK3 | PDK3 | 883 | 0.3 | 0.028 | YES |
| 5 | NDUFS8 | NDUFS8 | NDUFS8 | 933 | 0.29 | 0.042 | YES |
| 6 | NDUFA11 | NDUFA11 | NDUFA11 | 1024 | 0.28 | 0.053 | YES |
| 7 | NDUFA3 | NDUFA3 | NDUFA3 | 1039 | 0.28 | 0.068 | YES |
| 8 | NDUFB7 | NDUFB7 | NDUFB7 | 1044 | 0.28 | 0.083 | YES |
| 9 | NDUFB1 | NDUFB1 | NDUFB1 | 1100 | 0.27 | 0.096 | YES |
| 10 | ATP5D | ATP5D | ATP5D | 1124 | 0.27 | 0.11 | YES |
| 11 | ATP5O | ATP5O | ATP5O | 1217 | 0.26 | 0.12 | YES |
| 12 | NDUFS6 | NDUFS6 | NDUFS6 | 1237 | 0.26 | 0.13 | YES |
| 13 | COX6B1 | COX6B1 | COX6B1 | 1340 | 0.24 | 0.14 | YES |
| 14 | UQCRB | UQCRB | UQCRB | 1443 | 0.24 | 0.15 | YES |
| 15 | NDUFV3 | NDUFV3 | NDUFV3 | 1505 | 0.23 | 0.16 | YES |
| 16 | NDUFS7 | NDUFS7 | NDUFS7 | 1535 | 0.23 | 0.17 | YES |
| 17 | NDUFAB1 | NDUFAB1 | NDUFAB1 | 1549 | 0.23 | 0.18 | YES |
| 18 | ATP5E | ATP5E | ATP5E | 1616 | 0.22 | 0.19 | YES |
| 19 | COX5B | COX5B | COX5B | 1635 | 0.22 | 0.2 | YES |
| 20 | NDUFA1 | NDUFA1 | NDUFA1 | 1670 | 0.22 | 0.21 | YES |
| 21 | COX6C | COX6C | COX6C | 1697 | 0.22 | 0.22 | YES |
| 22 | UQCRQ | UQCRQ | UQCRQ | 1707 | 0.22 | 0.24 | YES |
| 23 | NDUFA2 | NDUFA2 | NDUFA2 | 1724 | 0.21 | 0.25 | YES |
| 24 | NDUFA8 | NDUFA8 | NDUFA8 | 1773 | 0.21 | 0.26 | YES |
| 25 | ATP5J | ATP5J | ATP5J | 1809 | 0.21 | 0.27 | YES |
| 26 | UQCR11 | UQCR11 | UQCR11 | 1908 | 0.2 | 0.27 | YES |
| 27 | NDUFB10 | NDUFB10 | NDUFB10 | 1927 | 0.2 | 0.28 | YES |
| 28 | ATP5I | ATP5I | ATP5I | 1961 | 0.2 | 0.29 | YES |
| 29 | UQCRHL | UQCRHL | UQCRHL | 1964 | 0.2 | 0.3 | YES |
| 30 | NDUFC2 | NDUFC2 | NDUFC2 | 1988 | 0.2 | 0.31 | YES |
| 31 | UQCRH | UQCRH | UQCRH | 2004 | 0.2 | 0.32 | YES |
| 32 | ATP5L | ATP5L | ATP5L | 2044 | 0.19 | 0.33 | YES |
| 33 | COX4I1 | COX4I1 | COX4I1 | 2052 | 0.19 | 0.34 | YES |
| 34 | NDUFS4 | NDUFS4 | NDUFS4 | 2070 | 0.19 | 0.35 | YES |
| 35 | NDUFB9 | NDUFB9 | NDUFB9 | 2180 | 0.18 | 0.36 | YES |
| 36 | NDUFV1 | NDUFV1 | NDUFV1 | 2262 | 0.18 | 0.36 | YES |
| 37 | NDUFS3 | NDUFS3 | NDUFS3 | 2282 | 0.18 | 0.37 | YES |
| 38 | NDUFC1 | NDUFC1 | NDUFC1 | 2391 | 0.17 | 0.38 | YES |
| 39 | COX6A1 | COX6A1 | COX6A1 | 2407 | 0.17 | 0.38 | YES |
| 40 | COX7C | COX7C | COX7C | 2542 | 0.16 | 0.39 | YES |
| 41 | NDUFB2 | NDUFB2 | NDUFB2 | 2565 | 0.16 | 0.39 | YES |
| 42 | ATP5H | ATP5H | ATP5H | 2707 | 0.16 | 0.4 | YES |
| 43 | COX7B | COX7B | COX7B | 2719 | 0.16 | 0.4 | YES |
| 44 | COX8A | COX8A | COX8A | 2744 | 0.16 | 0.41 | YES |
| 45 | NDUFS5 | NDUFS5 | NDUFS5 | 2870 | 0.15 | 0.41 | YES |
| 46 | NDUFA7 | NDUFA7 | NDUFA7 | 2877 | 0.15 | 0.42 | YES |
| 47 | NDUFA9 | NDUFA9 | NDUFA9 | 2983 | 0.14 | 0.42 | YES |
| 48 | IDH3G | IDH3G | IDH3G | 3003 | 0.14 | 0.43 | YES |
| 49 | ATP5G1 | ATP5G1 | ATP5G1 | 3106 | 0.14 | 0.43 | YES |
| 50 | ATP5J2 | ATP5J2 | ATP5J2 | 3121 | 0.14 | 0.44 | YES |
| 51 | SUCLG1 | SUCLG1 | SUCLG1 | 3125 | 0.14 | 0.45 | YES |
| 52 | NDUFB5 | NDUFB5 | NDUFB5 | 3316 | 0.13 | 0.44 | YES |
| 53 | UQCRC1 | UQCRC1 | UQCRC1 | 3365 | 0.13 | 0.45 | YES |
| 54 | IDH3B | IDH3B | IDH3B | 3392 | 0.13 | 0.45 | YES |
| 55 | NDUFA5 | NDUFA5 | NDUFA5 | 3406 | 0.13 | 0.46 | YES |
| 56 | NDUFA4 | NDUFA4 | NDUFA4 | 3503 | 0.12 | 0.46 | YES |
| 57 | COX5A | COX5A | COX5A | 3586 | 0.12 | 0.46 | YES |
| 58 | FH | FH | FH | 3605 | 0.12 | 0.47 | YES |
| 59 | UQCRFS1 | UQCRFS1 | UQCRFS1 | 3618 | 0.12 | 0.48 | YES |
| 60 | NDUFA6 | NDUFA6 | NDUFA6 | 3621 | 0.12 | 0.48 | YES |
| 61 | NDUFB6 | NDUFB6 | NDUFB6 | 3624 | 0.12 | 0.49 | YES |
| 62 | MDH2 | MDH2 | MDH2 | 3812 | 0.11 | 0.48 | YES |
| 63 | COX7A2L | COX7A2L | COX7A2L | 3845 | 0.11 | 0.49 | YES |
| 64 | NDUFB8 | NDUFB8 | NDUFB8 | 4089 | 0.099 | 0.48 | YES |
| 65 | ATP5F1 | ATP5F1 | ATP5F1 | 4134 | 0.097 | 0.48 | YES |
| 66 | PDHA1 | PDHA1 | PDHA1 | 4177 | 0.096 | 0.49 | YES |
| 67 | NDUFV2 | NDUFV2 | NDUFV2 | 4209 | 0.095 | 0.49 | YES |
| 68 | IDH2 | IDH2 | IDH2 | 4469 | 0.086 | 0.48 | NO |
| 69 | NDUFB3 | NDUFB3 | NDUFB3 | 4742 | 0.076 | 0.47 | NO |
| 70 | D2HGDH | D2HGDH | D2HGDH | 4924 | 0.07 | 0.46 | NO |
| 71 | NDUFA10 | NDUFA10 | NDUFA10 | 5207 | 0.062 | 0.45 | NO |
| 72 | NDUFA12 | NDUFA12 | NDUFA12 | 5333 | 0.058 | 0.45 | NO |
| 73 | BSG | BSG | BSG | 5596 | 0.05 | 0.43 | NO |
| 74 | PDK2 | PDK2 | PDK2 | 5725 | 0.046 | 0.43 | NO |
| 75 | PDHB | PDHB | PDHB | 5957 | 0.039 | 0.42 | NO |
| 76 | NDUFS2 | NDUFS2 | NDUFS2 | 6211 | 0.031 | 0.41 | NO |
| 77 | ACO2 | ACO2 | ACO2 | 6255 | 0.03 | 0.4 | NO |
| 78 | ATP5C1 | ATP5C1 | ATP5C1 | 6314 | 0.028 | 0.4 | NO |
| 79 | CYCS | CYCS | CYCS | 6389 | 0.025 | 0.4 | NO |
| 80 | LDHB | LDHB | LDHB | 6449 | 0.024 | 0.4 | NO |
| 81 | SDHB | SDHB | SDHB | 6491 | 0.022 | 0.4 | NO |
| 82 | CYC1 | CYC1 | CYC1 | 6495 | 0.022 | 0.4 | NO |
| 83 | SDHC | SDHC | SDHC | 6587 | 0.02 | 0.4 | NO |
| 84 | LDHA | LDHA | LDHA | 6734 | 0.016 | 0.39 | NO |
| 85 | PDHX | PDHX | PDHX | 6799 | 0.014 | 0.38 | NO |
| 86 | ATP5B | ATP5B | ATP5B | 6860 | 0.012 | 0.38 | NO |
| 87 | DLD | DLD | DLD | 6867 | 0.011 | 0.38 | NO |
| 88 | NDUFB4 | NDUFB4 | NDUFB4 | 7271 | -0.00053 | 0.36 | NO |
| 89 | UCP2 | UCP2 | UCP2 | 7409 | -0.0045 | 0.35 | NO |
| 90 | SLC16A3 | SLC16A3 | SLC16A3 | 7726 | -0.014 | 0.33 | NO |
| 91 | SDHA | SDHA | SDHA | 7733 | -0.015 | 0.34 | NO |
| 92 | UQCRC2 | UQCRC2 | UQCRC2 | 8306 | -0.033 | 0.3 | NO |
| 93 | ATP5A1 | ATP5A1 | ATP5A1 | 8489 | -0.037 | 0.3 | NO |
| 94 | NNT | NNT | NNT | 8628 | -0.041 | 0.29 | NO |
| 95 | SLC16A1 | SLC16A1 | SLC16A1 | 8877 | -0.05 | 0.28 | NO |
| 96 | CS | CS | CS | 8963 | -0.052 | 0.28 | NO |
| 97 | PDK1 | PDK1 | PDK1 | 9412 | -0.066 | 0.26 | NO |
| 98 | SDHD | SDHD | SDHD | 9823 | -0.08 | 0.24 | NO |
| 99 | ETFDH | ETFDH | ETFDH | 9852 | -0.08 | 0.24 | NO |
| 100 | DLST | DLST | DLST | 10004 | -0.085 | 0.24 | NO |
| 101 | ETFA | ETFA | ETFA | 10095 | -0.087 | 0.24 | NO |
| 102 | DLAT | DLAT | DLAT | 10726 | -0.11 | 0.21 | NO |
| 103 | SUCLG2 | SUCLG2 | SUCLG2 | 11239 | -0.12 | 0.18 | NO |
| 104 | PDK4 | PDK4 | PDK4 | 12369 | -0.16 | 0.13 | NO |
| 105 | IDH3A | IDH3A | IDH3A | 12578 | -0.17 | 0.13 | NO |
| 106 | NDUFS1 | NDUFS1 | NDUFS1 | 13097 | -0.19 | 0.11 | NO |
| 107 | L2HGDH | L2HGDH | L2HGDH | 13362 | -0.2 | 0.1 | NO |
| 108 | OGDH | OGDH | OGDH | 13389 | -0.21 | 0.12 | NO |
| 109 | ADHFE1 | ADHFE1 | ADHFE1 | 13968 | -0.24 | 0.096 | NO |
| 110 | IDH1 | IDH1 | IDH1 | 14016 | -0.24 | 0.11 | NO |
| 111 | SUCLA2 | SUCLA2 | SUCLA2 | 14308 | -0.25 | 0.1 | NO |
| 112 | PDP1 | PDP1 | PDP1 | 14569 | -0.27 | 0.1 | NO |
| 113 | UCP3 | UCP3 | UCP3 | 14912 | -0.29 | 0.1 | NO |
| 114 | PDPR | PDPR | PDPR | 16230 | -0.42 | 0.051 | NO |
| 115 | PDP2 | PDP2 | PDP2 | 16927 | -0.55 | 0.042 | NO |
Figure S85. Get High-res Image This plot shows mRNAseq_cNMF expression data heatmap (on the left) a RunningEnrichmentScore(RES) plot (on the top right) and a Signal2Noise(S2N) plot (on the bottom right) of genes in the pathway: KEGG PARKINSONS DISEASE.

Figure S86. Get High-res Image For the top 5 core enriched genes in the pathway: KEGG PARKINSONS DISEASE, this volcano plot shows how much they are up/down-regulated and significant. The significance was calculated by empirical bayesian fit
Table S44. Get Full Table This table shows a Running Enrichment Score (RES) of each gene in this pathway, that is, the enrichment score at this point in the ranked list of genes. All genes are ranked by Signal-to-Noise (S2N), a measure of similarity as default and are used to obtain ES matrix of all genes. In this way, GSEA tool uses expression pattern of not only overlapped genes but also not-overlapped genes to produce ES matrix.
| Rank | GENE | SYMBOL | DESC | LIST.LOC | S2N | RES | CORE_ENRICHMENT |
|---|---|---|---|---|---|---|---|
| 1 | RPL21 | RPL21 | RPL21 | 4 | 0.85 | 0.041 | YES |
| 2 | RPL9 | RPL9 | RPL9 | 200 | 0.51 | 0.054 | YES |
| 3 | RPL39 | RPL39 | RPL39 | 278 | 0.46 | 0.072 | YES |
| 4 | RPSAP9 | RPSAP9 | RPSAP9 | 985 | 0.28 | 0.046 | YES |
| 5 | RPL36 | RPL36 | RPL36 | 1156 | 0.26 | 0.049 | YES |
| 6 | EIF3K | EIF3K | EIF3K | 1233 | 0.26 | 0.057 | YES |
| 7 | RPLP2 | RPLP2 | RPLP2 | 1353 | 0.24 | 0.062 | YES |
| 8 | RPL35 | RPL35 | RPL35 | 1413 | 0.24 | 0.07 | YES |
| 9 | RPL38 | RPL38 | RPL38 | 1457 | 0.24 | 0.079 | YES |
| 10 | RPL13 | RPL13 | RPL13 | 1464 | 0.23 | 0.09 | YES |
| 11 | RPS15 | RPS15 | RPS15 | 1518 | 0.23 | 0.098 | YES |
| 12 | RPS19 | RPS19 | RPS19 | 1618 | 0.22 | 0.1 | YES |
| 13 | RPS21 | RPS21 | RPS21 | 1640 | 0.22 | 0.11 | YES |
| 14 | RPL27A | RPL27A | RPL27A | 1733 | 0.21 | 0.12 | YES |
| 15 | RPS29 | RPS29 | RPS29 | 1790 | 0.21 | 0.12 | YES |
| 16 | RPL34 | RPL34 | RPL34 | 1797 | 0.21 | 0.13 | YES |
| 17 | RPL18 | RPL18 | RPL18 | 1832 | 0.21 | 0.14 | YES |
| 18 | RPS10 | RPS10 | RPS10 | 1864 | 0.2 | 0.15 | YES |
| 19 | RPL28 | RPL28 | RPL28 | 1867 | 0.2 | 0.16 | YES |
| 20 | RPL37 | RPL37 | RPL37 | 1876 | 0.2 | 0.17 | YES |
| 21 | RPL23 | RPL23 | RPL23 | 1880 | 0.2 | 0.18 | YES |
| 22 | RPL24 | RPL24 | RPL24 | 1895 | 0.2 | 0.19 | YES |
| 23 | RPL37A | RPL37A | RPL37A | 1898 | 0.2 | 0.2 | YES |
| 24 | UBA52 | UBA52 | UBA52 | 1899 | 0.2 | 0.21 | YES |
| 25 | RPL18A | RPL18A | RPL18A | 1923 | 0.2 | 0.22 | YES |
| 26 | RPL23A | RPL23A | RPL23A | 1936 | 0.2 | 0.22 | YES |
| 27 | RPS15A | RPS15A | RPS15A | 1942 | 0.2 | 0.23 | YES |
| 28 | EIF3F | EIF3F | EIF3F | 1943 | 0.2 | 0.24 | YES |
| 29 | EEF1D | EEF1D | EEF1D | 1946 | 0.2 | 0.25 | YES |
| 30 | RPS7 | RPS7 | RPS7 | 1967 | 0.2 | 0.26 | YES |
| 31 | RPS4X | RPS4X | RPS4X | 1982 | 0.2 | 0.27 | YES |
| 32 | FAU | FAU | FAU | 1984 | 0.2 | 0.28 | YES |
| 33 | RPS27A | RPS27A | RPS27A | 2012 | 0.2 | 0.29 | YES |
| 34 | RPL11 | RPL11 | RPL11 | 2136 | 0.19 | 0.29 | YES |
| 35 | RPS5 | RPS5 | RPS5 | 2175 | 0.18 | 0.3 | YES |
| 36 | EIF3G | EIF3G | EIF3G | 2184 | 0.18 | 0.3 | YES |
| 37 | RPL30 | RPL30 | RPL30 | 2207 | 0.18 | 0.31 | YES |
| 38 | RPS9 | RPS9 | RPS9 | 2232 | 0.18 | 0.32 | YES |
| 39 | RPL8 | RPL8 | RPL8 | 2296 | 0.18 | 0.32 | YES |
| 40 | RPS3A | RPS3A | RPS3A | 2330 | 0.18 | 0.33 | YES |
| 41 | RPL31 | RPL31 | RPL31 | 2333 | 0.18 | 0.34 | YES |
| 42 | RPS11 | RPS11 | RPS11 | 2416 | 0.17 | 0.34 | YES |
| 43 | RPS3 | RPS3 | RPS3 | 2452 | 0.17 | 0.35 | YES |
| 44 | RPL7 | RPL7 | RPL7 | 2470 | 0.17 | 0.36 | YES |
| 45 | RPL12 | RPL12 | RPL12 | 2502 | 0.17 | 0.36 | YES |
| 46 | GSPT2 | GSPT2 | GSPT2 | 2505 | 0.17 | 0.37 | YES |
| 47 | RPS16 | RPS16 | RPS16 | 2569 | 0.16 | 0.38 | YES |
| 48 | RPS12 | RPS12 | RPS12 | 2570 | 0.16 | 0.38 | YES |
| 49 | RPL32 | RPL32 | RPL32 | 2573 | 0.16 | 0.39 | YES |
| 50 | RPL7A | RPL7A | RPL7A | 2586 | 0.16 | 0.4 | YES |
| 51 | RPL29 | RPL29 | RPL29 | 2618 | 0.16 | 0.4 | YES |
| 52 | SEC61G | SEC61G | SEC61G | 2661 | 0.16 | 0.41 | YES |
| 53 | RPS20 | RPS20 | RPS20 | 2665 | 0.16 | 0.42 | YES |
| 54 | RPL14 | RPL14 | RPL14 | 2753 | 0.16 | 0.42 | YES |
| 55 | RPS6 | RPS6 | RPS6 | 2769 | 0.16 | 0.43 | YES |
| 56 | RPL41 | RPL41 | RPL41 | 2793 | 0.15 | 0.43 | YES |
| 57 | RPL27 | RPL27 | RPL27 | 2798 | 0.15 | 0.44 | YES |
| 58 | RPS24 | RPS24 | RPS24 | 2807 | 0.15 | 0.45 | YES |
| 59 | SSR4 | SSR4 | SSR4 | 2809 | 0.15 | 0.45 | YES |
| 60 | RPL36A | RPL36A | RPL36A | 2811 | 0.15 | 0.46 | YES |
| 61 | RPS25 | RPS25 | RPS25 | 2831 | 0.15 | 0.47 | YES |
| 62 | RPS13 | RPS13 | RPS13 | 2852 | 0.15 | 0.47 | YES |
| 63 | RPSA | RPSA | RPSA | 2869 | 0.15 | 0.48 | YES |
| 64 | RPS8 | RPS8 | RPS8 | 2881 | 0.15 | 0.49 | YES |
| 65 | RPS14 | RPS14 | RPS14 | 2902 | 0.15 | 0.49 | YES |
| 66 | RPL22 | RPL22 | RPL22 | 2984 | 0.14 | 0.5 | YES |
| 67 | RPL13A | RPL13A | RPL13A | 3013 | 0.14 | 0.5 | YES |
| 68 | RPS27 | RPS27 | RPS27 | 3101 | 0.14 | 0.5 | YES |
| 69 | EIF2B4 | EIF2B4 | EIF2B4 | 3110 | 0.14 | 0.51 | YES |
| 70 | EEF1G | EEF1G | EEF1G | 3120 | 0.14 | 0.52 | YES |
| 71 | RPS17 | RPS17 | RPS17 | 3174 | 0.14 | 0.52 | YES |
| 72 | EIF2B3 | EIF2B3 | EIF2B3 | 3181 | 0.14 | 0.52 | YES |
| 73 | RPL10A | RPL10A | RPL10A | 3194 | 0.14 | 0.53 | YES |
| 74 | EIF2S2 | EIF2S2 | EIF2S2 | 3282 | 0.13 | 0.53 | YES |
| 75 | RPL35A | RPL35A | RPL35A | 3294 | 0.13 | 0.54 | YES |
| 76 | EIF3H | EIF3H | EIF3H | 3297 | 0.13 | 0.54 | YES |
| 77 | RPL5 | RPL5 | RPL5 | 3318 | 0.13 | 0.55 | YES |
| 78 | RPS2 | RPS2 | RPS2 | 3321 | 0.13 | 0.56 | YES |
| 79 | RPL19 | RPL19 | RPL19 | 3328 | 0.13 | 0.56 | YES |
| 80 | RPS18 | RPS18 | RPS18 | 3372 | 0.13 | 0.56 | YES |
| 81 | RPL10 | RPL10 | RPL10 | 3490 | 0.12 | 0.56 | YES |
| 82 | RPL6 | RPL6 | RPL6 | 3500 | 0.12 | 0.57 | YES |
| 83 | RPL15 | RPL15 | RPL15 | 3597 | 0.12 | 0.57 | YES |
| 84 | EIF3I | EIF3I | EIF3I | 3609 | 0.12 | 0.57 | YES |
| 85 | RPLP1 | RPLP1 | RPLP1 | 3700 | 0.11 | 0.57 | YES |
| 86 | EEF1B2 | EEF1B2 | EEF1B2 | 3818 | 0.11 | 0.57 | YES |
| 87 | SSR2 | SSR2 | SSR2 | 3838 | 0.11 | 0.58 | YES |
| 88 | RPS23 | RPS23 | RPS23 | 3881 | 0.11 | 0.58 | YES |
| 89 | EIF3D | EIF3D | EIF3D | 3882 | 0.11 | 0.59 | YES |
| 90 | EIF2B2 | EIF2B2 | EIF2B2 | 3948 | 0.1 | 0.59 | YES |
| 91 | EIF3B | EIF3B | EIF3B | 4036 | 0.1 | 0.59 | YES |
| 92 | RPL4 | RPL4 | RPL4 | 4085 | 0.099 | 0.59 | YES |
| 93 | RPL26 | RPL26 | RPL26 | 4099 | 0.099 | 0.59 | YES |
| 94 | RPLP0 | RPLP0 | RPLP0 | 4172 | 0.096 | 0.59 | YES |
| 95 | RPN2 | RPN2 | RPN2 | 4333 | 0.091 | 0.59 | YES |
| 96 | EIF2B1 | EIF2B1 | EIF2B1 | 4344 | 0.09 | 0.59 | YES |
| 97 | EIF2S3 | EIF2S3 | EIF2S3 | 4346 | 0.09 | 0.6 | YES |
| 98 | EIF4EBP1 | EIF4EBP1 | EIF4EBP1 | 4599 | 0.081 | 0.59 | NO |
| 99 | SEC61B | SEC61B | SEC61B | 4733 | 0.077 | 0.58 | NO |
| 100 | EIF5B | EIF5B | EIF5B | 4824 | 0.074 | 0.58 | NO |
| 101 | SRP19 | SRP19 | SRP19 | 4852 | 0.072 | 0.58 | NO |
| 102 | RPL17 | RPL17 | RPL17 | 4891 | 0.071 | 0.58 | NO |
| 103 | EIF3E | EIF3E | EIF3E | 4904 | 0.07 | 0.59 | NO |
| 104 | SEC11C | SEC11C | SEC11C | 5251 | 0.06 | 0.57 | NO |
| 105 | SRP9 | SRP9 | SRP9 | 5535 | 0.052 | 0.56 | NO |
| 106 | EIF1AX | EIF1AX | EIF1AX | 5586 | 0.05 | 0.56 | NO |
| 107 | RPL3 | RPL3 | RPL3 | 5665 | 0.048 | 0.55 | NO |
| 108 | EIF4B | EIF4B | EIF4B | 5793 | 0.044 | 0.55 | NO |
| 109 | EIF2S1 | EIF2S1 | EIF2S1 | 5946 | 0.039 | 0.54 | NO |
| 110 | EEF1A1 | EEF1A1 | EEF1A1 | 6036 | 0.037 | 0.54 | NO |
| 111 | RPS28 | RPS28 | RPS28 | 6298 | 0.028 | 0.52 | NO |
| 112 | SRP14 | SRP14 | SRP14 | 6428 | 0.024 | 0.52 | NO |
| 113 | RPS26 | RPS26 | RPS26 | 6567 | 0.02 | 0.51 | NO |
| 114 | EIF4A1 | EIF4A1 | EIF4A1 | 6583 | 0.02 | 0.51 | NO |
| 115 | SPCS1 | SPCS1 | SPCS1 | 6593 | 0.02 | 0.51 | NO |
| 116 | RPN1 | RPN1 | RPN1 | 6837 | 0.012 | 0.5 | NO |
| 117 | SPCS2 | SPCS2 | SPCS2 | 7284 | -0.00092 | 0.47 | NO |
| 118 | SEC61A1 | SEC61A1 | SEC61A1 | 7351 | -0.0027 | 0.47 | NO |
| 119 | SRPR | SRPR | SRPR | 7397 | -0.0042 | 0.47 | NO |
| 120 | SEC11A | SEC11A | SEC11A | 7445 | -0.0059 | 0.46 | NO |
| 121 | EEF2 | EEF2 | EEF2 | 7524 | -0.008 | 0.46 | NO |
| 122 | SSR3 | SSR3 | SSR3 | 7556 | -0.0088 | 0.46 | NO |
| 123 | LOC653566 | LOC653566 | LOC653566 | 7623 | -0.011 | 0.46 | NO |
| 124 | EIF2B5 | EIF2B5 | EIF2B5 | 7658 | -0.012 | 0.46 | NO |
| 125 | PABPC1 | PABPC1 | PABPC1 | 7683 | -0.013 | 0.46 | NO |
| 126 | SRPRB | SRPRB | SRPRB | 7724 | -0.014 | 0.45 | NO |
| 127 | SRP68 | SRP68 | SRP68 | 7920 | -0.02 | 0.44 | NO |
| 128 | EIF5 | EIF5 | EIF5 | 8007 | -0.023 | 0.44 | NO |
| 129 | DDOST | DDOST | DDOST | 8326 | -0.033 | 0.42 | NO |
| 130 | EIF4H | EIF4H | EIF4H | 8332 | -0.033 | 0.42 | NO |
| 131 | EIF4E | EIF4E | EIF4E | 8492 | -0.037 | 0.42 | NO |
| 132 | EIF3J | EIF3J | EIF3J | 8672 | -0.043 | 0.41 | NO |
| 133 | ETF1 | ETF1 | ETF1 | 8791 | -0.046 | 0.4 | NO |
| 134 | SSR1 | SSR1 | SSR1 | 9421 | -0.067 | 0.37 | NO |
| 135 | SRP72 | SRP72 | SRP72 | 9454 | -0.068 | 0.37 | NO |
| 136 | SRP54 | SRP54 | SRP54 | 9899 | -0.082 | 0.35 | NO |
| 137 | TRAM1 | TRAM1 | TRAM1 | 10033 | -0.086 | 0.35 | NO |
| 138 | EIF4A2 | EIF4A2 | EIF4A2 | 10058 | -0.086 | 0.35 | NO |
| 139 | SPCS3 | SPCS3 | SPCS3 | 10211 | -0.091 | 0.35 | NO |
| 140 | RPS4Y1 | RPS4Y1 | RPS4Y1 | 11175 | -0.12 | 0.3 | NO |
| 141 | EIF3A | EIF3A | EIF3A | 11880 | -0.14 | 0.26 | NO |
| 142 | EIF4G1 | EIF4G1 | EIF4G1 | 11885 | -0.14 | 0.27 | NO |
| 143 | RPL26L1 | RPL26L1 | RPL26L1 | 12727 | -0.18 | 0.23 | NO |
| 144 | FAM153A | FAM153A | FAM153A | 13059 | -0.19 | 0.22 | NO |
| 145 | SEC61A2 | SEC61A2 | SEC61A2 | 15762 | -0.36 | 0.085 | NO |
| 146 | EIF3C | EIF3C | EIF3C | 16658 | -0.49 | 0.058 | NO |
Figure S87. Get High-res Image This plot shows mRNAseq_cNMF expression data heatmap (on the left) a RunningEnrichmentScore(RES) plot (on the top right) and a Signal2Noise(S2N) plot (on the bottom right) of genes in the pathway: KEGG HUNTINGTONS DISEASE.
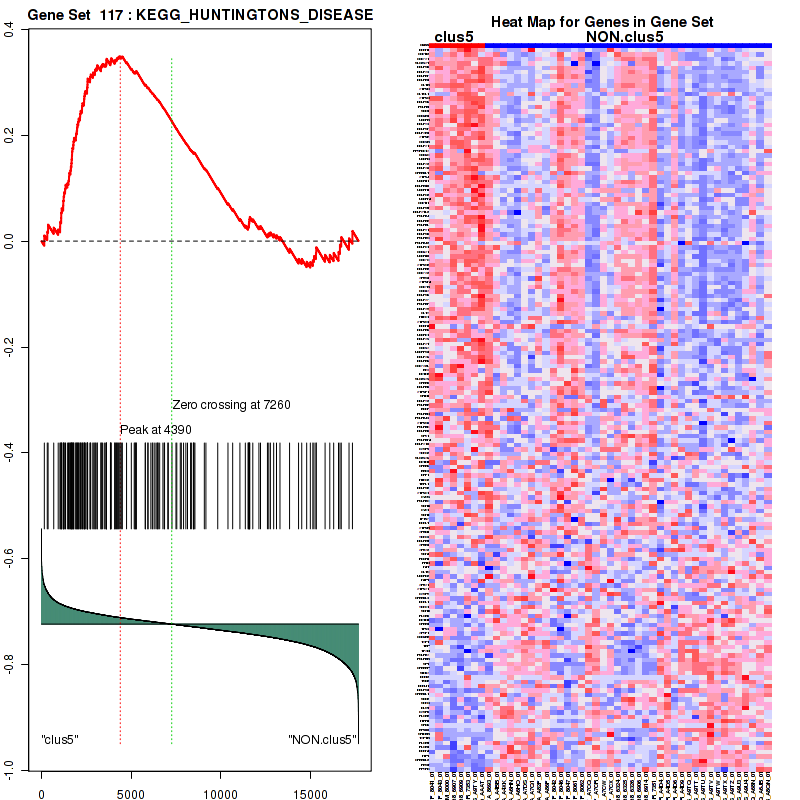
Figure S88. Get High-res Image For the top 5 core enriched genes in the pathway: KEGG HUNTINGTONS DISEASE, this volcano plot shows how much they are up/down-regulated and significant. The significance was calculated by empirical bayesian fit
Table S45. Get Full Table This table shows a Running Enrichment Score (RES) of each gene in this pathway, that is, the enrichment score at this point in the ranked list of genes. All genes are ranked by Signal-to-Noise (S2N), a measure of similarity as default and are used to obtain ES matrix of all genes. In this way, GSEA tool uses expression pattern of not only overlapped genes but also not-overlapped genes to produce ES matrix.
| Rank | GENE | SYMBOL | DESC | LIST.LOC | S2N | RES | CORE_ENRICHMENT |
|---|---|---|---|---|---|---|---|
| 1 | RPL21 | RPL21 | RPL21 | 4 | 0.85 | 0.031 | YES |
| 2 | RPL9 | RPL9 | RPL9 | 200 | 0.51 | 0.038 | YES |
| 3 | RPL39 | RPL39 | RPL39 | 278 | 0.46 | 0.051 | YES |
| 4 | RPSAP9 | RPSAP9 | RPSAP9 | 985 | 0.28 | 0.02 | YES |
| 5 | RPL36 | RPL36 | RPL36 | 1156 | 0.26 | 0.02 | YES |
| 6 | EXOSC4 | EXOSC4 | EXOSC4 | 1243 | 0.26 | 0.025 | YES |
| 7 | HSPB1 | HSPB1 | HSPB1 | 1327 | 0.25 | 0.029 | YES |
| 8 | PSMB3 | PSMB3 | PSMB3 | 1333 | 0.24 | 0.037 | YES |
| 9 | RPLP2 | RPLP2 | RPLP2 | 1353 | 0.24 | 0.045 | YES |
| 10 | RPL35 | RPL35 | RPL35 | 1413 | 0.24 | 0.05 | YES |
| 11 | RPL38 | RPL38 | RPL38 | 1457 | 0.24 | 0.056 | YES |
| 12 | RPL13 | RPL13 | RPL13 | 1464 | 0.23 | 0.065 | YES |
| 13 | RPS15 | RPS15 | RPS15 | 1518 | 0.23 | 0.07 | YES |
| 14 | RPS19 | RPS19 | RPS19 | 1618 | 0.22 | 0.072 | YES |
| 15 | RPS21 | RPS21 | RPS21 | 1640 | 0.22 | 0.079 | YES |
| 16 | PSMC1 | PSMC1 | PSMC1 | 1732 | 0.21 | 0.082 | YES |
| 17 | RPL27A | RPL27A | RPL27A | 1733 | 0.21 | 0.09 | YES |
| 18 | RPS29 | RPS29 | RPS29 | 1790 | 0.21 | 0.094 | YES |
| 19 | RPL34 | RPL34 | RPL34 | 1797 | 0.21 | 0.1 | YES |
| 20 | RPL18 | RPL18 | RPL18 | 1832 | 0.21 | 0.11 | YES |
| 21 | RPS10 | RPS10 | RPS10 | 1864 | 0.2 | 0.11 | YES |
| 22 | RPL28 | RPL28 | RPL28 | 1867 | 0.2 | 0.12 | YES |
| 23 | RPL37 | RPL37 | RPL37 | 1876 | 0.2 | 0.13 | YES |
| 24 | RPL23 | RPL23 | RPL23 | 1880 | 0.2 | 0.13 | YES |
| 25 | RPL24 | RPL24 | RPL24 | 1895 | 0.2 | 0.14 | YES |
| 26 | RPL37A | RPL37A | RPL37A | 1898 | 0.2 | 0.15 | YES |
| 27 | UBA52 | UBA52 | UBA52 | 1899 | 0.2 | 0.16 | YES |
| 28 | RPL18A | RPL18A | RPL18A | 1923 | 0.2 | 0.16 | YES |
| 29 | RPL23A | RPL23A | RPL23A | 1936 | 0.2 | 0.17 | YES |
| 30 | RPS15A | RPS15A | RPS15A | 1942 | 0.2 | 0.18 | YES |
| 31 | RPS7 | RPS7 | RPS7 | 1967 | 0.2 | 0.18 | YES |
| 32 | RPS4X | RPS4X | RPS4X | 1982 | 0.2 | 0.19 | YES |
| 33 | FAU | FAU | FAU | 1984 | 0.2 | 0.19 | YES |
| 34 | RPS27A | RPS27A | RPS27A | 2012 | 0.2 | 0.2 | YES |
| 35 | RPL11 | RPL11 | RPL11 | 2136 | 0.19 | 0.2 | YES |
| 36 | DCPS | DCPS | DCPS | 2172 | 0.18 | 0.2 | YES |
| 37 | RPS5 | RPS5 | RPS5 | 2175 | 0.18 | 0.21 | YES |
| 38 | PSMD4 | PSMD4 | PSMD4 | 2195 | 0.18 | 0.22 | YES |
| 39 | RPL30 | RPL30 | RPL30 | 2207 | 0.18 | 0.22 | YES |
| 40 | RPS9 | RPS9 | RPS9 | 2232 | 0.18 | 0.23 | YES |
| 41 | RPL8 | RPL8 | RPL8 | 2296 | 0.18 | 0.23 | YES |
| 42 | RPS3A | RPS3A | RPS3A | 2330 | 0.18 | 0.24 | YES |
| 43 | RPL31 | RPL31 | RPL31 | 2333 | 0.18 | 0.24 | YES |
| 44 | LSM4 | LSM4 | LSM4 | 2358 | 0.18 | 0.25 | YES |
| 45 | RPS11 | RPS11 | RPS11 | 2416 | 0.17 | 0.25 | YES |
| 46 | PSMC5 | PSMC5 | PSMC5 | 2418 | 0.17 | 0.26 | YES |
| 47 | PSMB10 | PSMB10 | PSMB10 | 2441 | 0.17 | 0.26 | YES |
| 48 | RPS3 | RPS3 | RPS3 | 2452 | 0.17 | 0.27 | YES |
| 49 | RPL7 | RPL7 | RPL7 | 2470 | 0.17 | 0.27 | YES |
| 50 | PARN | PARN | PARN | 2479 | 0.17 | 0.28 | YES |
| 51 | RPL12 | RPL12 | RPL12 | 2502 | 0.17 | 0.28 | YES |
| 52 | GSPT2 | GSPT2 | GSPT2 | 2505 | 0.17 | 0.29 | YES |
| 53 | PSMB6 | PSMB6 | PSMB6 | 2513 | 0.17 | 0.29 | YES |
| 54 | PSMD9 | PSMD9 | PSMD9 | 2535 | 0.16 | 0.3 | YES |
| 55 | PSMD13 | PSMD13 | PSMD13 | 2538 | 0.16 | 0.3 | YES |
| 56 | PSMB7 | PSMB7 | PSMB7 | 2564 | 0.16 | 0.31 | YES |
| 57 | RPS16 | RPS16 | RPS16 | 2569 | 0.16 | 0.31 | YES |
| 58 | RPS12 | RPS12 | RPS12 | 2570 | 0.16 | 0.32 | YES |
| 59 | RPL32 | RPL32 | RPL32 | 2573 | 0.16 | 0.33 | YES |
| 60 | RPL7A | RPL7A | RPL7A | 2586 | 0.16 | 0.33 | YES |
| 61 | PSMC3 | PSMC3 | PSMC3 | 2595 | 0.16 | 0.34 | YES |
| 62 | RPL29 | RPL29 | RPL29 | 2618 | 0.16 | 0.34 | YES |
| 63 | RPS20 | RPS20 | RPS20 | 2665 | 0.16 | 0.34 | YES |
| 64 | EXOSC5 | EXOSC5 | EXOSC5 | 2678 | 0.16 | 0.35 | YES |
| 65 | RPL14 | RPL14 | RPL14 | 2753 | 0.16 | 0.35 | YES |
| 66 | RPS6 | RPS6 | RPS6 | 2769 | 0.16 | 0.36 | YES |
| 67 | RPL41 | RPL41 | RPL41 | 2793 | 0.15 | 0.36 | YES |
| 68 | RPL27 | RPL27 | RPL27 | 2798 | 0.15 | 0.36 | YES |
| 69 | RPS24 | RPS24 | RPS24 | 2807 | 0.15 | 0.37 | YES |
| 70 | RPL36A | RPL36A | RPL36A | 2811 | 0.15 | 0.38 | YES |
| 71 | RPS25 | RPS25 | RPS25 | 2831 | 0.15 | 0.38 | YES |
| 72 | RPS13 | RPS13 | RPS13 | 2852 | 0.15 | 0.38 | YES |
| 73 | LSM2 | LSM2 | LSM2 | 2856 | 0.15 | 0.39 | YES |
| 74 | RPSA | RPSA | RPSA | 2869 | 0.15 | 0.39 | YES |
| 75 | RPS8 | RPS8 | RPS8 | 2881 | 0.15 | 0.4 | YES |
| 76 | RPS14 | RPS14 | RPS14 | 2902 | 0.15 | 0.4 | YES |
| 77 | LSM5 | LSM5 | LSM5 | 2925 | 0.15 | 0.41 | YES |
| 78 | PSMB1 | PSMB1 | PSMB1 | 2926 | 0.15 | 0.41 | YES |
| 79 | RPL22 | RPL22 | RPL22 | 2984 | 0.14 | 0.42 | YES |
| 80 | LSM3 | LSM3 | LSM3 | 3002 | 0.14 | 0.42 | YES |
| 81 | RPL13A | RPL13A | RPL13A | 3013 | 0.14 | 0.42 | YES |
| 82 | PSMA7 | PSMA7 | PSMA7 | 3019 | 0.14 | 0.43 | YES |
| 83 | PPP2R1A | PPP2R1A | PPP2R1A | 3098 | 0.14 | 0.43 | YES |
| 84 | RPS27 | RPS27 | RPS27 | 3101 | 0.14 | 0.43 | YES |
| 85 | PSMB4 | PSMB4 | PSMB4 | 3165 | 0.14 | 0.44 | YES |
| 86 | RPS17 | RPS17 | RPS17 | 3174 | 0.14 | 0.44 | YES |
| 87 | RPL10A | RPL10A | RPL10A | 3194 | 0.14 | 0.44 | YES |
| 88 | EXOSC7 | EXOSC7 | EXOSC7 | 3263 | 0.13 | 0.44 | YES |
| 89 | RPL35A | RPL35A | RPL35A | 3294 | 0.13 | 0.45 | YES |
| 90 | RPL5 | RPL5 | RPL5 | 3318 | 0.13 | 0.45 | YES |
| 91 | RPS2 | RPS2 | RPS2 | 3321 | 0.13 | 0.46 | YES |
| 92 | RPL19 | RPL19 | RPL19 | 3328 | 0.13 | 0.46 | YES |
| 93 | RPS18 | RPS18 | RPS18 | 3372 | 0.13 | 0.46 | YES |
| 94 | PSMC4 | PSMC4 | PSMC4 | 3410 | 0.13 | 0.46 | YES |
| 95 | RBM8A | RBM8A | RBM8A | 3423 | 0.13 | 0.47 | YES |
| 96 | RPL10 | RPL10 | RPL10 | 3490 | 0.12 | 0.47 | YES |
| 97 | RPL6 | RPL6 | RPL6 | 3500 | 0.12 | 0.47 | YES |
| 98 | RPL15 | RPL15 | RPL15 | 3597 | 0.12 | 0.47 | YES |
| 99 | RPLP1 | RPLP1 | RPLP1 | 3700 | 0.11 | 0.47 | YES |
| 100 | MAPK11 | MAPK11 | MAPK11 | 3737 | 0.11 | 0.47 | YES |
| 101 | PSMA2 | PSMA2 | PSMA2 | 3742 | 0.11 | 0.48 | YES |
| 102 | MAGOH | MAGOH | MAGOH | 3747 | 0.11 | 0.48 | YES |
| 103 | RPS23 | RPS23 | RPS23 | 3881 | 0.11 | 0.48 | YES |
| 104 | YWHAB | YWHAB | YWHAB | 3982 | 0.1 | 0.48 | YES |
| 105 | PSMD10 | PSMD10 | PSMD10 | 4023 | 0.1 | 0.48 | YES |
| 106 | RPL4 | RPL4 | RPL4 | 4085 | 0.099 | 0.48 | YES |
| 107 | RPL26 | RPL26 | RPL26 | 4099 | 0.099 | 0.48 | YES |
| 108 | DCP1B | DCP1B | DCP1B | 4163 | 0.096 | 0.48 | YES |
| 109 | RPLP0 | RPLP0 | RPLP0 | 4172 | 0.096 | 0.48 | YES |
| 110 | PSMD8 | PSMD8 | PSMD8 | 4223 | 0.094 | 0.48 | YES |
| 111 | UPF3B | UPF3B | UPF3B | 4228 | 0.094 | 0.49 | YES |
| 112 | PSMA4 | PSMA4 | PSMA4 | 4241 | 0.094 | 0.49 | YES |
| 113 | PSME2 | PSME2 | PSME2 | 4314 | 0.091 | 0.49 | NO |
| 114 | LSM1 | LSM1 | LSM1 | 4468 | 0.086 | 0.48 | NO |
| 115 | NCBP2 | NCBP2 | NCBP2 | 4567 | 0.082 | 0.48 | NO |
| 116 | PSMA6 | PSMA6 | PSMA6 | 4591 | 0.081 | 0.48 | NO |
| 117 | EXOSC6 | EXOSC6 | EXOSC6 | 4680 | 0.079 | 0.48 | NO |
| 118 | EXOSC1 | EXOSC1 | EXOSC1 | 4799 | 0.074 | 0.48 | NO |
| 119 | RPL17 | RPL17 | RPL17 | 4891 | 0.071 | 0.47 | NO |
| 120 | PSMA5 | PSMA5 | PSMA5 | 4925 | 0.07 | 0.47 | NO |
| 121 | CNOT10 | CNOT10 | CNOT10 | 4943 | 0.069 | 0.47 | NO |
| 122 | EXOSC2 | EXOSC2 | EXOSC2 | 5006 | 0.067 | 0.47 | NO |
| 123 | PSMB5 | PSMB5 | PSMB5 | 5071 | 0.065 | 0.47 | NO |
| 124 | ANP32A | ANP32A | ANP32A | 5106 | 0.064 | 0.47 | NO |
| 125 | PSMD6 | PSMD6 | PSMD6 | 5107 | 0.064 | 0.48 | NO |
| 126 | C2orf29 | C2orf29 | C2orf29 | 5329 | 0.058 | 0.46 | NO |
| 127 | PSMA3 | PSMA3 | PSMA3 | 5408 | 0.056 | 0.46 | NO |
| 128 | PSMD7 | PSMD7 | PSMD7 | 5438 | 0.055 | 0.46 | NO |
| 129 | PPP2R2A | PPP2R2A | PPP2R2A | 5463 | 0.054 | 0.46 | NO |
| 130 | PSMC2 | PSMC2 | PSMC2 | 5503 | 0.053 | 0.46 | NO |
| 131 | XPO1 | XPO1 | XPO1 | 5529 | 0.052 | 0.46 | NO |
| 132 | PPP2CA | PPP2CA | PPP2CA | 5628 | 0.049 | 0.46 | NO |
| 133 | RPL3 | RPL3 | RPL3 | 5665 | 0.048 | 0.46 | NO |
| 134 | PSME1 | PSME1 | PSME1 | 5670 | 0.048 | 0.46 | NO |
| 135 | PSMB9 | PSMB9 | PSMB9 | 5747 | 0.045 | 0.46 | NO |
| 136 | ELAVL1 | ELAVL1 | ELAVL1 | 5763 | 0.045 | 0.46 | NO |
| 137 | EXOSC3 | EXOSC3 | EXOSC3 | 5764 | 0.044 | 0.46 | NO |
| 138 | EIF4B | EIF4B | EIF4B | 5793 | 0.044 | 0.46 | NO |
| 139 | RNPS1 | RNPS1 | RNPS1 | 5886 | 0.041 | 0.46 | NO |
| 140 | PSMF1 | PSMF1 | PSMF1 | 5919 | 0.04 | 0.46 | NO |
| 141 | PSMB2 | PSMB2 | PSMB2 | 5987 | 0.038 | 0.45 | NO |
| 142 | PSMD1 | PSMD1 | PSMD1 | 5991 | 0.038 | 0.45 | NO |
| 143 | PSMC6 | PSMC6 | PSMC6 | 6053 | 0.036 | 0.45 | NO |
| 144 | EXOSC9 | EXOSC9 | EXOSC9 | 6134 | 0.034 | 0.45 | NO |
| 145 | EDC4 | EDC4 | EDC4 | 6142 | 0.033 | 0.45 | NO |
| 146 | ZFP36L1 | ZFP36L1 | ZFP36L1 | 6213 | 0.031 | 0.45 | NO |
| 147 | PSMA1 | PSMA1 | PSMA1 | 6293 | 0.028 | 0.44 | NO |
| 148 | RPS28 | RPS28 | RPS28 | 6298 | 0.028 | 0.44 | NO |
| 149 | LSM6 | LSM6 | LSM6 | 6417 | 0.024 | 0.44 | NO |
| 150 | EXOSC8 | EXOSC8 | EXOSC8 | 6566 | 0.02 | 0.43 | NO |
| 151 | RPS26 | RPS26 | RPS26 | 6567 | 0.02 | 0.43 | NO |
| 152 | EIF4A1 | EIF4A1 | EIF4A1 | 6583 | 0.02 | 0.43 | NO |
| 153 | CNOT7 | CNOT7 | CNOT7 | 6702 | 0.016 | 0.42 | NO |
| 154 | HNRNPD | HNRNPD | HNRNPD | 6725 | 0.016 | 0.42 | NO |
| 155 | SMG5 | SMG5 | SMG5 | 6772 | 0.014 | 0.42 | NO |
| 156 | PSMD14 | PSMD14 | PSMD14 | 6775 | 0.014 | 0.42 | NO |
| 157 | EDC3 | EDC3 | EDC3 | 6807 | 0.013 | 0.42 | NO |
| 158 | DCP2 | DCP2 | DCP2 | 6885 | 0.011 | 0.42 | NO |
| 159 | PSMD11 | PSMD11 | PSMD11 | 6897 | 0.01 | 0.42 | NO |
| 160 | PSMB8 | PSMB8 | PSMB8 | 6918 | 0.0098 | 0.42 | NO |
| 161 | CNOT2 | CNOT2 | CNOT2 | 7007 | 0.0072 | 0.41 | NO |
| 162 | PRKCD | PRKCD | PRKCD | 7083 | 0.0049 | 0.41 | NO |
| 163 | CNOT3 | CNOT3 | CNOT3 | 7297 | -0.0013 | 0.4 | NO |
| 164 | YWHAZ | YWHAZ | YWHAZ | 7331 | -0.0022 | 0.39 | NO |
| 165 | PABPC1 | PABPC1 | PABPC1 | 7683 | -0.013 | 0.37 | NO |
| 166 | HSPA8 | HSPA8 | HSPA8 | 7713 | -0.014 | 0.37 | NO |
| 167 | PSMD2 | PSMD2 | PSMD2 | 7817 | -0.017 | 0.37 | NO |
| 168 | SMG6 | SMG6 | SMG6 | 7969 | -0.022 | 0.36 | NO |
| 169 | MAPKAPK2 | MAPKAPK2 | MAPKAPK2 | 8043 | -0.024 | 0.36 | NO |
| 170 | DDX6 | DDX6 | DDX6 | 8145 | -0.028 | 0.35 | NO |
| 171 | PSMD3 | PSMD3 | PSMD3 | 8202 | -0.029 | 0.35 | NO |
| 172 | CASC3 | CASC3 | CASC3 | 8455 | -0.036 | 0.34 | NO |
| 173 | EIF4E | EIF4E | EIF4E | 8492 | -0.037 | 0.34 | NO |
| 174 | KHSRP | KHSRP | KHSRP | 8535 | -0.038 | 0.33 | NO |
| 175 | PSME4 | PSME4 | PSME4 | 8570 | -0.039 | 0.33 | NO |
| 176 | EIF4A3 | EIF4A3 | EIF4A3 | 8614 | -0.041 | 0.33 | NO |
| 177 | ETF1 | ETF1 | ETF1 | 8791 | -0.046 | 0.32 | NO |
| 178 | SMG7 | SMG7 | SMG7 | 8949 | -0.052 | 0.32 | NO |
| 179 | PAIP1 | PAIP1 | PAIP1 | 9005 | -0.053 | 0.32 | NO |
| 180 | PSMA8 | PSMA8 | PSMA8 | 9025 | -0.054 | 0.32 | NO |
| 181 | MAPK14 | MAPK14 | MAPK14 | 9146 | -0.058 | 0.31 | NO |
| 182 | NCBP1 | NCBP1 | NCBP1 | 9240 | -0.061 | 0.31 | NO |
| 183 | NUP214 | NUP214 | NUP214 | 9409 | -0.066 | 0.3 | NO |
| 184 | PSMD12 | PSMD12 | PSMD12 | 9660 | -0.074 | 0.29 | NO |
| 185 | CNOT8 | CNOT8 | CNOT8 | 9975 | -0.084 | 0.28 | NO |
| 186 | EIF4A2 | EIF4A2 | EIF4A2 | 10058 | -0.086 | 0.27 | NO |
| 187 | TNKS1BP1 | TNKS1BP1 | TNKS1BP1 | 10215 | -0.091 | 0.27 | NO |
| 188 | UPF3A | UPF3A | UPF3A | 10306 | -0.094 | 0.27 | NO |
| 189 | TNPO1 | TNPO1 | TNPO1 | 10479 | -0.1 | 0.26 | NO |
| 190 | DIS3 | DIS3 | DIS3 | 10675 | -0.1 | 0.25 | NO |
| 191 | CNOT4 | CNOT4 | CNOT4 | 10893 | -0.11 | 0.24 | NO |
| 192 | RPS4Y1 | RPS4Y1 | RPS4Y1 | 11175 | -0.12 | 0.23 | NO |
| 193 | CNOT6 | CNOT6 | CNOT6 | 11669 | -0.14 | 0.21 | NO |
| 194 | DCP1A | DCP1A | DCP1A | 11865 | -0.14 | 0.2 | NO |
| 195 | EIF4G1 | EIF4G1 | EIF4G1 | 11885 | -0.14 | 0.21 | NO |
| 196 | AKT1 | AKT1 | AKT1 | 12074 | -0.15 | 0.2 | NO |
| 197 | RPL26L1 | RPL26L1 | RPL26L1 | 12727 | -0.18 | 0.17 | NO |
| 198 | FAM153A | FAM153A | FAM153A | 13059 | -0.19 | 0.16 | NO |
| 199 | PSMD5 | PSMD5 | PSMD5 | 13209 | -0.2 | 0.16 | NO |
| 200 | SMG1 | SMG1 | SMG1 | 13566 | -0.21 | 0.15 | NO |
| 201 | PRKCA | PRKCA | PRKCA | 14286 | -0.25 | 0.11 | NO |
| 202 | TNFSF13 | TNFSF13 | TNFSF13 | 14495 | -0.26 | 0.11 | NO |
| 203 | PATL1 | PATL1 | PATL1 | 14532 | -0.26 | 0.12 | NO |
| 204 | UPF2 | UPF2 | UPF2 | 14728 | -0.28 | 0.12 | NO |
| 205 | HSPA1B | HSPA1B | HSPA1B | 14796 | -0.28 | 0.12 | NO |
| 206 | ZFP36 | ZFP36 | ZFP36 | 15314 | -0.32 | 0.11 | NO |
| 207 | XRN1 | XRN1 | XRN1 | 15645 | -0.35 | 0.1 | NO |
| 208 | RQCD1 | RQCD1 | RQCD1 | 16298 | -0.43 | 0.078 | NO |
Figure S89. Get High-res Image This plot shows mRNAseq_cNMF expression data heatmap (on the left) a RunningEnrichmentScore(RES) plot (on the top right) and a Signal2Noise(S2N) plot (on the bottom right) of genes in the pathway: REACTOME TRANSLATION.
Figure S90. Get High-res Image For the top 5 core enriched genes in the pathway: REACTOME TRANSLATION, this volcano plot shows how much they are up/down-regulated and significant. The significance was calculated by empirical bayesian fit

Table S46. Get Full Table This table shows a Running Enrichment Score (RES) of each gene in this pathway, that is, the enrichment score at this point in the ranked list of genes. All genes are ranked by Signal-to-Noise (S2N), a measure of similarity as default and are used to obtain ES matrix of all genes. In this way, GSEA tool uses expression pattern of not only overlapped genes but also not-overlapped genes to produce ES matrix.
| Rank | GENE | SYMBOL | DESC | LIST.LOC | S2N | RES | CORE_ENRICHMENT |
|---|---|---|---|---|---|---|---|
| 1 | RPL21 | RPL21 | RPL21 | 4 | 0.85 | 0.051 | YES |
| 2 | RPL9 | RPL9 | RPL9 | 200 | 0.51 | 0.07 | YES |
| 3 | RPL39 | RPL39 | RPL39 | 278 | 0.46 | 0.093 | YES |
| 4 | RPSAP9 | RPSAP9 | RPSAP9 | 985 | 0.28 | 0.07 | YES |
| 5 | RPL36 | RPL36 | RPL36 | 1156 | 0.26 | 0.076 | YES |
| 6 | RPLP2 | RPLP2 | RPLP2 | 1353 | 0.24 | 0.079 | YES |
| 7 | RPL35 | RPL35 | RPL35 | 1413 | 0.24 | 0.09 | YES |
| 8 | RPL38 | RPL38 | RPL38 | 1457 | 0.24 | 0.1 | YES |
| 9 | RPL13 | RPL13 | RPL13 | 1464 | 0.23 | 0.12 | YES |
| 10 | RPS15 | RPS15 | RPS15 | 1518 | 0.23 | 0.12 | YES |
| 11 | RPS19 | RPS19 | RPS19 | 1618 | 0.22 | 0.13 | YES |
| 12 | RPS21 | RPS21 | RPS21 | 1640 | 0.22 | 0.14 | YES |
| 13 | RPL27A | RPL27A | RPL27A | 1733 | 0.21 | 0.15 | YES |
| 14 | RPS29 | RPS29 | RPS29 | 1790 | 0.21 | 0.16 | YES |
| 15 | RPL34 | RPL34 | RPL34 | 1797 | 0.21 | 0.17 | YES |
| 16 | RPL18 | RPL18 | RPL18 | 1832 | 0.21 | 0.18 | YES |
| 17 | RPS10 | RPS10 | RPS10 | 1864 | 0.2 | 0.2 | YES |
| 18 | RPL28 | RPL28 | RPL28 | 1867 | 0.2 | 0.21 | YES |
| 19 | RPL37 | RPL37 | RPL37 | 1876 | 0.2 | 0.22 | YES |
| 20 | RPL23 | RPL23 | RPL23 | 1880 | 0.2 | 0.23 | YES |
| 21 | RPL24 | RPL24 | RPL24 | 1895 | 0.2 | 0.24 | YES |
| 22 | RPL37A | RPL37A | RPL37A | 1898 | 0.2 | 0.25 | YES |
| 23 | UBA52 | UBA52 | UBA52 | 1899 | 0.2 | 0.26 | YES |
| 24 | RPL18A | RPL18A | RPL18A | 1923 | 0.2 | 0.28 | YES |
| 25 | RPL23A | RPL23A | RPL23A | 1936 | 0.2 | 0.29 | YES |
| 26 | RPS15A | RPS15A | RPS15A | 1942 | 0.2 | 0.3 | YES |
| 27 | RPS7 | RPS7 | RPS7 | 1967 | 0.2 | 0.31 | YES |
| 28 | RPS4X | RPS4X | RPS4X | 1982 | 0.2 | 0.32 | YES |
| 29 | FAU | FAU | FAU | 1984 | 0.2 | 0.33 | YES |
| 30 | RPS27A | RPS27A | RPS27A | 2012 | 0.2 | 0.34 | YES |
| 31 | RPL11 | RPL11 | RPL11 | 2136 | 0.19 | 0.35 | YES |
| 32 | RPS5 | RPS5 | RPS5 | 2175 | 0.18 | 0.36 | YES |
| 33 | RPL30 | RPL30 | RPL30 | 2207 | 0.18 | 0.36 | YES |
| 34 | RPS9 | RPS9 | RPS9 | 2232 | 0.18 | 0.37 | YES |
| 35 | RPL8 | RPL8 | RPL8 | 2296 | 0.18 | 0.38 | YES |
| 36 | RPS3A | RPS3A | RPS3A | 2330 | 0.18 | 0.39 | YES |
| 37 | RPL31 | RPL31 | RPL31 | 2333 | 0.18 | 0.4 | YES |
| 38 | RPS11 | RPS11 | RPS11 | 2416 | 0.17 | 0.4 | YES |
| 39 | RPS3 | RPS3 | RPS3 | 2452 | 0.17 | 0.41 | YES |
| 40 | RPL7 | RPL7 | RPL7 | 2470 | 0.17 | 0.42 | YES |
| 41 | RPL12 | RPL12 | RPL12 | 2502 | 0.17 | 0.43 | YES |
| 42 | RPS16 | RPS16 | RPS16 | 2569 | 0.16 | 0.44 | YES |
| 43 | RPS12 | RPS12 | RPS12 | 2570 | 0.16 | 0.45 | YES |
| 44 | RPL32 | RPL32 | RPL32 | 2573 | 0.16 | 0.46 | YES |
| 45 | RPL7A | RPL7A | RPL7A | 2586 | 0.16 | 0.46 | YES |
| 46 | RPL29 | RPL29 | RPL29 | 2618 | 0.16 | 0.47 | YES |
| 47 | SEC61G | SEC61G | SEC61G | 2661 | 0.16 | 0.48 | YES |
| 48 | RPS20 | RPS20 | RPS20 | 2665 | 0.16 | 0.49 | YES |
| 49 | RPL14 | RPL14 | RPL14 | 2753 | 0.16 | 0.49 | YES |
| 50 | RPS6 | RPS6 | RPS6 | 2769 | 0.16 | 0.5 | YES |
| 51 | RPL41 | RPL41 | RPL41 | 2793 | 0.15 | 0.51 | YES |
| 52 | RPL27 | RPL27 | RPL27 | 2798 | 0.15 | 0.52 | YES |
| 53 | RPS24 | RPS24 | RPS24 | 2807 | 0.15 | 0.53 | YES |
| 54 | SSR4 | SSR4 | SSR4 | 2809 | 0.15 | 0.54 | YES |
| 55 | RPL36A | RPL36A | RPL36A | 2811 | 0.15 | 0.55 | YES |
| 56 | RPS25 | RPS25 | RPS25 | 2831 | 0.15 | 0.55 | YES |
| 57 | RPS13 | RPS13 | RPS13 | 2852 | 0.15 | 0.56 | YES |
| 58 | RPSA | RPSA | RPSA | 2869 | 0.15 | 0.57 | YES |
| 59 | RPS8 | RPS8 | RPS8 | 2881 | 0.15 | 0.58 | YES |
| 60 | RPS14 | RPS14 | RPS14 | 2902 | 0.15 | 0.58 | YES |
| 61 | RPL22 | RPL22 | RPL22 | 2984 | 0.14 | 0.59 | YES |
| 62 | RPL13A | RPL13A | RPL13A | 3013 | 0.14 | 0.6 | YES |
| 63 | RPS27 | RPS27 | RPS27 | 3101 | 0.14 | 0.6 | YES |
| 64 | RPS17 | RPS17 | RPS17 | 3174 | 0.14 | 0.6 | YES |
| 65 | RPL10A | RPL10A | RPL10A | 3194 | 0.14 | 0.61 | YES |
| 66 | RPL35A | RPL35A | RPL35A | 3294 | 0.13 | 0.61 | YES |
| 67 | RPL5 | RPL5 | RPL5 | 3318 | 0.13 | 0.62 | YES |
| 68 | RPS2 | RPS2 | RPS2 | 3321 | 0.13 | 0.63 | YES |
| 69 | RPL19 | RPL19 | RPL19 | 3328 | 0.13 | 0.63 | YES |
| 70 | RPS18 | RPS18 | RPS18 | 3372 | 0.13 | 0.64 | YES |
| 71 | RPL10 | RPL10 | RPL10 | 3490 | 0.12 | 0.64 | YES |
| 72 | RPL6 | RPL6 | RPL6 | 3500 | 0.12 | 0.65 | YES |
| 73 | RPL15 | RPL15 | RPL15 | 3597 | 0.12 | 0.65 | YES |
| 74 | RPLP1 | RPLP1 | RPLP1 | 3700 | 0.11 | 0.65 | YES |
| 75 | SSR2 | SSR2 | SSR2 | 3838 | 0.11 | 0.65 | YES |
| 76 | RPS23 | RPS23 | RPS23 | 3881 | 0.11 | 0.65 | YES |
| 77 | RPL4 | RPL4 | RPL4 | 4085 | 0.099 | 0.65 | YES |
| 78 | RPL26 | RPL26 | RPL26 | 4099 | 0.099 | 0.65 | YES |
| 79 | RPLP0 | RPLP0 | RPLP0 | 4172 | 0.096 | 0.65 | YES |
| 80 | RPN2 | RPN2 | RPN2 | 4333 | 0.091 | 0.65 | NO |
| 81 | SEC61B | SEC61B | SEC61B | 4733 | 0.077 | 0.63 | NO |
| 82 | SRP19 | SRP19 | SRP19 | 4852 | 0.072 | 0.63 | NO |
| 83 | RPL17 | RPL17 | RPL17 | 4891 | 0.071 | 0.63 | NO |
| 84 | SEC11C | SEC11C | SEC11C | 5251 | 0.06 | 0.61 | NO |
| 85 | SRP9 | SRP9 | SRP9 | 5535 | 0.052 | 0.6 | NO |
| 86 | RPL3 | RPL3 | RPL3 | 5665 | 0.048 | 0.6 | NO |
| 87 | RPS28 | RPS28 | RPS28 | 6298 | 0.028 | 0.56 | NO |
| 88 | SRP14 | SRP14 | SRP14 | 6428 | 0.024 | 0.56 | NO |
| 89 | RPS26 | RPS26 | RPS26 | 6567 | 0.02 | 0.55 | NO |
| 90 | SPCS1 | SPCS1 | SPCS1 | 6593 | 0.02 | 0.55 | NO |
| 91 | RPN1 | RPN1 | RPN1 | 6837 | 0.012 | 0.54 | NO |
| 92 | SPCS2 | SPCS2 | SPCS2 | 7284 | -0.00092 | 0.51 | NO |
| 93 | SEC61A1 | SEC61A1 | SEC61A1 | 7351 | -0.0027 | 0.51 | NO |
| 94 | SRPR | SRPR | SRPR | 7397 | -0.0042 | 0.5 | NO |
| 95 | SEC11A | SEC11A | SEC11A | 7445 | -0.0059 | 0.5 | NO |
| 96 | SSR3 | SSR3 | SSR3 | 7556 | -0.0088 | 0.5 | NO |
| 97 | LOC653566 | LOC653566 | LOC653566 | 7623 | -0.011 | 0.49 | NO |
| 98 | SRPRB | SRPRB | SRPRB | 7724 | -0.014 | 0.49 | NO |
| 99 | SRP68 | SRP68 | SRP68 | 7920 | -0.02 | 0.48 | NO |
| 100 | DDOST | DDOST | DDOST | 8326 | -0.033 | 0.46 | NO |
| 101 | SSR1 | SSR1 | SSR1 | 9421 | -0.067 | 0.4 | NO |
| 102 | SRP72 | SRP72 | SRP72 | 9454 | -0.068 | 0.4 | NO |
| 103 | SRP54 | SRP54 | SRP54 | 9899 | -0.082 | 0.38 | NO |
| 104 | TRAM1 | TRAM1 | TRAM1 | 10033 | -0.086 | 0.38 | NO |
| 105 | SPCS3 | SPCS3 | SPCS3 | 10211 | -0.091 | 0.37 | NO |
| 106 | RPS4Y1 | RPS4Y1 | RPS4Y1 | 11175 | -0.12 | 0.33 | NO |
| 107 | RPL26L1 | RPL26L1 | RPL26L1 | 12727 | -0.18 | 0.25 | NO |
| 108 | FAM153A | FAM153A | FAM153A | 13059 | -0.19 | 0.24 | NO |
| 109 | SEC61A2 | SEC61A2 | SEC61A2 | 15762 | -0.36 | 0.11 | NO |
Figure S91. Get High-res Image This plot shows mRNAseq_cNMF expression data heatmap (on the left) a RunningEnrichmentScore(RES) plot (on the top right) and a Signal2Noise(S2N) plot (on the bottom right) of genes in the pathway: REACTOME FORMATION OF THE TERNARY COMPLEX AND SUBSEQUENTLY THE 43S COMPLEX.
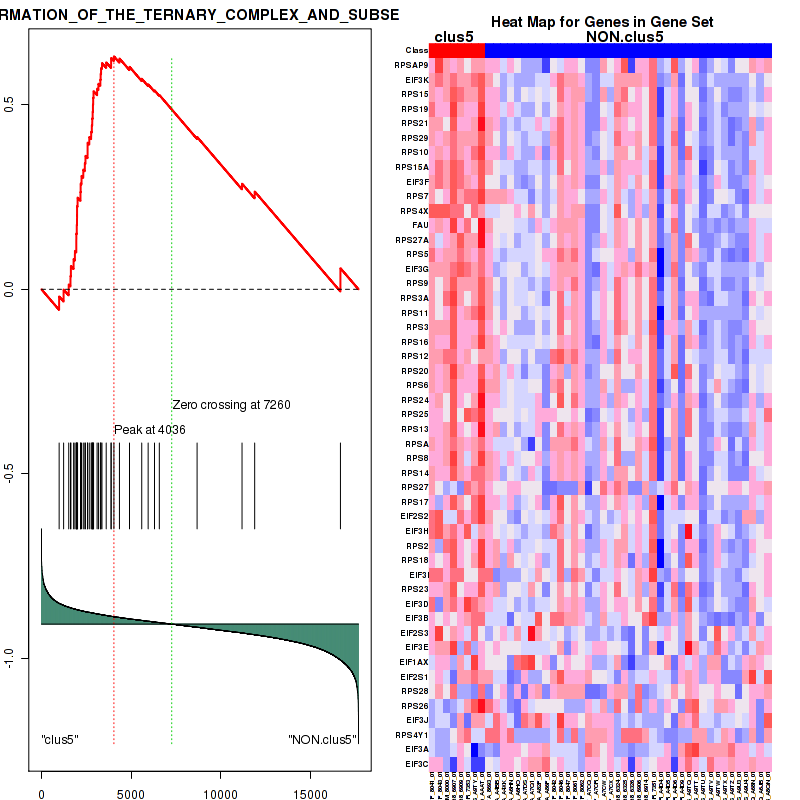
Figure S92. Get High-res Image For the top 5 core enriched genes in the pathway: REACTOME FORMATION OF THE TERNARY COMPLEX AND SUBSEQUENTLY THE 43S COMPLEX, this volcano plot shows how much they are up/down-regulated and significant. The significance was calculated by empirical bayesian fit
Table S47. Get Full Table This table shows a Running Enrichment Score (RES) of each gene in this pathway, that is, the enrichment score at this point in the ranked list of genes. All genes are ranked by Signal-to-Noise (S2N), a measure of similarity as default and are used to obtain ES matrix of all genes. In this way, GSEA tool uses expression pattern of not only overlapped genes but also not-overlapped genes to produce ES matrix.
| Rank | GENE | SYMBOL | DESC | LIST.LOC | S2N | RES | CORE_ENRICHMENT |
|---|---|---|---|---|---|---|---|
| 1 | RPL21 | RPL21 | RPL21 | 4 | 0.85 | 0.05 | YES |
| 2 | RPL9 | RPL9 | RPL9 | 200 | 0.51 | 0.069 | YES |
| 3 | RPL39 | RPL39 | RPL39 | 278 | 0.46 | 0.092 | YES |
| 4 | RPSAP9 | RPSAP9 | RPSAP9 | 985 | 0.28 | 0.068 | YES |
| 5 | RPL36 | RPL36 | RPL36 | 1156 | 0.26 | 0.074 | YES |
| 6 | RPLP2 | RPLP2 | RPLP2 | 1353 | 0.24 | 0.077 | YES |
| 7 | RPL35 | RPL35 | RPL35 | 1413 | 0.24 | 0.088 | YES |
| 8 | RPL38 | RPL38 | RPL38 | 1457 | 0.24 | 0.099 | YES |
| 9 | RPL13 | RPL13 | RPL13 | 1464 | 0.23 | 0.11 | YES |
| 10 | RPS15 | RPS15 | RPS15 | 1518 | 0.23 | 0.12 | YES |
| 11 | RPS19 | RPS19 | RPS19 | 1618 | 0.22 | 0.13 | YES |
| 12 | RPS21 | RPS21 | RPS21 | 1640 | 0.22 | 0.14 | YES |
| 13 | RPL27A | RPL27A | RPL27A | 1733 | 0.21 | 0.15 | YES |
| 14 | RPS29 | RPS29 | RPS29 | 1790 | 0.21 | 0.16 | YES |
| 15 | RPL34 | RPL34 | RPL34 | 1797 | 0.21 | 0.17 | YES |
| 16 | RPL18 | RPL18 | RPL18 | 1832 | 0.21 | 0.18 | YES |
| 17 | RPS10 | RPS10 | RPS10 | 1864 | 0.2 | 0.19 | YES |
| 18 | RPL28 | RPL28 | RPL28 | 1867 | 0.2 | 0.2 | YES |
| 19 | RPL37 | RPL37 | RPL37 | 1876 | 0.2 | 0.22 | YES |
| 20 | RPL23 | RPL23 | RPL23 | 1880 | 0.2 | 0.23 | YES |
| 21 | RPL24 | RPL24 | RPL24 | 1895 | 0.2 | 0.24 | YES |
| 22 | RPL37A | RPL37A | RPL37A | 1898 | 0.2 | 0.25 | YES |
| 23 | UBA52 | UBA52 | UBA52 | 1899 | 0.2 | 0.26 | YES |
| 24 | RPL18A | RPL18A | RPL18A | 1923 | 0.2 | 0.27 | YES |
| 25 | RPL23A | RPL23A | RPL23A | 1936 | 0.2 | 0.28 | YES |
| 26 | RPS15A | RPS15A | RPS15A | 1942 | 0.2 | 0.29 | YES |
| 27 | RPS7 | RPS7 | RPS7 | 1967 | 0.2 | 0.3 | YES |
| 28 | RPS4X | RPS4X | RPS4X | 1982 | 0.2 | 0.32 | YES |
| 29 | FAU | FAU | FAU | 1984 | 0.2 | 0.33 | YES |
| 30 | RPS27A | RPS27A | RPS27A | 2012 | 0.2 | 0.34 | YES |
| 31 | RPL11 | RPL11 | RPL11 | 2136 | 0.19 | 0.34 | YES |
| 32 | RPS5 | RPS5 | RPS5 | 2175 | 0.18 | 0.35 | YES |
| 33 | RPL30 | RPL30 | RPL30 | 2207 | 0.18 | 0.36 | YES |
| 34 | RPS9 | RPS9 | RPS9 | 2232 | 0.18 | 0.37 | YES |
| 35 | RPL8 | RPL8 | RPL8 | 2296 | 0.18 | 0.37 | YES |
| 36 | RPS3A | RPS3A | RPS3A | 2330 | 0.18 | 0.38 | YES |
| 37 | RPL31 | RPL31 | RPL31 | 2333 | 0.18 | 0.39 | YES |
| 38 | RPS11 | RPS11 | RPS11 | 2416 | 0.17 | 0.4 | YES |
| 39 | RPS3 | RPS3 | RPS3 | 2452 | 0.17 | 0.41 | YES |
| 40 | RPL7 | RPL7 | RPL7 | 2470 | 0.17 | 0.42 | YES |
| 41 | RPL12 | RPL12 | RPL12 | 2502 | 0.17 | 0.42 | YES |
| 42 | GSPT2 | GSPT2 | GSPT2 | 2505 | 0.17 | 0.43 | YES |
| 43 | RPS16 | RPS16 | RPS16 | 2569 | 0.16 | 0.44 | YES |
| 44 | RPS12 | RPS12 | RPS12 | 2570 | 0.16 | 0.45 | YES |
| 45 | RPL32 | RPL32 | RPL32 | 2573 | 0.16 | 0.46 | YES |
| 46 | RPL7A | RPL7A | RPL7A | 2586 | 0.16 | 0.47 | YES |
| 47 | RPL29 | RPL29 | RPL29 | 2618 | 0.16 | 0.48 | YES |
| 48 | RPS20 | RPS20 | RPS20 | 2665 | 0.16 | 0.48 | YES |
| 49 | RPL14 | RPL14 | RPL14 | 2753 | 0.16 | 0.49 | YES |
| 50 | RPS6 | RPS6 | RPS6 | 2769 | 0.16 | 0.49 | YES |
| 51 | RPL41 | RPL41 | RPL41 | 2793 | 0.15 | 0.5 | YES |
| 52 | RPL27 | RPL27 | RPL27 | 2798 | 0.15 | 0.51 | YES |
| 53 | RPS24 | RPS24 | RPS24 | 2807 | 0.15 | 0.52 | YES |
| 54 | RPL36A | RPL36A | RPL36A | 2811 | 0.15 | 0.53 | YES |
| 55 | RPS25 | RPS25 | RPS25 | 2831 | 0.15 | 0.54 | YES |
| 56 | RPS13 | RPS13 | RPS13 | 2852 | 0.15 | 0.54 | YES |
| 57 | RPSA | RPSA | RPSA | 2869 | 0.15 | 0.55 | YES |
| 58 | RPS8 | RPS8 | RPS8 | 2881 | 0.15 | 0.56 | YES |
| 59 | RPS14 | RPS14 | RPS14 | 2902 | 0.15 | 0.57 | YES |
| 60 | RPL22 | RPL22 | RPL22 | 2984 | 0.14 | 0.57 | YES |
| 61 | RPL13A | RPL13A | RPL13A | 3013 | 0.14 | 0.58 | YES |
| 62 | PPP2R1A | PPP2R1A | PPP2R1A | 3098 | 0.14 | 0.58 | YES |
| 63 | RPS27 | RPS27 | RPS27 | 3101 | 0.14 | 0.59 | YES |
| 64 | RPS17 | RPS17 | RPS17 | 3174 | 0.14 | 0.59 | YES |
| 65 | RPL10A | RPL10A | RPL10A | 3194 | 0.14 | 0.6 | YES |
| 66 | RPL35A | RPL35A | RPL35A | 3294 | 0.13 | 0.6 | YES |
| 67 | RPL5 | RPL5 | RPL5 | 3318 | 0.13 | 0.61 | YES |
| 68 | RPS2 | RPS2 | RPS2 | 3321 | 0.13 | 0.62 | YES |
| 69 | RPL19 | RPL19 | RPL19 | 3328 | 0.13 | 0.62 | YES |
| 70 | RPS18 | RPS18 | RPS18 | 3372 | 0.13 | 0.63 | YES |
| 71 | RBM8A | RBM8A | RBM8A | 3423 | 0.13 | 0.63 | YES |
| 72 | RPL10 | RPL10 | RPL10 | 3490 | 0.12 | 0.64 | YES |
| 73 | RPL6 | RPL6 | RPL6 | 3500 | 0.12 | 0.64 | YES |
| 74 | RPL15 | RPL15 | RPL15 | 3597 | 0.12 | 0.64 | YES |
| 75 | RPLP1 | RPLP1 | RPLP1 | 3700 | 0.11 | 0.65 | YES |
| 76 | MAGOH | MAGOH | MAGOH | 3747 | 0.11 | 0.65 | YES |
| 77 | RPS23 | RPS23 | RPS23 | 3881 | 0.11 | 0.65 | YES |
| 78 | RPL4 | RPL4 | RPL4 | 4085 | 0.099 | 0.64 | YES |
| 79 | RPL26 | RPL26 | RPL26 | 4099 | 0.099 | 0.65 | YES |
| 80 | RPLP0 | RPLP0 | RPLP0 | 4172 | 0.096 | 0.65 | YES |
| 81 | UPF3B | UPF3B | UPF3B | 4228 | 0.094 | 0.65 | YES |
| 82 | NCBP2 | NCBP2 | NCBP2 | 4567 | 0.082 | 0.64 | NO |
| 83 | RPL17 | RPL17 | RPL17 | 4891 | 0.071 | 0.62 | NO |
| 84 | PPP2R2A | PPP2R2A | PPP2R2A | 5463 | 0.054 | 0.59 | NO |
| 85 | PPP2CA | PPP2CA | PPP2CA | 5628 | 0.049 | 0.59 | NO |
| 86 | RPL3 | RPL3 | RPL3 | 5665 | 0.048 | 0.59 | NO |
| 87 | RNPS1 | RNPS1 | RNPS1 | 5886 | 0.041 | 0.58 | NO |
| 88 | RPS28 | RPS28 | RPS28 | 6298 | 0.028 | 0.56 | NO |
| 89 | RPS26 | RPS26 | RPS26 | 6567 | 0.02 | 0.54 | NO |
| 90 | SMG5 | SMG5 | SMG5 | 6772 | 0.014 | 0.53 | NO |
| 91 | PABPC1 | PABPC1 | PABPC1 | 7683 | -0.013 | 0.48 | NO |
| 92 | SMG6 | SMG6 | SMG6 | 7969 | -0.022 | 0.47 | NO |
| 93 | CASC3 | CASC3 | CASC3 | 8455 | -0.036 | 0.44 | NO |
| 94 | EIF4A3 | EIF4A3 | EIF4A3 | 8614 | -0.041 | 0.43 | NO |
| 95 | ETF1 | ETF1 | ETF1 | 8791 | -0.046 | 0.43 | NO |
| 96 | SMG7 | SMG7 | SMG7 | 8949 | -0.052 | 0.42 | NO |
| 97 | NCBP1 | NCBP1 | NCBP1 | 9240 | -0.061 | 0.41 | NO |
| 98 | UPF3A | UPF3A | UPF3A | 10306 | -0.094 | 0.35 | NO |
| 99 | RPS4Y1 | RPS4Y1 | RPS4Y1 | 11175 | -0.12 | 0.31 | NO |
| 100 | EIF4G1 | EIF4G1 | EIF4G1 | 11885 | -0.14 | 0.28 | NO |
| 101 | RPL26L1 | RPL26L1 | RPL26L1 | 12727 | -0.18 | 0.24 | NO |
| 102 | FAM153A | FAM153A | FAM153A | 13059 | -0.19 | 0.23 | NO |
| 103 | SMG1 | SMG1 | SMG1 | 13566 | -0.21 | 0.22 | NO |
| 104 | UPF2 | UPF2 | UPF2 | 14728 | -0.28 | 0.17 | NO |
Figure S93. Get High-res Image This plot shows mRNAseq_cNMF expression data heatmap (on the left) a RunningEnrichmentScore(RES) plot (on the top right) and a Signal2Noise(S2N) plot (on the bottom right) of genes in the pathway: REACTOME TCA CYCLE AND RESPIRATORY ELECTRON TRANSPORT.
Figure S94. Get High-res Image For the top 5 core enriched genes in the pathway: REACTOME TCA CYCLE AND RESPIRATORY ELECTRON TRANSPORT, this volcano plot shows how much they are up/down-regulated and significant. The significance was calculated by empirical bayesian fit
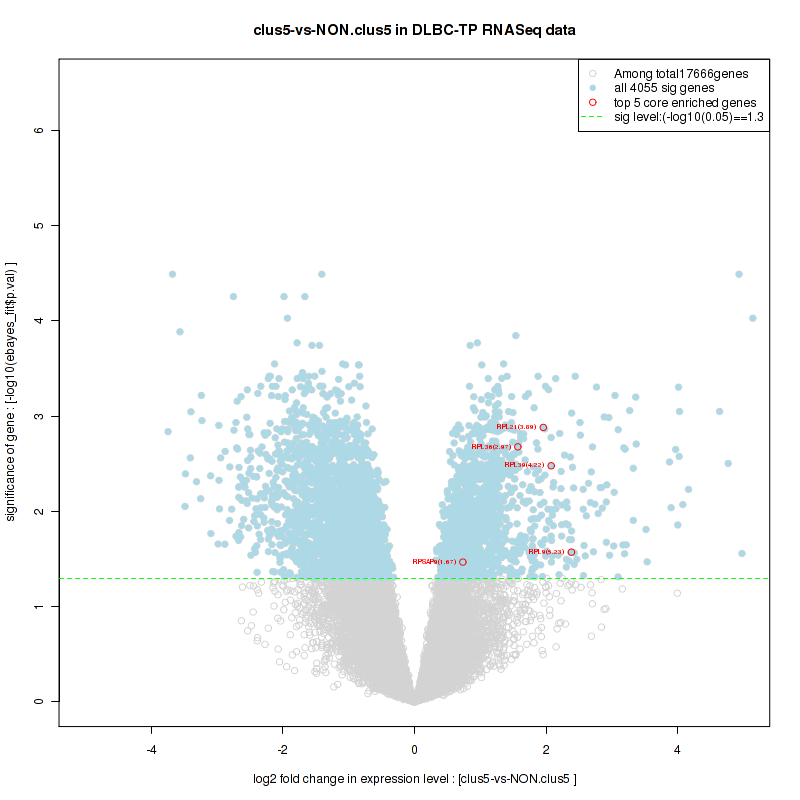
Table S48. Get Full Table This table shows a Running Enrichment Score (RES) of each gene in this pathway, that is, the enrichment score at this point in the ranked list of genes. All genes are ranked by Signal-to-Noise (S2N), a measure of similarity as default and are used to obtain ES matrix of all genes. In this way, GSEA tool uses expression pattern of not only overlapped genes but also not-overlapped genes to produce ES matrix.
| Rank | GENE | SYMBOL | DESC | LIST.LOC | S2N | RES | CORE_ENRICHMENT |
|---|---|---|---|---|---|---|---|
| 1 | PSMB3 | PSMB3 | PSMB3 | 1333 | 0.24 | -0.034 | YES |
| 2 | PSMC1 | PSMC1 | PSMC1 | 1732 | 0.21 | -0.021 | YES |
| 3 | UBA52 | UBA52 | UBA52 | 1899 | 0.2 | 0.0039 | YES |
| 4 | RPS27A | RPS27A | RPS27A | 2012 | 0.2 | 0.03 | YES |
| 5 | PSMD4 | PSMD4 | PSMD4 | 2195 | 0.18 | 0.051 | YES |
| 6 | PSMC5 | PSMC5 | PSMC5 | 2418 | 0.17 | 0.067 | YES |
| 7 | PSMB10 | PSMB10 | PSMB10 | 2441 | 0.17 | 0.095 | YES |
| 8 | PSMB6 | PSMB6 | PSMB6 | 2513 | 0.17 | 0.12 | YES |
| 9 | PSMD9 | PSMD9 | PSMD9 | 2535 | 0.16 | 0.15 | YES |
| 10 | PSMD13 | PSMD13 | PSMD13 | 2538 | 0.16 | 0.17 | YES |
| 11 | PSMB7 | PSMB7 | PSMB7 | 2564 | 0.16 | 0.2 | YES |
| 12 | PSMC3 | PSMC3 | PSMC3 | 2595 | 0.16 | 0.23 | YES |
| 13 | PSMB1 | PSMB1 | PSMB1 | 2926 | 0.15 | 0.23 | YES |
| 14 | PSMA7 | PSMA7 | PSMA7 | 3019 | 0.14 | 0.25 | YES |
| 15 | PSMB4 | PSMB4 | PSMB4 | 3165 | 0.14 | 0.26 | YES |
| 16 | NFKBIB | NFKBIB | NFKBIB | 3308 | 0.13 | 0.28 | YES |
| 17 | NFKBIE | NFKBIE | NFKBIE | 3334 | 0.13 | 0.3 | YES |
| 18 | PSMC4 | PSMC4 | PSMC4 | 3410 | 0.13 | 0.32 | YES |
| 19 | PSMA2 | PSMA2 | PSMA2 | 3742 | 0.11 | 0.32 | YES |
| 20 | SKP1 | SKP1 | SKP1 | 3973 | 0.1 | 0.32 | YES |
| 21 | PSMD10 | PSMD10 | PSMD10 | 4023 | 0.1 | 0.34 | YES |
| 22 | PSMD8 | PSMD8 | PSMD8 | 4223 | 0.094 | 0.34 | YES |
| 23 | PSMA4 | PSMA4 | PSMA4 | 4241 | 0.094 | 0.36 | YES |
| 24 | PSME2 | PSME2 | PSME2 | 4314 | 0.091 | 0.37 | YES |
| 25 | PSMA6 | PSMA6 | PSMA6 | 4591 | 0.081 | 0.36 | YES |
| 26 | PSMA5 | PSMA5 | PSMA5 | 4925 | 0.07 | 0.36 | YES |
| 27 | PSMB5 | PSMB5 | PSMB5 | 5071 | 0.065 | 0.36 | YES |
| 28 | PSMD6 | PSMD6 | PSMD6 | 5107 | 0.064 | 0.37 | YES |
| 29 | PSMA3 | PSMA3 | PSMA3 | 5408 | 0.056 | 0.36 | YES |
| 30 | PSMD7 | PSMD7 | PSMD7 | 5438 | 0.055 | 0.37 | YES |
| 31 | PSMC2 | PSMC2 | PSMC2 | 5503 | 0.053 | 0.37 | YES |
| 32 | BCL10 | BCL10 | BCL10 | 5640 | 0.049 | 0.38 | YES |
| 33 | PSME1 | PSME1 | PSME1 | 5670 | 0.048 | 0.38 | YES |
| 34 | MALT1 | MALT1 | MALT1 | 5693 | 0.047 | 0.39 | YES |
| 35 | PSMB9 | PSMB9 | PSMB9 | 5747 | 0.045 | 0.39 | YES |
| 36 | PSMF1 | PSMF1 | PSMF1 | 5919 | 0.04 | 0.39 | YES |
| 37 | IKBKG | IKBKG | IKBKG | 5954 | 0.039 | 0.39 | YES |
| 38 | PSMB2 | PSMB2 | PSMB2 | 5987 | 0.038 | 0.4 | YES |
| 39 | PSMD1 | PSMD1 | PSMD1 | 5991 | 0.038 | 0.4 | YES |
| 40 | PSMC6 | PSMC6 | PSMC6 | 6053 | 0.036 | 0.41 | YES |
| 41 | PSMA1 | PSMA1 | PSMA1 | 6293 | 0.028 | 0.4 | NO |
| 42 | NFKBIA | NFKBIA | NFKBIA | 6464 | 0.023 | 0.39 | NO |
| 43 | REL | REL | REL | 6507 | 0.022 | 0.4 | NO |
| 44 | PSMD14 | PSMD14 | PSMD14 | 6775 | 0.014 | 0.38 | NO |
| 45 | PSMD11 | PSMD11 | PSMD11 | 6897 | 0.01 | 0.38 | NO |
| 46 | PSMB8 | PSMB8 | PSMB8 | 6918 | 0.0098 | 0.38 | NO |
| 47 | RELA | RELA | RELA | 7751 | -0.015 | 0.33 | NO |
| 48 | PSMD2 | PSMD2 | PSMD2 | 7817 | -0.017 | 0.33 | NO |
| 49 | MAP3K7 | MAP3K7 | MAP3K7 | 8040 | -0.024 | 0.32 | NO |
| 50 | PSMD3 | PSMD3 | PSMD3 | 8202 | -0.029 | 0.32 | NO |
| 51 | PSME4 | PSME4 | PSME4 | 8570 | -0.039 | 0.3 | NO |
| 52 | PSMA8 | PSMA8 | PSMA8 | 9025 | -0.054 | 0.29 | NO |
| 53 | PSMD12 | PSMD12 | PSMD12 | 9660 | -0.074 | 0.26 | NO |
| 54 | PRKCB | PRKCB | PRKCB | 10104 | -0.088 | 0.25 | NO |
| 55 | FBXW11 | FBXW11 | FBXW11 | 10181 | -0.09 | 0.26 | NO |
| 56 | IKBKB | IKBKB | IKBKB | 11233 | -0.12 | 0.23 | NO |
| 57 | CARD11 | CARD11 | CARD11 | 11581 | -0.14 | 0.23 | NO |
| 58 | CUL1 | CUL1 | CUL1 | 11853 | -0.14 | 0.24 | NO |
| 59 | BTRC | BTRC | BTRC | 12493 | -0.17 | 0.23 | NO |
| 60 | CHUK | CHUK | CHUK | 12761 | -0.18 | 0.24 | NO |
| 61 | PSMD5 | PSMD5 | PSMD5 | 13209 | -0.2 | 0.25 | NO |
Figure S95. Get High-res Image This plot shows mRNAseq_cNMF expression data heatmap (on the left) a RunningEnrichmentScore(RES) plot (on the top right) and a Signal2Noise(S2N) plot (on the bottom right) of genes in the pathway: REACTOME SRP DEPENDENT COTRANSLATIONAL PROTEIN TARGETING TO MEMBRANE.
Figure S96. Get High-res Image For the top 5 core enriched genes in the pathway: REACTOME SRP DEPENDENT COTRANSLATIONAL PROTEIN TARGETING TO MEMBRANE, this volcano plot shows how much they are up/down-regulated and significant. The significance was calculated by empirical bayesian fit
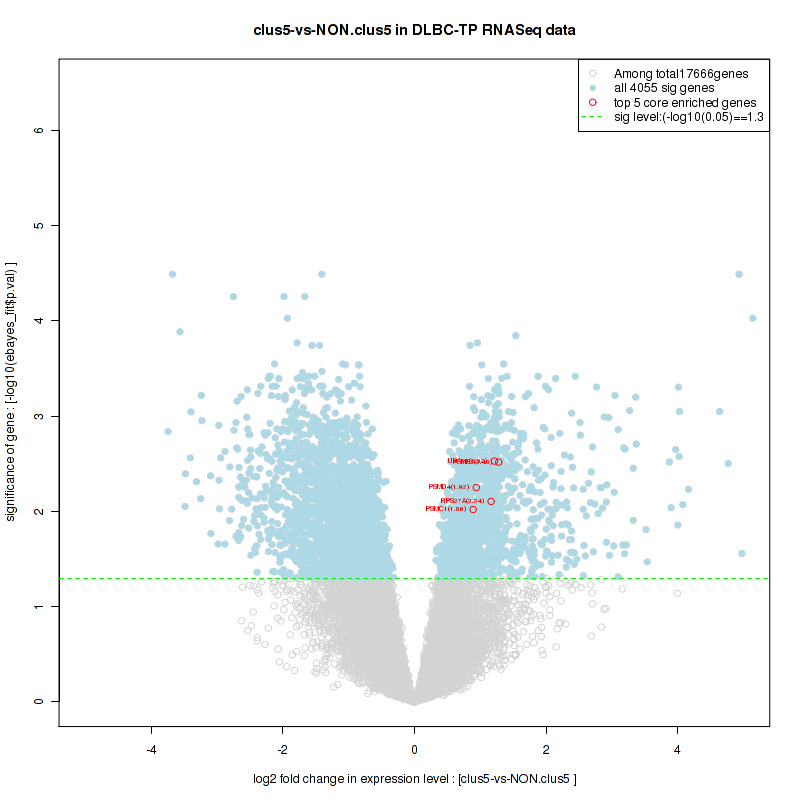
Table S49. Get Full Table This table shows a Running Enrichment Score (RES) of each gene in this pathway, that is, the enrichment score at this point in the ranked list of genes. All genes are ranked by Signal-to-Noise (S2N), a measure of similarity as default and are used to obtain ES matrix of all genes. In this way, GSEA tool uses expression pattern of not only overlapped genes but also not-overlapped genes to produce ES matrix.
| Rank | GENE | SYMBOL | DESC | LIST.LOC | S2N | RES | CORE_ENRICHMENT |
|---|---|---|---|---|---|---|---|
| 1 | RPL21 | RPL21 | RPL21 | 4 | 0.85 | 0.048 | YES |
| 2 | RPL9 | RPL9 | RPL9 | 200 | 0.51 | 0.066 | YES |
| 3 | RPL39 | RPL39 | RPL39 | 278 | 0.46 | 0.088 | YES |
| 4 | RPSAP9 | RPSAP9 | RPSAP9 | 985 | 0.28 | 0.064 | YES |
| 5 | RPL36 | RPL36 | RPL36 | 1156 | 0.26 | 0.069 | YES |
| 6 | EIF3K | EIF3K | EIF3K | 1233 | 0.26 | 0.079 | YES |
| 7 | RPLP2 | RPLP2 | RPLP2 | 1353 | 0.24 | 0.086 | YES |
| 8 | RPL35 | RPL35 | RPL35 | 1413 | 0.24 | 0.096 | YES |
| 9 | RPL38 | RPL38 | RPL38 | 1457 | 0.24 | 0.11 | YES |
| 10 | RPL13 | RPL13 | RPL13 | 1464 | 0.23 | 0.12 | YES |
| 11 | RPS15 | RPS15 | RPS15 | 1518 | 0.23 | 0.13 | YES |
| 12 | RPS19 | RPS19 | RPS19 | 1618 | 0.22 | 0.14 | YES |
| 13 | RPS21 | RPS21 | RPS21 | 1640 | 0.22 | 0.15 | YES |
| 14 | RPL27A | RPL27A | RPL27A | 1733 | 0.21 | 0.16 | YES |
| 15 | RPS29 | RPS29 | RPS29 | 1790 | 0.21 | 0.16 | YES |
| 16 | RPL34 | RPL34 | RPL34 | 1797 | 0.21 | 0.18 | YES |
| 17 | RPL18 | RPL18 | RPL18 | 1832 | 0.21 | 0.18 | YES |
| 18 | RPS10 | RPS10 | RPS10 | 1864 | 0.2 | 0.2 | YES |
| 19 | RPL28 | RPL28 | RPL28 | 1867 | 0.2 | 0.21 | YES |
| 20 | RPL37 | RPL37 | RPL37 | 1876 | 0.2 | 0.22 | YES |
| 21 | RPL23 | RPL23 | RPL23 | 1880 | 0.2 | 0.23 | YES |
| 22 | RPL24 | RPL24 | RPL24 | 1895 | 0.2 | 0.24 | YES |
| 23 | RPL37A | RPL37A | RPL37A | 1898 | 0.2 | 0.25 | YES |
| 24 | UBA52 | UBA52 | UBA52 | 1899 | 0.2 | 0.26 | YES |
| 25 | RPL18A | RPL18A | RPL18A | 1923 | 0.2 | 0.27 | YES |
| 26 | RPL23A | RPL23A | RPL23A | 1936 | 0.2 | 0.28 | YES |
| 27 | RPS15A | RPS15A | RPS15A | 1942 | 0.2 | 0.29 | YES |
| 28 | EIF3F | EIF3F | EIF3F | 1943 | 0.2 | 0.3 | YES |
| 29 | RPS7 | RPS7 | RPS7 | 1967 | 0.2 | 0.32 | YES |
| 30 | RPS4X | RPS4X | RPS4X | 1982 | 0.2 | 0.32 | YES |
| 31 | FAU | FAU | FAU | 1984 | 0.2 | 0.34 | YES |
| 32 | RPS27A | RPS27A | RPS27A | 2012 | 0.2 | 0.35 | YES |
| 33 | RPL11 | RPL11 | RPL11 | 2136 | 0.19 | 0.35 | YES |
| 34 | RPS5 | RPS5 | RPS5 | 2175 | 0.18 | 0.36 | YES |
| 35 | EIF3G | EIF3G | EIF3G | 2184 | 0.18 | 0.37 | YES |
| 36 | RPL30 | RPL30 | RPL30 | 2207 | 0.18 | 0.38 | YES |
| 37 | RPS9 | RPS9 | RPS9 | 2232 | 0.18 | 0.39 | YES |
| 38 | RPL8 | RPL8 | RPL8 | 2296 | 0.18 | 0.39 | YES |
| 39 | RPS3A | RPS3A | RPS3A | 2330 | 0.18 | 0.4 | YES |
| 40 | RPL31 | RPL31 | RPL31 | 2333 | 0.18 | 0.41 | YES |
| 41 | RPS11 | RPS11 | RPS11 | 2416 | 0.17 | 0.42 | YES |
| 42 | RPS3 | RPS3 | RPS3 | 2452 | 0.17 | 0.42 | YES |
| 43 | RPL7 | RPL7 | RPL7 | 2470 | 0.17 | 0.43 | YES |
| 44 | RPL12 | RPL12 | RPL12 | 2502 | 0.17 | 0.44 | YES |
| 45 | RPS16 | RPS16 | RPS16 | 2569 | 0.16 | 0.44 | YES |
| 46 | RPS12 | RPS12 | RPS12 | 2570 | 0.16 | 0.45 | YES |
| 47 | RPL32 | RPL32 | RPL32 | 2573 | 0.16 | 0.46 | YES |
| 48 | RPL7A | RPL7A | RPL7A | 2586 | 0.16 | 0.47 | YES |
| 49 | RPL29 | RPL29 | RPL29 | 2618 | 0.16 | 0.48 | YES |
| 50 | RPS20 | RPS20 | RPS20 | 2665 | 0.16 | 0.48 | YES |
| 51 | RPL14 | RPL14 | RPL14 | 2753 | 0.16 | 0.49 | YES |
| 52 | RPS6 | RPS6 | RPS6 | 2769 | 0.16 | 0.5 | YES |
| 53 | RPL41 | RPL41 | RPL41 | 2793 | 0.15 | 0.5 | YES |
| 54 | RPL27 | RPL27 | RPL27 | 2798 | 0.15 | 0.51 | YES |
| 55 | RPS24 | RPS24 | RPS24 | 2807 | 0.15 | 0.52 | YES |
| 56 | RPL36A | RPL36A | RPL36A | 2811 | 0.15 | 0.53 | YES |
| 57 | RPS25 | RPS25 | RPS25 | 2831 | 0.15 | 0.54 | YES |
| 58 | RPS13 | RPS13 | RPS13 | 2852 | 0.15 | 0.55 | YES |
| 59 | RPSA | RPSA | RPSA | 2869 | 0.15 | 0.55 | YES |
| 60 | RPS8 | RPS8 | RPS8 | 2881 | 0.15 | 0.56 | YES |
| 61 | RPS14 | RPS14 | RPS14 | 2902 | 0.15 | 0.57 | YES |
| 62 | RPL22 | RPL22 | RPL22 | 2984 | 0.14 | 0.57 | YES |
| 63 | RPL13A | RPL13A | RPL13A | 3013 | 0.14 | 0.58 | YES |
| 64 | RPS27 | RPS27 | RPS27 | 3101 | 0.14 | 0.58 | YES |
| 65 | RPS17 | RPS17 | RPS17 | 3174 | 0.14 | 0.58 | YES |
| 66 | RPL10A | RPL10A | RPL10A | 3194 | 0.14 | 0.59 | YES |
| 67 | EIF2S2 | EIF2S2 | EIF2S2 | 3282 | 0.13 | 0.59 | YES |
| 68 | RPL35A | RPL35A | RPL35A | 3294 | 0.13 | 0.6 | YES |
| 69 | EIF3H | EIF3H | EIF3H | 3297 | 0.13 | 0.61 | YES |
| 70 | RPL5 | RPL5 | RPL5 | 3318 | 0.13 | 0.61 | YES |
| 71 | RPS2 | RPS2 | RPS2 | 3321 | 0.13 | 0.62 | YES |
| 72 | RPL19 | RPL19 | RPL19 | 3328 | 0.13 | 0.63 | YES |
| 73 | RPS18 | RPS18 | RPS18 | 3372 | 0.13 | 0.63 | YES |
| 74 | RPL10 | RPL10 | RPL10 | 3490 | 0.12 | 0.63 | YES |
| 75 | RPL6 | RPL6 | RPL6 | 3500 | 0.12 | 0.64 | YES |
| 76 | RPL15 | RPL15 | RPL15 | 3597 | 0.12 | 0.64 | YES |
| 77 | EIF3I | EIF3I | EIF3I | 3609 | 0.12 | 0.65 | YES |
| 78 | RPLP1 | RPLP1 | RPLP1 | 3700 | 0.11 | 0.65 | YES |
| 79 | RPS23 | RPS23 | RPS23 | 3881 | 0.11 | 0.64 | YES |
| 80 | EIF3D | EIF3D | EIF3D | 3882 | 0.11 | 0.65 | YES |
| 81 | EIF3B | EIF3B | EIF3B | 4036 | 0.1 | 0.65 | YES |
| 82 | RPL4 | RPL4 | RPL4 | 4085 | 0.099 | 0.65 | YES |
| 83 | RPL26 | RPL26 | RPL26 | 4099 | 0.099 | 0.66 | YES |
| 84 | RPLP0 | RPLP0 | RPLP0 | 4172 | 0.096 | 0.66 | YES |
| 85 | EIF2S3 | EIF2S3 | EIF2S3 | 4346 | 0.09 | 0.65 | NO |
| 86 | RPL17 | RPL17 | RPL17 | 4891 | 0.071 | 0.62 | NO |
| 87 | EIF3E | EIF3E | EIF3E | 4904 | 0.07 | 0.63 | NO |
| 88 | EIF1AX | EIF1AX | EIF1AX | 5586 | 0.05 | 0.59 | NO |
| 89 | RPL3 | RPL3 | RPL3 | 5665 | 0.048 | 0.59 | NO |
| 90 | EIF4B | EIF4B | EIF4B | 5793 | 0.044 | 0.58 | NO |
| 91 | EIF2S1 | EIF2S1 | EIF2S1 | 5946 | 0.039 | 0.58 | NO |
| 92 | RPS28 | RPS28 | RPS28 | 6298 | 0.028 | 0.56 | NO |
| 93 | RPS26 | RPS26 | RPS26 | 6567 | 0.02 | 0.55 | NO |
| 94 | EIF4A1 | EIF4A1 | EIF4A1 | 6583 | 0.02 | 0.55 | NO |
| 95 | PABPC1 | PABPC1 | PABPC1 | 7683 | -0.013 | 0.48 | NO |
| 96 | EIF4H | EIF4H | EIF4H | 8332 | -0.033 | 0.45 | NO |
| 97 | EIF4E | EIF4E | EIF4E | 8492 | -0.037 | 0.44 | NO |
| 98 | EIF3J | EIF3J | EIF3J | 8672 | -0.043 | 0.44 | NO |
| 99 | EIF4A2 | EIF4A2 | EIF4A2 | 10058 | -0.086 | 0.36 | NO |
| 100 | RPS4Y1 | RPS4Y1 | RPS4Y1 | 11175 | -0.12 | 0.3 | NO |
| 101 | EIF3A | EIF3A | EIF3A | 11880 | -0.14 | 0.27 | NO |
| 102 | EIF4G1 | EIF4G1 | EIF4G1 | 11885 | -0.14 | 0.28 | NO |
| 103 | RPL26L1 | RPL26L1 | RPL26L1 | 12727 | -0.18 | 0.24 | NO |
| 104 | FAM153A | FAM153A | FAM153A | 13059 | -0.19 | 0.24 | NO |
| 105 | EIF3C | EIF3C | EIF3C | 16658 | -0.49 | 0.057 | NO |
Figure S97. Get High-res Image This plot shows mRNAseq_cNMF expression data heatmap (on the left) a RunningEnrichmentScore(RES) plot (on the top right) and a Signal2Noise(S2N) plot (on the bottom right) of genes in the pathway: REACTOME ACTIVATION OF NF KAPPAB IN B CELLS.
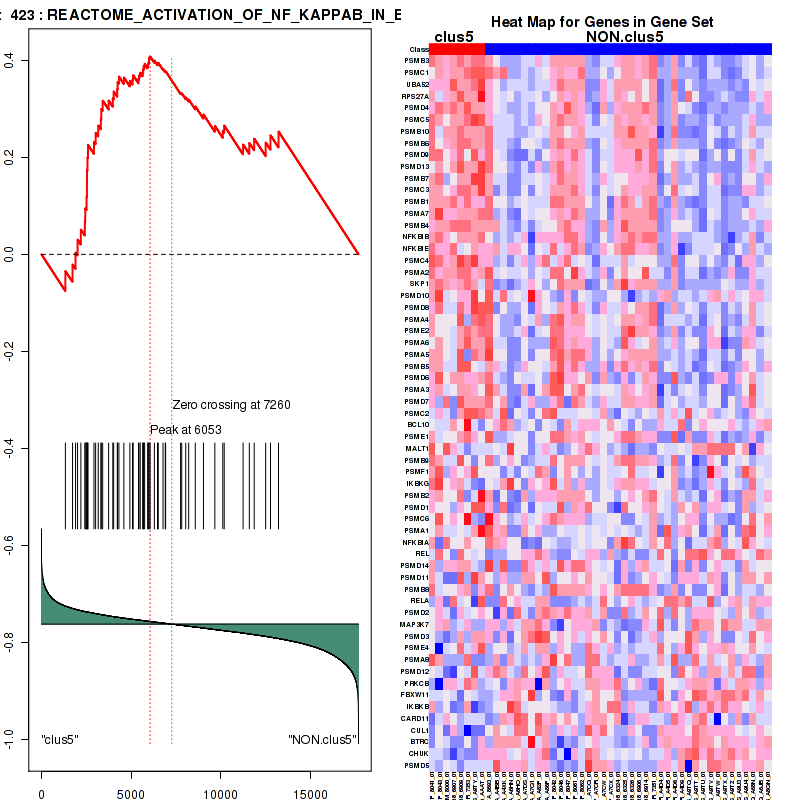
Figure S98. Get High-res Image For the top 5 core enriched genes in the pathway: REACTOME ACTIVATION OF NF KAPPAB IN B CELLS, this volcano plot shows how much they are up/down-regulated and significant. The significance was calculated by empirical bayesian fit
Table S50. Get Full Table This table shows a Running Enrichment Score (RES) of each gene in this pathway, that is, the enrichment score at this point in the ranked list of genes. All genes are ranked by Signal-to-Noise (S2N), a measure of similarity as default and are used to obtain ES matrix of all genes. In this way, GSEA tool uses expression pattern of not only overlapped genes but also not-overlapped genes to produce ES matrix.
| Rank | GENE | SYMBOL | DESC | LIST.LOC | S2N | RES | CORE_ENRICHMENT |
|---|---|---|---|---|---|---|---|
| 1 | ETFB | ETFB | ETFB | 682 | 0.33 | -0.012 | YES |
| 2 | NDUFA13 | NDUFA13 | NDUFA13 | 792 | 0.31 | 0.0071 | YES |
| 3 | NDUFS8 | NDUFS8 | NDUFS8 | 933 | 0.29 | 0.022 | YES |
| 4 | NDUFA11 | NDUFA11 | NDUFA11 | 1024 | 0.28 | 0.04 | YES |
| 5 | NDUFA3 | NDUFA3 | NDUFA3 | 1039 | 0.28 | 0.061 | YES |
| 6 | NDUFB7 | NDUFB7 | NDUFB7 | 1044 | 0.28 | 0.083 | YES |
| 7 | NDUFB1 | NDUFB1 | NDUFB1 | 1100 | 0.27 | 0.1 | YES |
| 8 | ATP5D | ATP5D | ATP5D | 1124 | 0.27 | 0.12 | YES |
| 9 | ATP5O | ATP5O | ATP5O | 1217 | 0.26 | 0.14 | YES |
| 10 | NDUFS6 | NDUFS6 | NDUFS6 | 1237 | 0.26 | 0.16 | YES |
| 11 | COX6B1 | COX6B1 | COX6B1 | 1340 | 0.24 | 0.17 | YES |
| 12 | UQCRB | UQCRB | UQCRB | 1443 | 0.24 | 0.18 | YES |
| 13 | NDUFV3 | NDUFV3 | NDUFV3 | 1505 | 0.23 | 0.2 | YES |
| 14 | NDUFS7 | NDUFS7 | NDUFS7 | 1535 | 0.23 | 0.22 | YES |
| 15 | NDUFAB1 | NDUFAB1 | NDUFAB1 | 1549 | 0.23 | 0.23 | YES |
| 16 | ATP5E | ATP5E | ATP5E | 1616 | 0.22 | 0.25 | YES |
| 17 | COX5B | COX5B | COX5B | 1635 | 0.22 | 0.26 | YES |
| 18 | NDUFA1 | NDUFA1 | NDUFA1 | 1670 | 0.22 | 0.28 | YES |
| 19 | COX6C | COX6C | COX6C | 1697 | 0.22 | 0.3 | YES |
| 20 | UQCRQ | UQCRQ | UQCRQ | 1707 | 0.22 | 0.31 | YES |
| 21 | NDUFA2 | NDUFA2 | NDUFA2 | 1724 | 0.21 | 0.33 | YES |
| 22 | NDUFA8 | NDUFA8 | NDUFA8 | 1773 | 0.21 | 0.34 | YES |
| 23 | ATP5J | ATP5J | ATP5J | 1809 | 0.21 | 0.36 | YES |
| 24 | UQCR11 | UQCR11 | UQCR11 | 1908 | 0.2 | 0.37 | YES |
| 25 | NDUFB10 | NDUFB10 | NDUFB10 | 1927 | 0.2 | 0.38 | YES |
| 26 | ATP5I | ATP5I | ATP5I | 1961 | 0.2 | 0.4 | YES |
| 27 | UQCRHL | UQCRHL | UQCRHL | 1964 | 0.2 | 0.41 | YES |
| 28 | NDUFC2 | NDUFC2 | NDUFC2 | 1988 | 0.2 | 0.43 | YES |
| 29 | UQCRH | UQCRH | UQCRH | 2004 | 0.2 | 0.44 | YES |
| 30 | ATP5L | ATP5L | ATP5L | 2044 | 0.19 | 0.46 | YES |
| 31 | COX4I1 | COX4I1 | COX4I1 | 2052 | 0.19 | 0.47 | YES |
| 32 | NDUFS4 | NDUFS4 | NDUFS4 | 2070 | 0.19 | 0.48 | YES |
| 33 | NDUFB9 | NDUFB9 | NDUFB9 | 2180 | 0.18 | 0.49 | YES |
| 34 | NDUFV1 | NDUFV1 | NDUFV1 | 2262 | 0.18 | 0.5 | YES |
| 35 | NDUFS3 | NDUFS3 | NDUFS3 | 2282 | 0.18 | 0.52 | YES |
| 36 | NDUFC1 | NDUFC1 | NDUFC1 | 2391 | 0.17 | 0.52 | YES |
| 37 | COX6A1 | COX6A1 | COX6A1 | 2407 | 0.17 | 0.54 | YES |
| 38 | COX7C | COX7C | COX7C | 2542 | 0.16 | 0.54 | YES |
| 39 | NDUFB2 | NDUFB2 | NDUFB2 | 2565 | 0.16 | 0.56 | YES |
| 40 | ATP5H | ATP5H | ATP5H | 2707 | 0.16 | 0.56 | YES |
| 41 | COX7B | COX7B | COX7B | 2719 | 0.16 | 0.57 | YES |
| 42 | COX8A | COX8A | COX8A | 2744 | 0.16 | 0.58 | YES |
| 43 | NDUFS5 | NDUFS5 | NDUFS5 | 2870 | 0.15 | 0.59 | YES |
| 44 | NDUFA7 | NDUFA7 | NDUFA7 | 2877 | 0.15 | 0.6 | YES |
| 45 | NDUFA9 | NDUFA9 | NDUFA9 | 2983 | 0.14 | 0.6 | YES |
| 46 | ATP5G1 | ATP5G1 | ATP5G1 | 3106 | 0.14 | 0.61 | YES |
| 47 | ATP5J2 | ATP5J2 | ATP5J2 | 3121 | 0.14 | 0.62 | YES |
| 48 | NDUFB5 | NDUFB5 | NDUFB5 | 3316 | 0.13 | 0.62 | YES |
| 49 | UQCRC1 | UQCRC1 | UQCRC1 | 3365 | 0.13 | 0.63 | YES |
| 50 | NDUFA5 | NDUFA5 | NDUFA5 | 3406 | 0.13 | 0.64 | YES |
| 51 | NDUFA4 | NDUFA4 | NDUFA4 | 3503 | 0.12 | 0.64 | YES |
| 52 | COX5A | COX5A | COX5A | 3586 | 0.12 | 0.64 | YES |
| 53 | UQCRFS1 | UQCRFS1 | UQCRFS1 | 3618 | 0.12 | 0.65 | YES |
| 54 | NDUFA6 | NDUFA6 | NDUFA6 | 3621 | 0.12 | 0.66 | YES |
| 55 | NDUFB6 | NDUFB6 | NDUFB6 | 3624 | 0.12 | 0.67 | YES |
| 56 | COX7A2L | COX7A2L | COX7A2L | 3845 | 0.11 | 0.67 | NO |
| 57 | NDUFB8 | NDUFB8 | NDUFB8 | 4089 | 0.099 | 0.66 | NO |
| 58 | ATP5F1 | ATP5F1 | ATP5F1 | 4134 | 0.097 | 0.67 | NO |
| 59 | NDUFV2 | NDUFV2 | NDUFV2 | 4209 | 0.095 | 0.67 | NO |
| 60 | NDUFB3 | NDUFB3 | NDUFB3 | 4742 | 0.076 | 0.64 | NO |
| 61 | NDUFA10 | NDUFA10 | NDUFA10 | 5207 | 0.062 | 0.62 | NO |
| 62 | NDUFA12 | NDUFA12 | NDUFA12 | 5333 | 0.058 | 0.62 | NO |
| 63 | NDUFS2 | NDUFS2 | NDUFS2 | 6211 | 0.031 | 0.57 | NO |
| 64 | ATP5C1 | ATP5C1 | ATP5C1 | 6314 | 0.028 | 0.57 | NO |
| 65 | CYCS | CYCS | CYCS | 6389 | 0.025 | 0.57 | NO |
| 66 | SDHB | SDHB | SDHB | 6491 | 0.022 | 0.56 | NO |
| 67 | CYC1 | CYC1 | CYC1 | 6495 | 0.022 | 0.57 | NO |
| 68 | SDHC | SDHC | SDHC | 6587 | 0.02 | 0.56 | NO |
| 69 | ATP5B | ATP5B | ATP5B | 6860 | 0.012 | 0.55 | NO |
| 70 | NDUFB4 | NDUFB4 | NDUFB4 | 7271 | -0.00053 | 0.52 | NO |
| 71 | UCP2 | UCP2 | UCP2 | 7409 | -0.0045 | 0.52 | NO |
| 72 | SDHA | SDHA | SDHA | 7733 | -0.015 | 0.5 | NO |
| 73 | UQCRC2 | UQCRC2 | UQCRC2 | 8306 | -0.033 | 0.47 | NO |
| 74 | ATP5A1 | ATP5A1 | ATP5A1 | 8489 | -0.037 | 0.46 | NO |
| 75 | SDHD | SDHD | SDHD | 9823 | -0.08 | 0.39 | NO |
| 76 | ETFDH | ETFDH | ETFDH | 9852 | -0.08 | 0.4 | NO |
| 77 | ETFA | ETFA | ETFA | 10095 | -0.087 | 0.39 | NO |
| 78 | NDUFS1 | NDUFS1 | NDUFS1 | 13097 | -0.19 | 0.24 | NO |
| 79 | UCP3 | UCP3 | UCP3 | 14912 | -0.29 | 0.16 | NO |
Figure S99. Get High-res Image This plot shows mRNAseq_cNMF expression data heatmap (on the left) a RunningEnrichmentScore(RES) plot (on the top right) and a Signal2Noise(S2N) plot (on the bottom right) of genes in the pathway: REACTOME ACTIVATION OF THE MRNA UPON BINDING OF THE CAP BINDING COMPLEX AND EIFS AND SUBSEQUENT BINDING TO 43S.
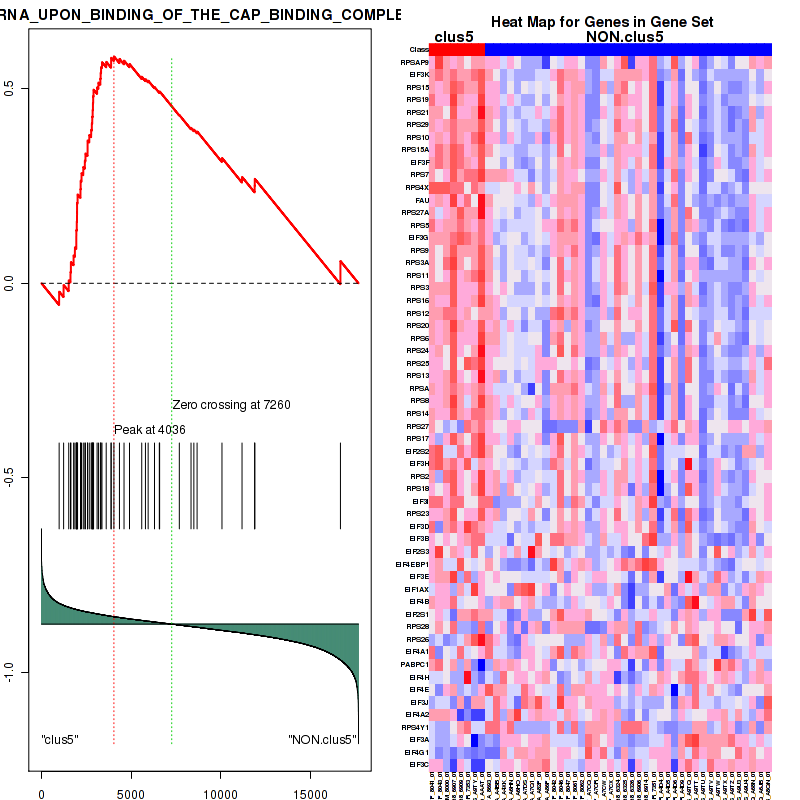
Figure S100. Get High-res Image For the top 5 core enriched genes in the pathway: REACTOME ACTIVATION OF THE MRNA UPON BINDING OF THE CAP BINDING COMPLEX AND EIFS AND SUBSEQUENT BINDING TO 43S, this volcano plot shows how much they are up/down-regulated and significant. The significance was calculated by empirical bayesian fit
For the top enriched genes, if you want to check whether they are
-
up-regulated, please check the list of up-regulated genes
-
down-regulated, please check the list of down-regulated genes
For the top enriched genes, if you want to check whether they are
-
highly expressed genes, please check the list of high (top 30%) expressed genes
-
low expressed genes, please check the list of low (bottom 30%) expressed genes
An expression pattern of top(30%)/middle(30%)/low(30%) in this subtype against other subtypes is available in a heatmap
For the top enriched genes, if you want to check whether they are
-
significantly differently expressed genes by eBayes lm fit, please check the list of significant genes
Table 8. Get Full Table This table shows top 10 pathways which are significantly enriched in cluster clus6. It displays only significant gene sets satisfying nom.p.val.threshold (-1), fwer.p.val.threshold (-1) , fdr.q.val.threshold (0.25) and the default table is sorted by Normalized Enrichment Score (NES). Further details on NES statistics, please visit The Broad GSEA website.
| GeneSet(GS) | Size(#genes) | genes.ES.table | ES | NES | NOM.p.val | FDR.q.val | FWER.p.val | Tag.. | Gene.. | Signal | FDR..median. | glob.p.val |
|---|---|---|---|---|---|---|---|---|---|---|---|---|
| KEGG LYSOSOME | 119 | genes.ES.table | 0.47 | 1.7 | 0.075 | 0.45 | 0.67 | 0.58 | 0.33 | 0.39 | 0.15 | 0.1 |
| KEGG TOLL LIKE RECEPTOR SIGNALING PATHWAY | 90 | genes.ES.table | 0.55 | 1.7 | 0.0063 | 0.54 | 0.63 | 0.58 | 0.31 | 0.4 | 0.18 | 0.12 |
| KEGG NOD LIKE RECEPTOR SIGNALING PATHWAY | 61 | genes.ES.table | 0.58 | 1.7 | 0.0082 | 0.51 | 0.64 | 0.36 | 0.17 | 0.3 | 0.17 | 0.11 |
| KEGG THYROID CANCER | 29 | genes.ES.table | 0.61 | 1.8 | 0.015 | 0.57 | 0.59 | 0.31 | 0.16 | 0.26 | 0.16 | 0.12 |
| ST TUMOR NECROSIS FACTOR PATHWAY | 28 | genes.ES.table | 0.55 | 1.9 | 0.0077 | 0.5 | 0.36 | 0.46 | 0.28 | 0.33 | 0 | 0.091 |
| ST G ALPHA I PATHWAY | 34 | genes.ES.table | 0.58 | 1.7 | 0.0022 | 0.51 | 0.67 | 0.38 | 0.21 | 0.3 | 0.17 | 0.12 |
| ST GAQ PATHWAY | 27 | genes.ES.table | 0.54 | 1.8 | 0.0061 | 0.53 | 0.44 | 0.44 | 0.24 | 0.34 | 0 | 0.098 |
| PID ERBB2ERBB3PATHWAY | 44 | genes.ES.table | 0.46 | 1.7 | 0.014 | 0.43 | 0.73 | 0.27 | 0.23 | 0.21 | 0.16 | 0.11 |
| REACTOME ANTIVIRAL MECHANISM BY IFN STIMULATED GENES | 65 | genes.ES.table | 0.46 | 1.8 | 0.032 | 0.56 | 0.5 | 0.14 | 0.087 | 0.13 | 0.13 | 0.12 |
| REACTOME TRIGLYCERIDE BIOSYNTHESIS | 38 | genes.ES.table | 0.52 | 1.7 | 0.017 | 0.49 | 0.67 | 0.24 | 0.13 | 0.21 | 0.16 | 0.11 |
Table S51. Get Full Table This table shows a Running Enrichment Score (RES) of each gene in this pathway, that is, the enrichment score at this point in the ranked list of genes. All genes are ranked by Signal-to-Noise (S2N), a measure of similarity as default and are used to obtain ES matrix of all genes. In this way, GSEA tool uses expression pattern of not only overlapped genes but also not-overlapped genes to produce ES matrix.
| Rank | GENE | SYMBOL | DESC | LIST.LOC | S2N | RES | CORE_ENRICHMENT |
|---|---|---|---|---|---|---|---|
| 1 | GBP6 | GBP6 | GBP6 | 87 | 0.79 | 0.024 | YES |
| 2 | IFNG | IFNG | IFNG | 99 | 0.78 | 0.053 | YES |
| 3 | HERC5 | HERC5 | HERC5 | 139 | 0.72 | 0.077 | YES |
| 4 | FCGR1B | FCGR1B | FCGR1B | 229 | 0.66 | 0.096 | YES |
| 5 | FCGR1A | FCGR1A | FCGR1A | 234 | 0.65 | 0.12 | YES |
| 6 | IFIT3 | IFIT3 | IFIT3 | 245 | 0.65 | 0.14 | YES |
| 7 | OASL | OASL | OASL | 266 | 0.63 | 0.17 | YES |
| 8 | OAS3 | OAS3 | OAS3 | 295 | 0.61 | 0.19 | YES |
| 9 | USP18 | USP18 | USP18 | 298 | 0.61 | 0.21 | YES |
| 10 | IFIT2 | IFIT2 | IFIT2 | 326 | 0.6 | 0.23 | YES |
| 11 | IFIT1 | IFIT1 | IFIT1 | 330 | 0.59 | 0.25 | YES |
| 12 | GBP5 | GBP5 | GBP5 | 389 | 0.57 | 0.27 | YES |
| 13 | CAMK2A | CAMK2A | CAMK2A | 485 | 0.53 | 0.28 | YES |
| 14 | GBP4 | GBP4 | GBP4 | 490 | 0.53 | 0.3 | YES |
| 15 | GBP1 | GBP1 | GBP1 | 498 | 0.53 | 0.32 | YES |
| 16 | PTAFR | PTAFR | PTAFR | 601 | 0.5 | 0.34 | YES |
| 17 | IFI6 | IFI6 | IFI6 | 685 | 0.47 | 0.35 | YES |
| 18 | EIF2AK2 | EIF2AK2 | EIF2AK2 | 711 | 0.47 | 0.36 | YES |
| 19 | XAF1 | XAF1 | XAF1 | 756 | 0.46 | 0.38 | YES |
| 20 | GBP7 | GBP7 | GBP7 | 788 | 0.45 | 0.39 | YES |
| 21 | MX1 | MX1 | MX1 | 794 | 0.45 | 0.41 | YES |
| 22 | MT2A | MT2A | MT2A | 913 | 0.43 | 0.42 | YES |
| 23 | DDX58 | DDX58 | DDX58 | 1293 | 0.36 | 0.41 | YES |
| 24 | IFI27 | IFI27 | IFI27 | 1303 | 0.36 | 0.42 | YES |
| 25 | ISG15 | ISG15 | ISG15 | 1318 | 0.36 | 0.44 | YES |
| 26 | SOCS1 | SOCS1 | SOCS1 | 1346 | 0.36 | 0.45 | YES |
| 27 | EIF4E3 | EIF4E3 | EIF4E3 | 1361 | 0.36 | 0.46 | YES |
| 28 | JAK2 | JAK2 | JAK2 | 1430 | 0.35 | 0.47 | YES |
| 29 | STAT1 | STAT1 | STAT1 | 1534 | 0.34 | 0.48 | YES |
| 30 | GBP2 | GBP2 | GBP2 | 1751 | 0.31 | 0.48 | YES |
| 31 | SOCS3 | SOCS3 | SOCS3 | 1807 | 0.31 | 0.48 | YES |
| 32 | IRF1 | IRF1 | IRF1 | 1909 | 0.3 | 0.49 | YES |
| 33 | OAS1 | OAS1 | OAS1 | 1918 | 0.3 | 0.5 | YES |
| 34 | ICAM1 | ICAM1 | ICAM1 | 2012 | 0.29 | 0.5 | YES |
| 35 | OAS2 | OAS2 | OAS2 | 2080 | 0.29 | 0.51 | YES |
| 36 | IFI35 | IFI35 | IFI35 | 2529 | 0.25 | 0.5 | YES |
| 37 | IFITM1 | IFITM1 | IFITM1 | 2681 | 0.24 | 0.5 | YES |
| 38 | IFNB1 | IFNB1 | IFNB1 | 2716 | 0.23 | 0.5 | YES |
| 39 | STAT2 | STAT2 | STAT2 | 2830 | 0.23 | 0.5 | YES |
| 40 | PML | PML | PML | 2844 | 0.23 | 0.51 | YES |
| 41 | MX2 | MX2 | MX2 | 2875 | 0.22 | 0.52 | YES |
| 42 | IRF7 | IRF7 | IRF7 | 2935 | 0.22 | 0.52 | YES |
| 43 | HLA-G | HLA-G | HLA-G | 3355 | 0.2 | 0.51 | YES |
| 44 | VCAM1 | VCAM1 | VCAM1 | 3523 | 0.18 | 0.5 | YES |
| 45 | FLNB | FLNB | FLNB | 3535 | 0.18 | 0.51 | YES |
| 46 | IRF6 | IRF6 | IRF6 | 3569 | 0.18 | 0.52 | YES |
| 47 | IFITM3 | IFITM3 | IFITM3 | 3597 | 0.18 | 0.52 | YES |
| 48 | CD44 | CD44 | CD44 | 3666 | 0.18 | 0.52 | YES |
| 49 | PIAS1 | PIAS1 | PIAS1 | 3724 | 0.17 | 0.53 | YES |
| 50 | UBE2L6 | UBE2L6 | UBE2L6 | 3799 | 0.17 | 0.53 | YES |
| 51 | HLA-F | HLA-F | HLA-F | 3900 | 0.16 | 0.53 | YES |
| 52 | HLA-DQA2 | HLA-DQA2 | HLA-DQA2 | 3934 | 0.16 | 0.53 | YES |
| 53 | PTPN1 | PTPN1 | PTPN1 | 4061 | 0.16 | 0.53 | YES |
| 54 | ADAR | ADAR | ADAR | 4087 | 0.16 | 0.54 | YES |
| 55 | IFNAR1 | IFNAR1 | IFNAR1 | 4113 | 0.16 | 0.54 | YES |
| 56 | UBA7 | UBA7 | UBA7 | 4534 | 0.14 | 0.52 | NO |
| 57 | IFNAR2 | IFNAR2 | IFNAR2 | 4664 | 0.13 | 0.52 | NO |
| 58 | HLA-C | HLA-C | HLA-C | 4728 | 0.13 | 0.52 | NO |
| 59 | IRF9 | IRF9 | IRF9 | 4770 | 0.13 | 0.52 | NO |
| 60 | HLA-A | HLA-A | HLA-A | 4938 | 0.12 | 0.52 | NO |
| 61 | NUP62 | NUP62 | NUP62 | 4944 | 0.12 | 0.52 | NO |
| 62 | TYK2 | TYK2 | TYK2 | 5037 | 0.12 | 0.52 | NO |
| 63 | TRIM25 | TRIM25 | TRIM25 | 5101 | 0.11 | 0.52 | NO |
| 64 | IRF2 | IRF2 | IRF2 | 5285 | 0.11 | 0.52 | NO |
| 65 | B2M | B2M | B2M | 5322 | 0.1 | 0.52 | NO |
| 66 | IFNGR2 | IFNGR2 | IFNGR2 | 5451 | 0.1 | 0.51 | NO |
| 67 | ISG20 | ISG20 | ISG20 | 5617 | 0.096 | 0.51 | NO |
| 68 | IRF5 | IRF5 | IRF5 | 5671 | 0.094 | 0.51 | NO |
| 69 | NUPL1 | NUPL1 | NUPL1 | 5676 | 0.094 | 0.51 | NO |
| 70 | IRF4 | IRF4 | IRF4 | 5925 | 0.086 | 0.5 | NO |
| 71 | NUP214 | NUP214 | NUP214 | 6142 | 0.08 | 0.49 | NO |
| 72 | IFNGR1 | IFNGR1 | IFNGR1 | 6170 | 0.079 | 0.49 | NO |
| 73 | RNASEL | RNASEL | RNASEL | 6273 | 0.076 | 0.49 | NO |
| 74 | RANBP2 | RANBP2 | RANBP2 | 6526 | 0.068 | 0.48 | NO |
| 75 | HLA-B | HLA-B | HLA-B | 6544 | 0.068 | 0.48 | NO |
| 76 | ARIH1 | ARIH1 | ARIH1 | 6718 | 0.064 | 0.47 | NO |
| 77 | PRKCD | PRKCD | PRKCD | 6865 | 0.059 | 0.46 | NO |
| 78 | PSMB8 | PSMB8 | PSMB8 | 7050 | 0.054 | 0.46 | NO |
| 79 | PTPN2 | PTPN2 | PTPN2 | 7127 | 0.052 | 0.45 | NO |
| 80 | NUP155 | NUP155 | NUP155 | 7153 | 0.052 | 0.46 | NO |
| 81 | KPNA3 | KPNA3 | KPNA3 | 7155 | 0.052 | 0.46 | NO |
| 82 | IFITM2 | IFITM2 | IFITM2 | 7405 | 0.046 | 0.44 | NO |
| 83 | EIF4G2 | EIF4G2 | EIF4G2 | 7428 | 0.045 | 0.44 | NO |
| 84 | NUP153 | NUP153 | NUP153 | 7564 | 0.042 | 0.44 | NO |
| 85 | PPM1B | PPM1B | PPM1B | 7639 | 0.04 | 0.44 | NO |
| 86 | PTPN6 | PTPN6 | PTPN6 | 7669 | 0.039 | 0.44 | NO |
| 87 | EIF4G1 | EIF4G1 | EIF4G1 | 7683 | 0.039 | 0.44 | NO |
| 88 | TPR | TPR | TPR | 7865 | 0.035 | 0.43 | NO |
| 89 | SP100 | SP100 | SP100 | 7940 | 0.033 | 0.42 | NO |
| 90 | HLA-DPA1 | HLA-DPA1 | HLA-DPA1 | 8174 | 0.027 | 0.41 | NO |
| 91 | EIF4E2 | EIF4E2 | EIF4E2 | 8278 | 0.025 | 0.41 | NO |
| 92 | NUP50 | NUP50 | NUP50 | 8367 | 0.024 | 0.4 | NO |
| 93 | HLA-DRB5 | HLA-DRB5 | HLA-DRB5 | 8406 | 0.023 | 0.4 | NO |
| 94 | KPNB1 | KPNB1 | KPNB1 | 8471 | 0.021 | 0.4 | NO |
| 95 | NUP188 | NUP188 | NUP188 | 8804 | 0.015 | 0.38 | NO |
| 96 | PLCG1 | PLCG1 | PLCG1 | 8908 | 0.013 | 0.38 | NO |
| 97 | NUP93 | NUP93 | NUP93 | 9595 | -0.0012 | 0.34 | NO |
| 98 | JAK1 | JAK1 | JAK1 | 9870 | -0.007 | 0.32 | NO |
| 99 | IRF8 | IRF8 | IRF8 | 9884 | -0.0073 | 0.32 | NO |
| 100 | NEDD4 | NEDD4 | NEDD4 | 9983 | -0.009 | 0.32 | NO |
| 101 | KPNA4 | KPNA4 | KPNA4 | 9991 | -0.0092 | 0.32 | NO |
| 102 | MAPK3 | MAPK3 | MAPK3 | 9998 | -0.0093 | 0.32 | NO |
| 103 | EIF4G3 | EIF4G3 | EIF4G3 | 10166 | -0.012 | 0.3 | NO |
| 104 | UBE2E1 | UBE2E1 | UBE2E1 | 10273 | -0.014 | 0.3 | NO |
| 105 | KPNA1 | KPNA1 | KPNA1 | 10282 | -0.015 | 0.3 | NO |
| 106 | HLA-DPB1 | HLA-DPB1 | HLA-DPB1 | 10547 | -0.02 | 0.29 | NO |
| 107 | EIF4A1 | EIF4A1 | EIF4A1 | 10608 | -0.021 | 0.28 | NO |
| 108 | EIF4E | EIF4E | EIF4E | 10733 | -0.024 | 0.28 | NO |
| 109 | KPNA5 | KPNA5 | KPNA5 | 10758 | -0.024 | 0.28 | NO |
| 110 | PIN1 | PIN1 | PIN1 | 11011 | -0.029 | 0.26 | NO |
| 111 | EIF4A3 | EIF4A3 | EIF4A3 | 11207 | -0.034 | 0.25 | NO |
| 112 | SUMO1 | SUMO1 | SUMO1 | 11253 | -0.034 | 0.25 | NO |
| 113 | EGR1 | EGR1 | EGR1 | 11283 | -0.035 | 0.25 | NO |
| 114 | UBE2N | UBE2N | UBE2N | 11423 | -0.038 | 0.24 | NO |
| 115 | KPNA2 | KPNA2 | KPNA2 | 11518 | -0.04 | 0.24 | NO |
| 116 | RAE1 | RAE1 | RAE1 | 11690 | -0.044 | 0.23 | NO |
| 117 | EIF4A2 | EIF4A2 | EIF4A2 | 11727 | -0.045 | 0.23 | NO |
| 118 | IRF3 | IRF3 | IRF3 | 11824 | -0.047 | 0.23 | NO |
| 119 | IFNA21 | IFNA21 | IFNA21 | 12051 | -0.052 | 0.22 | NO |
| 120 | NUP133 | NUP133 | NUP133 | 12101 | -0.053 | 0.22 | NO |
| 121 | NUP43 | NUP43 | NUP43 | 12106 | -0.053 | 0.22 | NO |
| 122 | NUP54 | NUP54 | NUP54 | 12302 | -0.057 | 0.21 | NO |
| 123 | NUP205 | NUP205 | NUP205 | 12454 | -0.06 | 0.2 | NO |
| 124 | POM121 | POM121 | POM121 | 12719 | -0.066 | 0.19 | NO |
| 125 | AAAS | AAAS | AAAS | 12728 | -0.066 | 0.19 | NO |
| 126 | NUP85 | NUP85 | NUP85 | 12771 | -0.067 | 0.19 | NO |
| 127 | UBA52 | UBA52 | UBA52 | 13253 | -0.079 | 0.17 | NO |
| 128 | NUP107 | NUP107 | NUP107 | 13364 | -0.082 | 0.16 | NO |
| 129 | HLA-DQA1 | HLA-DQA1 | HLA-DQA1 | 13474 | -0.085 | 0.16 | NO |
| 130 | NUP210 | NUP210 | NUP210 | 13511 | -0.086 | 0.16 | NO |
| 131 | IP6K2 | IP6K2 | IP6K2 | 13570 | -0.088 | 0.16 | NO |
| 132 | NUP37 | NUP37 | NUP37 | 14245 | -0.11 | 0.13 | NO |
| 133 | RPS27A | RPS27A | RPS27A | 14352 | -0.11 | 0.13 | NO |
| 134 | NUP88 | NUP88 | NUP88 | 14418 | -0.12 | 0.13 | NO |
| 135 | HLA-DRB1 | HLA-DRB1 | HLA-DRB1 | 14559 | -0.12 | 0.12 | NO |
| 136 | NUP35 | NUP35 | NUP35 | 14702 | -0.13 | 0.12 | NO |
| 137 | SEH1L | SEH1L | SEH1L | 14952 | -0.14 | 0.11 | NO |
| 138 | NCAM1 | NCAM1 | NCAM1 | 15482 | -0.17 | 0.088 | NO |
| 139 | CAMK2D | CAMK2D | CAMK2D | 15601 | -0.17 | 0.087 | NO |
| 140 | NUPL2 | NUPL2 | NUPL2 | 15757 | -0.18 | 0.085 | NO |
| 141 | CIITA | CIITA | CIITA | 16304 | -0.23 | 0.062 | NO |
| 142 | CAMK2B | CAMK2B | CAMK2B | 17306 | -0.41 | 0.02 | NO |
Figure S101. Get High-res Image This plot shows mRNAseq_cNMF expression data heatmap (on the left) a RunningEnrichmentScore(RES) plot (on the top right) and a Signal2Noise(S2N) plot (on the bottom right) of genes in the pathway: KEGG LYSOSOME.
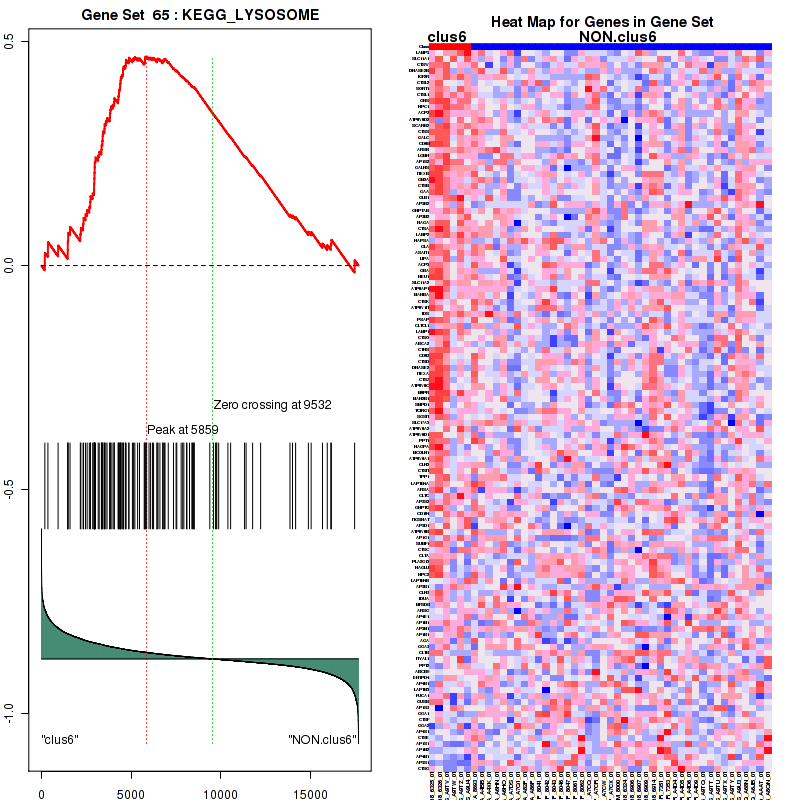
Figure S102. Get High-res Image For the top 5 core enriched genes in the pathway: KEGG LYSOSOME, this volcano plot shows how much they are up/down-regulated and significant. The significance was calculated by empirical bayesian fit

Table S52. Get Full Table This table shows a Running Enrichment Score (RES) of each gene in this pathway, that is, the enrichment score at this point in the ranked list of genes. All genes are ranked by Signal-to-Noise (S2N), a measure of similarity as default and are used to obtain ES matrix of all genes. In this way, GSEA tool uses expression pattern of not only overlapped genes but also not-overlapped genes to produce ES matrix.
| Rank | GENE | SYMBOL | DESC | LIST.LOC | S2N | RES | CORE_ENRICHMENT |
|---|---|---|---|---|---|---|---|
| 1 | HERC5 | HERC5 | HERC5 | 139 | 0.72 | 0.15 | YES |
| 2 | IFIH1 | IFIH1 | IFIH1 | 818 | 0.44 | 0.21 | YES |
| 3 | TNFAIP3 | TNFAIP3 | TNFAIP3 | 1189 | 0.38 | 0.27 | YES |
| 4 | DDX58 | DDX58 | DDX58 | 1293 | 0.36 | 0.34 | YES |
| 5 | ISG15 | ISG15 | ISG15 | 1318 | 0.36 | 0.42 | YES |
| 6 | RNF125 | RNF125 | RNF125 | 1655 | 0.32 | 0.47 | YES |
| 7 | CYLD | CYLD | CYLD | 2725 | 0.23 | 0.46 | YES |
| 8 | UBE2D1 | UBE2D1 | UBE2D1 | 3261 | 0.2 | 0.47 | YES |
| 9 | IKBKE | IKBKE | IKBKE | 3395 | 0.2 | 0.51 | YES |
| 10 | UBE2L6 | UBE2L6 | UBE2L6 | 3799 | 0.17 | 0.52 | YES |
| 11 | NLRC5 | NLRC5 | NLRC5 | 3929 | 0.16 | 0.55 | YES |
| 12 | UBA7 | UBA7 | UBA7 | 4534 | 0.14 | 0.54 | YES |
| 13 | TRAF3 | TRAF3 | TRAF3 | 4765 | 0.13 | 0.56 | YES |
| 14 | TRIM25 | TRIM25 | TRIM25 | 5101 | 0.11 | 0.56 | YES |
| 15 | TBK1 | TBK1 | TBK1 | 5853 | 0.088 | 0.54 | NO |
| 16 | UBE2K | UBE2K | UBE2K | 6910 | 0.058 | 0.49 | NO |
| 17 | MAVS | MAVS | MAVS | 8230 | 0.026 | 0.42 | NO |
| 18 | UBE2D3 | UBE2D3 | UBE2D3 | 8647 | 0.018 | 0.4 | NO |
| 19 | ATG5 | ATG5 | ATG5 | 8689 | 0.017 | 0.41 | NO |
| 20 | NLRX1 | NLRX1 | NLRX1 | 8827 | 0.014 | 0.4 | NO |
| 21 | TAX1BP1 | TAX1BP1 | TAX1BP1 | 9043 | 0.01 | 0.39 | NO |
| 22 | OTUD5 | OTUD5 | OTUD5 | 10031 | -0.0098 | 0.34 | NO |
| 23 | RNF135 | RNF135 | RNF135 | 10165 | -0.012 | 0.33 | NO |
| 24 | PIN1 | PIN1 | PIN1 | 11011 | -0.029 | 0.29 | NO |
| 25 | PCBP2 | PCBP2 | PCBP2 | 11282 | -0.035 | 0.28 | NO |
| 26 | UBE2D2 | UBE2D2 | UBE2D2 | 11788 | -0.046 | 0.26 | NO |
| 27 | IRF3 | IRF3 | IRF3 | 11824 | -0.047 | 0.27 | NO |
| 28 | ATG12 | ATG12 | ATG12 | 13020 | -0.074 | 0.22 | NO |
| 29 | UBA52 | UBA52 | UBA52 | 13253 | -0.079 | 0.23 | NO |
| 30 | RPS27A | RPS27A | RPS27A | 14352 | -0.11 | 0.19 | NO |
Figure S103. Get High-res Image This plot shows mRNAseq_cNMF expression data heatmap (on the left) a RunningEnrichmentScore(RES) plot (on the top right) and a Signal2Noise(S2N) plot (on the bottom right) of genes in the pathway: KEGG TOLL LIKE RECEPTOR SIGNALING PATHWAY.
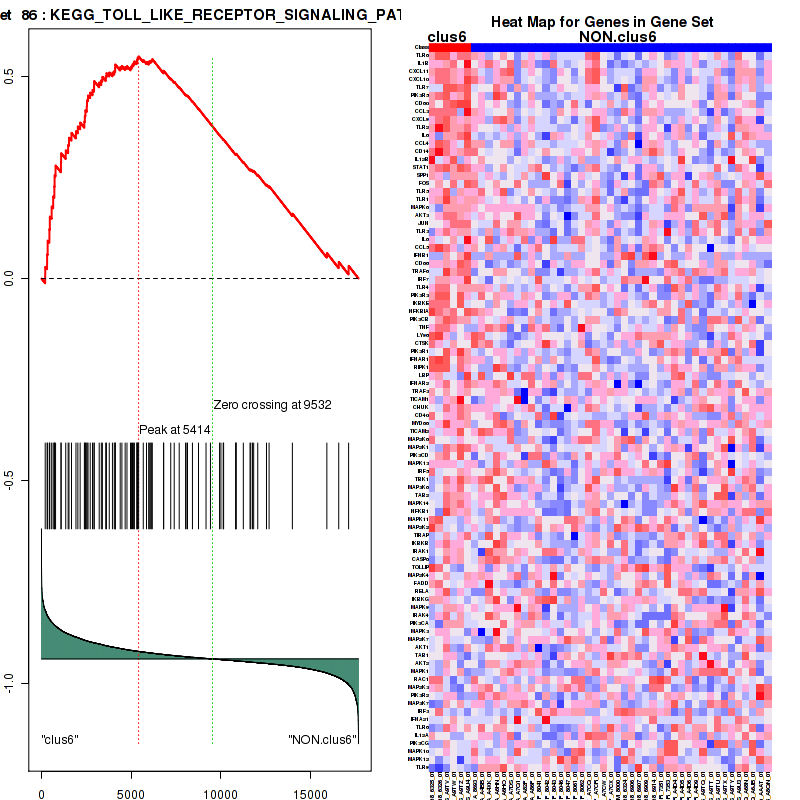
Figure S104. Get High-res Image For the top 5 core enriched genes in the pathway: KEGG TOLL LIKE RECEPTOR SIGNALING PATHWAY, this volcano plot shows how much they are up/down-regulated and significant. The significance was calculated by empirical bayesian fit

Table S53. Get Full Table This table shows a Running Enrichment Score (RES) of each gene in this pathway, that is, the enrichment score at this point in the ranked list of genes. All genes are ranked by Signal-to-Noise (S2N), a measure of similarity as default and are used to obtain ES matrix of all genes. In this way, GSEA tool uses expression pattern of not only overlapped genes but also not-overlapped genes to produce ES matrix.
| Rank | GENE | SYMBOL | DESC | LIST.LOC | S2N | RES | CORE_ENRICHMENT |
|---|---|---|---|---|---|---|---|
| 1 | HERC5 | HERC5 | HERC5 | 139 | 0.72 | 0.07 | YES |
| 2 | S100A12 | S100A12 | S100A12 | 373 | 0.57 | 0.12 | YES |
| 3 | IFIH1 | IFIH1 | IFIH1 | 818 | 0.44 | 0.14 | YES |
| 4 | DHX58 | DHX58 | DHX58 | 1065 | 0.4 | 0.17 | YES |
| 5 | TNFAIP3 | TNFAIP3 | TNFAIP3 | 1189 | 0.38 | 0.2 | YES |
| 6 | CASP10 | CASP10 | CASP10 | 1241 | 0.37 | 0.24 | YES |
| 7 | DDX58 | DDX58 | DDX58 | 1293 | 0.36 | 0.28 | YES |
| 8 | ISG15 | ISG15 | ISG15 | 1318 | 0.36 | 0.32 | YES |
| 9 | RNF125 | RNF125 | RNF125 | 1655 | 0.32 | 0.33 | YES |
| 10 | IRF1 | IRF1 | IRF1 | 1909 | 0.3 | 0.35 | YES |
| 11 | IFNB1 | IFNB1 | IFNB1 | 2716 | 0.23 | 0.33 | YES |
| 12 | CYLD | CYLD | CYLD | 2725 | 0.23 | 0.36 | YES |
| 13 | TRAF6 | TRAF6 | TRAF6 | 2931 | 0.22 | 0.37 | YES |
| 14 | IRF7 | IRF7 | IRF7 | 2935 | 0.22 | 0.39 | YES |
| 15 | UBE2D1 | UBE2D1 | UBE2D1 | 3261 | 0.2 | 0.39 | YES |
| 16 | IKBKE | IKBKE | IKBKE | 3395 | 0.2 | 0.41 | YES |
| 17 | TANK | TANK | TANK | 3409 | 0.19 | 0.43 | YES |
| 18 | NFKBIA | NFKBIA | NFKBIA | 3582 | 0.18 | 0.44 | YES |
| 19 | APP | APP | APP | 3657 | 0.18 | 0.45 | YES |
| 20 | NFKB2 | NFKB2 | NFKB2 | 3704 | 0.18 | 0.47 | YES |
| 21 | UBE2L6 | UBE2L6 | UBE2L6 | 3799 | 0.17 | 0.48 | YES |
| 22 | NLRC5 | NLRC5 | NLRC5 | 3929 | 0.16 | 0.49 | YES |
| 23 | S100B | S100B | S100B | 4092 | 0.16 | 0.5 | YES |
| 24 | RIPK1 | RIPK1 | RIPK1 | 4386 | 0.14 | 0.5 | YES |
| 25 | UBA7 | UBA7 | UBA7 | 4534 | 0.14 | 0.51 | YES |
| 26 | TRAF3 | TRAF3 | TRAF3 | 4765 | 0.13 | 0.51 | YES |
| 27 | CHUK | CHUK | CHUK | 5020 | 0.12 | 0.5 | YES |
| 28 | TRIM25 | TRIM25 | TRIM25 | 5101 | 0.11 | 0.51 | YES |
| 29 | IRF2 | IRF2 | IRF2 | 5285 | 0.11 | 0.51 | YES |
| 30 | SAA1 | SAA1 | SAA1 | 5456 | 0.1 | 0.52 | YES |
| 31 | TBK1 | TBK1 | TBK1 | 5853 | 0.088 | 0.5 | NO |
| 32 | EP300 | EP300 | EP300 | 6458 | 0.07 | 0.48 | NO |
| 33 | UBE2K | UBE2K | UBE2K | 6910 | 0.058 | 0.46 | NO |
| 34 | TRAF2 | TRAF2 | TRAF2 | 7163 | 0.052 | 0.45 | NO |
| 35 | IKBKB | IKBKB | IKBKB | 7202 | 0.05 | 0.45 | NO |
| 36 | CASP8 | CASP8 | CASP8 | 7676 | 0.039 | 0.43 | NO |
| 37 | AGER | AGER | AGER | 7721 | 0.038 | 0.43 | NO |
| 38 | FADD | FADD | FADD | 8136 | 0.028 | 0.41 | NO |
| 39 | MAVS | MAVS | MAVS | 8230 | 0.026 | 0.41 | NO |
| 40 | RELA | RELA | RELA | 8411 | 0.023 | 0.4 | NO |
| 41 | CREBBP | CREBBP | CREBBP | 8533 | 0.02 | 0.39 | NO |
| 42 | UBE2D3 | UBE2D3 | UBE2D3 | 8647 | 0.018 | 0.39 | NO |
| 43 | ATG5 | ATG5 | ATG5 | 8689 | 0.017 | 0.39 | NO |
| 44 | IKBKG | IKBKG | IKBKG | 8750 | 0.016 | 0.39 | NO |
| 45 | NLRX1 | NLRX1 | NLRX1 | 8827 | 0.014 | 0.38 | NO |
| 46 | TAX1BP1 | TAX1BP1 | TAX1BP1 | 9043 | 0.01 | 0.37 | NO |
| 47 | OTUD5 | OTUD5 | OTUD5 | 10031 | -0.0098 | 0.32 | NO |
| 48 | RNF135 | RNF135 | RNF135 | 10165 | -0.012 | 0.31 | NO |
| 49 | PIN1 | PIN1 | PIN1 | 11011 | -0.029 | 0.27 | NO |
| 50 | PCBP2 | PCBP2 | PCBP2 | 11282 | -0.035 | 0.26 | NO |
| 51 | NFKBIB | NFKBIB | NFKBIB | 11534 | -0.04 | 0.25 | NO |
| 52 | UBE2D2 | UBE2D2 | UBE2D2 | 11788 | -0.046 | 0.24 | NO |
| 53 | IRF3 | IRF3 | IRF3 | 11824 | -0.047 | 0.24 | NO |
| 54 | IFNA21 | IFNA21 | IFNA21 | 12051 | -0.052 | 0.23 | NO |
| 55 | SIKE1 | SIKE1 | SIKE1 | 12194 | -0.055 | 0.23 | NO |
| 56 | ATG12 | ATG12 | ATG12 | 13020 | -0.074 | 0.19 | NO |
| 57 | UBA52 | UBA52 | UBA52 | 13253 | -0.079 | 0.19 | NO |
| 58 | DAK | DAK | DAK | 14289 | -0.11 | 0.14 | NO |
| 59 | RPS27A | RPS27A | RPS27A | 14352 | -0.11 | 0.15 | NO |
| 60 | HMGB1 | HMGB1 | HMGB1 | 15341 | -0.16 | 0.11 | NO |
| 61 | MAP3K1 | MAP3K1 | MAP3K1 | 16026 | -0.2 | 0.093 | NO |
Figure S105. Get High-res Image This plot shows mRNAseq_cNMF expression data heatmap (on the left) a RunningEnrichmentScore(RES) plot (on the top right) and a Signal2Noise(S2N) plot (on the bottom right) of genes in the pathway: KEGG NOD LIKE RECEPTOR SIGNALING PATHWAY.
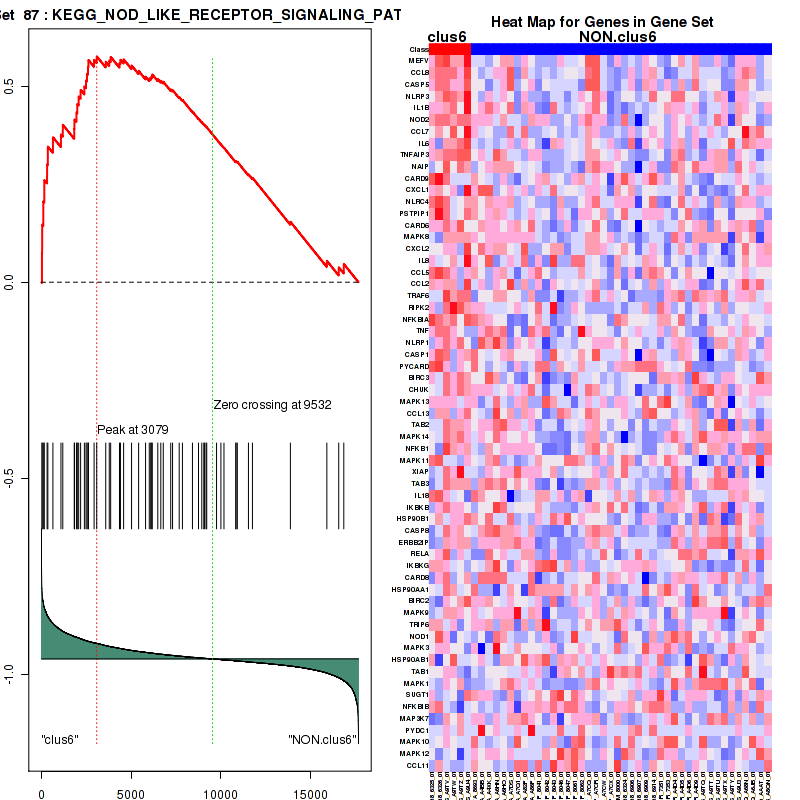
Figure S106. Get High-res Image For the top 5 core enriched genes in the pathway: KEGG NOD LIKE RECEPTOR SIGNALING PATHWAY, this volcano plot shows how much they are up/down-regulated and significant. The significance was calculated by empirical bayesian fit
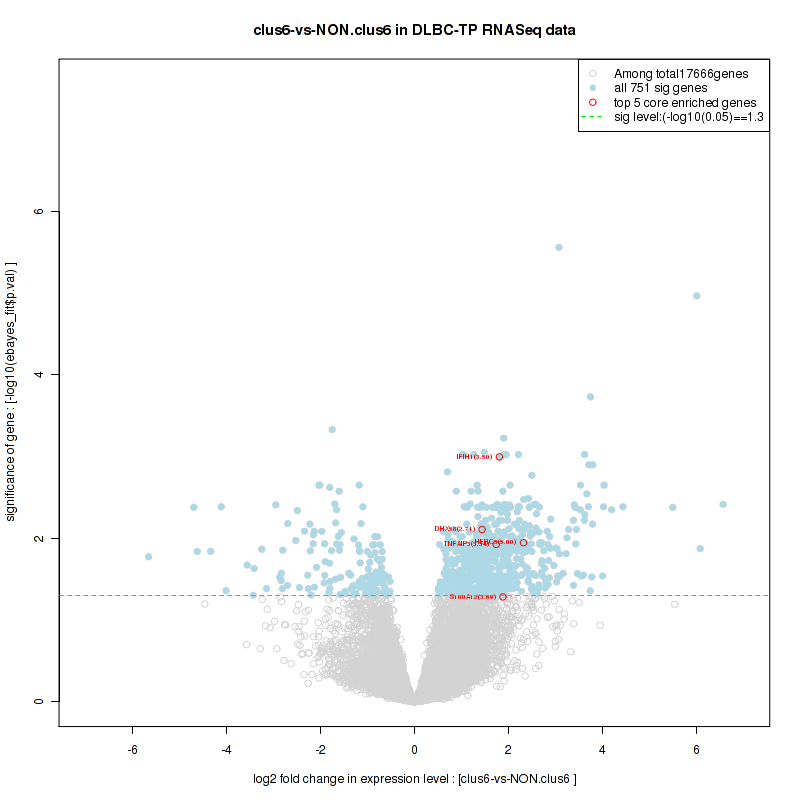
Table S54. Get Full Table This table shows a Running Enrichment Score (RES) of each gene in this pathway, that is, the enrichment score at this point in the ranked list of genes. All genes are ranked by Signal-to-Noise (S2N), a measure of similarity as default and are used to obtain ES matrix of all genes. In this way, GSEA tool uses expression pattern of not only overlapped genes but also not-overlapped genes to produce ES matrix.
| Rank | GENE | SYMBOL | DESC | LIST.LOC | S2N | RES | CORE_ENRICHMENT |
|---|---|---|---|---|---|---|---|
| 1 | GBP6 | GBP6 | GBP6 | 87 | 0.79 | 0.013 | YES |
| 2 | IL1RN | IL1RN | IL1RN | 96 | 0.78 | 0.03 | YES |
| 3 | IFNG | IFNG | IFNG | 99 | 0.78 | 0.048 | YES |
| 4 | HGF | HGF | HGF | 124 | 0.74 | 0.063 | YES |
| 5 | HERC5 | HERC5 | HERC5 | 139 | 0.72 | 0.079 | YES |
| 6 | FCGR1B | FCGR1B | FCGR1B | 229 | 0.66 | 0.089 | YES |
| 7 | FCGR1A | FCGR1A | FCGR1A | 234 | 0.65 | 0.1 | YES |
| 8 | IL1R2 | IL1R2 | IL1R2 | 241 | 0.65 | 0.12 | YES |
| 9 | IFIT3 | IFIT3 | IFIT3 | 245 | 0.65 | 0.13 | YES |
| 10 | OASL | OASL | OASL | 266 | 0.63 | 0.15 | YES |
| 11 | OAS3 | OAS3 | OAS3 | 295 | 0.61 | 0.16 | YES |
| 12 | USP18 | USP18 | USP18 | 298 | 0.61 | 0.17 | YES |
| 13 | PRLR | PRLR | PRLR | 299 | 0.61 | 0.19 | YES |
| 14 | IL1B | IL1B | IL1B | 314 | 0.6 | 0.2 | YES |
| 15 | IFIT2 | IFIT2 | IFIT2 | 326 | 0.6 | 0.21 | YES |
| 16 | IFIT1 | IFIT1 | IFIT1 | 330 | 0.59 | 0.22 | YES |
| 17 | NOD2 | NOD2 | NOD2 | 356 | 0.58 | 0.24 | YES |
| 18 | GBP5 | GBP5 | GBP5 | 389 | 0.57 | 0.25 | YES |
| 19 | CAMK2A | CAMK2A | CAMK2A | 485 | 0.53 | 0.25 | YES |
| 20 | GBP4 | GBP4 | GBP4 | 490 | 0.53 | 0.27 | YES |
| 21 | GBP1 | GBP1 | GBP1 | 498 | 0.53 | 0.28 | YES |
| 22 | IRAK3 | IRAK3 | IRAK3 | 596 | 0.5 | 0.28 | YES |
| 23 | PTAFR | PTAFR | PTAFR | 601 | 0.5 | 0.29 | YES |
| 24 | IL6R | IL6R | IL6R | 678 | 0.48 | 0.3 | YES |
| 25 | IFI6 | IFI6 | IFI6 | 685 | 0.47 | 0.31 | YES |
| 26 | EIF2AK2 | EIF2AK2 | EIF2AK2 | 711 | 0.47 | 0.32 | YES |
| 27 | XAF1 | XAF1 | XAF1 | 756 | 0.46 | 0.33 | YES |
| 28 | GBP7 | GBP7 | GBP7 | 788 | 0.45 | 0.34 | YES |
| 29 | MX1 | MX1 | MX1 | 794 | 0.45 | 0.35 | YES |
| 30 | MT2A | MT2A | MT2A | 913 | 0.43 | 0.35 | YES |
| 31 | CISH | CISH | CISH | 1016 | 0.41 | 0.35 | YES |
| 32 | IL5RA | IL5RA | IL5RA | 1047 | 0.4 | 0.36 | YES |
| 33 | IL6 | IL6 | IL6 | 1086 | 0.4 | 0.37 | YES |
| 34 | IL7R | IL7R | IL7R | 1179 | 0.38 | 0.37 | YES |
| 35 | CSF2 | CSF2 | CSF2 | 1279 | 0.36 | 0.37 | YES |
| 36 | DDX58 | DDX58 | DDX58 | 1293 | 0.36 | 0.38 | YES |
| 37 | IFI27 | IFI27 | IFI27 | 1303 | 0.36 | 0.39 | YES |
| 38 | ISG15 | ISG15 | ISG15 | 1318 | 0.36 | 0.4 | YES |
| 39 | SOCS1 | SOCS1 | SOCS1 | 1346 | 0.36 | 0.4 | YES |
| 40 | EIF4E3 | EIF4E3 | EIF4E3 | 1361 | 0.36 | 0.41 | YES |
| 41 | JAK2 | JAK2 | JAK2 | 1430 | 0.35 | 0.41 | YES |
| 42 | YES1 | YES1 | YES1 | 1496 | 0.34 | 0.42 | YES |
| 43 | IRAK2 | IRAK2 | IRAK2 | 1517 | 0.34 | 0.42 | YES |
| 44 | STAT1 | STAT1 | STAT1 | 1534 | 0.34 | 0.43 | YES |
| 45 | IL1R1 | IL1R1 | IL1R1 | 1545 | 0.34 | 0.44 | YES |
| 46 | IL3RA | IL3RA | IL3RA | 1685 | 0.32 | 0.44 | YES |
| 47 | IL6ST | IL6ST | IL6ST | 1718 | 0.32 | 0.44 | YES |
| 48 | GBP2 | GBP2 | GBP2 | 1751 | 0.31 | 0.45 | YES |
| 49 | SOCS3 | SOCS3 | SOCS3 | 1807 | 0.31 | 0.45 | YES |
| 50 | CSF2RB | CSF2RB | CSF2RB | 1848 | 0.3 | 0.46 | YES |
| 51 | IRF1 | IRF1 | IRF1 | 1909 | 0.3 | 0.46 | YES |
| 52 | OAS1 | OAS1 | OAS1 | 1918 | 0.3 | 0.47 | YES |
| 53 | ICAM1 | ICAM1 | ICAM1 | 2012 | 0.29 | 0.47 | YES |
| 54 | OAS2 | OAS2 | OAS2 | 2080 | 0.29 | 0.47 | YES |
| 55 | IL2RB | IL2RB | IL2RB | 2217 | 0.27 | 0.47 | YES |
| 56 | IFI35 | IFI35 | IFI35 | 2529 | 0.25 | 0.46 | YES |
| 57 | PELI2 | PELI2 | PELI2 | 2656 | 0.24 | 0.46 | YES |
| 58 | IFITM1 | IFITM1 | IFITM1 | 2681 | 0.24 | 0.46 | YES |
| 59 | IFNB1 | IFNB1 | IFNB1 | 2716 | 0.23 | 0.46 | YES |
| 60 | STAT2 | STAT2 | STAT2 | 2830 | 0.23 | 0.46 | YES |
| 61 | PML | PML | PML | 2844 | 0.23 | 0.46 | YES |
| 62 | MX2 | MX2 | MX2 | 2875 | 0.22 | 0.47 | YES |
| 63 | TRAF6 | TRAF6 | TRAF6 | 2931 | 0.22 | 0.47 | YES |
| 64 | IRF7 | IRF7 | IRF7 | 2935 | 0.22 | 0.48 | YES |
| 65 | IL1RAP | IL1RAP | IL1RAP | 3027 | 0.22 | 0.48 | YES |
| 66 | RIPK2 | RIPK2 | RIPK2 | 3079 | 0.21 | 0.48 | YES |
| 67 | PIK3R3 | PIK3R3 | PIK3R3 | 3335 | 0.2 | 0.47 | YES |
| 68 | TNIP2 | TNIP2 | TNIP2 | 3338 | 0.2 | 0.47 | YES |
| 69 | HLA-G | HLA-G | HLA-G | 3355 | 0.2 | 0.48 | YES |
| 70 | CSF2RA | CSF2RA | CSF2RA | 3481 | 0.19 | 0.47 | YES |
| 71 | VCAM1 | VCAM1 | VCAM1 | 3523 | 0.18 | 0.47 | YES |
| 72 | FLNB | FLNB | FLNB | 3535 | 0.18 | 0.48 | YES |
| 73 | IRF6 | IRF6 | IRF6 | 3569 | 0.18 | 0.48 | YES |
| 74 | IFITM3 | IFITM3 | IFITM3 | 3597 | 0.18 | 0.48 | YES |
| 75 | PIK3CB | PIK3CB | PIK3CB | 3622 | 0.18 | 0.48 | YES |
| 76 | HCK | HCK | HCK | 3629 | 0.18 | 0.49 | YES |
| 77 | FYN | FYN | FYN | 3630 | 0.18 | 0.49 | YES |
| 78 | CD44 | CD44 | CD44 | 3666 | 0.18 | 0.5 | YES |
| 79 | NFKB2 | NFKB2 | NFKB2 | 3704 | 0.18 | 0.5 | YES |
| 80 | PIAS1 | PIAS1 | PIAS1 | 3724 | 0.17 | 0.5 | YES |
| 81 | UBE2L6 | UBE2L6 | UBE2L6 | 3799 | 0.17 | 0.5 | YES |
| 82 | HLA-F | HLA-F | HLA-F | 3900 | 0.16 | 0.5 | YES |
| 83 | IRS2 | IRS2 | IRS2 | 3933 | 0.16 | 0.5 | YES |
| 84 | HLA-DQA2 | HLA-DQA2 | HLA-DQA2 | 3934 | 0.16 | 0.5 | YES |
| 85 | PTPN1 | PTPN1 | PTPN1 | 4061 | 0.16 | 0.5 | YES |
| 86 | ADAR | ADAR | ADAR | 4087 | 0.16 | 0.5 | YES |
| 87 | PIK3R1 | PIK3R1 | PIK3R1 | 4109 | 0.16 | 0.5 | YES |
| 88 | IFNAR1 | IFNAR1 | IFNAR1 | 4113 | 0.16 | 0.51 | YES |
| 89 | IL2RG | IL2RG | IL2RG | 4257 | 0.15 | 0.5 | NO |
| 90 | CASP1 | CASP1 | CASP1 | 4348 | 0.14 | 0.5 | NO |
| 91 | SQSTM1 | SQSTM1 | SQSTM1 | 4520 | 0.14 | 0.49 | NO |
| 92 | UBA7 | UBA7 | UBA7 | 4534 | 0.14 | 0.5 | NO |
| 93 | JAK3 | JAK3 | JAK3 | 4548 | 0.14 | 0.5 | NO |
| 94 | GAB2 | GAB2 | GAB2 | 4660 | 0.13 | 0.5 | NO |
| 95 | IFNAR2 | IFNAR2 | IFNAR2 | 4664 | 0.13 | 0.5 | NO |
| 96 | HLA-C | HLA-C | HLA-C | 4728 | 0.13 | 0.5 | NO |
| 97 | IRF9 | IRF9 | IRF9 | 4770 | 0.13 | 0.5 | NO |
| 98 | HLA-A | HLA-A | HLA-A | 4938 | 0.12 | 0.49 | NO |
| 99 | NUP62 | NUP62 | NUP62 | 4944 | 0.12 | 0.49 | NO |
| 100 | MAP3K3 | MAP3K3 | MAP3K3 | 4983 | 0.12 | 0.49 | NO |
| 101 | CHUK | CHUK | CHUK | 5020 | 0.12 | 0.49 | NO |
| 102 | TYK2 | TYK2 | TYK2 | 5037 | 0.12 | 0.5 | NO |
| 103 | STAT5A | STAT5A | STAT5A | 5060 | 0.12 | 0.5 | NO |
| 104 | TRIM25 | TRIM25 | TRIM25 | 5101 | 0.11 | 0.5 | NO |
| 105 | MYD88 | MYD88 | MYD88 | 5136 | 0.11 | 0.5 | NO |
| 106 | ADAM17 | ADAM17 | ADAM17 | 5186 | 0.11 | 0.5 | NO |
| 107 | IRF2 | IRF2 | IRF2 | 5285 | 0.11 | 0.5 | NO |
| 108 | MAP2K6 | MAP2K6 | MAP2K6 | 5308 | 0.11 | 0.5 | NO |
| 109 | B2M | B2M | B2M | 5322 | 0.1 | 0.5 | NO |
| 110 | CRK | CRK | CRK | 5323 | 0.1 | 0.5 | NO |
| 111 | MAP2K1 | MAP2K1 | MAP2K1 | 5338 | 0.1 | 0.5 | NO |
| 112 | PIK3CD | PIK3CD | PIK3CD | 5358 | 0.1 | 0.5 | NO |
| 113 | IFNGR2 | IFNGR2 | IFNGR2 | 5451 | 0.1 | 0.5 | NO |
| 114 | ISG20 | ISG20 | ISG20 | 5617 | 0.096 | 0.49 | NO |
| 115 | STAT3 | STAT3 | STAT3 | 5667 | 0.095 | 0.49 | NO |
| 116 | IRF5 | IRF5 | IRF5 | 5671 | 0.094 | 0.49 | NO |
| 117 | NUPL1 | NUPL1 | NUPL1 | 5676 | 0.094 | 0.5 | NO |
| 118 | PTK2B | PTK2B | PTK2B | 5732 | 0.093 | 0.5 | NO |
| 119 | PRL | PRL | PRL | 5802 | 0.09 | 0.49 | NO |
| 120 | IRF4 | IRF4 | IRF4 | 5925 | 0.086 | 0.49 | NO |
| 121 | MAP3K8 | MAP3K8 | MAP3K8 | 5978 | 0.085 | 0.49 | NO |
| 122 | STAT5B | STAT5B | STAT5B | 5980 | 0.085 | 0.49 | NO |
| 123 | TAB2 | TAB2 | TAB2 | 6006 | 0.084 | 0.49 | NO |
| 124 | NUP214 | NUP214 | NUP214 | 6142 | 0.08 | 0.48 | NO |
| 125 | IFNGR1 | IFNGR1 | IFNGR1 | 6170 | 0.079 | 0.48 | NO |
| 126 | IL2 | IL2 | IL2 | 6271 | 0.076 | 0.48 | NO |
| 127 | RNASEL | RNASEL | RNASEL | 6273 | 0.076 | 0.48 | NO |
| 128 | IL1A | IL1A | IL1A | 6326 | 0.074 | 0.48 | NO |
| 129 | RANBP2 | RANBP2 | RANBP2 | 6526 | 0.068 | 0.47 | NO |
| 130 | HLA-B | HLA-B | HLA-B | 6544 | 0.068 | 0.47 | NO |
| 131 | TAB3 | TAB3 | TAB3 | 6650 | 0.065 | 0.47 | NO |
| 132 | ARIH1 | ARIH1 | ARIH1 | 6718 | 0.064 | 0.46 | NO |
| 133 | CBL | CBL | CBL | 6723 | 0.064 | 0.46 | NO |
| 134 | IL18 | IL18 | IL18 | 6786 | 0.061 | 0.46 | NO |
| 135 | MAP2K2 | MAP2K2 | MAP2K2 | 6802 | 0.061 | 0.46 | NO |
| 136 | PRKCD | PRKCD | PRKCD | 6865 | 0.059 | 0.46 | NO |
| 137 | PSMB8 | PSMB8 | PSMB8 | 7050 | 0.054 | 0.45 | NO |
| 138 | VAV1 | VAV1 | VAV1 | 7059 | 0.054 | 0.45 | NO |
| 139 | PTPN2 | PTPN2 | PTPN2 | 7127 | 0.052 | 0.45 | NO |
| 140 | NRAS | NRAS | NRAS | 7137 | 0.052 | 0.45 | NO |
| 141 | NUP155 | NUP155 | NUP155 | 7153 | 0.052 | 0.45 | NO |
| 142 | KPNA3 | KPNA3 | KPNA3 | 7155 | 0.052 | 0.45 | NO |
| 143 | IKBKB | IKBKB | IKBKB | 7202 | 0.05 | 0.45 | NO |
| 144 | IRAK1 | IRAK1 | IRAK1 | 7397 | 0.046 | 0.44 | NO |
| 145 | IFITM2 | IFITM2 | IFITM2 | 7405 | 0.046 | 0.44 | NO |
| 146 | EIF4G2 | EIF4G2 | EIF4G2 | 7428 | 0.045 | 0.44 | NO |
| 147 | NUP153 | NUP153 | NUP153 | 7564 | 0.042 | 0.43 | NO |
| 148 | KRAS | KRAS | KRAS | 7618 | 0.04 | 0.43 | NO |
| 149 | PPM1B | PPM1B | PPM1B | 7639 | 0.04 | 0.43 | NO |
| 150 | PTPN6 | PTPN6 | PTPN6 | 7669 | 0.039 | 0.43 | NO |
| 151 | EIF4G1 | EIF4G1 | EIF4G1 | 7683 | 0.039 | 0.43 | NO |
| 152 | PELI3 | PELI3 | PELI3 | 7728 | 0.038 | 0.43 | NO |
| 153 | IL2RA | IL2RA | IL2RA | 7848 | 0.035 | 0.42 | NO |
| 154 | RAF1 | RAF1 | RAF1 | 7858 | 0.035 | 0.42 | NO |
| 155 | TPR | TPR | TPR | 7865 | 0.035 | 0.42 | NO |
| 156 | SP100 | SP100 | SP100 | 7940 | 0.033 | 0.42 | NO |
| 157 | TOLLIP | TOLLIP | TOLLIP | 8029 | 0.031 | 0.42 | NO |
| 158 | MAP2K4 | MAP2K4 | MAP2K4 | 8103 | 0.029 | 0.41 | NO |
| 159 | HLA-DPA1 | HLA-DPA1 | HLA-DPA1 | 8174 | 0.027 | 0.41 | NO |
| 160 | YWHAZ | YWHAZ | YWHAZ | 8194 | 0.027 | 0.41 | NO |
| 161 | EIF4E2 | EIF4E2 | EIF4E2 | 8278 | 0.025 | 0.4 | NO |
| 162 | NUP50 | NUP50 | NUP50 | 8367 | 0.024 | 0.4 | NO |
| 163 | HLA-DRB5 | HLA-DRB5 | HLA-DRB5 | 8406 | 0.023 | 0.4 | NO |
| 164 | RELA | RELA | RELA | 8411 | 0.023 | 0.4 | NO |
| 165 | SHC1 | SHC1 | SHC1 | 8438 | 0.022 | 0.4 | NO |
| 166 | KPNB1 | KPNB1 | KPNB1 | 8471 | 0.021 | 0.4 | NO |
| 167 | RAPGEF1 | RAPGEF1 | RAPGEF1 | 8524 | 0.02 | 0.39 | NO |
| 168 | IKBKG | IKBKG | IKBKG | 8750 | 0.016 | 0.38 | NO |
| 169 | NUP188 | NUP188 | NUP188 | 8804 | 0.015 | 0.38 | NO |
| 170 | CUL1 | CUL1 | CUL1 | 8885 | 0.013 | 0.37 | NO |
| 171 | LYN | LYN | LYN | 8896 | 0.013 | 0.37 | NO |
| 172 | PLCG1 | PLCG1 | PLCG1 | 8908 | 0.013 | 0.37 | NO |
| 173 | YWHAB | YWHAB | YWHAB | 9263 | 0.0052 | 0.35 | NO |
| 174 | LCK | LCK | LCK | 9267 | 0.0051 | 0.35 | NO |
| 175 | BTRC | BTRC | BTRC | 9289 | 0.0046 | 0.35 | NO |
| 176 | SKP1 | SKP1 | SKP1 | 9397 | 0.0024 | 0.35 | NO |
| 177 | IRAK4 | IRAK4 | IRAK4 | 9415 | 0.0022 | 0.34 | NO |
| 178 | GHR | GHR | GHR | 9563 | -0.00059 | 0.34 | NO |
| 179 | NUP93 | NUP93 | NUP93 | 9595 | -0.0012 | 0.34 | NO |
| 180 | GRB2 | GRB2 | GRB2 | 9626 | -0.002 | 0.33 | NO |
| 181 | SOS1 | SOS1 | SOS1 | 9673 | -0.0027 | 0.33 | NO |
| 182 | NOD1 | NOD1 | NOD1 | 9756 | -0.0046 | 0.33 | NO |
| 183 | JAK1 | JAK1 | JAK1 | 9870 | -0.007 | 0.32 | NO |
| 184 | IRF8 | IRF8 | IRF8 | 9884 | -0.0073 | 0.32 | NO |
| 185 | PIK3CA | PIK3CA | PIK3CA | 9924 | -0.008 | 0.32 | NO |
| 186 | INPPL1 | INPPL1 | INPPL1 | 9978 | -0.0089 | 0.31 | NO |
| 187 | NEDD4 | NEDD4 | NEDD4 | 9983 | -0.009 | 0.31 | NO |
| 188 | KPNA4 | KPNA4 | KPNA4 | 9991 | -0.0092 | 0.31 | NO |
| 189 | MAPK3 | MAPK3 | MAPK3 | 9998 | -0.0093 | 0.31 | NO |
| 190 | CRKL | CRKL | CRKL | 10062 | -0.01 | 0.31 | NO |
| 191 | EIF4G3 | EIF4G3 | EIF4G3 | 10166 | -0.012 | 0.3 | NO |
| 192 | UBE2E1 | UBE2E1 | UBE2E1 | 10273 | -0.014 | 0.3 | NO |
| 193 | KPNA1 | KPNA1 | KPNA1 | 10282 | -0.015 | 0.3 | NO |
| 194 | HLA-DPB1 | HLA-DPB1 | HLA-DPB1 | 10547 | -0.02 | 0.28 | NO |
| 195 | EIF4A1 | EIF4A1 | EIF4A1 | 10608 | -0.021 | 0.28 | NO |
| 196 | EIF4E | EIF4E | EIF4E | 10733 | -0.024 | 0.28 | NO |
| 197 | KPNA5 | KPNA5 | KPNA5 | 10758 | -0.024 | 0.27 | NO |
| 198 | RBX1 | RBX1 | RBX1 | 10765 | -0.024 | 0.27 | NO |
| 199 | TAB1 | TAB1 | TAB1 | 10826 | -0.026 | 0.27 | NO |
| 200 | MAPK1 | MAPK1 | MAPK1 | 10844 | -0.026 | 0.27 | NO |
| 201 | PIN1 | PIN1 | PIN1 | 11011 | -0.029 | 0.26 | NO |
| 202 | EIF4A3 | EIF4A3 | EIF4A3 | 11207 | -0.034 | 0.25 | NO |
| 203 | SUMO1 | SUMO1 | SUMO1 | 11253 | -0.034 | 0.25 | NO |
| 204 | EGR1 | EGR1 | EGR1 | 11283 | -0.035 | 0.25 | NO |
| 205 | TEC | TEC | TEC | 11323 | -0.036 | 0.25 | NO |
| 206 | UBE2N | UBE2N | UBE2N | 11423 | -0.038 | 0.24 | NO |
| 207 | KPNA2 | KPNA2 | KPNA2 | 11518 | -0.04 | 0.24 | NO |
| 208 | PIK3R2 | PIK3R2 | PIK3R2 | 11662 | -0.043 | 0.23 | NO |
| 209 | RAE1 | RAE1 | RAE1 | 11690 | -0.044 | 0.23 | NO |
| 210 | EIF4A2 | EIF4A2 | EIF4A2 | 11727 | -0.045 | 0.23 | NO |
| 211 | MAP3K7 | MAP3K7 | MAP3K7 | 11756 | -0.045 | 0.23 | NO |
| 212 | IRF3 | IRF3 | IRF3 | 11824 | -0.047 | 0.23 | NO |
| 213 | IFNA21 | IFNA21 | IFNA21 | 12051 | -0.052 | 0.21 | NO |
| 214 | NUP133 | NUP133 | NUP133 | 12101 | -0.053 | 0.21 | NO |
| 215 | NUP43 | NUP43 | NUP43 | 12106 | -0.053 | 0.21 | NO |
| 216 | NUP54 | NUP54 | NUP54 | 12302 | -0.057 | 0.2 | NO |
| 217 | NUP205 | NUP205 | NUP205 | 12454 | -0.06 | 0.2 | NO |
| 218 | POM121 | POM121 | POM121 | 12719 | -0.066 | 0.18 | NO |
| 219 | AAAS | AAAS | AAAS | 12728 | -0.066 | 0.18 | NO |
| 220 | NUP85 | NUP85 | NUP85 | 12771 | -0.067 | 0.18 | NO |
| 221 | HRAS | HRAS | HRAS | 12995 | -0.073 | 0.17 | NO |
| 222 | SOCS2 | SOCS2 | SOCS2 | 13053 | -0.075 | 0.17 | NO |
| 223 | UBA52 | UBA52 | UBA52 | 13253 | -0.079 | 0.16 | NO |
| 224 | NUP107 | NUP107 | NUP107 | 13364 | -0.082 | 0.16 | NO |
| 225 | PELI1 | PELI1 | PELI1 | 13393 | -0.083 | 0.16 | NO |
| 226 | SH2B1 | SH2B1 | SH2B1 | 13464 | -0.085 | 0.15 | NO |
| 227 | HLA-DQA1 | HLA-DQA1 | HLA-DQA1 | 13474 | -0.085 | 0.16 | NO |
| 228 | NUP210 | NUP210 | NUP210 | 13511 | -0.086 | 0.16 | NO |
| 229 | IP6K2 | IP6K2 | IP6K2 | 13570 | -0.088 | 0.15 | NO |
| 230 | NUP37 | NUP37 | NUP37 | 14245 | -0.11 | 0.12 | NO |
| 231 | RPS27A | RPS27A | RPS27A | 14352 | -0.11 | 0.12 | NO |
| 232 | NUP88 | NUP88 | NUP88 | 14418 | -0.12 | 0.11 | NO |
| 233 | PRKACB | PRKACB | PRKACB | 14467 | -0.12 | 0.11 | NO |
| 234 | HLA-DRB1 | HLA-DRB1 | HLA-DRB1 | 14559 | -0.12 | 0.11 | NO |
| 235 | NUP35 | NUP35 | NUP35 | 14702 | -0.13 | 0.11 | NO |
| 236 | SEH1L | SEH1L | SEH1L | 14952 | -0.14 | 0.095 | NO |
| 237 | CDK1 | CDK1 | CDK1 | 15276 | -0.16 | 0.08 | NO |
| 238 | SYK | SYK | SYK | 15458 | -0.16 | 0.073 | NO |
| 239 | NCAM1 | NCAM1 | NCAM1 | 15482 | -0.17 | 0.075 | NO |
| 240 | CAMK2D | CAMK2D | CAMK2D | 15601 | -0.17 | 0.072 | NO |
| 241 | NUPL2 | NUPL2 | NUPL2 | 15757 | -0.18 | 0.068 | NO |
| 242 | IL7 | IL7 | IL7 | 16279 | -0.23 | 0.043 | NO |
| 243 | CIITA | CIITA | CIITA | 16304 | -0.23 | 0.047 | NO |
| 244 | BLNK | BLNK | BLNK | 16385 | -0.24 | 0.048 | NO |
| 245 | IRS1 | IRS1 | IRS1 | 16754 | -0.28 | 0.033 | NO |
| 246 | CAMK2B | CAMK2B | CAMK2B | 17306 | -0.41 | 0.011 | NO |
| 247 | GH1 | GH1 | GH1 | 17369 | -0.44 | 0.017 | NO |
Figure S107. Get High-res Image This plot shows mRNAseq_cNMF expression data heatmap (on the left) a RunningEnrichmentScore(RES) plot (on the top right) and a Signal2Noise(S2N) plot (on the bottom right) of genes in the pathway: KEGG THYROID CANCER.
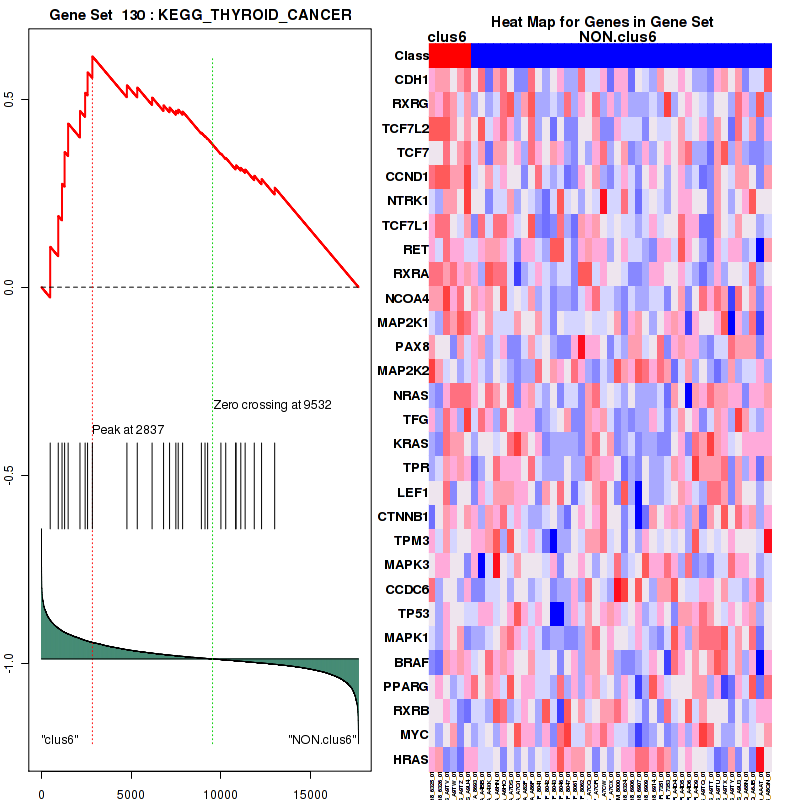
Figure S108. Get High-res Image For the top 5 core enriched genes in the pathway: KEGG THYROID CANCER, this volcano plot shows how much they are up/down-regulated and significant. The significance was calculated by empirical bayesian fit
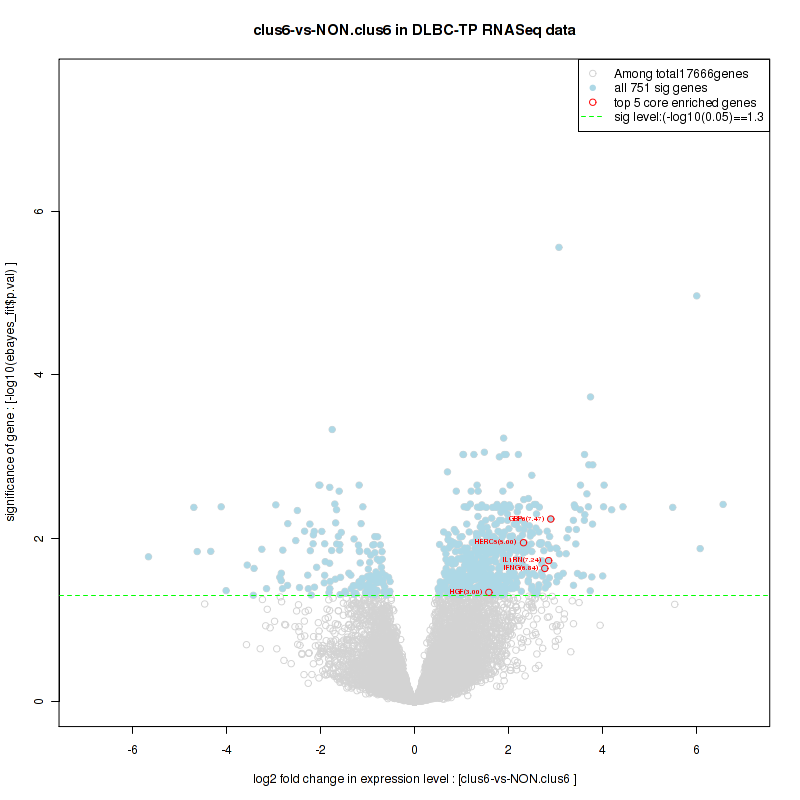
Table S55. Get Full Table This table shows a Running Enrichment Score (RES) of each gene in this pathway, that is, the enrichment score at this point in the ranked list of genes. All genes are ranked by Signal-to-Noise (S2N), a measure of similarity as default and are used to obtain ES matrix of all genes. In this way, GSEA tool uses expression pattern of not only overlapped genes but also not-overlapped genes to produce ES matrix.
| Rank | GENE | SYMBOL | DESC | LIST.LOC | S2N | RES | CORE_ENRICHMENT |
|---|---|---|---|---|---|---|---|
| 1 | TNFAIP3 | TNFAIP3 | TNFAIP3 | 1189 | 0.38 | 0.059 | YES |
| 2 | JUN | JUN | JUN | 2449 | 0.25 | 0.072 | YES |
| 3 | BAG4 | BAG4 | BAG4 | 2862 | 0.22 | 0.12 | YES |
| 4 | TNFRSF1B | TNFRSF1B | TNFRSF1B | 3310 | 0.2 | 0.16 | YES |
| 5 | CFLAR | CFLAR | CFLAR | 3342 | 0.2 | 0.23 | YES |
| 6 | NFKBIA | NFKBIA | NFKBIA | 3582 | 0.18 | 0.28 | YES |
| 7 | TNFRSF1A | TNFRSF1A | TNFRSF1A | 3672 | 0.18 | 0.33 | YES |
| 8 | NFKB2 | NFKB2 | NFKB2 | 3704 | 0.18 | 0.39 | YES |
| 9 | TNF | TNF | TNF | 3779 | 0.17 | 0.44 | YES |
| 10 | RIPK1 | RIPK1 | RIPK1 | 4386 | 0.14 | 0.46 | YES |
| 11 | BIRC3 | BIRC3 | BIRC3 | 4577 | 0.13 | 0.49 | YES |
| 12 | TRADD | TRADD | TRADD | 4863 | 0.12 | 0.51 | YES |
| 13 | MAP3K3 | MAP3K3 | MAP3K3 | 4983 | 0.12 | 0.55 | YES |
| 14 | NFKB1 | NFKB1 | NFKB1 | 6140 | 0.08 | 0.51 | NO |
| 15 | NR2C2 | NR2C2 | NR2C2 | 6334 | 0.074 | 0.52 | NO |
| 16 | TRAF2 | TRAF2 | TRAF2 | 7163 | 0.052 | 0.49 | NO |
| 17 | AGFG1 | AGFG1 | AGFG1 | 7223 | 0.05 | 0.5 | NO |
| 18 | CASP8 | CASP8 | CASP8 | 7676 | 0.039 | 0.49 | NO |
| 19 | MAP2K4 | MAP2K4 | MAP2K4 | 8103 | 0.029 | 0.48 | NO |
| 20 | FADD | FADD | FADD | 8136 | 0.028 | 0.49 | NO |
| 21 | CASP3 | CASP3 | CASP3 | 8167 | 0.028 | 0.49 | NO |
| 22 | IKBKG | IKBKG | IKBKG | 8750 | 0.016 | 0.46 | NO |
| 23 | BIRC2 | BIRC2 | BIRC2 | 9086 | 0.0092 | 0.45 | NO |
| 24 | NFKBIE | NFKBIE | NFKBIE | 9566 | -0.00082 | 0.42 | NO |
| 25 | NFKBIL1 | NFKBIL1 | NFKBIL1 | 10052 | -0.01 | 0.4 | NO |
| 26 | RALBP1 | RALBP1 | RALBP1 | 10197 | -0.013 | 0.4 | NO |
| 27 | NFKBIB | NFKBIB | NFKBIB | 11534 | -0.04 | 0.33 | NO |
| 28 | MAP3K7 | MAP3K7 | MAP3K7 | 11756 | -0.045 | 0.34 | NO |
Figure S109. Get High-res Image This plot shows mRNAseq_cNMF expression data heatmap (on the left) a RunningEnrichmentScore(RES) plot (on the top right) and a Signal2Noise(S2N) plot (on the bottom right) of genes in the pathway: ST TUMOR NECROSIS FACTOR PATHWAY.
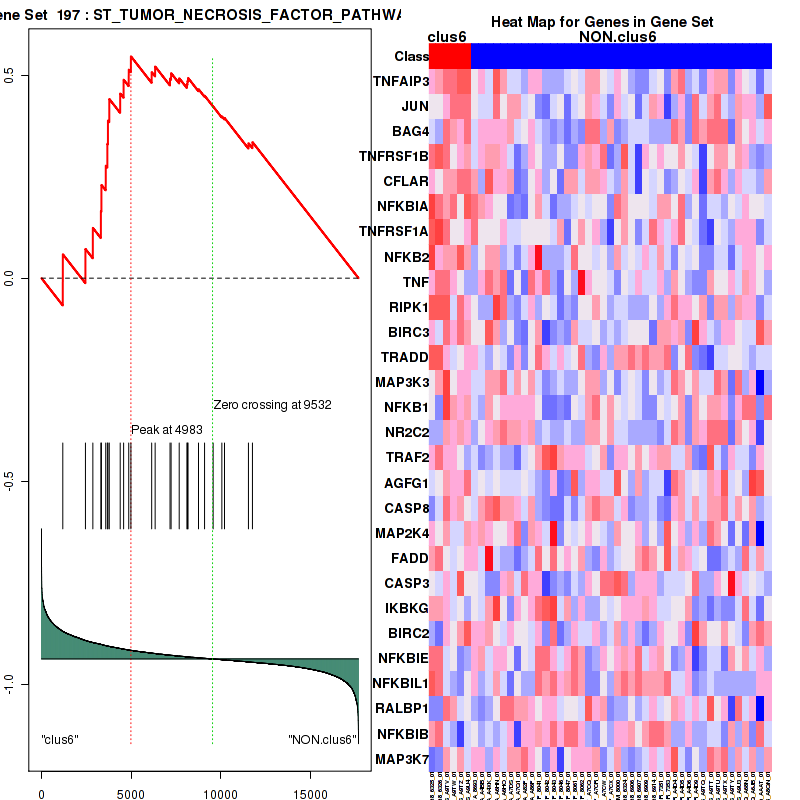
Figure S110. Get High-res Image For the top 5 core enriched genes in the pathway: ST TUMOR NECROSIS FACTOR PATHWAY, this volcano plot shows how much they are up/down-regulated and significant. The significance was calculated by empirical bayesian fit
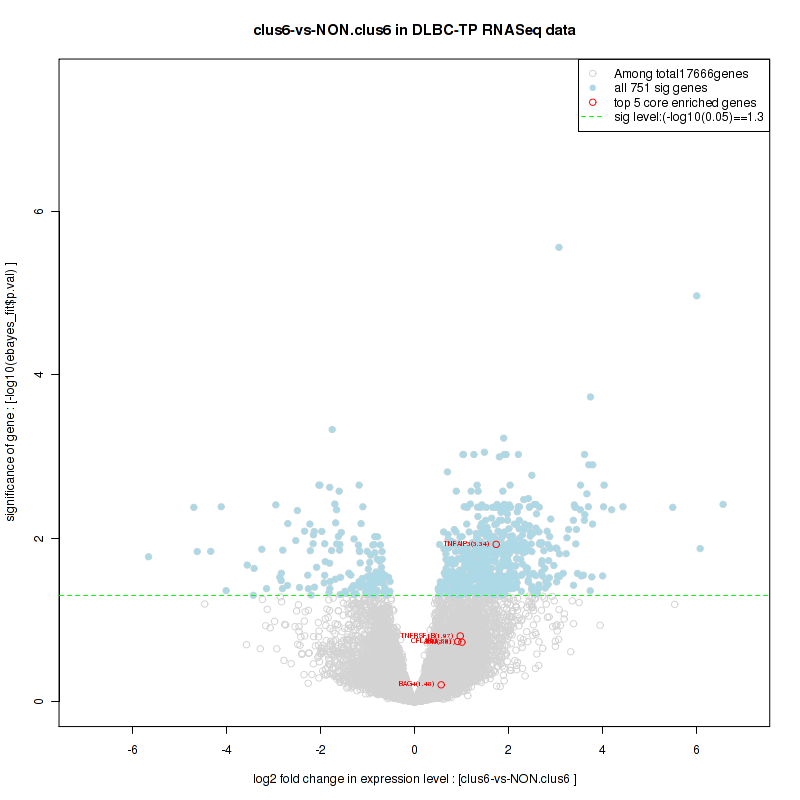
Table S56. Get Full Table This table shows a Running Enrichment Score (RES) of each gene in this pathway, that is, the enrichment score at this point in the ranked list of genes. All genes are ranked by Signal-to-Noise (S2N), a measure of similarity as default and are used to obtain ES matrix of all genes. In this way, GSEA tool uses expression pattern of not only overlapped genes but also not-overlapped genes to produce ES matrix.
| Rank | GENE | SYMBOL | DESC | LIST.LOC | S2N | RES | CORE_ENRICHMENT |
|---|---|---|---|---|---|---|---|
| 1 | CFB | CFB | CFB | 1058 | 0.4 | 0.044 | YES |
| 2 | PITX2 | PITX2 | PITX2 | 1425 | 0.35 | 0.11 | YES |
| 3 | ITPKA | ITPKA | ITPKA | 1689 | 0.32 | 0.18 | YES |
| 4 | PLD1 | PLD1 | PLD1 | 1818 | 0.31 | 0.25 | YES |
| 5 | AKT3 | AKT3 | AKT3 | 2416 | 0.26 | 0.29 | YES |
| 6 | GNAQ | GNAQ | GNAQ | 2510 | 0.25 | 0.34 | YES |
| 7 | ITPR1 | ITPR1 | ITPR1 | 2998 | 0.22 | 0.37 | YES |
| 8 | PLD3 | PLD3 | PLD3 | 3241 | 0.2 | 0.41 | YES |
| 9 | NFKBIA | NFKBIA | NFKBIA | 3582 | 0.18 | 0.44 | YES |
| 10 | PIK3CB | PIK3CB | PIK3CB | 3622 | 0.18 | 0.48 | YES |
| 11 | NFKB2 | NFKB2 | NFKB2 | 3704 | 0.18 | 0.53 | YES |
| 12 | PLD2 | PLD2 | PLD2 | 4166 | 0.15 | 0.54 | YES |
| 13 | ITPKB | ITPKB | ITPKB | 5738 | 0.093 | 0.48 | NO |
| 14 | NFKB1 | NFKB1 | NFKB1 | 6140 | 0.08 | 0.47 | NO |
| 15 | DAG1 | DAG1 | DAG1 | 7374 | 0.046 | 0.42 | NO |
| 16 | IKBKG | IKBKG | IKBKG | 8750 | 0.016 | 0.34 | NO |
| 17 | ITPR2 | ITPR2 | ITPR2 | 8934 | 0.012 | 0.33 | NO |
| 18 | NFKBIE | NFKBIE | NFKBIE | 9566 | -0.00082 | 0.3 | NO |
| 19 | NFKBIL1 | NFKBIL1 | NFKBIL1 | 10052 | -0.01 | 0.27 | NO |
| 20 | AKT1 | AKT1 | AKT1 | 10149 | -0.012 | 0.27 | NO |
| 21 | ADRBK1 | ADRBK1 | ADRBK1 | 10349 | -0.016 | 0.26 | NO |
| 22 | AKT2 | AKT2 | AKT2 | 10834 | -0.026 | 0.24 | NO |
| 23 | NFKBIB | NFKBIB | NFKBIB | 11534 | -0.04 | 0.21 | NO |
| 24 | PHKA2 | PHKA2 | PHKA2 | 11722 | -0.045 | 0.22 | NO |
| 25 | ITPR3 | ITPR3 | ITPR3 | 11810 | -0.047 | 0.22 | NO |
| 26 | PDK1 | PDK1 | PDK1 | 14652 | -0.12 | 0.093 | NO |
| 27 | VN1R1 | VN1R1 | VN1R1 | 16846 | -0.3 | 0.046 | NO |
Figure S111. Get High-res Image This plot shows mRNAseq_cNMF expression data heatmap (on the left) a RunningEnrichmentScore(RES) plot (on the top right) and a Signal2Noise(S2N) plot (on the bottom right) of genes in the pathway: ST G ALPHA I PATHWAY.
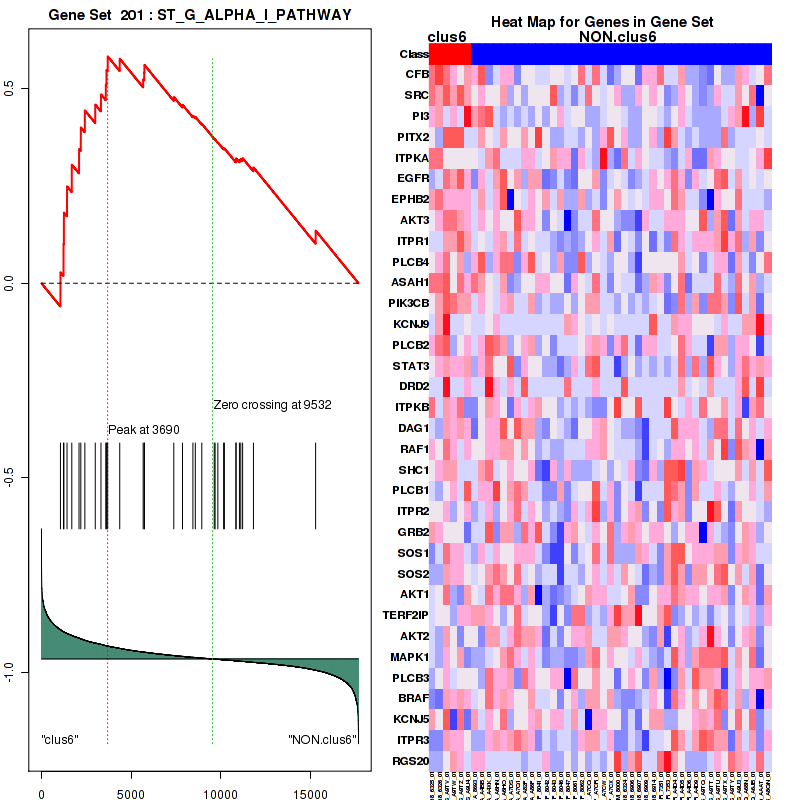
Figure S112. Get High-res Image For the top 5 core enriched genes in the pathway: ST G ALPHA I PATHWAY, this volcano plot shows how much they are up/down-regulated and significant. The significance was calculated by empirical bayesian fit

Table S57. Get Full Table This table shows a Running Enrichment Score (RES) of each gene in this pathway, that is, the enrichment score at this point in the ranked list of genes. All genes are ranked by Signal-to-Noise (S2N), a measure of similarity as default and are used to obtain ES matrix of all genes. In this way, GSEA tool uses expression pattern of not only overlapped genes but also not-overlapped genes to produce ES matrix.
| Rank | GENE | SYMBOL | DESC | LIST.LOC | S2N | RES | CORE_ENRICHMENT |
|---|---|---|---|---|---|---|---|
| 1 | HERC5 | HERC5 | HERC5 | 139 | 0.72 | 0.084 | YES |
| 2 | USP18 | USP18 | USP18 | 298 | 0.61 | 0.15 | YES |
| 3 | IFIT1 | IFIT1 | IFIT1 | 330 | 0.59 | 0.23 | YES |
| 4 | EIF2AK2 | EIF2AK2 | EIF2AK2 | 711 | 0.47 | 0.27 | YES |
| 5 | MX1 | MX1 | MX1 | 794 | 0.45 | 0.32 | YES |
| 6 | DDX58 | DDX58 | DDX58 | 1293 | 0.36 | 0.34 | YES |
| 7 | ISG15 | ISG15 | ISG15 | 1318 | 0.36 | 0.38 | YES |
| 8 | EIF4E3 | EIF4E3 | EIF4E3 | 1361 | 0.36 | 0.43 | YES |
| 9 | STAT1 | STAT1 | STAT1 | 1534 | 0.34 | 0.46 | YES |
| 10 | MX2 | MX2 | MX2 | 2875 | 0.22 | 0.41 | NO |
| 11 | FLNB | FLNB | FLNB | 3535 | 0.18 | 0.4 | NO |
| 12 | UBE2L6 | UBE2L6 | UBE2L6 | 3799 | 0.17 | 0.41 | NO |
| 13 | UBA7 | UBA7 | UBA7 | 4534 | 0.14 | 0.38 | NO |
| 14 | NUP62 | NUP62 | NUP62 | 4944 | 0.12 | 0.37 | NO |
| 15 | TRIM25 | TRIM25 | TRIM25 | 5101 | 0.11 | 0.38 | NO |
| 16 | NUPL1 | NUPL1 | NUPL1 | 5676 | 0.094 | 0.36 | NO |
| 17 | NUP214 | NUP214 | NUP214 | 6142 | 0.08 | 0.34 | NO |
| 18 | RANBP2 | RANBP2 | RANBP2 | 6526 | 0.068 | 0.33 | NO |
| 19 | ARIH1 | ARIH1 | ARIH1 | 6718 | 0.064 | 0.33 | NO |
| 20 | NUP155 | NUP155 | NUP155 | 7153 | 0.052 | 0.31 | NO |
| 21 | KPNA3 | KPNA3 | KPNA3 | 7155 | 0.052 | 0.32 | NO |
| 22 | EIF4G2 | EIF4G2 | EIF4G2 | 7428 | 0.045 | 0.31 | NO |
| 23 | NUP153 | NUP153 | NUP153 | 7564 | 0.042 | 0.3 | NO |
| 24 | PPM1B | PPM1B | PPM1B | 7639 | 0.04 | 0.3 | NO |
| 25 | EIF4G1 | EIF4G1 | EIF4G1 | 7683 | 0.039 | 0.31 | NO |
| 26 | TPR | TPR | TPR | 7865 | 0.035 | 0.3 | NO |
| 27 | EIF4E2 | EIF4E2 | EIF4E2 | 8278 | 0.025 | 0.28 | NO |
| 28 | NUP50 | NUP50 | NUP50 | 8367 | 0.024 | 0.28 | NO |
| 29 | KPNB1 | KPNB1 | KPNB1 | 8471 | 0.021 | 0.28 | NO |
| 30 | NUP188 | NUP188 | NUP188 | 8804 | 0.015 | 0.26 | NO |
| 31 | PLCG1 | PLCG1 | PLCG1 | 8908 | 0.013 | 0.26 | NO |
| 32 | NUP93 | NUP93 | NUP93 | 9595 | -0.0012 | 0.22 | NO |
| 33 | JAK1 | JAK1 | JAK1 | 9870 | -0.007 | 0.2 | NO |
| 34 | NEDD4 | NEDD4 | NEDD4 | 9983 | -0.009 | 0.2 | NO |
| 35 | KPNA4 | KPNA4 | KPNA4 | 9991 | -0.0092 | 0.2 | NO |
| 36 | MAPK3 | MAPK3 | MAPK3 | 9998 | -0.0093 | 0.2 | NO |
| 37 | EIF4G3 | EIF4G3 | EIF4G3 | 10166 | -0.012 | 0.19 | NO |
| 38 | UBE2E1 | UBE2E1 | UBE2E1 | 10273 | -0.014 | 0.18 | NO |
| 39 | KPNA1 | KPNA1 | KPNA1 | 10282 | -0.015 | 0.19 | NO |
| 40 | EIF4A1 | EIF4A1 | EIF4A1 | 10608 | -0.021 | 0.17 | NO |
| 41 | EIF4E | EIF4E | EIF4E | 10733 | -0.024 | 0.17 | NO |
| 42 | KPNA5 | KPNA5 | KPNA5 | 10758 | -0.024 | 0.17 | NO |
| 43 | PIN1 | PIN1 | PIN1 | 11011 | -0.029 | 0.16 | NO |
| 44 | EIF4A3 | EIF4A3 | EIF4A3 | 11207 | -0.034 | 0.15 | NO |
| 45 | UBE2N | UBE2N | UBE2N | 11423 | -0.038 | 0.14 | NO |
| 46 | KPNA2 | KPNA2 | KPNA2 | 11518 | -0.04 | 0.14 | NO |
| 47 | RAE1 | RAE1 | RAE1 | 11690 | -0.044 | 0.14 | NO |
| 48 | EIF4A2 | EIF4A2 | EIF4A2 | 11727 | -0.045 | 0.14 | NO |
| 49 | IRF3 | IRF3 | IRF3 | 11824 | -0.047 | 0.14 | NO |
| 50 | NUP133 | NUP133 | NUP133 | 12101 | -0.053 | 0.14 | NO |
| 51 | NUP43 | NUP43 | NUP43 | 12106 | -0.053 | 0.14 | NO |
| 52 | NUP54 | NUP54 | NUP54 | 12302 | -0.057 | 0.14 | NO |
| 53 | NUP205 | NUP205 | NUP205 | 12454 | -0.06 | 0.14 | NO |
| 54 | POM121 | POM121 | POM121 | 12719 | -0.066 | 0.13 | NO |
| 55 | AAAS | AAAS | AAAS | 12728 | -0.066 | 0.14 | NO |
| 56 | NUP85 | NUP85 | NUP85 | 12771 | -0.067 | 0.14 | NO |
| 57 | UBA52 | UBA52 | UBA52 | 13253 | -0.079 | 0.13 | NO |
| 58 | NUP107 | NUP107 | NUP107 | 13364 | -0.082 | 0.13 | NO |
| 59 | NUP210 | NUP210 | NUP210 | 13511 | -0.086 | 0.14 | NO |
| 60 | NUP37 | NUP37 | NUP37 | 14245 | -0.11 | 0.11 | NO |
| 61 | RPS27A | RPS27A | RPS27A | 14352 | -0.11 | 0.12 | NO |
| 62 | NUP88 | NUP88 | NUP88 | 14418 | -0.12 | 0.13 | NO |
| 63 | NUP35 | NUP35 | NUP35 | 14702 | -0.13 | 0.13 | NO |
| 64 | SEH1L | SEH1L | SEH1L | 14952 | -0.14 | 0.13 | NO |
| 65 | NUPL2 | NUPL2 | NUPL2 | 15757 | -0.18 | 0.11 | NO |
Figure S113. Get High-res Image This plot shows mRNAseq_cNMF expression data heatmap (on the left) a RunningEnrichmentScore(RES) plot (on the top right) and a Signal2Noise(S2N) plot (on the bottom right) of genes in the pathway: ST GAQ PATHWAY.
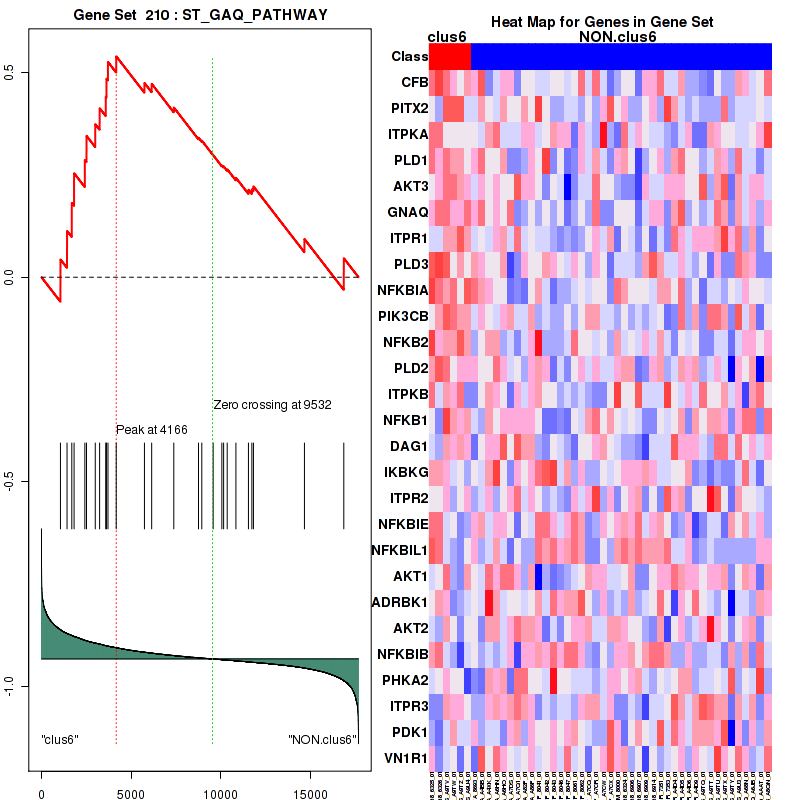
Figure S114. Get High-res Image For the top 5 core enriched genes in the pathway: ST GAQ PATHWAY, this volcano plot shows how much they are up/down-regulated and significant. The significance was calculated by empirical bayesian fit

Table S58. Get Full Table This table shows a Running Enrichment Score (RES) of each gene in this pathway, that is, the enrichment score at this point in the ranked list of genes. All genes are ranked by Signal-to-Noise (S2N), a measure of similarity as default and are used to obtain ES matrix of all genes. In this way, GSEA tool uses expression pattern of not only overlapped genes but also not-overlapped genes to produce ES matrix.
| Rank | GENE | SYMBOL | DESC | LIST.LOC | S2N | RES | CORE_ENRICHMENT |
|---|---|---|---|---|---|---|---|
| 1 | IL1RN | IL1RN | IL1RN | 96 | 0.78 | 0.044 | YES |
| 2 | HGF | HGF | HGF | 124 | 0.74 | 0.088 | YES |
| 3 | IL1R2 | IL1R2 | IL1R2 | 241 | 0.65 | 0.12 | YES |
| 4 | IL1B | IL1B | IL1B | 314 | 0.6 | 0.16 | YES |
| 5 | NOD2 | NOD2 | NOD2 | 356 | 0.58 | 0.19 | YES |
| 6 | IRAK3 | IRAK3 | IRAK3 | 596 | 0.5 | 0.21 | YES |
| 7 | IL6R | IL6R | IL6R | 678 | 0.48 | 0.23 | YES |
| 8 | IL5RA | IL5RA | IL5RA | 1047 | 0.4 | 0.24 | YES |
| 9 | IL6 | IL6 | IL6 | 1086 | 0.4 | 0.26 | YES |
| 10 | IL7R | IL7R | IL7R | 1179 | 0.38 | 0.28 | YES |
| 11 | CSF2 | CSF2 | CSF2 | 1279 | 0.36 | 0.3 | YES |
| 12 | JAK2 | JAK2 | JAK2 | 1430 | 0.35 | 0.31 | YES |
| 13 | YES1 | YES1 | YES1 | 1496 | 0.34 | 0.33 | YES |
| 14 | IRAK2 | IRAK2 | IRAK2 | 1517 | 0.34 | 0.35 | YES |
| 15 | STAT1 | STAT1 | STAT1 | 1534 | 0.34 | 0.37 | YES |
| 16 | IL1R1 | IL1R1 | IL1R1 | 1545 | 0.34 | 0.39 | YES |
| 17 | IL3RA | IL3RA | IL3RA | 1685 | 0.32 | 0.4 | YES |
| 18 | IL6ST | IL6ST | IL6ST | 1718 | 0.32 | 0.42 | YES |
| 19 | SOCS3 | SOCS3 | SOCS3 | 1807 | 0.31 | 0.43 | YES |
| 20 | CSF2RB | CSF2RB | CSF2RB | 1848 | 0.3 | 0.45 | YES |
| 21 | IL2RB | IL2RB | IL2RB | 2217 | 0.27 | 0.45 | YES |
| 22 | PELI2 | PELI2 | PELI2 | 2656 | 0.24 | 0.44 | YES |
| 23 | TRAF6 | TRAF6 | TRAF6 | 2931 | 0.22 | 0.43 | YES |
| 24 | IL1RAP | IL1RAP | IL1RAP | 3027 | 0.22 | 0.44 | YES |
| 25 | RIPK2 | RIPK2 | RIPK2 | 3079 | 0.21 | 0.45 | YES |
| 26 | PIK3R3 | PIK3R3 | PIK3R3 | 3335 | 0.2 | 0.45 | YES |
| 27 | TNIP2 | TNIP2 | TNIP2 | 3338 | 0.2 | 0.46 | YES |
| 28 | CSF2RA | CSF2RA | CSF2RA | 3481 | 0.19 | 0.47 | YES |
| 29 | PIK3CB | PIK3CB | PIK3CB | 3622 | 0.18 | 0.47 | YES |
| 30 | HCK | HCK | HCK | 3629 | 0.18 | 0.48 | YES |
| 31 | FYN | FYN | FYN | 3630 | 0.18 | 0.49 | YES |
| 32 | NFKB2 | NFKB2 | NFKB2 | 3704 | 0.18 | 0.5 | YES |
| 33 | PIK3R1 | PIK3R1 | PIK3R1 | 4109 | 0.16 | 0.49 | YES |
| 34 | IL2RG | IL2RG | IL2RG | 4257 | 0.15 | 0.49 | YES |
| 35 | CASP1 | CASP1 | CASP1 | 4348 | 0.14 | 0.49 | YES |
| 36 | SQSTM1 | SQSTM1 | SQSTM1 | 4520 | 0.14 | 0.49 | YES |
| 37 | JAK3 | JAK3 | JAK3 | 4548 | 0.14 | 0.5 | YES |
| 38 | GAB2 | GAB2 | GAB2 | 4660 | 0.13 | 0.5 | YES |
| 39 | MAP3K3 | MAP3K3 | MAP3K3 | 4983 | 0.12 | 0.49 | YES |
| 40 | CHUK | CHUK | CHUK | 5020 | 0.12 | 0.49 | YES |
| 41 | TYK2 | TYK2 | TYK2 | 5037 | 0.12 | 0.5 | YES |
| 42 | STAT5A | STAT5A | STAT5A | 5060 | 0.12 | 0.5 | YES |
| 43 | MYD88 | MYD88 | MYD88 | 5136 | 0.11 | 0.51 | YES |
| 44 | MAP2K6 | MAP2K6 | MAP2K6 | 5308 | 0.11 | 0.5 | YES |
| 45 | CRK | CRK | CRK | 5323 | 0.1 | 0.51 | YES |
| 46 | MAP2K1 | MAP2K1 | MAP2K1 | 5338 | 0.1 | 0.52 | YES |
| 47 | PIK3CD | PIK3CD | PIK3CD | 5358 | 0.1 | 0.52 | YES |
| 48 | STAT3 | STAT3 | STAT3 | 5667 | 0.095 | 0.51 | NO |
| 49 | PTK2B | PTK2B | PTK2B | 5732 | 0.093 | 0.51 | NO |
| 50 | MAP3K8 | MAP3K8 | MAP3K8 | 5978 | 0.085 | 0.5 | NO |
| 51 | STAT5B | STAT5B | STAT5B | 5980 | 0.085 | 0.51 | NO |
| 52 | TAB2 | TAB2 | TAB2 | 6006 | 0.084 | 0.51 | NO |
| 53 | IL2 | IL2 | IL2 | 6271 | 0.076 | 0.5 | NO |
| 54 | IL1A | IL1A | IL1A | 6326 | 0.074 | 0.5 | NO |
| 55 | TAB3 | TAB3 | TAB3 | 6650 | 0.065 | 0.49 | NO |
| 56 | CBL | CBL | CBL | 6723 | 0.064 | 0.49 | NO |
| 57 | IL18 | IL18 | IL18 | 6786 | 0.061 | 0.49 | NO |
| 58 | MAP2K2 | MAP2K2 | MAP2K2 | 6802 | 0.061 | 0.49 | NO |
| 59 | VAV1 | VAV1 | VAV1 | 7059 | 0.054 | 0.48 | NO |
| 60 | NRAS | NRAS | NRAS | 7137 | 0.052 | 0.48 | NO |
| 61 | IKBKB | IKBKB | IKBKB | 7202 | 0.05 | 0.48 | NO |
| 62 | IRAK1 | IRAK1 | IRAK1 | 7397 | 0.046 | 0.47 | NO |
| 63 | KRAS | KRAS | KRAS | 7618 | 0.04 | 0.46 | NO |
| 64 | PTPN6 | PTPN6 | PTPN6 | 7669 | 0.039 | 0.46 | NO |
| 65 | PELI3 | PELI3 | PELI3 | 7728 | 0.038 | 0.46 | NO |
| 66 | IL2RA | IL2RA | IL2RA | 7848 | 0.035 | 0.46 | NO |
| 67 | RAF1 | RAF1 | RAF1 | 7858 | 0.035 | 0.46 | NO |
| 68 | TOLLIP | TOLLIP | TOLLIP | 8029 | 0.031 | 0.45 | NO |
| 69 | MAP2K4 | MAP2K4 | MAP2K4 | 8103 | 0.029 | 0.45 | NO |
| 70 | YWHAZ | YWHAZ | YWHAZ | 8194 | 0.027 | 0.44 | NO |
| 71 | RELA | RELA | RELA | 8411 | 0.023 | 0.43 | NO |
| 72 | SHC1 | SHC1 | SHC1 | 8438 | 0.022 | 0.43 | NO |
| 73 | RAPGEF1 | RAPGEF1 | RAPGEF1 | 8524 | 0.02 | 0.43 | NO |
| 74 | IKBKG | IKBKG | IKBKG | 8750 | 0.016 | 0.42 | NO |
| 75 | CUL1 | CUL1 | CUL1 | 8885 | 0.013 | 0.41 | NO |
| 76 | LYN | LYN | LYN | 8896 | 0.013 | 0.41 | NO |
| 77 | YWHAB | YWHAB | YWHAB | 9263 | 0.0052 | 0.39 | NO |
| 78 | LCK | LCK | LCK | 9267 | 0.0051 | 0.39 | NO |
| 79 | BTRC | BTRC | BTRC | 9289 | 0.0046 | 0.39 | NO |
| 80 | SKP1 | SKP1 | SKP1 | 9397 | 0.0024 | 0.38 | NO |
| 81 | IRAK4 | IRAK4 | IRAK4 | 9415 | 0.0022 | 0.38 | NO |
| 82 | GRB2 | GRB2 | GRB2 | 9626 | -0.002 | 0.37 | NO |
| 83 | SOS1 | SOS1 | SOS1 | 9673 | -0.0027 | 0.37 | NO |
| 84 | NOD1 | NOD1 | NOD1 | 9756 | -0.0046 | 0.36 | NO |
| 85 | JAK1 | JAK1 | JAK1 | 9870 | -0.007 | 0.36 | NO |
| 86 | PIK3CA | PIK3CA | PIK3CA | 9924 | -0.008 | 0.36 | NO |
| 87 | INPPL1 | INPPL1 | INPPL1 | 9978 | -0.0089 | 0.35 | NO |
| 88 | MAPK3 | MAPK3 | MAPK3 | 9998 | -0.0093 | 0.35 | NO |
| 89 | CRKL | CRKL | CRKL | 10062 | -0.01 | 0.35 | NO |
| 90 | RBX1 | RBX1 | RBX1 | 10765 | -0.024 | 0.31 | NO |
| 91 | TAB1 | TAB1 | TAB1 | 10826 | -0.026 | 0.31 | NO |
| 92 | MAPK1 | MAPK1 | MAPK1 | 10844 | -0.026 | 0.31 | NO |
| 93 | TEC | TEC | TEC | 11323 | -0.036 | 0.29 | NO |
| 94 | UBE2N | UBE2N | UBE2N | 11423 | -0.038 | 0.28 | NO |
| 95 | PIK3R2 | PIK3R2 | PIK3R2 | 11662 | -0.043 | 0.27 | NO |
| 96 | MAP3K7 | MAP3K7 | MAP3K7 | 11756 | -0.045 | 0.27 | NO |
| 97 | HRAS | HRAS | HRAS | 12995 | -0.073 | 0.2 | NO |
| 98 | PELI1 | PELI1 | PELI1 | 13393 | -0.083 | 0.19 | NO |
| 99 | PRKACB | PRKACB | PRKACB | 14467 | -0.12 | 0.13 | NO |
| 100 | CDK1 | CDK1 | CDK1 | 15276 | -0.16 | 0.096 | NO |
| 101 | SYK | SYK | SYK | 15458 | -0.16 | 0.096 | NO |
| 102 | IL7 | IL7 | IL7 | 16279 | -0.23 | 0.064 | NO |
| 103 | BLNK | BLNK | BLNK | 16385 | -0.24 | 0.073 | NO |
Figure S115. Get High-res Image This plot shows mRNAseq_cNMF expression data heatmap (on the left) a RunningEnrichmentScore(RES) plot (on the top right) and a Signal2Noise(S2N) plot (on the bottom right) of genes in the pathway: PID ERBB2ERBB3PATHWAY.

Figure S116. Get High-res Image For the top 5 core enriched genes in the pathway: PID ERBB2ERBB3PATHWAY, this volcano plot shows how much they are up/down-regulated and significant. The significance was calculated by empirical bayesian fit
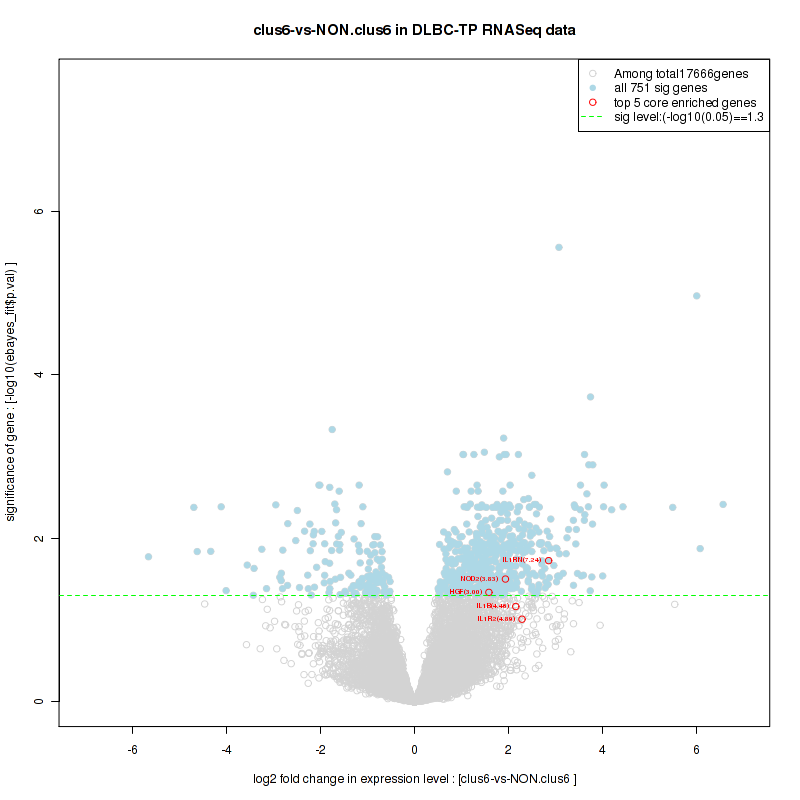
Table S59. Get Full Table This table shows a Running Enrichment Score (RES) of each gene in this pathway, that is, the enrichment score at this point in the ranked list of genes. All genes are ranked by Signal-to-Noise (S2N), a measure of similarity as default and are used to obtain ES matrix of all genes. In this way, GSEA tool uses expression pattern of not only overlapped genes but also not-overlapped genes to produce ES matrix.
| Rank | GENE | SYMBOL | DESC | LIST.LOC | S2N | RES | CORE_ENRICHMENT |
|---|---|---|---|---|---|---|---|
| 1 | CDH1 | CDH1 | CDH1 | 487 | 0.53 | 0.11 | YES |
| 2 | RXRG | RXRG | RXRG | 935 | 0.42 | 0.19 | YES |
| 3 | TCF7L2 | TCF7L2 | TCF7L2 | 1146 | 0.38 | 0.28 | YES |
| 4 | TCF7 | TCF7 | TCF7 | 1289 | 0.36 | 0.36 | YES |
| 5 | CCND1 | CCND1 | CCND1 | 1486 | 0.34 | 0.44 | YES |
| 6 | NTRK1 | NTRK1 | NTRK1 | 2147 | 0.28 | 0.47 | YES |
| 7 | TCF7L1 | TCF7L1 | TCF7L1 | 2434 | 0.25 | 0.52 | YES |
| 8 | RET | RET | RET | 2570 | 0.24 | 0.57 | YES |
| 9 | RXRA | RXRA | RXRA | 2837 | 0.23 | 0.61 | YES |
| 10 | NCOA4 | NCOA4 | NCOA4 | 4761 | 0.13 | 0.54 | NO |
| 11 | MAP2K1 | MAP2K1 | MAP2K1 | 5338 | 0.1 | 0.53 | NO |
| 12 | PAX8 | PAX8 | PAX8 | 6165 | 0.079 | 0.5 | NO |
| 13 | MAP2K2 | MAP2K2 | MAP2K2 | 6802 | 0.061 | 0.48 | NO |
| 14 | NRAS | NRAS | NRAS | 7137 | 0.052 | 0.48 | NO |
| 15 | TFG | TFG | TFG | 7489 | 0.044 | 0.47 | NO |
| 16 | KRAS | KRAS | KRAS | 7618 | 0.04 | 0.47 | NO |
| 17 | TPR | TPR | TPR | 7865 | 0.035 | 0.47 | NO |
| 18 | LEF1 | LEF1 | LEF1 | 8909 | 0.013 | 0.41 | NO |
| 19 | CTNNB1 | CTNNB1 | CTNNB1 | 9112 | 0.0085 | 0.4 | NO |
| 20 | TPM3 | TPM3 | TPM3 | 9259 | 0.0053 | 0.4 | NO |
| 21 | MAPK3 | MAPK3 | MAPK3 | 9998 | -0.0093 | 0.36 | NO |
| 22 | CCDC6 | CCDC6 | CCDC6 | 10266 | -0.014 | 0.34 | NO |
| 23 | TP53 | TP53 | TP53 | 10818 | -0.025 | 0.32 | NO |
| 24 | MAPK1 | MAPK1 | MAPK1 | 10844 | -0.026 | 0.32 | NO |
| 25 | BRAF | BRAF | BRAF | 11105 | -0.031 | 0.32 | NO |
| 26 | PPARG | PPARG | PPARG | 11350 | -0.036 | 0.31 | NO |
| 27 | RXRB | RXRB | RXRB | 11856 | -0.048 | 0.3 | NO |
| 28 | MYC | MYC | MYC | 12264 | -0.056 | 0.29 | NO |
| 29 | HRAS | HRAS | HRAS | 12995 | -0.073 | 0.26 | NO |
Figure S117. Get High-res Image This plot shows mRNAseq_cNMF expression data heatmap (on the left) a RunningEnrichmentScore(RES) plot (on the top right) and a Signal2Noise(S2N) plot (on the bottom right) of genes in the pathway: REACTOME ANTIVIRAL MECHANISM BY IFN STIMULATED GENES.
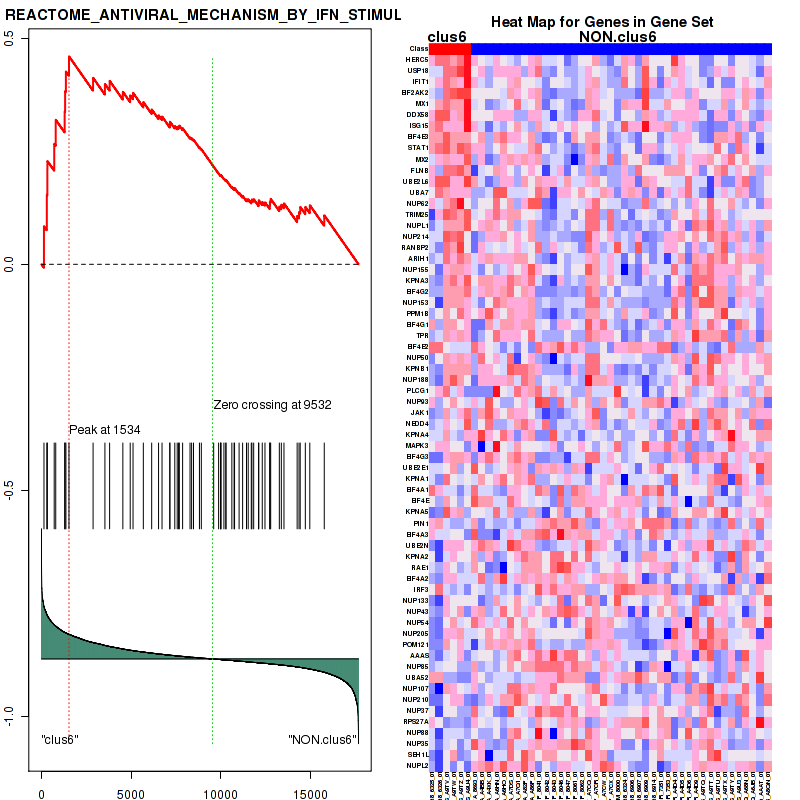
Figure S118. Get High-res Image For the top 5 core enriched genes in the pathway: REACTOME ANTIVIRAL MECHANISM BY IFN STIMULATED GENES, this volcano plot shows how much they are up/down-regulated and significant. The significance was calculated by empirical bayesian fit

Table S60. Get Full Table This table shows a Running Enrichment Score (RES) of each gene in this pathway, that is, the enrichment score at this point in the ranked list of genes. All genes are ranked by Signal-to-Noise (S2N), a measure of similarity as default and are used to obtain ES matrix of all genes. In this way, GSEA tool uses expression pattern of not only overlapped genes but also not-overlapped genes to produce ES matrix.
| Rank | GENE | SYMBOL | DESC | LIST.LOC | S2N | RES | CORE_ENRICHMENT |
|---|---|---|---|---|---|---|---|
| 1 | IL1RN | IL1RN | IL1RN | 96 | 0.78 | 0.12 | YES |
| 2 | IL1R2 | IL1R2 | IL1R2 | 241 | 0.65 | 0.21 | YES |
| 3 | IL1B | IL1B | IL1B | 314 | 0.6 | 0.3 | YES |
| 4 | NOD2 | NOD2 | NOD2 | 356 | 0.58 | 0.39 | YES |
| 5 | IRAK3 | IRAK3 | IRAK3 | 596 | 0.5 | 0.46 | YES |
| 6 | IRAK2 | IRAK2 | IRAK2 | 1517 | 0.34 | 0.46 | YES |
| 7 | IL1R1 | IL1R1 | IL1R1 | 1545 | 0.34 | 0.51 | YES |
| 8 | PELI2 | PELI2 | PELI2 | 2656 | 0.24 | 0.49 | YES |
| 9 | TRAF6 | TRAF6 | TRAF6 | 2931 | 0.22 | 0.5 | YES |
| 10 | IL1RAP | IL1RAP | IL1RAP | 3027 | 0.22 | 0.53 | YES |
| 11 | RIPK2 | RIPK2 | RIPK2 | 3079 | 0.21 | 0.56 | YES |
| 12 | TNIP2 | TNIP2 | TNIP2 | 3338 | 0.2 | 0.58 | YES |
| 13 | SQSTM1 | SQSTM1 | SQSTM1 | 4520 | 0.14 | 0.54 | NO |
| 14 | MAP3K3 | MAP3K3 | MAP3K3 | 4983 | 0.12 | 0.53 | NO |
| 15 | CHUK | CHUK | CHUK | 5020 | 0.12 | 0.55 | NO |
| 16 | MYD88 | MYD88 | MYD88 | 5136 | 0.11 | 0.56 | NO |
| 17 | MAP2K6 | MAP2K6 | MAP2K6 | 5308 | 0.11 | 0.56 | NO |
| 18 | MAP2K1 | MAP2K1 | MAP2K1 | 5338 | 0.1 | 0.58 | NO |
| 19 | MAP3K8 | MAP3K8 | MAP3K8 | 5978 | 0.085 | 0.56 | NO |
| 20 | TAB2 | TAB2 | TAB2 | 6006 | 0.084 | 0.57 | NO |
| 21 | IL1A | IL1A | IL1A | 6326 | 0.074 | 0.56 | NO |
| 22 | TAB3 | TAB3 | TAB3 | 6650 | 0.065 | 0.55 | NO |
| 23 | IKBKB | IKBKB | IKBKB | 7202 | 0.05 | 0.53 | NO |
| 24 | IRAK1 | IRAK1 | IRAK1 | 7397 | 0.046 | 0.52 | NO |
| 25 | PELI3 | PELI3 | PELI3 | 7728 | 0.038 | 0.51 | NO |
| 26 | TOLLIP | TOLLIP | TOLLIP | 8029 | 0.031 | 0.5 | NO |
| 27 | MAP2K4 | MAP2K4 | MAP2K4 | 8103 | 0.029 | 0.5 | NO |
| 28 | IKBKG | IKBKG | IKBKG | 8750 | 0.016 | 0.47 | NO |
| 29 | CUL1 | CUL1 | CUL1 | 8885 | 0.013 | 0.46 | NO |
| 30 | BTRC | BTRC | BTRC | 9289 | 0.0046 | 0.44 | NO |
| 31 | SKP1 | SKP1 | SKP1 | 9397 | 0.0024 | 0.43 | NO |
| 32 | IRAK4 | IRAK4 | IRAK4 | 9415 | 0.0022 | 0.43 | NO |
| 33 | NOD1 | NOD1 | NOD1 | 9756 | -0.0046 | 0.41 | NO |
| 34 | RBX1 | RBX1 | RBX1 | 10765 | -0.024 | 0.36 | NO |
| 35 | TAB1 | TAB1 | TAB1 | 10826 | -0.026 | 0.36 | NO |
| 36 | UBE2N | UBE2N | UBE2N | 11423 | -0.038 | 0.33 | NO |
| 37 | MAP3K7 | MAP3K7 | MAP3K7 | 11756 | -0.045 | 0.32 | NO |
| 38 | PELI1 | PELI1 | PELI1 | 13393 | -0.083 | 0.24 | NO |
Figure S119. Get High-res Image This plot shows mRNAseq_cNMF expression data heatmap (on the left) a RunningEnrichmentScore(RES) plot (on the top right) and a Signal2Noise(S2N) plot (on the bottom right) of genes in the pathway: REACTOME TRIGLYCERIDE BIOSYNTHESIS.
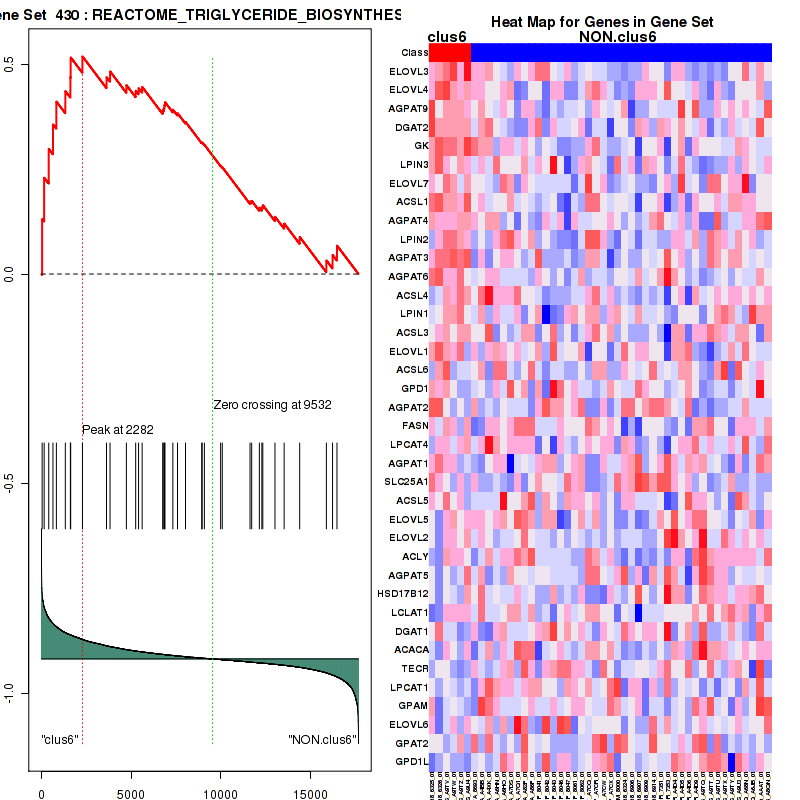
Figure S120. Get High-res Image For the top 5 core enriched genes in the pathway: REACTOME TRIGLYCERIDE BIOSYNTHESIS, this volcano plot shows how much they are up/down-regulated and significant. The significance was calculated by empirical bayesian fit

For the top enriched genes, if you want to check whether they are
-
up-regulated, please check the list of up-regulated genes
-
down-regulated, please check the list of down-regulated genes
For the top enriched genes, if you want to check whether they are
-
highly expressed genes, please check the list of high (top 30%) expressed genes
-
low expressed genes, please check the list of low (bottom 30%) expressed genes
An expression pattern of top(30%)/middle(30%)/low(30%) in this subtype against other subtypes is available in a heatmap
For the top enriched genes, if you want to check whether they are
-
significantly differently expressed genes by eBayes lm fit, please check the list of significant genes
-
Gene set database = c2.cp.v4.0.symbols.gmt
-
Expression data file = DLBC-TP.uncv2.mRNAseq_RSEM_normalized_log2.txt
-
Phenotype data file = DLBC-TP.mergedcluster.txt
For the Gene Set Enrichment Analysis (GSEA), Broad GSEA-P-R.1.0 version is used with class2: canonical pathways geneses from MSigDB. Further details about statistics are available inThe Broad GSEA website.
In addition to the links below, the full results of the analysis summarized in this report can also be downloaded programmatically using firehose_get, or interactively from either the Broad GDAC website or TCGA Data Coordination Center Portal.