This pipeline performs Gene Set Enrichment Analysis (GSEA) using The Broad Institute GSEA tool with MSigDB - Class2: Canonical Pathways gene sets. For a given phenotype subtype, it shows what pathways are significantly enriched in each subtype by comparing gene expression profiles between subtypes. Here, the phenotype is mRNAseq_cNMF subtypes having more than three samples and the input expression file "GBM-TP.uncv2.mRNAseq_RSEM_normalized_log2.txt" is generated in the pipeline mRNAseq_Preprocess in the stddata run. This pipeline has the following features:
-
For each subtype, calculates enrichment scores (ES) using signal to noise (S2N) that checks similarity between subtypes in expression level then calculates p values through permutation test.
-
Lists pathways significantly enriched in each phenotype subtype and their enrichment scores (ES).
-
Lists top 20 core genes enriched in each significant gene set and their enrichment scores (ES).
-
Checks if the top core genes are up-regulated or down-regulated.
-
Checks if the top core genes are high expressed or low expressed.
-
Checks if the top core genes are significantly differently expressed genes.
Table 1. Get Full Table basic data info
| basic data info |
|---|
| Number of Gene Sets: 709 |
| Number of samples: 153 |
| Original number of Gene Sets: 1320 |
| Maximum gene set size: 933 |
Table 2. Get Full Table pheno data info
| phenotype info |
|---|
| pheno.type: 1 - 3 :[ clus1 ] 48 |
| pheno.type: 2 - 3 :[ clus2 ] 71 |
| pheno.type: 3 - 3 :[ clus3 ] 34 |
For the expression subtypes of 18210 genes in 154 samples, GSEA found enriched gene sets in each cluster using 153 gene sets in MSigDB canonical pathways. Top enriched gene sets are listed as below.
-
clus1
-
Top enriched gene sets are KEGG RNA DEGRADATION, KEGG CELL CYCLE, KEGG PROGESTERONE MEDIATED OOCYTE MATURATION, PID ATR PATHWAY, PID RET PATHWAY, PID ATM PATHWAY, PID PLK1 PATHWAY, PID AR TF PATHWAY, PID LIS1PATHWAY, PID ERA GENOMIC PATHWAY
-
And common core enriched genes are CCNA2, CDC25A, CDC25C, PLK1, LSM2, ADCY1, ADCY5, ADCY8, AKT3, BUB1
-
clus2
-
Top enriched gene sets are KEGG AMINO SUGAR AND NUCLEOTIDE SUGAR METABOLISM, BIOCARTA HIVNEF PATHWAY, BIOCARTA IL2RB PATHWAY, BIOCARTA DEATH PATHWAY, ST TUMOR NECROSIS FACTOR PATHWAY, PID SYNDECAN 4 PATHWAY, PID HIVNEFPATHWAY, REACTOME ANTIGEN PROCESSING CROSS PRESENTATION, REACTOME TRIF MEDIATED TLR3 SIGNALING, REACTOME ACTIVATION OF CHAPERONE GENES BY XBP1S
-
And common core enriched genes are DDX58, HERC5, IFNB1, IRF1, IRF2, IRF3, IRF7, ISG15, UBA7, UBE2L6
-
clus3
-
Top enriched gene sets are KEGG ALANINE ASPARTATE AND GLUTAMATE METABOLISM, KEGG O GLYCAN BIOSYNTHESIS, KEGG INOSITOL PHOSPHATE METABOLISM, KEGG GLYCOSPHINGOLIPID BIOSYNTHESIS LACTO AND NEOLACTO SERIES, KEGG BUTANOATE METABOLISM, KEGG MAPK SIGNALING PATHWAY, KEGG ERBB SIGNALING PATHWAY, KEGG CALCIUM SIGNALING PATHWAY, KEGG PHOSPHATIDYLINOSITOL SIGNALING SYSTEM, KEGG NEUROACTIVE LIGAND RECEPTOR INTERACTION
-
And common core enriched genes are CAMK2A, CAMK2B, GRIN1, GRIN2A, GRIN2C, NEFL, ACTN2, RASGRF1, RASGRF2, CAMK2G
Table 3. Get Full Table This table shows top 10 pathways which are significantly enriched in cluster clus1. It displays only significant gene sets satisfying nom.p.val.threshold (-1), fwer.p.val.threshold (-1) , fdr.q.val.threshold (0.25) and the default table is sorted by Normalized Enrichment Score (NES). Further details on NES statistics, please visit The Broad GSEA website.
| GeneSet(GS) | Size(#genes) | genes.ES.table | ES | NES | NOM.p.val | FDR.q.val | FWER.p.val | Tag.. | Gene.. | Signal | FDR..median. | glob.p.val |
|---|---|---|---|---|---|---|---|---|---|---|---|---|
| KEGG RNA DEGRADATION | 57 | genes.ES.table | 0.43 | 1.8 | 0.026 | 1 | 0.52 | 0.53 | 0.37 | 0.33 | 0.35 | 0.27 |
| KEGG CELL CYCLE | 118 | genes.ES.table | 0.54 | 1.7 | 0.046 | 0.45 | 0.82 | 0.35 | 0.17 | 0.29 | 0.2 | 0.12 |
| KEGG PROGESTERONE MEDIATED OOCYTE MATURATION | 81 | genes.ES.table | 0.51 | 1.8 | 0 | 1 | 0.5 | 0.28 | 0.16 | 0.24 | 0.27 | 0.39 |
| PID ATR PATHWAY | 39 | genes.ES.table | 0.7 | 1.8 | 0.015 | 0.86 | 0.65 | 0.44 | 0.18 | 0.36 | 0.31 | 0.22 |
| PID RET PATHWAY | 39 | genes.ES.table | 0.49 | 1.8 | 0.0059 | 0.67 | 0.7 | 0.18 | 0.1 | 0.16 | 0.26 | 0.17 |
| PID ATM PATHWAY | 34 | genes.ES.table | 0.52 | 1.7 | 0.048 | 0.44 | 0.86 | 0.44 | 0.29 | 0.32 | 0.2 | 0.11 |
| PID PLK1 PATHWAY | 45 | genes.ES.table | 0.73 | 1.7 | 0.027 | 0.44 | 0.78 | 0.53 | 0.17 | 0.44 | 0.18 | 0.11 |
| PID AR TF PATHWAY | 50 | genes.ES.table | 0.48 | 1.7 | 0.012 | 0.43 | 0.82 | 0.52 | 0.33 | 0.35 | 0.19 | 0.11 |
| PID LIS1PATHWAY | 28 | genes.ES.table | 0.55 | 1.7 | 0.018 | 0.41 | 0.87 | 0.25 | 0.15 | 0.21 | 0.2 | 0.1 |
| PID ERA GENOMIC PATHWAY | 62 | genes.ES.table | 0.46 | 1.7 | 0.0084 | 0.47 | 0.78 | 0.13 | 0.066 | 0.12 | 0.19 | 0.12 |
Table S1. Get Full Table This table shows a Running Enrichment Score (RES) of each gene in this pathway, that is, the enrichment score at this point in the ranked list of genes. All genes are ranked by Signal-to-Noise (S2N), a measure of similarity as default and are used to obtain ES matrix of all genes. In this way, GSEA tool uses expression pattern of not only overlapped genes but also not-overlapped genes to produce ES matrix.
| Rank | GENE | SYMBOL | DESC | LIST.LOC | S2N | RES | CORE_ENRICHMENT |
|---|---|---|---|---|---|---|---|
| 1 | ADCY5 | ADCY5 | ADCY5 | 236 | 0.5 | 0.044 | YES |
| 2 | CDC25C | CDC25C | CDC25C | 381 | 0.43 | 0.086 | YES |
| 3 | CDC25A | CDC25A | CDC25A | 383 | 0.43 | 0.14 | YES |
| 4 | PKMYT1 | PKMYT1 | PKMYT1 | 565 | 0.37 | 0.17 | YES |
| 5 | GNAI1 | GNAI1 | GNAI1 | 664 | 0.34 | 0.2 | YES |
| 6 | CCNB3 | CCNB3 | CCNB3 | 831 | 0.31 | 0.23 | YES |
| 7 | PDE3B | PDE3B | PDE3B | 936 | 0.29 | 0.25 | YES |
| 8 | PLK1 | PLK1 | PLK1 | 988 | 0.28 | 0.28 | YES |
| 9 | RPS6KA6 | RPS6KA6 | RPS6KA6 | 989 | 0.28 | 0.32 | YES |
| 10 | MAD2L1 | MAD2L1 | MAD2L1 | 1060 | 0.27 | 0.34 | YES |
| 11 | CCNB2 | CCNB2 | CCNB2 | 1115 | 0.27 | 0.37 | YES |
| 12 | BUB1 | BUB1 | BUB1 | 1291 | 0.24 | 0.39 | YES |
| 13 | CCNA2 | CCNA2 | CCNA2 | 1313 | 0.24 | 0.42 | YES |
| 14 | CDK1 | CDK1 | CDK1 | 1599 | 0.21 | 0.42 | YES |
| 15 | MAPK8 | MAPK8 | MAPK8 | 1658 | 0.21 | 0.44 | YES |
| 16 | PIK3R3 | PIK3R3 | PIK3R3 | 1926 | 0.18 | 0.45 | YES |
| 17 | CCNB1 | CCNB1 | CCNB1 | 2331 | 0.16 | 0.45 | YES |
| 18 | AKT3 | AKT3 | AKT3 | 2415 | 0.15 | 0.46 | YES |
| 19 | MAD2L2 | MAD2L2 | MAD2L2 | 2632 | 0.14 | 0.46 | YES |
| 20 | PRKX | PRKX | PRKX | 2639 | 0.14 | 0.48 | YES |
| 21 | ADCY8 | ADCY8 | ADCY8 | 2797 | 0.13 | 0.48 | YES |
| 22 | CDC26 | CDC26 | CDC26 | 2879 | 0.12 | 0.5 | YES |
| 23 | ADCY1 | ADCY1 | ADCY1 | 2914 | 0.12 | 0.51 | YES |
| 24 | PIK3R2 | PIK3R2 | PIK3R2 | 3399 | 0.1 | 0.49 | NO |
| 25 | ADCY2 | ADCY2 | ADCY2 | 3647 | 0.095 | 0.49 | NO |
| 26 | RAF1 | RAF1 | RAF1 | 3993 | 0.084 | 0.48 | NO |
| 27 | ADCY9 | ADCY9 | ADCY9 | 4281 | 0.076 | 0.47 | NO |
| 28 | MAPK12 | MAPK12 | MAPK12 | 4514 | 0.07 | 0.47 | NO |
| 29 | CCNA1 | CCNA1 | CCNA1 | 4801 | 0.064 | 0.46 | NO |
| 30 | MAPK10 | MAPK10 | MAPK10 | 5214 | 0.055 | 0.44 | NO |
| 31 | BRAF | BRAF | BRAF | 5592 | 0.049 | 0.43 | NO |
| 32 | PIK3CA | PIK3CA | PIK3CA | 5616 | 0.049 | 0.43 | NO |
| 33 | CDC25B | CDC25B | CDC25B | 5946 | 0.043 | 0.42 | NO |
| 34 | ANAPC1 | ANAPC1 | ANAPC1 | 5969 | 0.043 | 0.42 | NO |
| 35 | ANAPC7 | ANAPC7 | ANAPC7 | 5975 | 0.043 | 0.43 | NO |
| 36 | KRAS | KRAS | KRAS | 6004 | 0.043 | 0.43 | NO |
| 37 | HSP90AB1 | HSP90AB1 | HSP90AB1 | 6237 | 0.039 | 0.42 | NO |
| 38 | FZR1 | FZR1 | FZR1 | 6295 | 0.038 | 0.42 | NO |
| 39 | CDC23 | CDC23 | CDC23 | 6843 | 0.03 | 0.4 | NO |
| 40 | ANAPC13 | ANAPC13 | ANAPC13 | 6879 | 0.03 | 0.4 | NO |
| 41 | CDC27 | CDC27 | CDC27 | 6980 | 0.029 | 0.4 | NO |
| 42 | ANAPC5 | ANAPC5 | ANAPC5 | 6998 | 0.029 | 0.4 | NO |
| 43 | ANAPC2 | ANAPC2 | ANAPC2 | 7118 | 0.027 | 0.4 | NO |
| 44 | CDK2 | CDK2 | CDK2 | 7151 | 0.027 | 0.4 | NO |
| 45 | PRKACB | PRKACB | PRKACB | 7428 | 0.023 | 0.38 | NO |
| 46 | IGF1R | IGF1R | IGF1R | 7514 | 0.022 | 0.38 | NO |
| 47 | ANAPC11 | ANAPC11 | ANAPC11 | 7649 | 0.02 | 0.38 | NO |
| 48 | PIK3R1 | PIK3R1 | PIK3R1 | 7809 | 0.019 | 0.37 | NO |
| 49 | ADCY7 | ADCY7 | ADCY7 | 8427 | 0.011 | 0.34 | NO |
| 50 | ADCY6 | ADCY6 | ADCY6 | 8607 | 0.0083 | 0.33 | NO |
| 51 | MAPK11 | MAPK11 | MAPK11 | 9127 | 0.0017 | 0.3 | NO |
| 52 | GNAI3 | GNAI3 | GNAI3 | 9186 | 0.00096 | 0.3 | NO |
| 53 | MAPK9 | MAPK9 | MAPK9 | 9470 | -0.0025 | 0.28 | NO |
| 54 | MAPK14 | MAPK14 | MAPK14 | 9593 | -0.004 | 0.28 | NO |
| 55 | MAPK1 | MAPK1 | MAPK1 | 9920 | -0.0081 | 0.26 | NO |
| 56 | AKT2 | AKT2 | AKT2 | 10960 | -0.022 | 0.2 | NO |
| 57 | ANAPC4 | ANAPC4 | ANAPC4 | 11228 | -0.025 | 0.19 | NO |
| 58 | MAPK3 | MAPK3 | MAPK3 | 11233 | -0.025 | 0.19 | NO |
| 59 | MAP2K1 | MAP2K1 | MAP2K1 | 11414 | -0.028 | 0.19 | NO |
| 60 | AKT1 | AKT1 | AKT1 | 11636 | -0.031 | 0.18 | NO |
| 61 | CDC16 | CDC16 | CDC16 | 11943 | -0.036 | 0.17 | NO |
| 62 | ADCY4 | ADCY4 | ADCY4 | 11954 | -0.036 | 0.17 | NO |
| 63 | HSP90AA1 | HSP90AA1 | HSP90AA1 | 11967 | -0.036 | 0.17 | NO |
| 64 | RPS6KA2 | RPS6KA2 | RPS6KA2 | 12020 | -0.037 | 0.17 | NO |
| 65 | PRKACA | PRKACA | PRKACA | 12068 | -0.038 | 0.18 | NO |
| 66 | GNAI2 | GNAI2 | GNAI2 | 12115 | -0.038 | 0.18 | NO |
| 67 | PIK3CD | PIK3CD | PIK3CD | 12324 | -0.041 | 0.17 | NO |
| 68 | ADCY3 | ADCY3 | ADCY3 | 12706 | -0.048 | 0.16 | NO |
| 69 | ARAF | ARAF | ARAF | 13101 | -0.056 | 0.14 | NO |
| 70 | PIK3CB | PIK3CB | PIK3CB | 13129 | -0.056 | 0.14 | NO |
| 71 | PDE3A | PDE3A | PDE3A | 13494 | -0.063 | 0.13 | NO |
| 72 | RPS6KA1 | RPS6KA1 | RPS6KA1 | 13716 | -0.068 | 0.13 | NO |
| 73 | ANAPC10 | ANAPC10 | ANAPC10 | 13778 | -0.07 | 0.13 | NO |
| 74 | SPDYA | SPDYA | SPDYA | 13801 | -0.07 | 0.14 | NO |
| 75 | RPS6KA3 | RPS6KA3 | RPS6KA3 | 14415 | -0.086 | 0.12 | NO |
| 76 | PIK3R5 | PIK3R5 | PIK3R5 | 14891 | -0.1 | 0.1 | NO |
| 77 | CPEB1 | CPEB1 | CPEB1 | 15340 | -0.12 | 0.089 | NO |
| 78 | IGF1 | IGF1 | IGF1 | 15506 | -0.12 | 0.094 | NO |
| 79 | PGR | PGR | PGR | 15717 | -0.13 | 0.098 | NO |
| 80 | PIK3CG | PIK3CG | PIK3CG | 16330 | -0.16 | 0.083 | NO |
| 81 | MAPK13 | MAPK13 | MAPK13 | 16522 | -0.18 | 0.092 | NO |
Figure S1. Get High-res Image This plot shows mRNAseq_cNMF expression data heatmap (on the left) a RunningEnrichmentScore(RES) plot (on the top right) and a Signal2Noise(S2N) plot (on the bottom right) of genes in the pathway: KEGG RNA DEGRADATION.
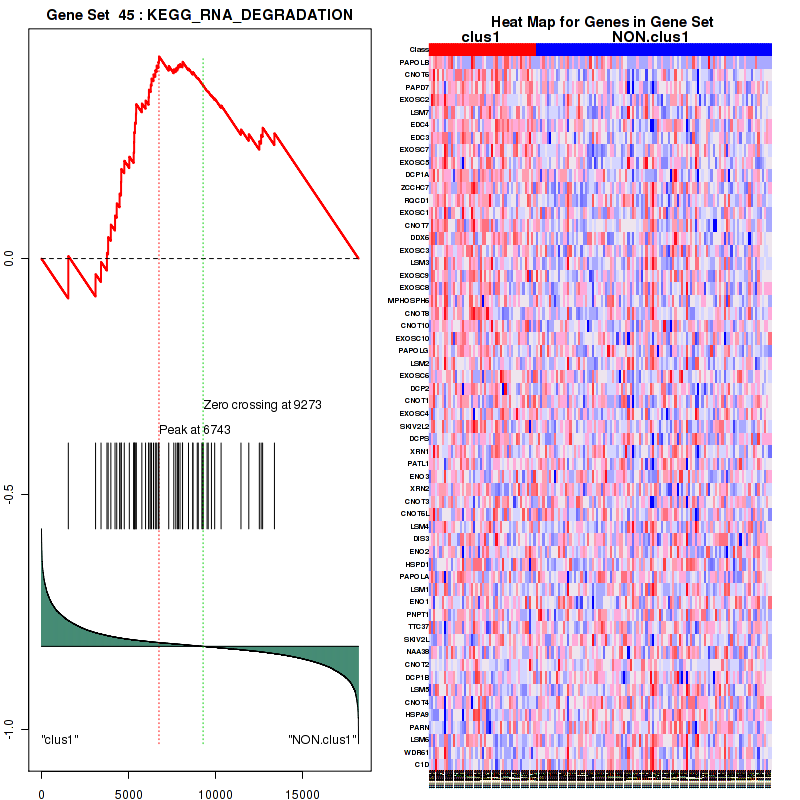
Figure S2. Get High-res Image For the top 5 core enriched genes in the pathway: KEGG RNA DEGRADATION, this volcano plot shows how much they are up/down-regulated and significant. The significance was calculated by empirical bayesian fit
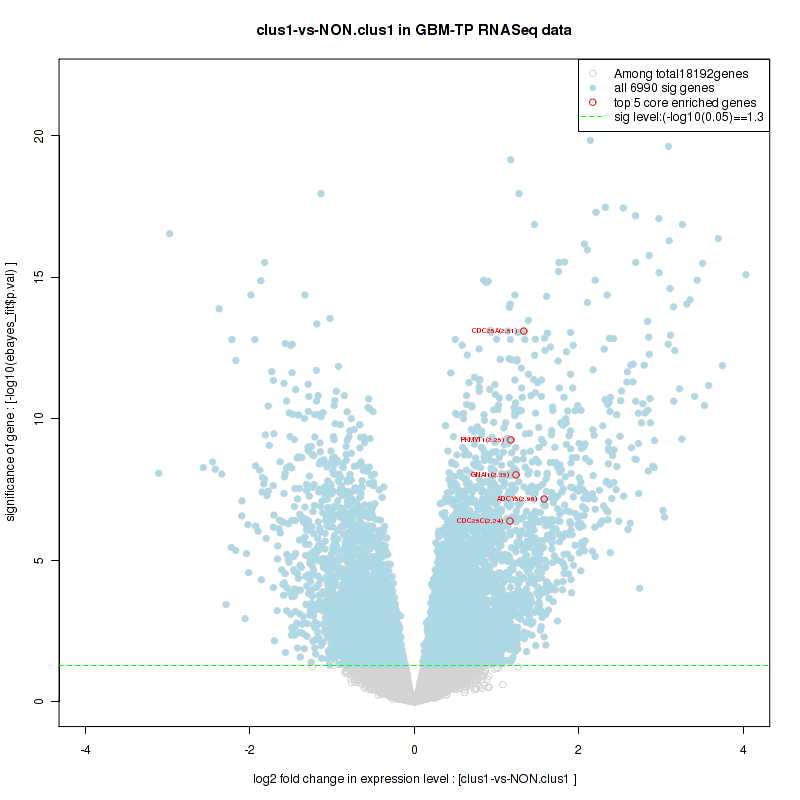
Table S2. Get Full Table This table shows a Running Enrichment Score (RES) of each gene in this pathway, that is, the enrichment score at this point in the ranked list of genes. All genes are ranked by Signal-to-Noise (S2N), a measure of similarity as default and are used to obtain ES matrix of all genes. In this way, GSEA tool uses expression pattern of not only overlapped genes but also not-overlapped genes to produce ES matrix.
| Rank | GENE | SYMBOL | DESC | LIST.LOC | S2N | RES | CORE_ENRICHMENT |
|---|---|---|---|---|---|---|---|
| 1 | PAPOLB | PAPOLB | PAPOLB | 1540 | 0.22 | 0.0055 | YES |
| 2 | CNOT6 | CNOT6 | CNOT6 | 3104 | 0.11 | -0.033 | YES |
| 3 | PAPD7 | PAPD7 | PAPD7 | 3416 | 0.1 | -0.0069 | YES |
| 4 | EXOSC2 | EXOSC2 | EXOSC2 | 3758 | 0.091 | 0.012 | YES |
| 5 | LSM7 | LSM7 | LSM7 | 3825 | 0.089 | 0.046 | YES |
| 6 | EDC4 | EDC4 | EDC4 | 3980 | 0.084 | 0.072 | YES |
| 7 | EDC3 | EDC3 | EDC3 | 4222 | 0.077 | 0.092 | YES |
| 8 | EXOSC7 | EXOSC7 | EXOSC7 | 4319 | 0.075 | 0.12 | YES |
| 9 | EXOSC5 | EXOSC5 | EXOSC5 | 4483 | 0.071 | 0.14 | YES |
| 10 | DCP1A | DCP1A | DCP1A | 4567 | 0.069 | 0.16 | YES |
| 11 | ZCCHC7 | ZCCHC7 | ZCCHC7 | 4578 | 0.068 | 0.19 | YES |
| 12 | RQCD1 | RQCD1 | RQCD1 | 4752 | 0.064 | 0.21 | YES |
| 13 | EXOSC1 | EXOSC1 | EXOSC1 | 5041 | 0.059 | 0.22 | YES |
| 14 | CNOT7 | CNOT7 | CNOT7 | 5292 | 0.054 | 0.22 | YES |
| 15 | DDX6 | DDX6 | DDX6 | 5317 | 0.054 | 0.25 | YES |
| 16 | EXOSC3 | EXOSC3 | EXOSC3 | 5323 | 0.054 | 0.27 | YES |
| 17 | LSM3 | LSM3 | LSM3 | 5365 | 0.053 | 0.29 | YES |
| 18 | EXOSC9 | EXOSC9 | EXOSC9 | 5420 | 0.052 | 0.31 | YES |
| 19 | EXOSC8 | EXOSC8 | EXOSC8 | 5436 | 0.052 | 0.33 | YES |
| 20 | MPHOSPH6 | MPHOSPH6 | MPHOSPH6 | 5761 | 0.046 | 0.33 | YES |
| 21 | CNOT8 | CNOT8 | CNOT8 | 5974 | 0.043 | 0.34 | YES |
| 22 | CNOT10 | CNOT10 | CNOT10 | 6149 | 0.04 | 0.34 | YES |
| 23 | EXOSC10 | EXOSC10 | EXOSC10 | 6168 | 0.04 | 0.36 | YES |
| 24 | PAPOLG | PAPOLG | PAPOLG | 6271 | 0.038 | 0.37 | YES |
| 25 | LSM2 | LSM2 | LSM2 | 6317 | 0.037 | 0.38 | YES |
| 26 | EXOSC6 | EXOSC6 | EXOSC6 | 6429 | 0.036 | 0.39 | YES |
| 27 | DCP2 | DCP2 | DCP2 | 6534 | 0.034 | 0.4 | YES |
| 28 | CNOT1 | CNOT1 | CNOT1 | 6609 | 0.034 | 0.41 | YES |
| 29 | EXOSC4 | EXOSC4 | EXOSC4 | 6710 | 0.032 | 0.42 | YES |
| 30 | SKIV2L2 | SKIV2L2 | SKIV2L2 | 6743 | 0.032 | 0.43 | YES |
| 31 | DCPS | DCPS | DCPS | 7302 | 0.025 | 0.41 | NO |
| 32 | XRN1 | XRN1 | XRN1 | 7592 | 0.021 | 0.4 | NO |
| 33 | PATL1 | PATL1 | PATL1 | 7708 | 0.02 | 0.4 | NO |
| 34 | ENO3 | ENO3 | ENO3 | 7800 | 0.019 | 0.41 | NO |
| 35 | XRN2 | XRN2 | XRN2 | 7859 | 0.018 | 0.41 | NO |
| 36 | CNOT3 | CNOT3 | CNOT3 | 7951 | 0.017 | 0.41 | NO |
| 37 | CNOT6L | CNOT6L | CNOT6L | 8090 | 0.015 | 0.41 | NO |
| 38 | LSM4 | LSM4 | LSM4 | 8097 | 0.015 | 0.42 | NO |
| 39 | DIS3 | DIS3 | DIS3 | 8437 | 0.011 | 0.4 | NO |
| 40 | ENO2 | ENO2 | ENO2 | 8685 | 0.0073 | 0.39 | NO |
| 41 | HSPD1 | HSPD1 | HSPD1 | 8688 | 0.0072 | 0.4 | NO |
| 42 | PAPOLA | PAPOLA | PAPOLA | 8940 | 0.0041 | 0.38 | NO |
| 43 | LSM1 | LSM1 | LSM1 | 8998 | 0.0034 | 0.38 | NO |
| 44 | ENO1 | ENO1 | ENO1 | 9211 | 0.00073 | 0.37 | NO |
| 45 | PNPT1 | PNPT1 | PNPT1 | 9231 | 0.00051 | 0.37 | NO |
| 46 | TTC37 | TTC37 | TTC37 | 9285 | -0.00022 | 0.37 | NO |
| 47 | SKIV2L | SKIV2L | SKIV2L | 9504 | -0.0029 | 0.36 | NO |
| 48 | NAA38 | NAA38 | NAA38 | 9569 | -0.0037 | 0.35 | NO |
| 49 | CNOT2 | CNOT2 | CNOT2 | 9754 | -0.0058 | 0.35 | NO |
| 50 | DCP1B | DCP1B | DCP1B | 9937 | -0.0084 | 0.34 | NO |
| 51 | LSM5 | LSM5 | LSM5 | 10307 | -0.013 | 0.32 | NO |
| 52 | CNOT4 | CNOT4 | CNOT4 | 11447 | -0.028 | 0.27 | NO |
| 53 | HSPA9 | HSPA9 | HSPA9 | 11896 | -0.035 | 0.26 | NO |
| 54 | PARN | PARN | PARN | 12502 | -0.044 | 0.25 | NO |
| 55 | LSM6 | LSM6 | LSM6 | 12604 | -0.046 | 0.26 | NO |
| 56 | WDR61 | WDR61 | WDR61 | 12690 | -0.048 | 0.28 | NO |
| 57 | C1D | C1D | C1D | 13367 | -0.061 | 0.27 | NO |
Figure S3. Get High-res Image This plot shows mRNAseq_cNMF expression data heatmap (on the left) a RunningEnrichmentScore(RES) plot (on the top right) and a Signal2Noise(S2N) plot (on the bottom right) of genes in the pathway: KEGG CELL CYCLE.
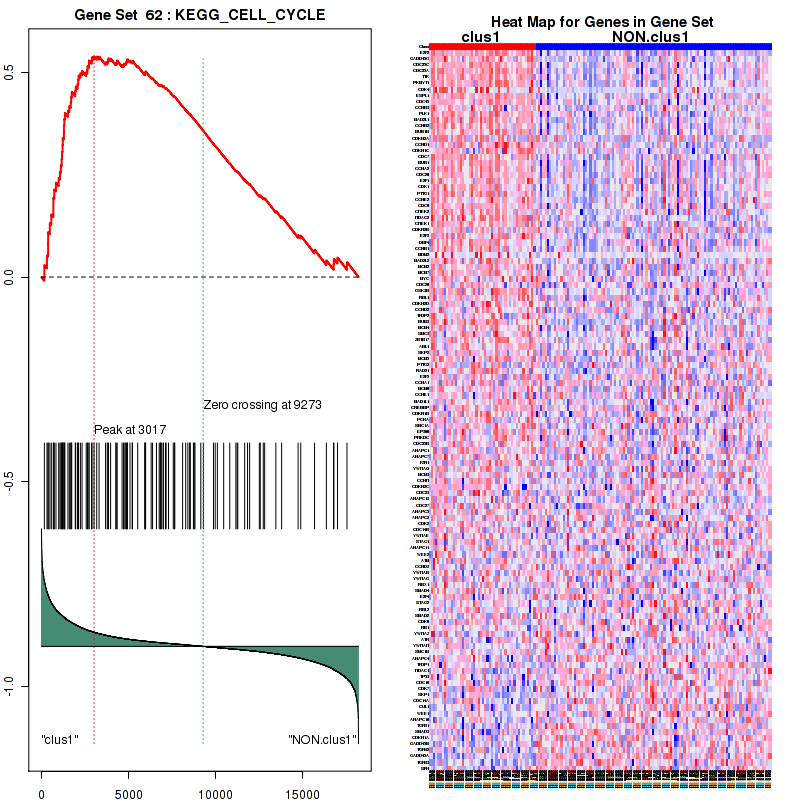
Figure S4. Get High-res Image For the top 5 core enriched genes in the pathway: KEGG CELL CYCLE, this volcano plot shows how much they are up/down-regulated and significant. The significance was calculated by empirical bayesian fit
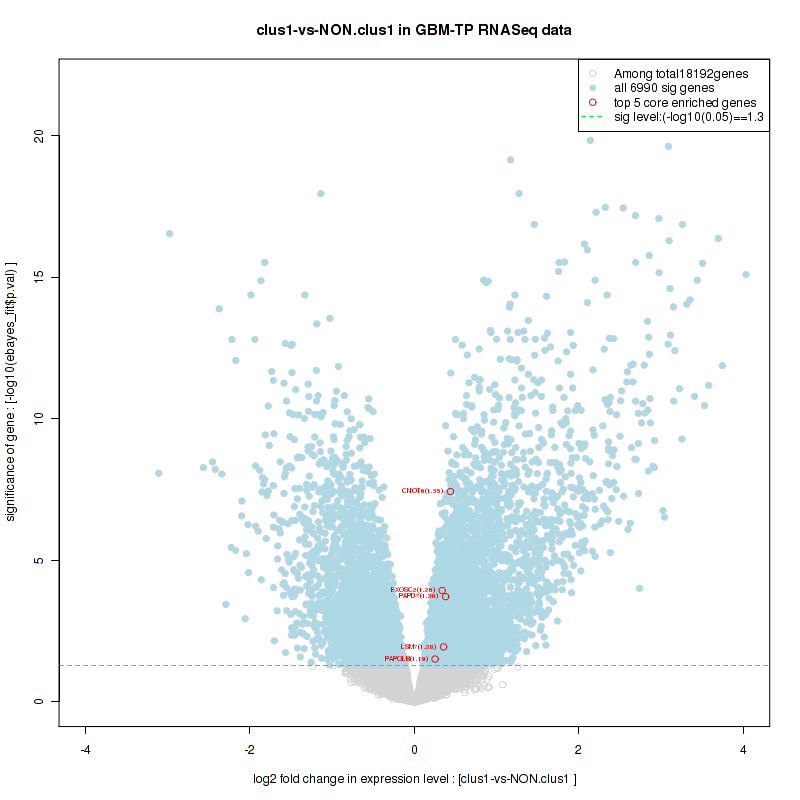
Table S3. Get Full Table This table shows a Running Enrichment Score (RES) of each gene in this pathway, that is, the enrichment score at this point in the ranked list of genes. All genes are ranked by Signal-to-Noise (S2N), a measure of similarity as default and are used to obtain ES matrix of all genes. In this way, GSEA tool uses expression pattern of not only overlapped genes but also not-overlapped genes to produce ES matrix.
| Rank | GENE | SYMBOL | DESC | LIST.LOC | S2N | RES | CORE_ENRICHMENT |
|---|---|---|---|---|---|---|---|
| 1 | E2F2 | E2F2 | E2F2 | 166 | 0.55 | 0.15 | YES |
| 2 | CDK4 | CDK4 | CDK4 | 683 | 0.34 | 0.22 | YES |
| 3 | PPP2R3B | PPP2R3B | PPP2R3B | 1073 | 0.27 | 0.27 | YES |
| 4 | CDKN2A | CDKN2A | CDKN2A | 1179 | 0.26 | 0.34 | YES |
| 5 | CCND1 | CCND1 | CCND1 | 1210 | 0.25 | 0.41 | YES |
| 6 | E2F1 | E2F1 | E2F1 | 1521 | 0.22 | 0.46 | YES |
| 7 | CDKN2B | CDKN2B | CDKN2B | 2110 | 0.17 | 0.48 | YES |
| 8 | E2F3 | E2F3 | E2F3 | 2128 | 0.17 | 0.52 | YES |
| 9 | RBL1 | RBL1 | RBL1 | 3017 | 0.12 | 0.51 | YES |
| 10 | CDKN2D | CDKN2D | CDKN2D | 3170 | 0.11 | 0.53 | YES |
| 11 | CCND2 | CCND2 | CCND2 | 3306 | 0.11 | 0.56 | YES |
| 12 | PPP2R2A | PPP2R2A | PPP2R2A | 3503 | 0.1 | 0.57 | YES |
| 13 | CKS1B | CKS1B | CKS1B | 3555 | 0.098 | 0.6 | YES |
| 14 | SKP2 | SKP2 | SKP2 | 4324 | 0.075 | 0.58 | NO |
| 15 | E2F5 | E2F5 | E2F5 | 4735 | 0.065 | 0.57 | NO |
| 16 | CDKN1B | CDKN1B | CDKN1B | 5078 | 0.058 | 0.57 | NO |
| 17 | CCNH | CCNH | CCNH | 6757 | 0.032 | 0.49 | NO |
| 18 | CDKN2C | CDKN2C | CDKN2C | 6817 | 0.031 | 0.49 | NO |
| 19 | PPP2R1A | PPP2R1A | PPP2R1A | 7103 | 0.028 | 0.49 | NO |
| 20 | PPP2R1B | PPP2R1B | PPP2R1B | 7139 | 0.027 | 0.49 | NO |
| 21 | PPP2CA | PPP2CA | PPP2CA | 8148 | 0.015 | 0.44 | NO |
| 22 | CCND3 | CCND3 | CCND3 | 8398 | 0.011 | 0.43 | NO |
| 23 | E2F4 | E2F4 | E2F4 | 8769 | 0.0062 | 0.41 | NO |
| 24 | RBL2 | RBL2 | RBL2 | 9141 | 0.0015 | 0.39 | NO |
| 25 | MNAT1 | MNAT1 | MNAT1 | 9747 | -0.0057 | 0.36 | NO |
| 26 | CDK6 | CDK6 | CDK6 | 9867 | -0.0073 | 0.36 | NO |
| 27 | RB1 | RB1 | RB1 | 9968 | -0.0088 | 0.35 | NO |
| 28 | UBA52 | UBA52 | UBA52 | 10240 | -0.012 | 0.34 | NO |
| 29 | PPP2CB | PPP2CB | PPP2CB | 10382 | -0.014 | 0.34 | NO |
| 30 | RPS27A | RPS27A | RPS27A | 11126 | -0.024 | 0.3 | NO |
| 31 | TFDP1 | TFDP1 | TFDP1 | 11264 | -0.026 | 0.3 | NO |
| 32 | CDK7 | CDK7 | CDK7 | 12501 | -0.044 | 0.25 | NO |
| 33 | SKP1 | SKP1 | SKP1 | 12556 | -0.045 | 0.26 | NO |
| 34 | CUL1 | CUL1 | CUL1 | 12808 | -0.05 | 0.26 | NO |
| 35 | CDKN1A | CDKN1A | CDKN1A | 15669 | -0.13 | 0.14 | NO |
Figure S5. Get High-res Image This plot shows mRNAseq_cNMF expression data heatmap (on the left) a RunningEnrichmentScore(RES) plot (on the top right) and a Signal2Noise(S2N) plot (on the bottom right) of genes in the pathway: KEGG PROGESTERONE MEDIATED OOCYTE MATURATION.
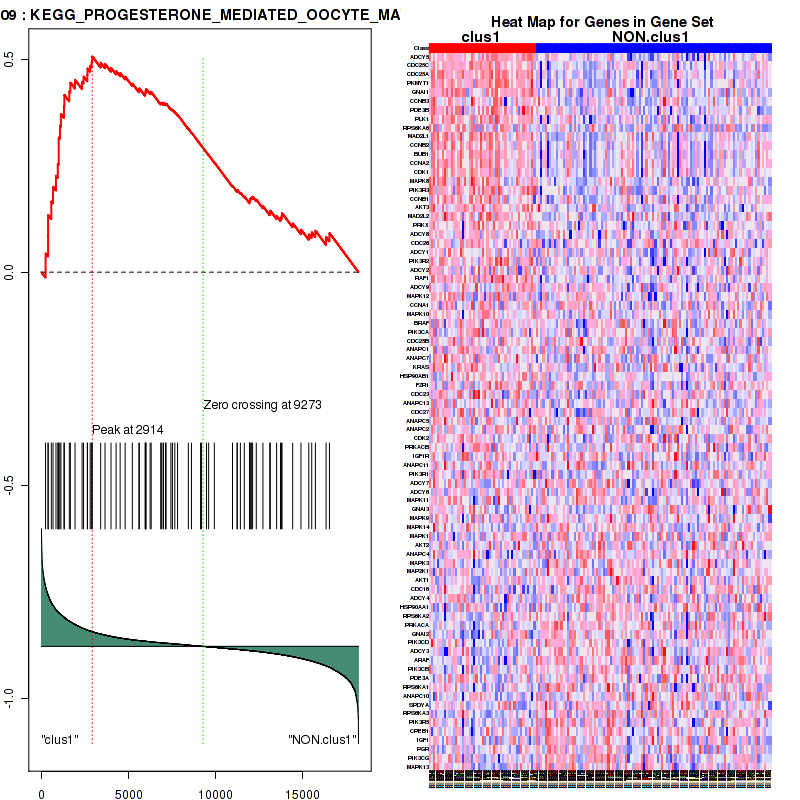
Figure S6. Get High-res Image For the top 5 core enriched genes in the pathway: KEGG PROGESTERONE MEDIATED OOCYTE MATURATION, this volcano plot shows how much they are up/down-regulated and significant. The significance was calculated by empirical bayesian fit
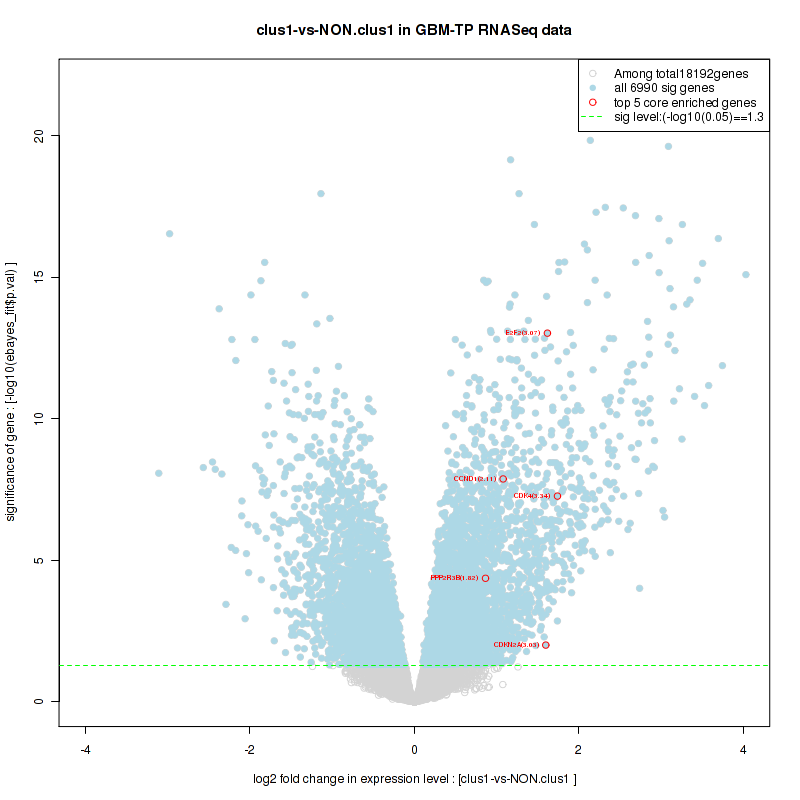
Table S4. Get Full Table This table shows a Running Enrichment Score (RES) of each gene in this pathway, that is, the enrichment score at this point in the ranked list of genes. All genes are ranked by Signal-to-Noise (S2N), a measure of similarity as default and are used to obtain ES matrix of all genes. In this way, GSEA tool uses expression pattern of not only overlapped genes but also not-overlapped genes to produce ES matrix.
| Rank | GENE | SYMBOL | DESC | LIST.LOC | S2N | RES | CORE_ENRICHMENT |
|---|---|---|---|---|---|---|---|
| 1 | CDC25C | CDC25C | CDC25C | 381 | 0.43 | 0.078 | YES |
| 2 | CDC25A | CDC25A | CDC25A | 383 | 0.43 | 0.18 | YES |
| 3 | CLSPN | CLSPN | CLSPN | 554 | 0.37 | 0.25 | YES |
| 4 | PLK1 | PLK1 | PLK1 | 988 | 0.28 | 0.29 | YES |
| 5 | RAD51 | RAD51 | RAD51 | 1072 | 0.27 | 0.35 | YES |
| 6 | FANCD2 | FANCD2 | FANCD2 | 1186 | 0.26 | 0.4 | YES |
| 7 | CCNA2 | CCNA2 | CCNA2 | 1313 | 0.24 | 0.45 | YES |
| 8 | BRCA2 | BRCA2 | BRCA2 | 1337 | 0.24 | 0.51 | YES |
| 9 | CDC6 | CDC6 | CDC6 | 1737 | 0.2 | 0.53 | YES |
| 10 | CHEK1 | CHEK1 | CHEK1 | 2070 | 0.17 | 0.55 | YES |
| 11 | RFC3 | RFC3 | RFC3 | 2112 | 0.17 | 0.59 | YES |
| 12 | MDM2 | MDM2 | MDM2 | 2567 | 0.14 | 0.6 | YES |
| 13 | MCM2 | MCM2 | MCM2 | 2642 | 0.14 | 0.62 | YES |
| 14 | MCM7 | MCM7 | MCM7 | 2726 | 0.13 | 0.65 | YES |
| 15 | TIMELESS | TIMELESS | TIMELESS | 2925 | 0.12 | 0.66 | YES |
| 16 | RFC4 | RFC4 | RFC4 | 3053 | 0.12 | 0.68 | YES |
| 17 | TOPBP1 | TOPBP1 | TOPBP1 | 3244 | 0.11 | 0.7 | YES |
| 18 | RFC5 | RFC5 | RFC5 | 3996 | 0.083 | 0.68 | NO |
| 19 | RAD1 | RAD1 | RAD1 | 4744 | 0.065 | 0.65 | NO |
| 20 | ATRIP | ATRIP | ATRIP | 4957 | 0.06 | 0.65 | NO |
| 21 | FBXW11 | FBXW11 | FBXW11 | 6171 | 0.04 | 0.6 | NO |
| 22 | PPP2R1A | PPP2R1A | PPP2R1A | 7103 | 0.028 | 0.55 | NO |
| 23 | CDK2 | CDK2 | CDK2 | 7151 | 0.027 | 0.55 | NO |
| 24 | RAD9A | RAD9A | RAD9A | 7625 | 0.021 | 0.53 | NO |
| 25 | PPP2CA | PPP2CA | PPP2CA | 8148 | 0.015 | 0.51 | NO |
| 26 | YWHAB | YWHAB | YWHAB | 8514 | 0.0096 | 0.49 | NO |
| 27 | CEP164 | CEP164 | CEP164 | 8868 | 0.0049 | 0.47 | NO |
| 28 | PPP2R2B | PPP2R2B | PPP2R2B | 8884 | 0.0048 | 0.47 | NO |
| 29 | RAD17 | RAD17 | RAD17 | 9216 | 0.00066 | 0.45 | NO |
| 30 | RPA1 | RPA1 | RPA1 | 9256 | 0.00022 | 0.45 | NO |
| 31 | SSPO | SSPO | SSPO | 9862 | -0.0072 | 0.42 | NO |
| 32 | RPA2 | RPA2 | RPA2 | 10018 | -0.0096 | 0.41 | NO |
| 33 | YWHAZ | YWHAZ | YWHAZ | 10093 | -0.01 | 0.41 | NO |
| 34 | SMARCAL1 | SMARCAL1 | SMARCAL1 | 10195 | -0.012 | 0.41 | NO |
| 35 | RFC2 | RFC2 | RFC2 | 10352 | -0.014 | 0.4 | NO |
| 36 | ATR | ATR | ATR | 10455 | -0.015 | 0.4 | NO |
| 37 | NBN | NBN | NBN | 10567 | -0.017 | 0.4 | NO |
| 38 | TIPIN | TIPIN | TIPIN | 11758 | -0.033 | 0.34 | NO |
| 39 | HUS1 | HUS1 | HUS1 | 13406 | -0.062 | 0.26 | NO |
Figure S7. Get High-res Image This plot shows mRNAseq_cNMF expression data heatmap (on the left) a RunningEnrichmentScore(RES) plot (on the top right) and a Signal2Noise(S2N) plot (on the bottom right) of genes in the pathway: PID ATR PATHWAY.
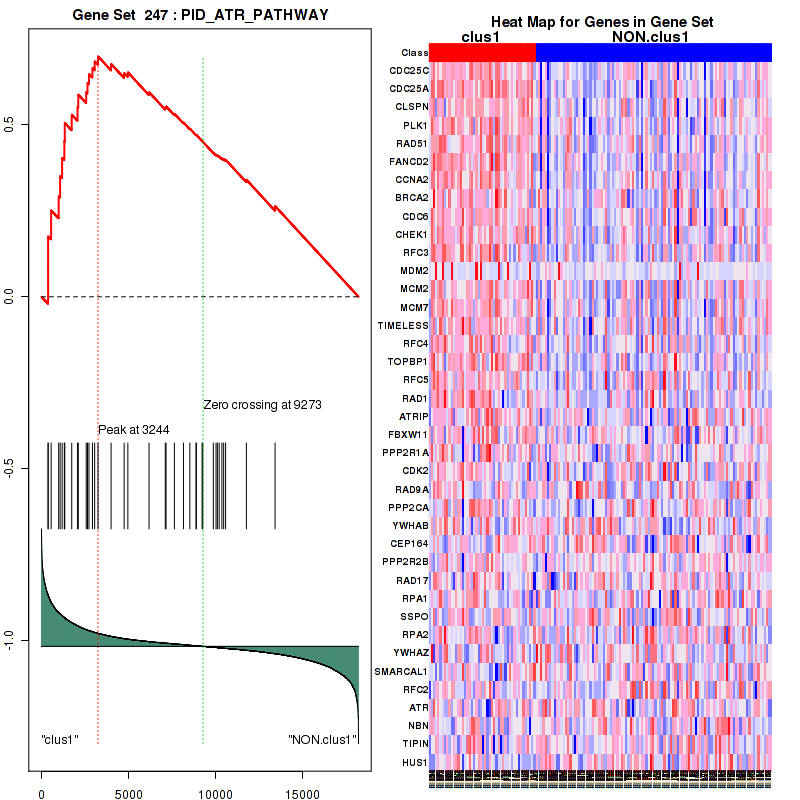
Figure S8. Get High-res Image For the top 5 core enriched genes in the pathway: PID ATR PATHWAY, this volcano plot shows how much they are up/down-regulated and significant. The significance was calculated by empirical bayesian fit
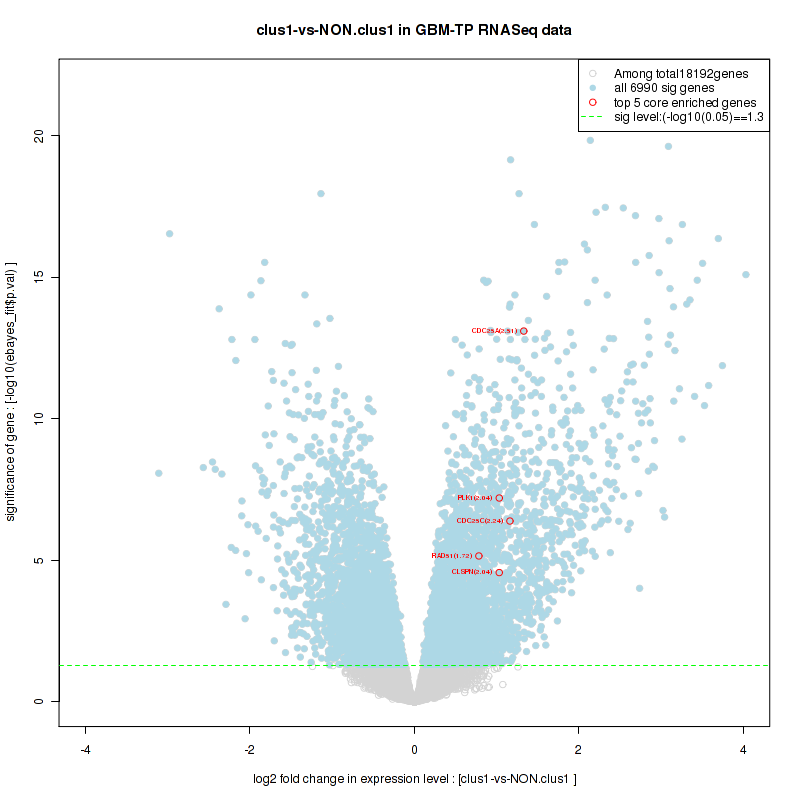
Table S5. Get Full Table This table shows a Running Enrichment Score (RES) of each gene in this pathway, that is, the enrichment score at this point in the ranked list of genes. All genes are ranked by Signal-to-Noise (S2N), a measure of similarity as default and are used to obtain ES matrix of all genes. In this way, GSEA tool uses expression pattern of not only overlapped genes but also not-overlapped genes to produce ES matrix.
| Rank | GENE | SYMBOL | DESC | LIST.LOC | S2N | RES | CORE_ENRICHMENT |
|---|---|---|---|---|---|---|---|
| 1 | POLR2F | POLR2F | POLR2F | 2938 | 0.12 | -0.14 | YES |
| 2 | NUP107 | NUP107 | NUP107 | 3390 | 0.1 | -0.14 | YES |
| 3 | NUP188 | NUP188 | NUP188 | 3582 | 0.098 | -0.13 | YES |
| 4 | HNRNPA0 | HNRNPA0 | HNRNPA0 | 3694 | 0.093 | -0.12 | YES |
| 5 | NUP93 | NUP93 | NUP93 | 3699 | 0.093 | -0.1 | YES |
| 6 | NUP35 | NUP35 | NUP35 | 3707 | 0.093 | -0.082 | YES |
| 7 | NUP88 | NUP88 | NUP88 | 3743 | 0.092 | -0.065 | YES |
| 8 | YBX1 | YBX1 | YBX1 | 3809 | 0.089 | -0.05 | YES |
| 9 | POLR2D | POLR2D | POLR2D | 3869 | 0.087 | -0.036 | YES |
| 10 | RBMX | RBMX | RBMX | 3971 | 0.084 | -0.024 | YES |
| 11 | NUP155 | NUP155 | NUP155 | 4191 | 0.078 | -0.02 | YES |
| 12 | HNRNPD | HNRNPD | HNRNPD | 4204 | 0.078 | -0.0047 | YES |
| 13 | HNRNPA3 | HNRNPA3 | HNRNPA3 | 4305 | 0.075 | 0.0052 | YES |
| 14 | NUP50 | NUP50 | NUP50 | 4412 | 0.072 | 0.014 | YES |
| 15 | AAAS | AAAS | AAAS | 4416 | 0.072 | 0.029 | YES |
| 16 | HNRNPA1 | HNRNPA1 | HNRNPA1 | 4467 | 0.071 | 0.04 | YES |
| 17 | THOC4 | THOC4 | THOC4 | 4471 | 0.071 | 0.055 | YES |
| 18 | SF3A2 | SF3A2 | SF3A2 | 4525 | 0.07 | 0.066 | YES |
| 19 | NCBP1 | NCBP1 | NCBP1 | 4599 | 0.068 | 0.076 | YES |
| 20 | SF3B3 | SF3B3 | SF3B3 | 4649 | 0.067 | 0.087 | YES |
| 21 | FUS | FUS | FUS | 4665 | 0.066 | 0.1 | YES |
| 22 | RNPS1 | RNPS1 | RNPS1 | 4707 | 0.066 | 0.11 | YES |
| 23 | SNRPA | SNRPA | SNRPA | 4819 | 0.063 | 0.12 | YES |
| 24 | NUPL2 | NUPL2 | NUPL2 | 4901 | 0.062 | 0.13 | YES |
| 25 | HNRNPM | HNRNPM | HNRNPM | 4909 | 0.061 | 0.14 | YES |
| 26 | CDC40 | CDC40 | CDC40 | 4975 | 0.06 | 0.15 | YES |
| 27 | POLR2B | POLR2B | POLR2B | 5029 | 0.059 | 0.16 | YES |
| 28 | NFX1 | NFX1 | NFX1 | 5043 | 0.059 | 0.17 | YES |
| 29 | HNRNPR | HNRNPR | HNRNPR | 5056 | 0.058 | 0.18 | YES |
| 30 | CPSF1 | CPSF1 | CPSF1 | 5060 | 0.058 | 0.19 | YES |
| 31 | SMC1A | SMC1A | SMC1A | 5224 | 0.055 | 0.19 | YES |
| 32 | HNRNPH1 | HNRNPH1 | HNRNPH1 | 5283 | 0.054 | 0.2 | YES |
| 33 | PRPF8 | PRPF8 | PRPF8 | 5347 | 0.053 | 0.21 | YES |
| 34 | SNRPD1 | SNRPD1 | SNRPD1 | 5386 | 0.053 | 0.22 | YES |
| 35 | POLR2A | POLR2A | POLR2A | 5442 | 0.052 | 0.22 | YES |
| 36 | SNRPF | SNRPF | SNRPF | 5544 | 0.05 | 0.23 | YES |
| 37 | NUP43 | NUP43 | NUP43 | 5611 | 0.049 | 0.24 | YES |
| 38 | HNRNPL | HNRNPL | HNRNPL | 5635 | 0.048 | 0.24 | YES |
| 39 | DHX38 | DHX38 | DHX38 | 5672 | 0.048 | 0.25 | YES |
| 40 | DHX9 | DHX9 | DHX9 | 5691 | 0.047 | 0.26 | YES |
| 41 | CPSF3 | CPSF3 | CPSF3 | 5744 | 0.046 | 0.27 | YES |
| 42 | CSTF3 | CSTF3 | CSTF3 | 5747 | 0.046 | 0.28 | YES |
| 43 | SNRPA1 | SNRPA1 | SNRPA1 | 5763 | 0.046 | 0.28 | YES |
| 44 | HNRNPUL1 | HNRNPUL1 | HNRNPUL1 | 5799 | 0.046 | 0.29 | YES |
| 45 | SNRPB | SNRPB | SNRPB | 5818 | 0.045 | 0.3 | YES |
| 46 | NUPL1 | NUPL1 | NUPL1 | 5908 | 0.044 | 0.3 | YES |
| 47 | RBM8A | RBM8A | RBM8A | 5930 | 0.044 | 0.31 | YES |
| 48 | CCAR1 | CCAR1 | CCAR1 | 5994 | 0.043 | 0.32 | YES |
| 49 | RBM5 | RBM5 | RBM5 | 6051 | 0.042 | 0.32 | YES |
| 50 | SNRNP200 | SNRNP200 | SNRNP200 | 6099 | 0.041 | 0.33 | YES |
| 51 | NUDT21 | NUDT21 | NUDT21 | 6122 | 0.041 | 0.34 | YES |
| 52 | SNRPD3 | SNRPD3 | SNRPD3 | 6145 | 0.04 | 0.34 | YES |
| 53 | CPSF7 | CPSF7 | CPSF7 | 6160 | 0.04 | 0.35 | YES |
| 54 | NUP214 | NUP214 | NUP214 | 6201 | 0.04 | 0.36 | YES |
| 55 | LSM2 | LSM2 | LSM2 | 6317 | 0.037 | 0.36 | YES |
| 56 | PABPN1 | PABPN1 | PABPN1 | 6420 | 0.036 | 0.36 | YES |
| 57 | SNRNP40 | SNRNP40 | SNRNP40 | 6505 | 0.035 | 0.36 | YES |
| 58 | CSTF2 | CSTF2 | CSTF2 | 6537 | 0.034 | 0.37 | YES |
| 59 | NUP62 | NUP62 | NUP62 | 6541 | 0.034 | 0.37 | YES |
| 60 | CLP1 | CLP1 | CLP1 | 6629 | 0.033 | 0.38 | YES |
| 61 | SNRPB2 | SNRPB2 | SNRPB2 | 6666 | 0.033 | 0.38 | YES |
| 62 | PRPF4 | PRPF4 | PRPF4 | 6747 | 0.032 | 0.38 | YES |
| 63 | PRPF6 | PRPF6 | PRPF6 | 6793 | 0.031 | 0.39 | YES |
| 64 | RAE1 | RAE1 | RAE1 | 6892 | 0.03 | 0.39 | YES |
| 65 | PHF5A | PHF5A | PHF5A | 6914 | 0.03 | 0.39 | YES |
| 66 | NUP153 | NUP153 | NUP153 | 7044 | 0.028 | 0.39 | YES |
| 67 | SF3B5 | SF3B5 | SF3B5 | 7064 | 0.028 | 0.4 | YES |
| 68 | SF3B2 | SF3B2 | SF3B2 | 7087 | 0.028 | 0.4 | YES |
| 69 | EFTUD2 | EFTUD2 | EFTUD2 | 7133 | 0.027 | 0.4 | YES |
| 70 | U2AF1 | U2AF1 | U2AF1 | 7260 | 0.026 | 0.4 | YES |
| 71 | HNRNPU | HNRNPU | HNRNPU | 7268 | 0.026 | 0.41 | YES |
| 72 | SNRPE | SNRPE | SNRPE | 7283 | 0.025 | 0.41 | YES |
| 73 | SF3B4 | SF3B4 | SF3B4 | 7309 | 0.025 | 0.41 | YES |
| 74 | SF3A1 | SF3A1 | SF3A1 | 7357 | 0.024 | 0.42 | YES |
| 75 | POLR2E | POLR2E | POLR2E | 7367 | 0.024 | 0.42 | YES |
| 76 | HNRNPK | HNRNPK | HNRNPK | 7372 | 0.024 | 0.42 | YES |
| 77 | CD2BP2 | CD2BP2 | CD2BP2 | 7521 | 0.022 | 0.42 | YES |
| 78 | NHP2L1 | NHP2L1 | NHP2L1 | 7590 | 0.021 | 0.42 | YES |
| 79 | NUP205 | NUP205 | NUP205 | 7660 | 0.02 | 0.42 | YES |
| 80 | GTF2F2 | GTF2F2 | GTF2F2 | 7684 | 0.02 | 0.42 | YES |
| 81 | HNRNPA2B1 | HNRNPA2B1 | HNRNPA2B1 | 7699 | 0.02 | 0.43 | YES |
| 82 | PTBP1 | PTBP1 | PTBP1 | 7825 | 0.018 | 0.43 | YES |
| 83 | U2AF2 | U2AF2 | U2AF2 | 7829 | 0.018 | 0.43 | YES |
| 84 | TXNL4A | TXNL4A | TXNL4A | 7830 | 0.018 | 0.43 | YES |
| 85 | PCF11 | PCF11 | PCF11 | 8043 | 0.016 | 0.42 | YES |
| 86 | SNRPG | SNRPG | SNRPG | 8084 | 0.015 | 0.42 | YES |
| 87 | NUP85 | NUP85 | NUP85 | 8109 | 0.015 | 0.43 | YES |
| 88 | NXF1 | NXF1 | NXF1 | 8112 | 0.015 | 0.43 | YES |
| 89 | SF3B14 | SF3B14 | SF3B14 | 8121 | 0.015 | 0.43 | YES |
| 90 | NUP133 | NUP133 | NUP133 | 8173 | 0.014 | 0.43 | YES |
| 91 | PCBP2 | PCBP2 | PCBP2 | 8221 | 0.014 | 0.43 | YES |
| 92 | SF3B1 | SF3B1 | SF3B1 | 8236 | 0.014 | 0.44 | YES |
| 93 | POM121 | POM121 | POM121 | 8360 | 0.012 | 0.43 | NO |
| 94 | UPF3B | UPF3B | UPF3B | 8509 | 0.0096 | 0.42 | NO |
| 95 | HNRNPC | HNRNPC | HNRNPC | 8558 | 0.0089 | 0.42 | NO |
| 96 | METTL3 | METTL3 | METTL3 | 8595 | 0.0085 | 0.42 | NO |
| 97 | CSTF1 | CSTF1 | CSTF1 | 8640 | 0.0079 | 0.42 | NO |
| 98 | NCBP2 | NCBP2 | NCBP2 | 8686 | 0.0073 | 0.42 | NO |
| 99 | SNRNP70 | SNRNP70 | SNRNP70 | 8751 | 0.0064 | 0.42 | NO |
| 100 | SF3A3 | SF3A3 | SF3A3 | 8754 | 0.0064 | 0.42 | NO |
| 101 | PAPOLA | PAPOLA | PAPOLA | 8940 | 0.0041 | 0.41 | NO |
| 102 | TPR | TPR | TPR | 9247 | 0.00035 | 0.39 | NO |
| 103 | POLR2C | POLR2C | POLR2C | 9350 | -0.001 | 0.39 | NO |
| 104 | PCBP1 | PCBP1 | PCBP1 | 9369 | -0.0013 | 0.39 | NO |
| 105 | DNAJC8 | DNAJC8 | DNAJC8 | 9380 | -0.0014 | 0.39 | NO |
| 106 | POLR2K | POLR2K | POLR2K | 9494 | -0.0028 | 0.38 | NO |
| 107 | POLR2H | POLR2H | POLR2H | 9634 | -0.0044 | 0.38 | NO |
| 108 | DDX23 | DDX23 | DDX23 | 9649 | -0.0045 | 0.38 | NO |
| 109 | POLR2G | POLR2G | POLR2G | 9823 | -0.0067 | 0.37 | NO |
| 110 | SRRM1 | SRRM1 | SRRM1 | 9857 | -0.0072 | 0.37 | NO |
| 111 | GTF2F1 | GTF2F1 | GTF2F1 | 9865 | -0.0073 | 0.37 | NO |
| 112 | EIF4E | EIF4E | EIF4E | 9883 | -0.0075 | 0.37 | NO |
| 113 | NUP54 | NUP54 | NUP54 | 10003 | -0.0093 | 0.36 | NO |
| 114 | SEH1L | SEH1L | SEH1L | 10071 | -0.01 | 0.36 | NO |
| 115 | HNRNPH2 | HNRNPH2 | HNRNPH2 | 10463 | -0.015 | 0.34 | NO |
| 116 | RANBP2 | RANBP2 | RANBP2 | 10508 | -0.016 | 0.34 | NO |
| 117 | HNRNPF | HNRNPF | HNRNPF | 10593 | -0.017 | 0.34 | NO |
| 118 | SLBP | SLBP | SLBP | 10816 | -0.02 | 0.34 | NO |
| 119 | MAGOH | MAGOH | MAGOH | 11015 | -0.023 | 0.33 | NO |
| 120 | SNRPD2 | SNRPD2 | SNRPD2 | 11189 | -0.025 | 0.32 | NO |
| 121 | NUP210 | NUP210 | NUP210 | 11384 | -0.027 | 0.32 | NO |
| 122 | POLR2I | POLR2I | POLR2I | 11694 | -0.032 | 0.31 | NO |
| 123 | POLR2J | POLR2J | POLR2J | 11746 | -0.033 | 0.31 | NO |
| 124 | CPSF2 | CPSF2 | CPSF2 | 11974 | -0.036 | 0.31 | NO |
| 125 | NUP37 | NUP37 | NUP37 | 13141 | -0.056 | 0.25 | NO |
| 126 | POLR2L | POLR2L | POLR2L | 15488 | -0.12 | 0.15 | NO |
Figure S9. Get High-res Image This plot shows mRNAseq_cNMF expression data heatmap (on the left) a RunningEnrichmentScore(RES) plot (on the top right) and a Signal2Noise(S2N) plot (on the bottom right) of genes in the pathway: PID RET PATHWAY.
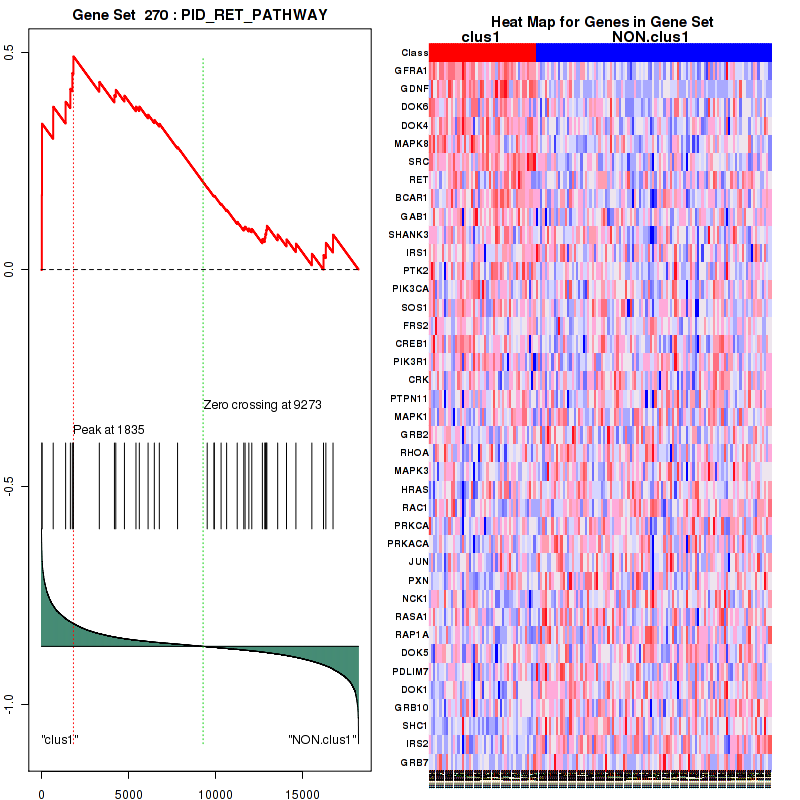
Figure S10. Get High-res Image For the top 5 core enriched genes in the pathway: PID RET PATHWAY, this volcano plot shows how much they are up/down-regulated and significant. The significance was calculated by empirical bayesian fit
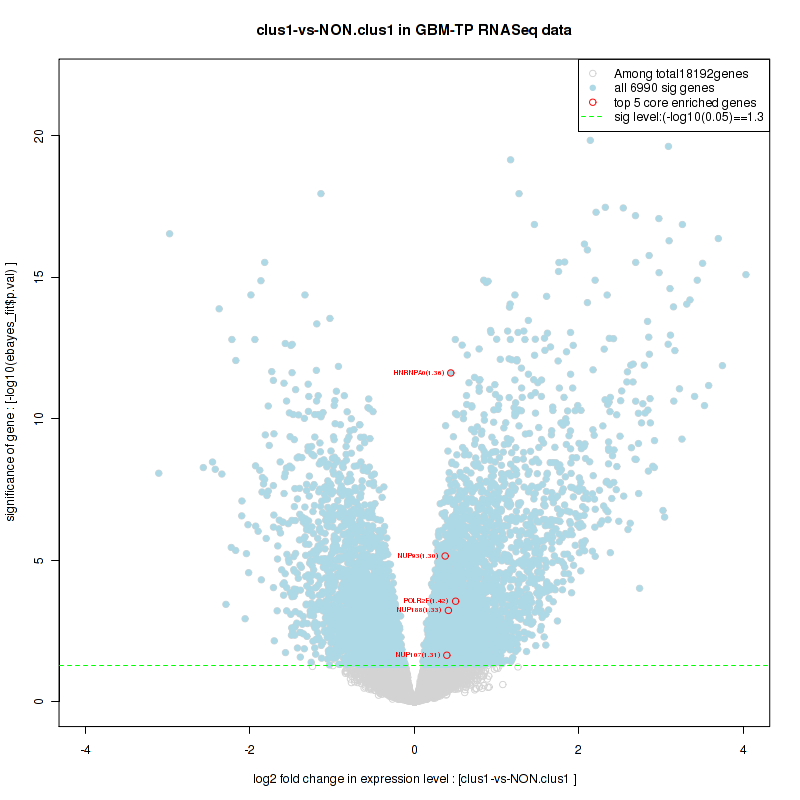
Table S6. Get Full Table This table shows a Running Enrichment Score (RES) of each gene in this pathway, that is, the enrichment score at this point in the ranked list of genes. All genes are ranked by Signal-to-Noise (S2N), a measure of similarity as default and are used to obtain ES matrix of all genes. In this way, GSEA tool uses expression pattern of not only overlapped genes but also not-overlapped genes to produce ES matrix.
| Rank | GENE | SYMBOL | DESC | LIST.LOC | S2N | RES | CORE_ENRICHMENT |
|---|---|---|---|---|---|---|---|
| 1 | GFRA1 | GFRA1 | GFRA1 | 22 | 0.8 | 0.17 | YES |
| 2 | GDNF | GDNF | GDNF | 31 | 0.75 | 0.34 | YES |
| 3 | DOK6 | DOK6 | DOK6 | 674 | 0.34 | 0.38 | YES |
| 4 | DOK4 | DOK4 | DOK4 | 1385 | 0.23 | 0.39 | YES |
| 5 | MAPK8 | MAPK8 | MAPK8 | 1658 | 0.21 | 0.42 | YES |
| 6 | SRC | SRC | SRC | 1772 | 0.2 | 0.45 | YES |
| 7 | RET | RET | RET | 1835 | 0.19 | 0.49 | YES |
| 8 | BCAR1 | BCAR1 | BCAR1 | 3319 | 0.11 | 0.43 | NO |
| 9 | GAB1 | GAB1 | GAB1 | 4186 | 0.078 | 0.4 | NO |
| 10 | SHANK3 | SHANK3 | SHANK3 | 4264 | 0.076 | 0.41 | NO |
| 11 | IRS1 | IRS1 | IRS1 | 4761 | 0.064 | 0.4 | NO |
| 12 | PTK2 | PTK2 | PTK2 | 5422 | 0.052 | 0.38 | NO |
| 13 | PIK3CA | PIK3CA | PIK3CA | 5616 | 0.049 | 0.38 | NO |
| 14 | SOS1 | SOS1 | SOS1 | 6118 | 0.041 | 0.36 | NO |
| 15 | FRS2 | FRS2 | FRS2 | 6477 | 0.035 | 0.34 | NO |
| 16 | CREB1 | CREB1 | CREB1 | 6764 | 0.032 | 0.34 | NO |
| 17 | PIK3R1 | PIK3R1 | PIK3R1 | 7809 | 0.019 | 0.28 | NO |
| 18 | CRK | CRK | CRK | 9511 | -0.003 | 0.19 | NO |
| 19 | PTPN11 | PTPN11 | PTPN11 | 9898 | -0.0078 | 0.17 | NO |
| 20 | MAPK1 | MAPK1 | MAPK1 | 9920 | -0.0081 | 0.17 | NO |
| 21 | GRB2 | GRB2 | GRB2 | 10308 | -0.013 | 0.15 | NO |
| 22 | RHOA | RHOA | RHOA | 10623 | -0.018 | 0.14 | NO |
| 23 | MAPK3 | MAPK3 | MAPK3 | 11233 | -0.025 | 0.11 | NO |
| 24 | HRAS | HRAS | HRAS | 11609 | -0.031 | 0.096 | NO |
| 25 | RAC1 | RAC1 | RAC1 | 11682 | -0.032 | 0.099 | NO |
| 26 | PRKCA | PRKCA | PRKCA | 11898 | -0.035 | 0.095 | NO |
| 27 | PRKACA | PRKACA | PRKACA | 12068 | -0.038 | 0.094 | NO |
| 28 | JUN | JUN | JUN | 12676 | -0.047 | 0.07 | NO |
| 29 | PXN | PXN | PXN | 12813 | -0.05 | 0.074 | NO |
| 30 | NCK1 | NCK1 | NCK1 | 12851 | -0.051 | 0.083 | NO |
| 31 | RASA1 | RASA1 | RASA1 | 12900 | -0.052 | 0.091 | NO |
| 32 | RAP1A | RAP1A | RAP1A | 12934 | -0.052 | 0.1 | NO |
| 33 | DOK5 | DOK5 | DOK5 | 13553 | -0.065 | 0.081 | NO |
| 34 | PDLIM7 | PDLIM7 | PDLIM7 | 14061 | -0.077 | 0.07 | NO |
| 35 | DOK1 | DOK1 | DOK1 | 14601 | -0.092 | 0.06 | NO |
| 36 | GRB10 | GRB10 | GRB10 | 15516 | -0.12 | 0.036 | NO |
| 37 | SHC1 | SHC1 | SHC1 | 16184 | -0.16 | 0.034 | NO |
| 38 | IRS2 | IRS2 | IRS2 | 16318 | -0.16 | 0.062 | NO |
| 39 | GRB7 | GRB7 | GRB7 | 16730 | -0.19 | 0.08 | NO |
Figure S11. Get High-res Image This plot shows mRNAseq_cNMF expression data heatmap (on the left) a RunningEnrichmentScore(RES) plot (on the top right) and a Signal2Noise(S2N) plot (on the bottom right) of genes in the pathway: PID ATM PATHWAY.
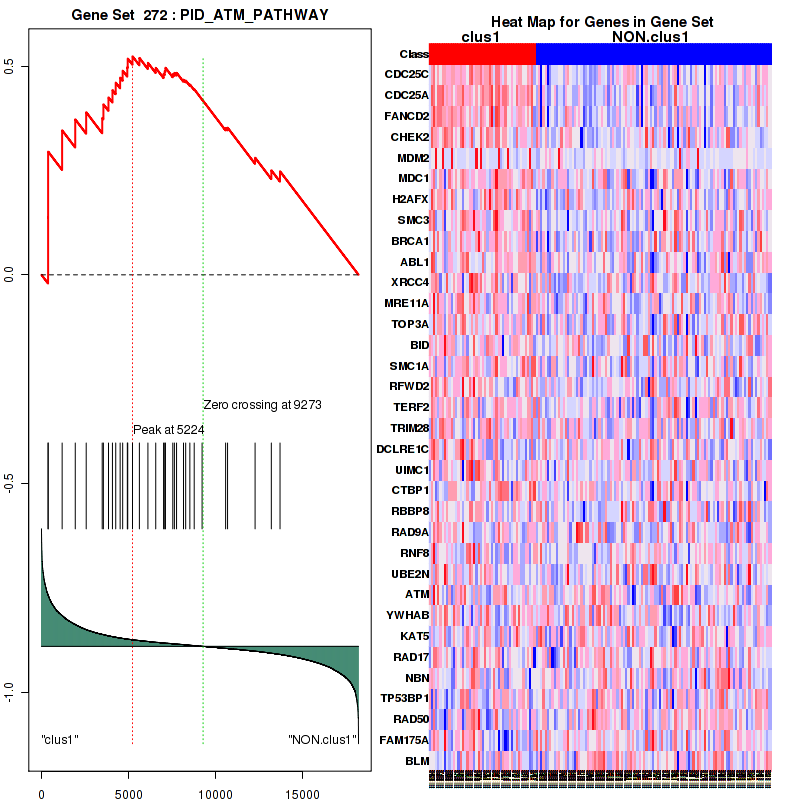
Figure S12. Get High-res Image For the top 5 core enriched genes in the pathway: PID ATM PATHWAY, this volcano plot shows how much they are up/down-regulated and significant. The significance was calculated by empirical bayesian fit
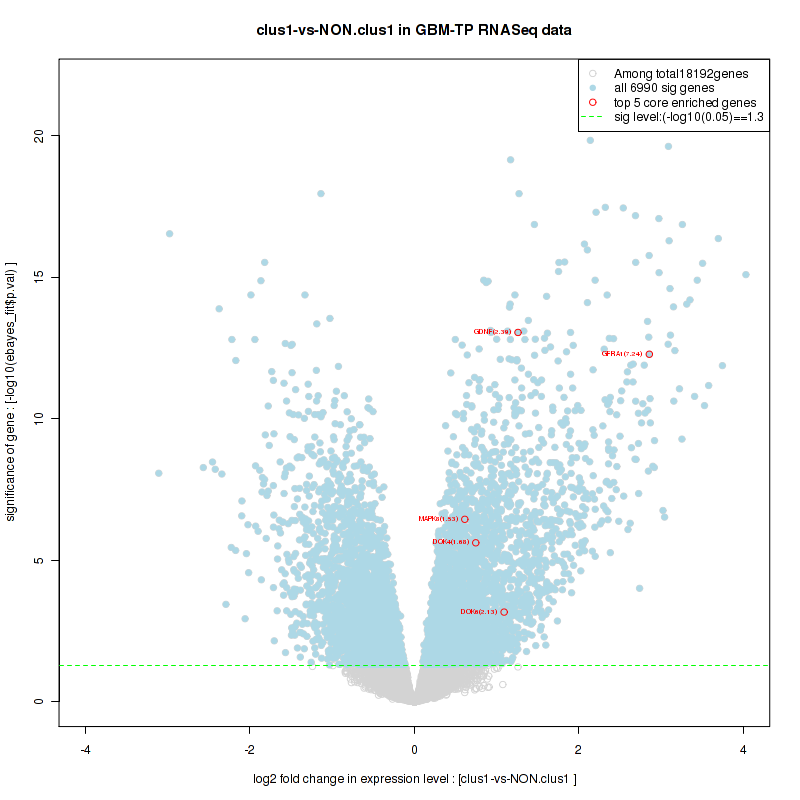
Table S7. Get Full Table This table shows a Running Enrichment Score (RES) of each gene in this pathway, that is, the enrichment score at this point in the ranked list of genes. All genes are ranked by Signal-to-Noise (S2N), a measure of similarity as default and are used to obtain ES matrix of all genes. In this way, GSEA tool uses expression pattern of not only overlapped genes but also not-overlapped genes to produce ES matrix.
| Rank | GENE | SYMBOL | DESC | LIST.LOC | S2N | RES | CORE_ENRICHMENT |
|---|---|---|---|---|---|---|---|
| 1 | CENPJ | CENPJ | CENPJ | 672 | 0.34 | 0.042 | YES |
| 2 | NEK2 | NEK2 | NEK2 | 804 | 0.31 | 0.11 | YES |
| 3 | PLK1 | PLK1 | PLK1 | 988 | 0.28 | 0.16 | YES |
| 4 | PLK4 | PLK4 | PLK4 | 1103 | 0.27 | 0.22 | YES |
| 5 | CEP135 | CEP135 | CEP135 | 1583 | 0.21 | 0.24 | YES |
| 6 | CDK1 | CDK1 | CDK1 | 1599 | 0.21 | 0.29 | YES |
| 7 | CEP72 | CEP72 | CEP72 | 1744 | 0.2 | 0.32 | YES |
| 8 | CSNK1E | CSNK1E | CSNK1E | 2086 | 0.17 | 0.35 | YES |
| 9 | AZI1 | AZI1 | AZI1 | 2430 | 0.15 | 0.36 | YES |
| 10 | DCTN2 | DCTN2 | DCTN2 | 2585 | 0.14 | 0.38 | YES |
| 11 | NINL | NINL | NINL | 2986 | 0.12 | 0.39 | YES |
| 12 | TUBB | TUBB | TUBB | 3674 | 0.094 | 0.37 | YES |
| 13 | DCTN3 | DCTN3 | DCTN3 | 3713 | 0.093 | 0.39 | YES |
| 14 | ACTR1A | ACTR1A | ACTR1A | 3714 | 0.093 | 0.41 | YES |
| 15 | TUBA1A | TUBA1A | TUBA1A | 3738 | 0.092 | 0.43 | YES |
| 16 | CEP57 | CEP57 | CEP57 | 3827 | 0.089 | 0.45 | YES |
| 17 | PRKAR2B | PRKAR2B | PRKAR2B | 4012 | 0.083 | 0.46 | YES |
| 18 | CEP63 | CEP63 | CEP63 | 4180 | 0.078 | 0.47 | YES |
| 19 | TUBG1 | TUBG1 | TUBG1 | 4370 | 0.073 | 0.47 | YES |
| 20 | CEP70 | CEP70 | CEP70 | 4628 | 0.067 | 0.48 | YES |
| 21 | ALMS1 | ALMS1 | ALMS1 | 5034 | 0.059 | 0.47 | NO |
| 22 | CKAP5 | CKAP5 | CKAP5 | 5376 | 0.053 | 0.46 | NO |
| 23 | MAPRE1 | MAPRE1 | MAPRE1 | 5500 | 0.05 | 0.46 | NO |
| 24 | CEP76 | CEP76 | CEP76 | 5810 | 0.045 | 0.46 | NO |
| 25 | CLASP1 | CLASP1 | CLASP1 | 5913 | 0.044 | 0.46 | NO |
| 26 | CDK5RAP2 | CDK5RAP2 | CDK5RAP2 | 6146 | 0.04 | 0.46 | NO |
| 27 | DCTN1 | DCTN1 | DCTN1 | 6543 | 0.034 | 0.44 | NO |
| 28 | CEP250 | CEP250 | CEP250 | 6601 | 0.034 | 0.45 | NO |
| 29 | PAFAH1B1 | PAFAH1B1 | PAFAH1B1 | 6705 | 0.032 | 0.45 | NO |
| 30 | PCNT | PCNT | PCNT | 6799 | 0.031 | 0.45 | NO |
| 31 | PPP2R1A | PPP2R1A | PPP2R1A | 7103 | 0.028 | 0.44 | NO |
| 32 | CEP192 | CEP192 | CEP192 | 7145 | 0.027 | 0.45 | NO |
| 33 | DYNC1I2 | DYNC1I2 | DYNC1I2 | 7275 | 0.025 | 0.44 | NO |
| 34 | CEP290 | CEP290 | CEP290 | 7398 | 0.024 | 0.44 | NO |
| 35 | YWHAE | YWHAE | YWHAE | 7564 | 0.022 | 0.44 | NO |
| 36 | SSNA1 | SSNA1 | SSNA1 | 8001 | 0.016 | 0.42 | NO |
| 37 | NEDD1 | NEDD1 | NEDD1 | 8230 | 0.014 | 0.41 | NO |
| 38 | DYNC1H1 | DYNC1H1 | DYNC1H1 | 8317 | 0.012 | 0.41 | NO |
| 39 | YWHAG | YWHAG | YWHAG | 8521 | 0.0094 | 0.4 | NO |
| 40 | CEP164 | CEP164 | CEP164 | 8868 | 0.0049 | 0.38 | NO |
| 41 | PCM1 | PCM1 | PCM1 | 8959 | 0.0039 | 0.38 | NO |
| 42 | DYNLL1 | DYNLL1 | DYNLL1 | 9371 | -0.0013 | 0.36 | NO |
| 43 | FGFR1OP | FGFR1OP | FGFR1OP | 9648 | -0.0045 | 0.34 | NO |
| 44 | AKAP9 | AKAP9 | AKAP9 | 9941 | -0.0084 | 0.33 | NO |
| 45 | CSNK1D | CSNK1D | CSNK1D | 10609 | -0.017 | 0.29 | NO |
| 46 | HSP90AA1 | HSP90AA1 | HSP90AA1 | 11967 | -0.036 | 0.23 | NO |
| 47 | PRKACA | PRKACA | PRKACA | 12068 | -0.038 | 0.23 | NO |
| 48 | HAUS2 | HAUS2 | HAUS2 | 12193 | -0.039 | 0.23 | NO |
| 49 | SDCCAG8 | SDCCAG8 | SDCCAG8 | 12351 | -0.042 | 0.23 | NO |
| 50 | OFD1 | OFD1 | OFD1 | 12404 | -0.042 | 0.24 | NO |
| 51 | CETN2 | CETN2 | CETN2 | 14640 | -0.093 | 0.14 | NO |
| 52 | TUBA4A | TUBA4A | TUBA4A | 17350 | -0.25 | 0.046 | NO |
Figure S13. Get High-res Image This plot shows mRNAseq_cNMF expression data heatmap (on the left) a RunningEnrichmentScore(RES) plot (on the top right) and a Signal2Noise(S2N) plot (on the bottom right) of genes in the pathway: PID PLK1 PATHWAY.
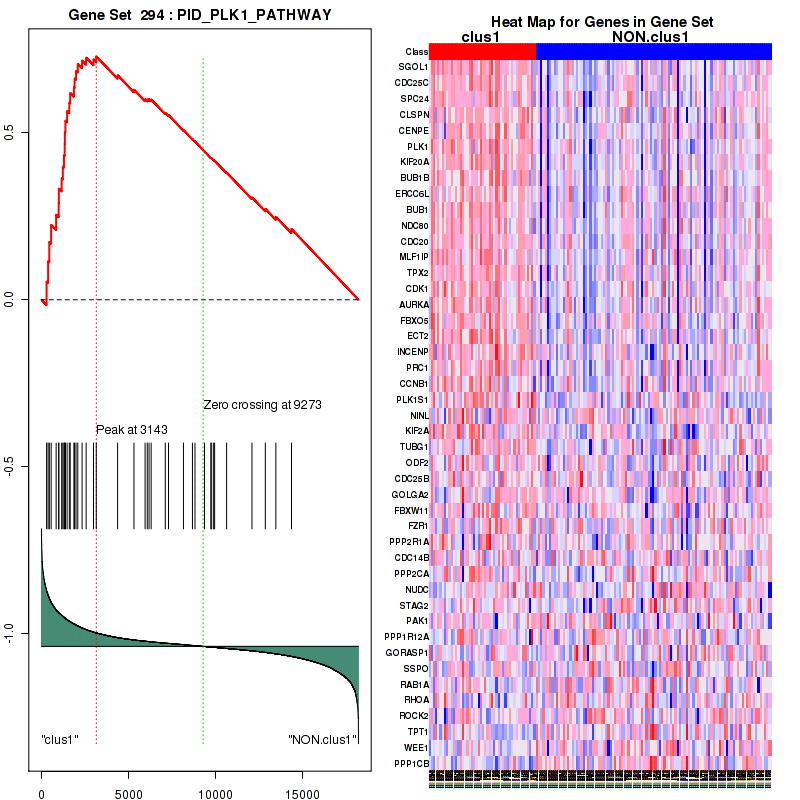
Figure S14. Get High-res Image For the top 5 core enriched genes in the pathway: PID PLK1 PATHWAY, this volcano plot shows how much they are up/down-regulated and significant. The significance was calculated by empirical bayesian fit
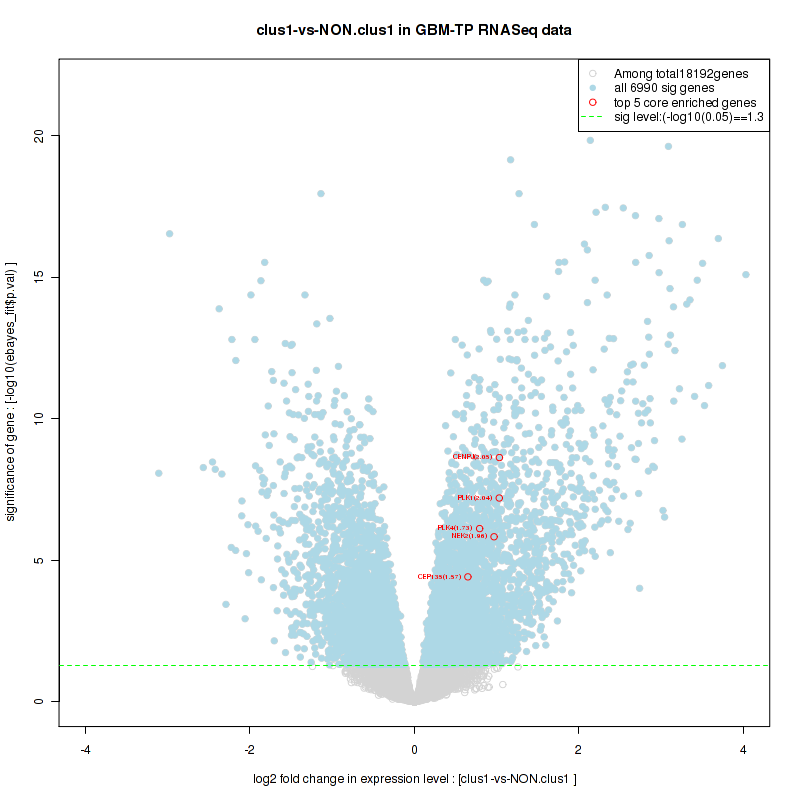
Table S8. Get Full Table This table shows a Running Enrichment Score (RES) of each gene in this pathway, that is, the enrichment score at this point in the ranked list of genes. All genes are ranked by Signal-to-Noise (S2N), a measure of similarity as default and are used to obtain ES matrix of all genes. In this way, GSEA tool uses expression pattern of not only overlapped genes but also not-overlapped genes to produce ES matrix.
| Rank | GENE | SYMBOL | DESC | LIST.LOC | S2N | RES | CORE_ENRICHMENT |
|---|---|---|---|---|---|---|---|
| 1 | E2F2 | E2F2 | E2F2 | 166 | 0.55 | 0.0083 | YES |
| 2 | MCM10 | MCM10 | MCM10 | 248 | 0.49 | 0.02 | YES |
| 3 | SGOL1 | SGOL1 | SGOL1 | 294 | 0.47 | 0.032 | YES |
| 4 | CDC25C | CDC25C | CDC25C | 381 | 0.43 | 0.041 | YES |
| 5 | CDC25A | CDC25A | CDC25A | 383 | 0.43 | 0.055 | YES |
| 6 | CASC5 | CASC5 | CASC5 | 397 | 0.42 | 0.067 | YES |
| 7 | SPC24 | SPC24 | SPC24 | 450 | 0.4 | 0.078 | YES |
| 8 | AURKB | AURKB | AURKB | 502 | 0.39 | 0.087 | YES |
| 9 | PKMYT1 | PKMYT1 | PKMYT1 | 565 | 0.37 | 0.095 | YES |
| 10 | MYBL2 | MYBL2 | MYBL2 | 571 | 0.36 | 0.11 | YES |
| 11 | DNA2 | DNA2 | DNA2 | 662 | 0.34 | 0.11 | YES |
| 12 | CENPJ | CENPJ | CENPJ | 672 | 0.34 | 0.12 | YES |
| 13 | CDK4 | CDK4 | CDK4 | 683 | 0.34 | 0.13 | YES |
| 14 | CDC45 | CDC45 | CDC45 | 738 | 0.32 | 0.14 | YES |
| 15 | CENPI | CENPI | CENPI | 753 | 0.32 | 0.15 | YES |
| 16 | SPC25 | SPC25 | SPC25 | 765 | 0.32 | 0.16 | YES |
| 17 | CDCA8 | CDCA8 | CDCA8 | 802 | 0.31 | 0.17 | YES |
| 18 | NEK2 | NEK2 | NEK2 | 804 | 0.31 | 0.18 | YES |
| 19 | CENPM | CENPM | CENPM | 850 | 0.3 | 0.19 | YES |
| 20 | CENPA | CENPA | CENPA | 860 | 0.3 | 0.2 | YES |
| 21 | NUF2 | NUF2 | NUF2 | 869 | 0.3 | 0.2 | YES |
| 22 | SKA1 | SKA1 | SKA1 | 870 | 0.3 | 0.21 | YES |
| 23 | UBE2C | UBE2C | UBE2C | 937 | 0.29 | 0.22 | YES |
| 24 | BIRC5 | BIRC5 | BIRC5 | 956 | 0.29 | 0.23 | YES |
| 25 | KIF2C | KIF2C | KIF2C | 967 | 0.29 | 0.24 | YES |
| 26 | PLK1 | PLK1 | PLK1 | 988 | 0.28 | 0.24 | YES |
| 27 | KIF20A | KIF20A | KIF20A | 996 | 0.28 | 0.25 | YES |
| 28 | MAD2L1 | MAD2L1 | MAD2L1 | 1060 | 0.27 | 0.26 | YES |
| 29 | PPP2R3B | PPP2R3B | PPP2R3B | 1073 | 0.27 | 0.27 | YES |
| 30 | PLK4 | PLK4 | PLK4 | 1103 | 0.27 | 0.27 | YES |
| 31 | CCNB2 | CCNB2 | CCNB2 | 1115 | 0.27 | 0.28 | YES |
| 32 | BUB1B | BUB1B | BUB1B | 1159 | 0.26 | 0.29 | YES |
| 33 | CDKN2A | CDKN2A | CDKN2A | 1179 | 0.26 | 0.29 | YES |
| 34 | CCND1 | CCND1 | CCND1 | 1210 | 0.25 | 0.3 | YES |
| 35 | KIF18A | KIF18A | KIF18A | 1213 | 0.25 | 0.31 | YES |
| 36 | ERCC6L | ERCC6L | ERCC6L | 1227 | 0.25 | 0.32 | YES |
| 37 | CENPH | CENPH | CENPH | 1281 | 0.25 | 0.32 | YES |
| 38 | CDC7 | CDC7 | CDC7 | 1288 | 0.24 | 0.33 | YES |
| 39 | BUB1 | BUB1 | BUB1 | 1291 | 0.24 | 0.34 | YES |
| 40 | CCNA2 | CCNA2 | CCNA2 | 1313 | 0.24 | 0.34 | YES |
| 41 | NDC80 | NDC80 | NDC80 | 1334 | 0.24 | 0.35 | YES |
| 42 | CDT1 | CDT1 | CDT1 | 1340 | 0.24 | 0.36 | YES |
| 43 | CDC20 | CDC20 | CDC20 | 1343 | 0.24 | 0.36 | YES |
| 44 | ZWINT | ZWINT | ZWINT | 1354 | 0.24 | 0.37 | YES |
| 45 | MLF1IP | MLF1IP | MLF1IP | 1375 | 0.23 | 0.38 | YES |
| 46 | E2F1 | E2F1 | E2F1 | 1521 | 0.22 | 0.38 | YES |
| 47 | CEP135 | CEP135 | CEP135 | 1583 | 0.21 | 0.38 | YES |
| 48 | CDK1 | CDK1 | CDK1 | 1599 | 0.21 | 0.39 | YES |
| 49 | SGOL2 | SGOL2 | SGOL2 | 1640 | 0.21 | 0.39 | YES |
| 50 | AURKA | AURKA | AURKA | 1649 | 0.21 | 0.4 | YES |
| 51 | LIN9 | LIN9 | LIN9 | 1664 | 0.21 | 0.4 | YES |
| 52 | PTTG1 | PTTG1 | PTTG1 | 1680 | 0.2 | 0.41 | YES |
| 53 | CCNE2 | CCNE2 | CCNE2 | 1707 | 0.2 | 0.41 | YES |
| 54 | CDC6 | CDC6 | CDC6 | 1737 | 0.2 | 0.42 | YES |
| 55 | CEP72 | CEP72 | CEP72 | 1744 | 0.2 | 0.42 | YES |
| 56 | GINS2 | GINS2 | GINS2 | 1775 | 0.2 | 0.43 | YES |
| 57 | KIF23 | KIF23 | KIF23 | 1814 | 0.19 | 0.43 | YES |
| 58 | FBXO5 | FBXO5 | FBXO5 | 1862 | 0.19 | 0.44 | YES |
| 59 | INCENP | INCENP | INCENP | 1985 | 0.18 | 0.44 | YES |
| 60 | MCM8 | MCM8 | MCM8 | 1990 | 0.18 | 0.44 | YES |
| 61 | CSNK1E | CSNK1E | CSNK1E | 2086 | 0.17 | 0.44 | YES |
| 62 | CDKN2B | CDKN2B | CDKN2B | 2110 | 0.17 | 0.44 | YES |
| 63 | RFC3 | RFC3 | RFC3 | 2112 | 0.17 | 0.45 | YES |
| 64 | E2F3 | E2F3 | E2F3 | 2128 | 0.17 | 0.46 | YES |
| 65 | POLE | POLE | POLE | 2133 | 0.17 | 0.46 | YES |
| 66 | RRM2 | RRM2 | RRM2 | 2148 | 0.17 | 0.46 | YES |
| 67 | DBF4 | DBF4 | DBF4 | 2235 | 0.16 | 0.46 | YES |
| 68 | RPA4 | RPA4 | RPA4 | 2268 | 0.16 | 0.47 | YES |
| 69 | PRIM1 | PRIM1 | PRIM1 | 2270 | 0.16 | 0.47 | YES |
| 70 | GINS1 | GINS1 | GINS1 | 2301 | 0.16 | 0.48 | YES |
| 71 | CCNB1 | CCNB1 | CCNB1 | 2331 | 0.16 | 0.48 | YES |
| 72 | DHFR | DHFR | DHFR | 2410 | 0.15 | 0.48 | YES |
| 73 | CCDC99 | CCDC99 | CCDC99 | 2424 | 0.15 | 0.48 | YES |
| 74 | AZI1 | AZI1 | AZI1 | 2430 | 0.15 | 0.49 | YES |
| 75 | CENPK | CENPK | CENPK | 2444 | 0.15 | 0.49 | YES |
| 76 | POLE2 | POLE2 | POLE2 | 2477 | 0.14 | 0.5 | YES |
| 77 | CENPN | CENPN | CENPN | 2561 | 0.14 | 0.5 | YES |
| 78 | DCTN2 | DCTN2 | DCTN2 | 2585 | 0.14 | 0.5 | YES |
| 79 | CENPO | CENPO | CENPO | 2592 | 0.14 | 0.5 | YES |
| 80 | MCM2 | MCM2 | MCM2 | 2642 | 0.14 | 0.5 | YES |
| 81 | ZWILCH | ZWILCH | ZWILCH | 2649 | 0.14 | 0.51 | YES |
| 82 | MCM7 | MCM7 | MCM7 | 2726 | 0.13 | 0.51 | YES |
| 83 | POLA2 | POLA2 | POLA2 | 2727 | 0.13 | 0.51 | YES |
| 84 | MYC | MYC | MYC | 2730 | 0.13 | 0.52 | YES |
| 85 | TYMS | TYMS | TYMS | 2846 | 0.13 | 0.51 | YES |
| 86 | CDC26 | CDC26 | CDC26 | 2879 | 0.12 | 0.52 | YES |
| 87 | PRIM2 | PRIM2 | PRIM2 | 2916 | 0.12 | 0.52 | YES |
| 88 | NINL | NINL | NINL | 2986 | 0.12 | 0.52 | YES |
| 89 | RBL1 | RBL1 | RBL1 | 3017 | 0.12 | 0.52 | YES |
| 90 | RFC4 | RFC4 | RFC4 | 3053 | 0.12 | 0.52 | YES |
| 91 | GINS4 | GINS4 | GINS4 | 3108 | 0.11 | 0.52 | YES |
| 92 | KIF2A | KIF2A | KIF2A | 3143 | 0.11 | 0.52 | YES |
| 93 | CDKN2D | CDKN2D | CDKN2D | 3170 | 0.11 | 0.53 | YES |
| 94 | KNTC1 | KNTC1 | KNTC1 | 3293 | 0.11 | 0.52 | YES |
| 95 | CCND2 | CCND2 | CCND2 | 3306 | 0.11 | 0.53 | YES |
| 96 | NUP107 | NUP107 | NUP107 | 3390 | 0.1 | 0.52 | YES |
| 97 | FEN1 | FEN1 | FEN1 | 3437 | 0.1 | 0.53 | YES |
| 98 | PPP2R2A | PPP2R2A | PPP2R2A | 3503 | 0.1 | 0.52 | YES |
| 99 | CKS1B | CKS1B | CKS1B | 3555 | 0.098 | 0.53 | YES |
| 100 | RCC2 | RCC2 | RCC2 | 3556 | 0.098 | 0.53 | YES |
| 101 | TUBB | TUBB | TUBB | 3674 | 0.094 | 0.52 | YES |
| 102 | DCTN3 | DCTN3 | DCTN3 | 3713 | 0.093 | 0.53 | YES |
| 103 | ACTR1A | ACTR1A | ACTR1A | 3714 | 0.093 | 0.53 | YES |
| 104 | TUBA1A | TUBA1A | TUBA1A | 3738 | 0.092 | 0.53 | YES |
| 105 | BUB3 | BUB3 | BUB3 | 3776 | 0.09 | 0.53 | YES |
| 106 | BTRC | BTRC | BTRC | 3810 | 0.089 | 0.53 | YES |
| 107 | MCM4 | MCM4 | MCM4 | 3820 | 0.089 | 0.54 | YES |
| 108 | CEP57 | CEP57 | CEP57 | 3827 | 0.089 | 0.54 | YES |
| 109 | SMC3 | SMC3 | SMC3 | 3845 | 0.088 | 0.54 | YES |
| 110 | RANGAP1 | RANGAP1 | RANGAP1 | 3912 | 0.086 | 0.54 | YES |
| 111 | CENPL | CENPL | CENPL | 3948 | 0.085 | 0.54 | YES |
| 112 | POLD1 | POLD1 | POLD1 | 3985 | 0.084 | 0.54 | YES |
| 113 | RFC5 | RFC5 | RFC5 | 3996 | 0.083 | 0.54 | YES |
| 114 | PRKAR2B | PRKAR2B | PRKAR2B | 4012 | 0.083 | 0.54 | YES |
| 115 | LIG1 | LIG1 | LIG1 | 4022 | 0.083 | 0.55 | YES |
| 116 | DSN1 | DSN1 | DSN1 | 4064 | 0.082 | 0.55 | YES |
| 117 | SKA2 | SKA2 | SKA2 | 4071 | 0.082 | 0.55 | YES |
| 118 | CENPP | CENPP | CENPP | 4078 | 0.082 | 0.55 | YES |
| 119 | CEP63 | CEP63 | CEP63 | 4180 | 0.078 | 0.55 | NO |
| 120 | SKP2 | SKP2 | SKP2 | 4324 | 0.075 | 0.54 | NO |
| 121 | MCM5 | MCM5 | MCM5 | 4334 | 0.074 | 0.54 | NO |
| 122 | TUBG1 | TUBG1 | TUBG1 | 4370 | 0.073 | 0.54 | NO |
| 123 | TAOK1 | TAOK1 | TAOK1 | 4421 | 0.072 | 0.54 | NO |
| 124 | PPP2R5D | PPP2R5D | PPP2R5D | 4476 | 0.071 | 0.54 | NO |
| 125 | CEP70 | CEP70 | CEP70 | 4628 | 0.067 | 0.54 | NO |
| 126 | NUMA1 | NUMA1 | NUMA1 | 4693 | 0.066 | 0.54 | NO |
| 127 | RAD21 | RAD21 | RAD21 | 4715 | 0.065 | 0.54 | NO |
| 128 | E2F5 | E2F5 | E2F5 | 4735 | 0.065 | 0.54 | NO |
| 129 | CCNA1 | CCNA1 | CCNA1 | 4801 | 0.064 | 0.54 | NO |
| 130 | PSMD3 | PSMD3 | PSMD3 | 4810 | 0.063 | 0.54 | NO |
| 131 | MCM6 | MCM6 | MCM6 | 4854 | 0.063 | 0.54 | NO |
| 132 | CCNE1 | CCNE1 | CCNE1 | 4876 | 0.062 | 0.54 | NO |
| 133 | PSMB7 | PSMB7 | PSMB7 | 4880 | 0.062 | 0.54 | NO |
| 134 | MAD1L1 | MAD1L1 | MAD1L1 | 4921 | 0.061 | 0.54 | NO |
| 135 | ALMS1 | ALMS1 | ALMS1 | 5034 | 0.059 | 0.54 | NO |
| 136 | CENPC1 | CENPC1 | CENPC1 | 5058 | 0.058 | 0.54 | NO |
| 137 | CDKN1B | CDKN1B | CDKN1B | 5078 | 0.058 | 0.54 | NO |
| 138 | CENPQ | CENPQ | CENPQ | 5092 | 0.058 | 0.54 | NO |
| 139 | PCNA | PCNA | PCNA | 5204 | 0.055 | 0.53 | NO |
| 140 | SMC1A | SMC1A | SMC1A | 5224 | 0.055 | 0.53 | NO |
| 141 | CENPT | CENPT | CENPT | 5327 | 0.054 | 0.53 | NO |
| 142 | CKAP5 | CKAP5 | CKAP5 | 5376 | 0.053 | 0.53 | NO |
| 143 | ITGB3BP | ITGB3BP | ITGB3BP | 5426 | 0.052 | 0.53 | NO |
| 144 | MAPRE1 | MAPRE1 | MAPRE1 | 5500 | 0.05 | 0.52 | NO |
| 145 | POLD3 | POLD3 | POLD3 | 5511 | 0.05 | 0.53 | NO |
| 146 | TUBGCP6 | TUBGCP6 | TUBGCP6 | 5528 | 0.05 | 0.53 | NO |
| 147 | UBE2D1 | UBE2D1 | UBE2D1 | 5553 | 0.05 | 0.53 | NO |
| 148 | NUP43 | NUP43 | NUP43 | 5611 | 0.049 | 0.53 | NO |
| 149 | PSMD11 | PSMD11 | PSMD11 | 5614 | 0.049 | 0.53 | NO |
| 150 | RBBP4 | RBBP4 | RBBP4 | 5621 | 0.048 | 0.53 | NO |
| 151 | POLA1 | POLA1 | POLA1 | 5765 | 0.046 | 0.52 | NO |
| 152 | CEP76 | CEP76 | CEP76 | 5810 | 0.045 | 0.52 | NO |
| 153 | GMNN | GMNN | GMNN | 5874 | 0.044 | 0.52 | NO |
| 154 | CLASP1 | CLASP1 | CLASP1 | 5913 | 0.044 | 0.52 | NO |
| 155 | MIS12 | MIS12 | MIS12 | 5920 | 0.044 | 0.52 | NO |
| 156 | CDC25B | CDC25B | CDC25B | 5946 | 0.043 | 0.52 | NO |
| 157 | ANAPC1 | ANAPC1 | ANAPC1 | 5969 | 0.043 | 0.52 | NO |
| 158 | ANAPC7 | ANAPC7 | ANAPC7 | 5975 | 0.043 | 0.52 | NO |
| 159 | TUBGCP3 | TUBGCP3 | TUBGCP3 | 6132 | 0.041 | 0.51 | NO |
| 160 | CDK5RAP2 | CDK5RAP2 | CDK5RAP2 | 6146 | 0.04 | 0.51 | NO |
| 161 | PPP2R5B | PPP2R5B | PPP2R5B | 6273 | 0.038 | 0.51 | NO |
| 162 | SEC13 | SEC13 | SEC13 | 6329 | 0.037 | 0.51 | NO |
| 163 | DCTN1 | DCTN1 | DCTN1 | 6543 | 0.034 | 0.5 | NO |
| 164 | ZW10 | ZW10 | ZW10 | 6580 | 0.034 | 0.49 | NO |
| 165 | MCM3 | MCM3 | MCM3 | 6596 | 0.034 | 0.49 | NO |
| 166 | CEP250 | CEP250 | CEP250 | 6601 | 0.034 | 0.5 | NO |
| 167 | PAFAH1B1 | PAFAH1B1 | PAFAH1B1 | 6705 | 0.032 | 0.49 | NO |
| 168 | LIN54 | LIN54 | LIN54 | 6721 | 0.032 | 0.49 | NO |
| 169 | CCNH | CCNH | CCNH | 6757 | 0.032 | 0.49 | NO |
| 170 | PCNT | PCNT | PCNT | 6799 | 0.031 | 0.49 | NO |
| 171 | CDKN2C | CDKN2C | CDKN2C | 6817 | 0.031 | 0.49 | NO |
| 172 | CDC23 | CDC23 | CDC23 | 6843 | 0.03 | 0.49 | NO |
| 173 | CDC27 | CDC27 | CDC27 | 6980 | 0.029 | 0.48 | NO |
| 174 | ANAPC5 | ANAPC5 | ANAPC5 | 6998 | 0.029 | 0.48 | NO |
| 175 | PSMD2 | PSMD2 | PSMD2 | 7102 | 0.028 | 0.48 | NO |
| 176 | PPP2R1A | PPP2R1A | PPP2R1A | 7103 | 0.028 | 0.48 | NO |
| 177 | ANAPC2 | ANAPC2 | ANAPC2 | 7118 | 0.027 | 0.48 | NO |
| 178 | PPP2R1B | PPP2R1B | PPP2R1B | 7139 | 0.027 | 0.48 | NO |
| 179 | CEP192 | CEP192 | CEP192 | 7145 | 0.027 | 0.48 | NO |
| 180 | CDK2 | CDK2 | CDK2 | 7151 | 0.027 | 0.48 | NO |
| 181 | PSMB6 | PSMB6 | PSMB6 | 7187 | 0.026 | 0.48 | NO |
| 182 | TUBGCP2 | TUBGCP2 | TUBGCP2 | 7236 | 0.026 | 0.48 | NO |
| 183 | DYNC1I2 | DYNC1I2 | DYNC1I2 | 7275 | 0.025 | 0.47 | NO |
| 184 | CEP290 | CEP290 | CEP290 | 7398 | 0.024 | 0.47 | NO |
| 185 | PSMB3 | PSMB3 | PSMB3 | 7447 | 0.023 | 0.47 | NO |
| 186 | UBE2E1 | UBE2E1 | UBE2E1 | 7461 | 0.023 | 0.47 | NO |
| 187 | PPP2R5E | PPP2R5E | PPP2R5E | 7539 | 0.022 | 0.46 | NO |
| 188 | PSMB2 | PSMB2 | PSMB2 | 7540 | 0.022 | 0.46 | NO |
| 189 | YWHAE | YWHAE | YWHAE | 7564 | 0.022 | 0.46 | NO |
| 190 | STAG1 | STAG1 | STAG1 | 7627 | 0.021 | 0.46 | NO |
| 191 | ANAPC11 | ANAPC11 | ANAPC11 | 7649 | 0.02 | 0.46 | NO |
| 192 | NSL1 | NSL1 | NSL1 | 7726 | 0.02 | 0.46 | NO |
| 193 | LIN52 | LIN52 | LIN52 | 7779 | 0.019 | 0.45 | NO |
| 194 | PSMD10 | PSMD10 | PSMD10 | 7801 | 0.019 | 0.45 | NO |
| 195 | PPP1CC | PPP1CC | PPP1CC | 7828 | 0.018 | 0.45 | NO |
| 196 | PMF1 | PMF1 | PMF1 | 7928 | 0.017 | 0.45 | NO |
| 197 | PSMD4 | PSMD4 | PSMD4 | 7961 | 0.017 | 0.45 | NO |
| 198 | XPO1 | XPO1 | XPO1 | 7986 | 0.016 | 0.44 | NO |
| 199 | SSNA1 | SSNA1 | SSNA1 | 8001 | 0.016 | 0.44 | NO |
| 200 | NUP85 | NUP85 | NUP85 | 8109 | 0.015 | 0.44 | NO |
| 201 | PPP2CA | PPP2CA | PPP2CA | 8148 | 0.015 | 0.44 | NO |
| 202 | NUP133 | NUP133 | NUP133 | 8173 | 0.014 | 0.44 | NO |
| 203 | NEDD1 | NEDD1 | NEDD1 | 8230 | 0.014 | 0.43 | NO |
| 204 | PSMD6 | PSMD6 | PSMD6 | 8285 | 0.013 | 0.43 | NO |
| 205 | DYNC1H1 | DYNC1H1 | DYNC1H1 | 8317 | 0.012 | 0.43 | NO |
| 206 | CCND3 | CCND3 | CCND3 | 8398 | 0.011 | 0.43 | NO |
| 207 | YWHAG | YWHAG | YWHAG | 8521 | 0.0094 | 0.42 | NO |
| 208 | NUDC | NUDC | NUDC | 8662 | 0.0077 | 0.41 | NO |
| 209 | DYRK1A | DYRK1A | DYRK1A | 8718 | 0.0068 | 0.41 | NO |
| 210 | E2F4 | E2F4 | E2F4 | 8769 | 0.0062 | 0.41 | NO |
| 211 | STAG2 | STAG2 | STAG2 | 8809 | 0.0056 | 0.4 | NO |
| 212 | LIN37 | LIN37 | LIN37 | 8814 | 0.0056 | 0.4 | NO |
| 213 | PSMD1 | PSMD1 | PSMD1 | 8837 | 0.0053 | 0.4 | NO |
| 214 | CEP164 | CEP164 | CEP164 | 8868 | 0.0049 | 0.4 | NO |
| 215 | PCM1 | PCM1 | PCM1 | 8959 | 0.0039 | 0.4 | NO |
| 216 | PSMB5 | PSMB5 | PSMB5 | 9004 | 0.0034 | 0.39 | NO |
| 217 | RBL2 | RBL2 | RBL2 | 9141 | 0.0015 | 0.39 | NO |
| 218 | RPA1 | RPA1 | RPA1 | 9256 | 0.00022 | 0.38 | NO |
| 219 | PSMA7 | PSMA7 | PSMA7 | 9321 | -0.00068 | 0.38 | NO |
| 220 | PSMA4 | PSMA4 | PSMA4 | 9323 | -0.0007 | 0.38 | NO |
| 221 | DYNLL1 | DYNLL1 | DYNLL1 | 9371 | -0.0013 | 0.37 | NO |
| 222 | PSMD14 | PSMD14 | PSMD14 | 9469 | -0.0025 | 0.37 | NO |
| 223 | FGFR1OP | FGFR1OP | FGFR1OP | 9648 | -0.0045 | 0.36 | NO |
| 224 | GORASP1 | GORASP1 | GORASP1 | 9735 | -0.0056 | 0.36 | NO |
| 225 | PSMD7 | PSMD7 | PSMD7 | 9742 | -0.0056 | 0.35 | NO |
| 226 | MNAT1 | MNAT1 | MNAT1 | 9747 | -0.0057 | 0.35 | NO |
| 227 | PSMB1 | PSMB1 | PSMB1 | 9812 | -0.0065 | 0.35 | NO |
| 228 | PPP2R5C | PPP2R5C | PPP2R5C | 9860 | -0.0072 | 0.35 | NO |
| 229 | CDK6 | CDK6 | CDK6 | 9867 | -0.0073 | 0.35 | NO |
| 230 | PSME4 | PSME4 | PSME4 | 9874 | -0.0074 | 0.35 | NO |
| 231 | AKAP9 | AKAP9 | AKAP9 | 9941 | -0.0084 | 0.34 | NO |
| 232 | RB1 | RB1 | RB1 | 9968 | -0.0088 | 0.34 | NO |
| 233 | RPA2 | RPA2 | RPA2 | 10018 | -0.0096 | 0.34 | NO |
| 234 | PSMB4 | PSMB4 | PSMB4 | 10061 | -0.01 | 0.34 | NO |
| 235 | SEH1L | SEH1L | SEH1L | 10071 | -0.01 | 0.34 | NO |
| 236 | PSMC3 | PSMC3 | PSMC3 | 10166 | -0.012 | 0.33 | NO |
| 237 | PSMF1 | PSMF1 | PSMF1 | 10206 | -0.012 | 0.33 | NO |
| 238 | UBA52 | UBA52 | UBA52 | 10240 | -0.012 | 0.33 | NO |
| 239 | PSMD8 | PSMD8 | PSMD8 | 10290 | -0.013 | 0.33 | NO |
| 240 | RFC2 | RFC2 | RFC2 | 10352 | -0.014 | 0.33 | NO |
| 241 | PPP2CB | PPP2CB | PPP2CB | 10382 | -0.014 | 0.32 | NO |
| 242 | POLD2 | POLD2 | POLD2 | 10505 | -0.016 | 0.32 | NO |
| 243 | RANBP2 | RANBP2 | RANBP2 | 10508 | -0.016 | 0.32 | NO |
| 244 | PSMC4 | PSMC4 | PSMC4 | 10516 | -0.016 | 0.32 | NO |
| 245 | RPA3 | RPA3 | RPA3 | 10532 | -0.016 | 0.32 | NO |
| 246 | PSMA6 | PSMA6 | PSMA6 | 10533 | -0.016 | 0.32 | NO |
| 247 | CSNK1D | CSNK1D | CSNK1D | 10609 | -0.017 | 0.32 | NO |
| 248 | PSMA5 | PSMA5 | PSMA5 | 10715 | -0.019 | 0.31 | NO |
| 249 | PSMD12 | PSMD12 | PSMD12 | 10787 | -0.02 | 0.31 | NO |
| 250 | PSMA2 | PSMA2 | PSMA2 | 10921 | -0.022 | 0.3 | NO |
| 251 | RPS27 | RPS27 | RPS27 | 11012 | -0.023 | 0.3 | NO |
| 252 | PSMC5 | PSMC5 | PSMC5 | 11025 | -0.023 | 0.3 | NO |
| 253 | RPS27A | RPS27A | RPS27A | 11126 | -0.024 | 0.29 | NO |
| 254 | PSMD13 | PSMD13 | PSMD13 | 11151 | -0.024 | 0.29 | NO |
| 255 | ANAPC4 | ANAPC4 | ANAPC4 | 11228 | -0.025 | 0.29 | NO |
| 256 | TFDP1 | TFDP1 | TFDP1 | 11264 | -0.026 | 0.29 | NO |
| 257 | AHCTF1 | AHCTF1 | AHCTF1 | 11348 | -0.027 | 0.28 | NO |
| 258 | PSMC6 | PSMC6 | PSMC6 | 11658 | -0.032 | 0.27 | NO |
| 259 | HDAC1 | HDAC1 | HDAC1 | 11661 | -0.032 | 0.27 | NO |
| 260 | PSMC2 | PSMC2 | PSMC2 | 11763 | -0.033 | 0.26 | NO |
| 261 | APITD1 | APITD1 | APITD1 | 11842 | -0.034 | 0.26 | NO |
| 262 | CDC16 | CDC16 | CDC16 | 11943 | -0.036 | 0.25 | NO |
| 263 | HSP90AA1 | HSP90AA1 | HSP90AA1 | 11967 | -0.036 | 0.25 | NO |
| 264 | PRKACA | PRKACA | PRKACA | 12068 | -0.038 | 0.25 | NO |
| 265 | HAUS2 | HAUS2 | HAUS2 | 12193 | -0.039 | 0.24 | NO |
| 266 | NDEL1 | NDEL1 | NDEL1 | 12299 | -0.041 | 0.24 | NO |
| 267 | SDCCAG8 | SDCCAG8 | SDCCAG8 | 12351 | -0.042 | 0.24 | NO |
| 268 | OFD1 | OFD1 | OFD1 | 12404 | -0.042 | 0.24 | NO |
| 269 | PSMA1 | PSMA1 | PSMA1 | 12410 | -0.043 | 0.24 | NO |
| 270 | CDK7 | CDK7 | CDK7 | 12501 | -0.044 | 0.23 | NO |
| 271 | PSMC1 | PSMC1 | PSMC1 | 12549 | -0.045 | 0.23 | NO |
| 272 | SKP1 | SKP1 | SKP1 | 12556 | -0.045 | 0.23 | NO |
| 273 | TUBG2 | TUBG2 | TUBG2 | 12648 | -0.047 | 0.23 | NO |
| 274 | CDC14A | CDC14A | CDC14A | 12726 | -0.048 | 0.23 | NO |
| 275 | CUL1 | CUL1 | CUL1 | 12808 | -0.05 | 0.22 | NO |
| 276 | PSMD5 | PSMD5 | PSMD5 | 12919 | -0.052 | 0.22 | NO |
| 277 | MAX | MAX | MAX | 13086 | -0.055 | 0.21 | NO |
| 278 | NUP37 | NUP37 | NUP37 | 13141 | -0.056 | 0.21 | NO |
| 279 | PSMD9 | PSMD9 | PSMD9 | 13349 | -0.06 | 0.2 | NO |
| 280 | WEE1 | WEE1 | WEE1 | 13448 | -0.062 | 0.2 | NO |
| 281 | ANAPC10 | ANAPC10 | ANAPC10 | 13778 | -0.07 | 0.18 | NO |
| 282 | PSMA3 | PSMA3 | PSMA3 | 13897 | -0.073 | 0.18 | NO |
| 283 | TUBGCP5 | TUBGCP5 | TUBGCP5 | 13963 | -0.074 | 0.18 | NO |
| 284 | PPP2R5A | PPP2R5A | PPP2R5A | 14000 | -0.075 | 0.18 | NO |
| 285 | TK2 | TK2 | TK2 | 14418 | -0.086 | 0.16 | NO |
| 286 | CETN2 | CETN2 | CETN2 | 14640 | -0.093 | 0.15 | NO |
| 287 | CLIP1 | CLIP1 | CLIP1 | 14808 | -0.098 | 0.14 | NO |
| 288 | PSMB10 | PSMB10 | PSMB10 | 15166 | -0.11 | 0.12 | NO |
| 289 | POLD4 | POLD4 | POLD4 | 15443 | -0.12 | 0.11 | NO |
| 290 | PSME1 | PSME1 | PSME1 | 15535 | -0.12 | 0.11 | NO |
| 291 | PSME2 | PSME2 | PSME2 | 15537 | -0.12 | 0.12 | NO |
| 292 | CDKN1A | CDKN1A | CDKN1A | 15669 | -0.13 | 0.11 | NO |
| 293 | PSMA8 | PSMA8 | PSMA8 | 15685 | -0.13 | 0.12 | NO |
| 294 | PSMB8 | PSMB8 | PSMB8 | 15918 | -0.14 | 0.11 | NO |
| 295 | B9D2 | B9D2 | B9D2 | 15935 | -0.14 | 0.11 | NO |
| 296 | PSMB9 | PSMB9 | PSMB9 | 16846 | -0.2 | 0.067 | NO |
| 297 | TUBA4A | TUBA4A | TUBA4A | 17350 | -0.25 | 0.047 | NO |
Figure S15. Get High-res Image This plot shows mRNAseq_cNMF expression data heatmap (on the left) a RunningEnrichmentScore(RES) plot (on the top right) and a Signal2Noise(S2N) plot (on the bottom right) of genes in the pathway: PID AR TF PATHWAY.
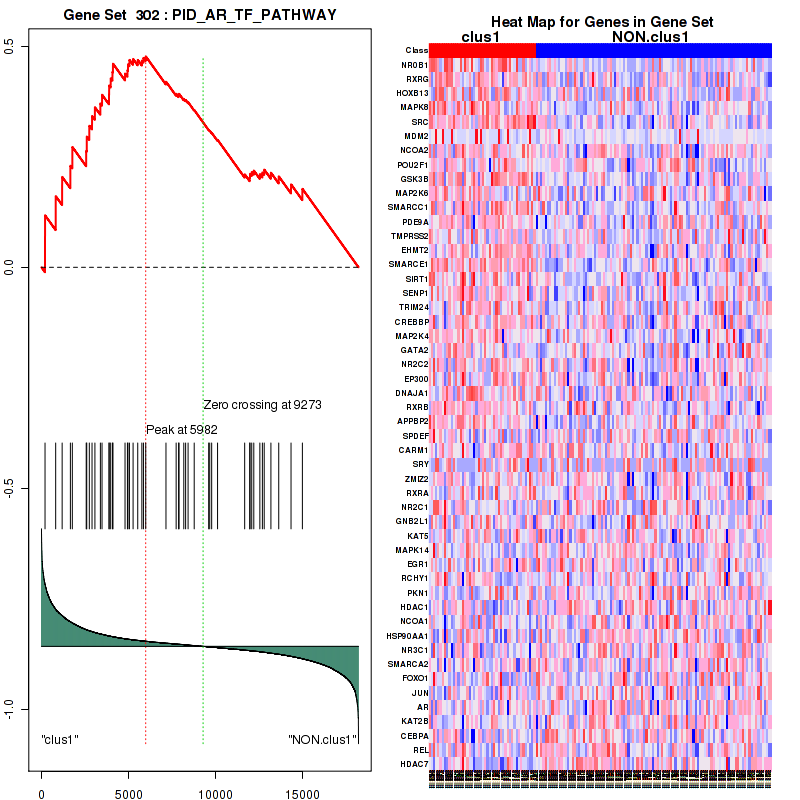
Figure S16. Get High-res Image For the top 5 core enriched genes in the pathway: PID AR TF PATHWAY, this volcano plot shows how much they are up/down-regulated and significant. The significance was calculated by empirical bayesian fit
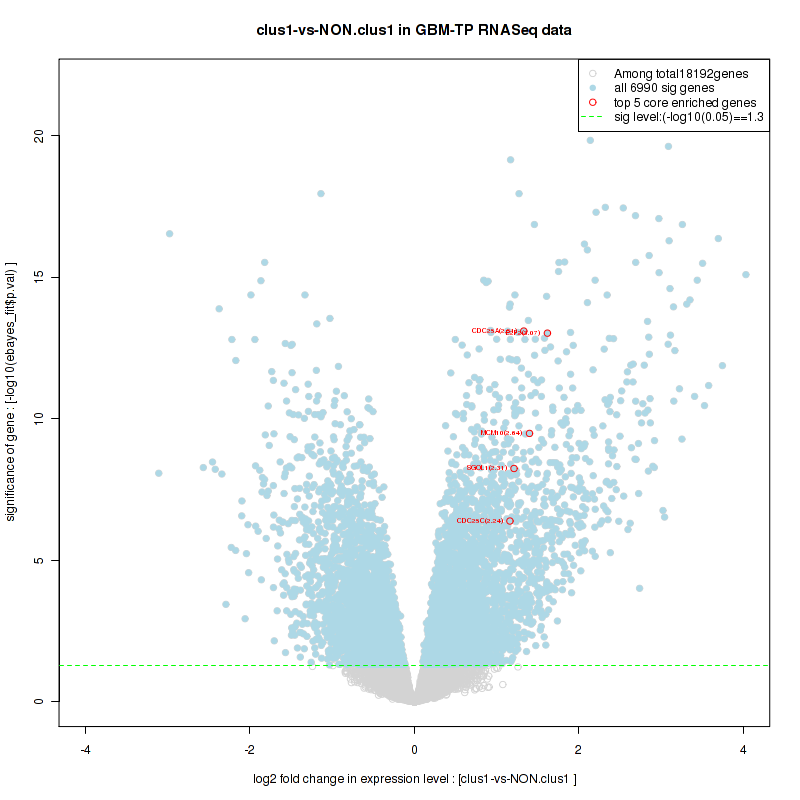
Table S9. Get Full Table This table shows a Running Enrichment Score (RES) of each gene in this pathway, that is, the enrichment score at this point in the ranked list of genes. All genes are ranked by Signal-to-Noise (S2N), a measure of similarity as default and are used to obtain ES matrix of all genes. In this way, GSEA tool uses expression pattern of not only overlapped genes but also not-overlapped genes to produce ES matrix.
| Rank | GENE | SYMBOL | DESC | LIST.LOC | S2N | RES | CORE_ENRICHMENT |
|---|---|---|---|---|---|---|---|
| 1 | CDC25C | CDC25C | CDC25C | 381 | 0.43 | 0.038 | YES |
| 2 | CDC25A | CDC25A | CDC25A | 383 | 0.43 | 0.098 | YES |
| 3 | PKMYT1 | PKMYT1 | PKMYT1 | 565 | 0.37 | 0.14 | YES |
| 4 | CENPJ | CENPJ | CENPJ | 672 | 0.34 | 0.18 | YES |
| 5 | NEK2 | NEK2 | NEK2 | 804 | 0.31 | 0.22 | YES |
| 6 | PLK1 | PLK1 | PLK1 | 988 | 0.28 | 0.24 | YES |
| 7 | PLK4 | PLK4 | PLK4 | 1103 | 0.27 | 0.28 | YES |
| 8 | CCNB2 | CCNB2 | CCNB2 | 1115 | 0.27 | 0.31 | YES |
| 9 | CCNA2 | CCNA2 | CCNA2 | 1313 | 0.24 | 0.34 | YES |
| 10 | E2F1 | E2F1 | E2F1 | 1521 | 0.22 | 0.35 | YES |
| 11 | CEP135 | CEP135 | CEP135 | 1583 | 0.21 | 0.38 | YES |
| 12 | CDK1 | CDK1 | CDK1 | 1599 | 0.21 | 0.41 | YES |
| 13 | CEP72 | CEP72 | CEP72 | 1744 | 0.2 | 0.43 | YES |
| 14 | CSNK1E | CSNK1E | CSNK1E | 2086 | 0.17 | 0.43 | YES |
| 15 | E2F3 | E2F3 | E2F3 | 2128 | 0.17 | 0.45 | YES |
| 16 | CCNB1 | CCNB1 | CCNB1 | 2331 | 0.16 | 0.46 | YES |
| 17 | AZI1 | AZI1 | AZI1 | 2430 | 0.15 | 0.48 | YES |
| 18 | DCTN2 | DCTN2 | DCTN2 | 2585 | 0.14 | 0.49 | YES |
| 19 | NINL | NINL | NINL | 2986 | 0.12 | 0.48 | YES |
| 20 | TUBB | TUBB | TUBB | 3674 | 0.094 | 0.46 | YES |
| 21 | DCTN3 | DCTN3 | DCTN3 | 3713 | 0.093 | 0.47 | YES |
| 22 | ACTR1A | ACTR1A | ACTR1A | 3714 | 0.093 | 0.48 | YES |
| 23 | TUBA1A | TUBA1A | TUBA1A | 3738 | 0.092 | 0.5 | YES |
| 24 | CEP57 | CEP57 | CEP57 | 3827 | 0.089 | 0.5 | YES |
| 25 | PRKAR2B | PRKAR2B | PRKAR2B | 4012 | 0.083 | 0.5 | YES |
| 26 | CEP63 | CEP63 | CEP63 | 4180 | 0.078 | 0.5 | YES |
| 27 | TUBG1 | TUBG1 | TUBG1 | 4370 | 0.073 | 0.5 | YES |
| 28 | CEP70 | CEP70 | CEP70 | 4628 | 0.067 | 0.5 | YES |
| 29 | NUMA1 | NUMA1 | NUMA1 | 4693 | 0.066 | 0.51 | YES |
| 30 | CCNA1 | CCNA1 | CCNA1 | 4801 | 0.064 | 0.51 | YES |
| 31 | ALMS1 | ALMS1 | ALMS1 | 5034 | 0.059 | 0.5 | NO |
| 32 | CKAP5 | CKAP5 | CKAP5 | 5376 | 0.053 | 0.49 | NO |
| 33 | MAPRE1 | MAPRE1 | MAPRE1 | 5500 | 0.05 | 0.49 | NO |
| 34 | TUBGCP6 | TUBGCP6 | TUBGCP6 | 5528 | 0.05 | 0.5 | NO |
| 35 | CEP76 | CEP76 | CEP76 | 5810 | 0.045 | 0.49 | NO |
| 36 | CLASP1 | CLASP1 | CLASP1 | 5913 | 0.044 | 0.49 | NO |
| 37 | CDC25B | CDC25B | CDC25B | 5946 | 0.043 | 0.49 | NO |
| 38 | TUBGCP3 | TUBGCP3 | TUBGCP3 | 6132 | 0.041 | 0.49 | NO |
| 39 | CDK5RAP2 | CDK5RAP2 | CDK5RAP2 | 6146 | 0.04 | 0.49 | NO |
| 40 | DCTN1 | DCTN1 | DCTN1 | 6543 | 0.034 | 0.48 | NO |
| 41 | CEP250 | CEP250 | CEP250 | 6601 | 0.034 | 0.48 | NO |
| 42 | PAFAH1B1 | PAFAH1B1 | PAFAH1B1 | 6705 | 0.032 | 0.48 | NO |
| 43 | CCNH | CCNH | CCNH | 6757 | 0.032 | 0.48 | NO |
| 44 | PCNT | PCNT | PCNT | 6799 | 0.031 | 0.48 | NO |
| 45 | PPP2R1A | PPP2R1A | PPP2R1A | 7103 | 0.028 | 0.47 | NO |
| 46 | CEP192 | CEP192 | CEP192 | 7145 | 0.027 | 0.47 | NO |
| 47 | CDK2 | CDK2 | CDK2 | 7151 | 0.027 | 0.47 | NO |
| 48 | TUBGCP2 | TUBGCP2 | TUBGCP2 | 7236 | 0.026 | 0.47 | NO |
| 49 | DYNC1I2 | DYNC1I2 | DYNC1I2 | 7275 | 0.025 | 0.47 | NO |
| 50 | CEP290 | CEP290 | CEP290 | 7398 | 0.024 | 0.47 | NO |
| 51 | YWHAE | YWHAE | YWHAE | 7564 | 0.022 | 0.46 | NO |
| 52 | XPO1 | XPO1 | XPO1 | 7986 | 0.016 | 0.44 | NO |
| 53 | SSNA1 | SSNA1 | SSNA1 | 8001 | 0.016 | 0.44 | NO |
| 54 | NEDD1 | NEDD1 | NEDD1 | 8230 | 0.014 | 0.43 | NO |
| 55 | DYNC1H1 | DYNC1H1 | DYNC1H1 | 8317 | 0.012 | 0.43 | NO |
| 56 | YWHAG | YWHAG | YWHAG | 8521 | 0.0094 | 0.42 | NO |
| 57 | CEP164 | CEP164 | CEP164 | 8868 | 0.0049 | 0.4 | NO |
| 58 | PCM1 | PCM1 | PCM1 | 8959 | 0.0039 | 0.4 | NO |
| 59 | DYNLL1 | DYNLL1 | DYNLL1 | 9371 | -0.0013 | 0.38 | NO |
| 60 | FGFR1OP | FGFR1OP | FGFR1OP | 9648 | -0.0045 | 0.36 | NO |
| 61 | MNAT1 | MNAT1 | MNAT1 | 9747 | -0.0057 | 0.36 | NO |
| 62 | AKAP9 | AKAP9 | AKAP9 | 9941 | -0.0084 | 0.35 | NO |
| 63 | CSNK1D | CSNK1D | CSNK1D | 10609 | -0.017 | 0.31 | NO |
| 64 | HSP90AA1 | HSP90AA1 | HSP90AA1 | 11967 | -0.036 | 0.24 | NO |
| 65 | PRKACA | PRKACA | PRKACA | 12068 | -0.038 | 0.24 | NO |
| 66 | HAUS2 | HAUS2 | HAUS2 | 12193 | -0.039 | 0.24 | NO |
| 67 | SDCCAG8 | SDCCAG8 | SDCCAG8 | 12351 | -0.042 | 0.24 | NO |
| 68 | OFD1 | OFD1 | OFD1 | 12404 | -0.042 | 0.24 | NO |
| 69 | CDK7 | CDK7 | CDK7 | 12501 | -0.044 | 0.24 | NO |
| 70 | TUBG2 | TUBG2 | TUBG2 | 12648 | -0.047 | 0.24 | NO |
| 71 | WEE1 | WEE1 | WEE1 | 13448 | -0.062 | 0.2 | NO |
| 72 | TUBGCP5 | TUBGCP5 | TUBGCP5 | 13963 | -0.074 | 0.19 | NO |
| 73 | CETN2 | CETN2 | CETN2 | 14640 | -0.093 | 0.16 | NO |
| 74 | TUBA4A | TUBA4A | TUBA4A | 17350 | -0.25 | 0.046 | NO |
Figure S17. Get High-res Image This plot shows mRNAseq_cNMF expression data heatmap (on the left) a RunningEnrichmentScore(RES) plot (on the top right) and a Signal2Noise(S2N) plot (on the bottom right) of genes in the pathway: PID LIS1PATHWAY.
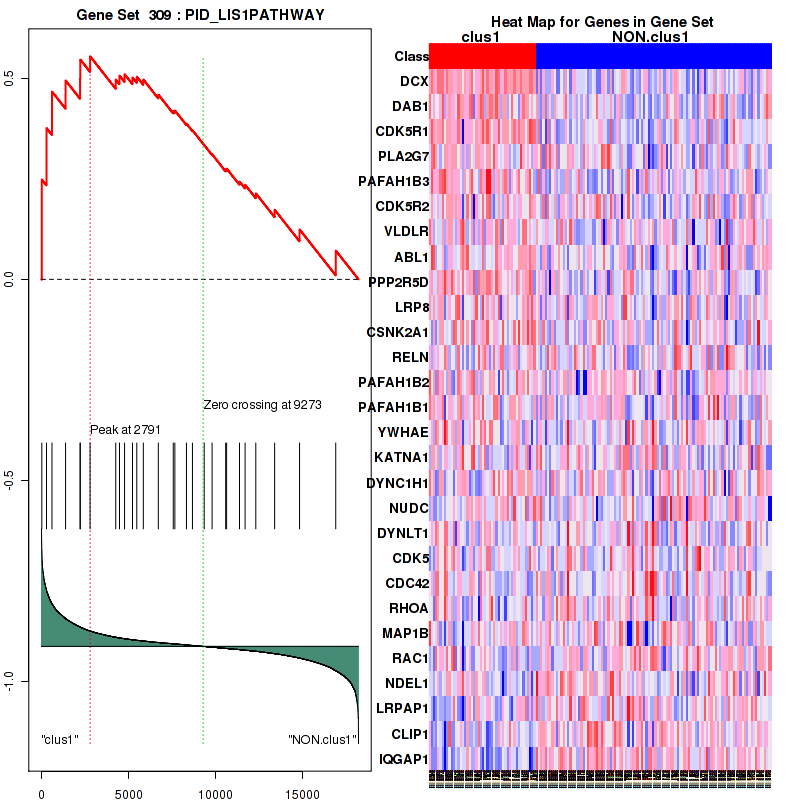
Figure S18. Get High-res Image For the top 5 core enriched genes in the pathway: PID LIS1PATHWAY, this volcano plot shows how much they are up/down-regulated and significant. The significance was calculated by empirical bayesian fit
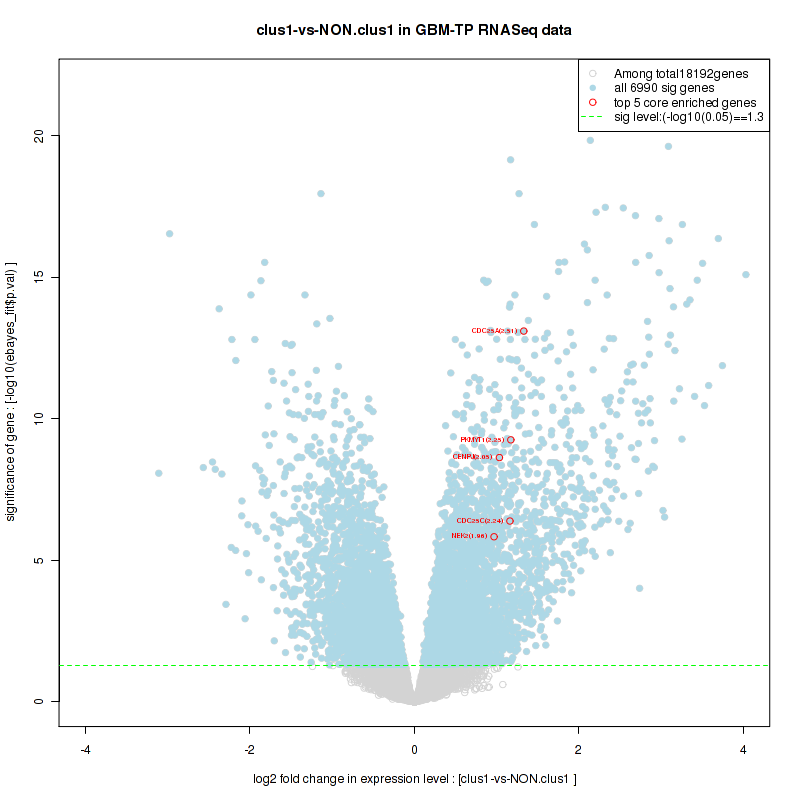
Table S10. Get Full Table This table shows a Running Enrichment Score (RES) of each gene in this pathway, that is, the enrichment score at this point in the ranked list of genes. All genes are ranked by Signal-to-Noise (S2N), a measure of similarity as default and are used to obtain ES matrix of all genes. In this way, GSEA tool uses expression pattern of not only overlapped genes but also not-overlapped genes to produce ES matrix.
| Rank | GENE | SYMBOL | DESC | LIST.LOC | S2N | RES | CORE_ENRICHMENT |
|---|---|---|---|---|---|---|---|
| 1 | E2F2 | E2F2 | E2F2 | 166 | 0.55 | 0.0044 | YES |
| 2 | MCM10 | MCM10 | MCM10 | 248 | 0.49 | 0.012 | YES |
| 3 | SGOL1 | SGOL1 | SGOL1 | 294 | 0.47 | 0.022 | YES |
| 4 | CDC25C | CDC25C | CDC25C | 381 | 0.43 | 0.027 | YES |
| 5 | CDC25A | CDC25A | CDC25A | 383 | 0.43 | 0.038 | YES |
| 6 | CASC5 | CASC5 | CASC5 | 397 | 0.42 | 0.048 | YES |
| 7 | SPC24 | SPC24 | SPC24 | 450 | 0.4 | 0.055 | YES |
| 8 | AURKB | AURKB | AURKB | 502 | 0.39 | 0.062 | YES |
| 9 | PKMYT1 | PKMYT1 | PKMYT1 | 565 | 0.37 | 0.068 | YES |
| 10 | MYBL2 | MYBL2 | MYBL2 | 571 | 0.36 | 0.077 | YES |
| 11 | HIST1H4A | HIST1H4A | HIST1H4A | 605 | 0.36 | 0.084 | YES |
| 12 | DNA2 | DNA2 | DNA2 | 662 | 0.34 | 0.089 | YES |
| 13 | CENPJ | CENPJ | CENPJ | 672 | 0.34 | 0.097 | YES |
| 14 | CDK4 | CDK4 | CDK4 | 683 | 0.34 | 0.1 | YES |
| 15 | HIST1H2BG | HIST1H2BG | HIST1H2BG | 732 | 0.33 | 0.11 | YES |
| 16 | CDC45 | CDC45 | CDC45 | 738 | 0.32 | 0.12 | YES |
| 17 | CENPI | CENPI | CENPI | 753 | 0.32 | 0.13 | YES |
| 18 | SPC25 | SPC25 | SPC25 | 765 | 0.32 | 0.13 | YES |
| 19 | CDCA8 | CDCA8 | CDCA8 | 802 | 0.31 | 0.14 | YES |
| 20 | NEK2 | NEK2 | NEK2 | 804 | 0.31 | 0.15 | YES |
| 21 | CENPM | CENPM | CENPM | 850 | 0.3 | 0.15 | YES |
| 22 | REC8 | REC8 | REC8 | 856 | 0.3 | 0.16 | YES |
| 23 | CENPA | CENPA | CENPA | 860 | 0.3 | 0.17 | YES |
| 24 | NUF2 | NUF2 | NUF2 | 869 | 0.3 | 0.17 | YES |
| 25 | SKA1 | SKA1 | SKA1 | 870 | 0.3 | 0.18 | YES |
| 26 | HIST1H4E | HIST1H4E | HIST1H4E | 886 | 0.3 | 0.19 | YES |
| 27 | UBE2C | UBE2C | UBE2C | 937 | 0.29 | 0.19 | YES |
| 28 | BIRC5 | BIRC5 | BIRC5 | 956 | 0.29 | 0.2 | YES |
| 29 | KIF2C | KIF2C | KIF2C | 967 | 0.29 | 0.21 | YES |
| 30 | PLK1 | PLK1 | PLK1 | 988 | 0.28 | 0.21 | YES |
| 31 | KIF20A | KIF20A | KIF20A | 996 | 0.28 | 0.22 | YES |
| 32 | MAD2L1 | MAD2L1 | MAD2L1 | 1060 | 0.27 | 0.22 | YES |
| 33 | PPP2R3B | PPP2R3B | PPP2R3B | 1073 | 0.27 | 0.23 | YES |
| 34 | PLK4 | PLK4 | PLK4 | 1103 | 0.27 | 0.23 | YES |
| 35 | CCNB2 | CCNB2 | CCNB2 | 1115 | 0.27 | 0.24 | YES |
| 36 | BUB1B | BUB1B | BUB1B | 1159 | 0.26 | 0.24 | YES |
| 37 | HJURP | HJURP | HJURP | 1176 | 0.26 | 0.25 | YES |
| 38 | CDKN2A | CDKN2A | CDKN2A | 1179 | 0.26 | 0.26 | YES |
| 39 | HIST1H4C | HIST1H4C | HIST1H4C | 1191 | 0.26 | 0.26 | YES |
| 40 | CCND1 | CCND1 | CCND1 | 1210 | 0.25 | 0.27 | YES |
| 41 | KIF18A | KIF18A | KIF18A | 1213 | 0.25 | 0.27 | YES |
| 42 | ERCC6L | ERCC6L | ERCC6L | 1227 | 0.25 | 0.28 | YES |
| 43 | CENPH | CENPH | CENPH | 1281 | 0.25 | 0.28 | YES |
| 44 | CDC7 | CDC7 | CDC7 | 1288 | 0.24 | 0.29 | YES |
| 45 | BUB1 | BUB1 | BUB1 | 1291 | 0.24 | 0.29 | YES |
| 46 | CCNA2 | CCNA2 | CCNA2 | 1313 | 0.24 | 0.3 | YES |
| 47 | LMNB1 | LMNB1 | LMNB1 | 1321 | 0.24 | 0.3 | YES |
| 48 | HIST1H2BL | HIST1H2BL | HIST1H2BL | 1327 | 0.24 | 0.31 | YES |
| 49 | NDC80 | NDC80 | NDC80 | 1334 | 0.24 | 0.32 | YES |
| 50 | CDT1 | CDT1 | CDT1 | 1340 | 0.24 | 0.32 | YES |
| 51 | CDC20 | CDC20 | CDC20 | 1343 | 0.24 | 0.33 | YES |
| 52 | HIST1H2AB | HIST1H2AB | HIST1H2AB | 1350 | 0.24 | 0.33 | YES |
| 53 | ZWINT | ZWINT | ZWINT | 1354 | 0.24 | 0.34 | YES |
| 54 | OIP5 | OIP5 | OIP5 | 1366 | 0.24 | 0.34 | YES |
| 55 | MLF1IP | MLF1IP | MLF1IP | 1375 | 0.23 | 0.35 | YES |
| 56 | HIST1H2BF | HIST1H2BF | HIST1H2BF | 1395 | 0.23 | 0.35 | YES |
| 57 | HIST2H2AC | HIST2H2AC | HIST2H2AC | 1409 | 0.23 | 0.36 | YES |
| 58 | HIST1H2AE | HIST1H2AE | HIST1H2AE | 1461 | 0.22 | 0.36 | YES |
| 59 | HIST1H2BI | HIST1H2BI | HIST1H2BI | 1499 | 0.22 | 0.36 | YES |
| 60 | E2F1 | E2F1 | E2F1 | 1521 | 0.22 | 0.37 | YES |
| 61 | HIST3H2BB | HIST3H2BB | HIST3H2BB | 1535 | 0.22 | 0.37 | YES |
| 62 | CEP135 | CEP135 | CEP135 | 1583 | 0.21 | 0.38 | YES |
| 63 | CDK1 | CDK1 | CDK1 | 1599 | 0.21 | 0.38 | YES |
| 64 | SGOL2 | SGOL2 | SGOL2 | 1640 | 0.21 | 0.38 | YES |
| 65 | AURKA | AURKA | AURKA | 1649 | 0.21 | 0.39 | YES |
| 66 | LIN9 | LIN9 | LIN9 | 1664 | 0.21 | 0.39 | YES |
| 67 | PTTG1 | PTTG1 | PTTG1 | 1680 | 0.2 | 0.4 | YES |
| 68 | HIST1H2BH | HIST1H2BH | HIST1H2BH | 1705 | 0.2 | 0.4 | YES |
| 69 | CCNE2 | CCNE2 | CCNE2 | 1707 | 0.2 | 0.41 | YES |
| 70 | CDC6 | CDC6 | CDC6 | 1737 | 0.2 | 0.41 | YES |
| 71 | CEP72 | CEP72 | CEP72 | 1744 | 0.2 | 0.41 | YES |
| 72 | GINS2 | GINS2 | GINS2 | 1775 | 0.2 | 0.42 | YES |
| 73 | KIF23 | KIF23 | KIF23 | 1814 | 0.19 | 0.42 | YES |
| 74 | HIST1H2BO | HIST1H2BO | HIST1H2BO | 1851 | 0.19 | 0.42 | YES |
| 75 | FBXO5 | FBXO5 | FBXO5 | 1862 | 0.19 | 0.43 | YES |
| 76 | HIST1H2BN | HIST1H2BN | HIST1H2BN | 1882 | 0.19 | 0.43 | YES |
| 77 | CHEK2 | CHEK2 | CHEK2 | 1938 | 0.18 | 0.43 | YES |
| 78 | INCENP | INCENP | INCENP | 1985 | 0.18 | 0.43 | YES |
| 79 | MCM8 | MCM8 | MCM8 | 1990 | 0.18 | 0.44 | YES |
| 80 | HIST1H4F | HIST1H4F | HIST1H4F | 2048 | 0.17 | 0.44 | YES |
| 81 | CHEK1 | CHEK1 | CHEK1 | 2070 | 0.17 | 0.44 | YES |
| 82 | CSNK1E | CSNK1E | CSNK1E | 2086 | 0.17 | 0.45 | YES |
| 83 | CDKN2B | CDKN2B | CDKN2B | 2110 | 0.17 | 0.45 | YES |
| 84 | RFC3 | RFC3 | RFC3 | 2112 | 0.17 | 0.45 | YES |
| 85 | E2F3 | E2F3 | E2F3 | 2128 | 0.17 | 0.46 | YES |
| 86 | POLE | POLE | POLE | 2133 | 0.17 | 0.46 | YES |
| 87 | RRM2 | RRM2 | RRM2 | 2148 | 0.17 | 0.46 | YES |
| 88 | HIST1H4B | HIST1H4B | HIST1H4B | 2162 | 0.17 | 0.47 | YES |
| 89 | DBF4 | DBF4 | DBF4 | 2235 | 0.16 | 0.47 | YES |
| 90 | RPA4 | RPA4 | RPA4 | 2268 | 0.16 | 0.47 | YES |
| 91 | PRIM1 | PRIM1 | PRIM1 | 2270 | 0.16 | 0.47 | YES |
| 92 | GINS1 | GINS1 | GINS1 | 2301 | 0.16 | 0.48 | YES |
| 93 | CCNB1 | CCNB1 | CCNB1 | 2331 | 0.16 | 0.48 | YES |
| 94 | DHFR | DHFR | DHFR | 2410 | 0.15 | 0.48 | YES |
| 95 | CCDC99 | CCDC99 | CCDC99 | 2424 | 0.15 | 0.48 | YES |
| 96 | AZI1 | AZI1 | AZI1 | 2430 | 0.15 | 0.48 | YES |
| 97 | CENPK | CENPK | CENPK | 2444 | 0.15 | 0.49 | YES |
| 98 | POLE2 | POLE2 | POLE2 | 2477 | 0.14 | 0.49 | YES |
| 99 | HIST1H2BB | HIST1H2BB | HIST1H2BB | 2508 | 0.14 | 0.49 | YES |
| 100 | CENPN | CENPN | CENPN | 2561 | 0.14 | 0.49 | YES |
| 101 | MDM2 | MDM2 | MDM2 | 2567 | 0.14 | 0.5 | YES |
| 102 | DCTN2 | DCTN2 | DCTN2 | 2585 | 0.14 | 0.5 | YES |
| 103 | CENPO | CENPO | CENPO | 2592 | 0.14 | 0.5 | YES |
| 104 | HIST1H2BM | HIST1H2BM | HIST1H2BM | 2623 | 0.14 | 0.5 | YES |
| 105 | MCM2 | MCM2 | MCM2 | 2642 | 0.14 | 0.5 | YES |
| 106 | ZWILCH | ZWILCH | ZWILCH | 2649 | 0.14 | 0.51 | YES |
| 107 | MCM7 | MCM7 | MCM7 | 2726 | 0.13 | 0.51 | YES |
| 108 | POLA2 | POLA2 | POLA2 | 2727 | 0.13 | 0.51 | YES |
| 109 | MYC | MYC | MYC | 2730 | 0.13 | 0.51 | YES |
| 110 | TYMS | TYMS | TYMS | 2846 | 0.13 | 0.51 | YES |
| 111 | CDC26 | CDC26 | CDC26 | 2879 | 0.12 | 0.51 | YES |
| 112 | PRIM2 | PRIM2 | PRIM2 | 2916 | 0.12 | 0.51 | YES |
| 113 | NINL | NINL | NINL | 2986 | 0.12 | 0.51 | YES |
| 114 | HIST1H2BJ | HIST1H2BJ | HIST1H2BJ | 2999 | 0.12 | 0.51 | YES |
| 115 | RBL1 | RBL1 | RBL1 | 3017 | 0.12 | 0.52 | YES |
| 116 | RFC4 | RFC4 | RFC4 | 3053 | 0.12 | 0.52 | YES |
| 117 | HIST2H4A | HIST2H4A | HIST2H4A | 3095 | 0.12 | 0.52 | YES |
| 118 | GINS4 | GINS4 | GINS4 | 3108 | 0.11 | 0.52 | YES |
| 119 | KIF2A | KIF2A | KIF2A | 3143 | 0.11 | 0.52 | YES |
| 120 | HIST1H2AD | HIST1H2AD | HIST1H2AD | 3158 | 0.11 | 0.52 | YES |
| 121 | CDKN2D | CDKN2D | CDKN2D | 3170 | 0.11 | 0.52 | YES |
| 122 | WRAP53 | WRAP53 | WRAP53 | 3224 | 0.11 | 0.52 | YES |
| 123 | KNTC1 | KNTC1 | KNTC1 | 3293 | 0.11 | 0.52 | YES |
| 124 | CCND2 | CCND2 | CCND2 | 3306 | 0.11 | 0.52 | YES |
| 125 | NUP107 | NUP107 | NUP107 | 3390 | 0.1 | 0.52 | YES |
| 126 | FEN1 | FEN1 | FEN1 | 3437 | 0.1 | 0.52 | YES |
| 127 | HIST1H2BE | HIST1H2BE | HIST1H2BE | 3499 | 0.1 | 0.52 | YES |
| 128 | PPP2R2A | PPP2R2A | PPP2R2A | 3503 | 0.1 | 0.52 | YES |
| 129 | H2AFX | H2AFX | H2AFX | 3554 | 0.098 | 0.52 | YES |
| 130 | CKS1B | CKS1B | CKS1B | 3555 | 0.098 | 0.53 | YES |
| 131 | RCC2 | RCC2 | RCC2 | 3556 | 0.098 | 0.53 | YES |
| 132 | H2AFZ | H2AFZ | H2AFZ | 3646 | 0.095 | 0.53 | YES |
| 133 | TUBB | TUBB | TUBB | 3674 | 0.094 | 0.53 | YES |
| 134 | DCTN3 | DCTN3 | DCTN3 | 3713 | 0.093 | 0.53 | YES |
| 135 | ACTR1A | ACTR1A | ACTR1A | 3714 | 0.093 | 0.53 | YES |
| 136 | SYNE1 | SYNE1 | SYNE1 | 3726 | 0.092 | 0.53 | YES |
| 137 | TUBA1A | TUBA1A | TUBA1A | 3738 | 0.092 | 0.53 | YES |
| 138 | BUB3 | BUB3 | BUB3 | 3776 | 0.09 | 0.53 | YES |
| 139 | HIST1H4D | HIST1H4D | HIST1H4D | 3778 | 0.09 | 0.54 | YES |
| 140 | BTRC | BTRC | BTRC | 3810 | 0.089 | 0.54 | YES |
| 141 | MCM4 | MCM4 | MCM4 | 3820 | 0.089 | 0.54 | YES |
| 142 | CEP57 | CEP57 | CEP57 | 3827 | 0.089 | 0.54 | YES |
| 143 | SMC3 | SMC3 | SMC3 | 3845 | 0.088 | 0.54 | YES |
| 144 | STAG3 | STAG3 | STAG3 | 3901 | 0.086 | 0.54 | YES |
| 145 | RANGAP1 | RANGAP1 | RANGAP1 | 3912 | 0.086 | 0.54 | YES |
| 146 | CENPL | CENPL | CENPL | 3948 | 0.085 | 0.54 | YES |
| 147 | POLD1 | POLD1 | POLD1 | 3985 | 0.084 | 0.54 | YES |
| 148 | RFC5 | RFC5 | RFC5 | 3996 | 0.083 | 0.54 | YES |
| 149 | PRKAR2B | PRKAR2B | PRKAR2B | 4012 | 0.083 | 0.55 | YES |
| 150 | LIG1 | LIG1 | LIG1 | 4022 | 0.083 | 0.55 | YES |
| 151 | DSN1 | DSN1 | DSN1 | 4064 | 0.082 | 0.55 | YES |
| 152 | SKA2 | SKA2 | SKA2 | 4071 | 0.082 | 0.55 | YES |
| 153 | BRCA1 | BRCA1 | BRCA1 | 4074 | 0.082 | 0.55 | YES |
| 154 | CENPP | CENPP | CENPP | 4078 | 0.082 | 0.55 | YES |
| 155 | HIST2H2BE | HIST2H2BE | HIST2H2BE | 4174 | 0.079 | 0.55 | NO |
| 156 | CEP63 | CEP63 | CEP63 | 4180 | 0.078 | 0.55 | NO |
| 157 | SKP2 | SKP2 | SKP2 | 4324 | 0.075 | 0.54 | NO |
| 158 | MCM5 | MCM5 | MCM5 | 4334 | 0.074 | 0.55 | NO |
| 159 | TUBG1 | TUBG1 | TUBG1 | 4370 | 0.073 | 0.55 | NO |
| 160 | TAOK1 | TAOK1 | TAOK1 | 4421 | 0.072 | 0.54 | NO |
| 161 | PPP2R5D | PPP2R5D | PPP2R5D | 4476 | 0.071 | 0.54 | NO |
| 162 | UBE2I | UBE2I | UBE2I | 4610 | 0.068 | 0.54 | NO |
| 163 | CEP70 | CEP70 | CEP70 | 4628 | 0.067 | 0.54 | NO |
| 164 | NUMA1 | NUMA1 | NUMA1 | 4693 | 0.066 | 0.54 | NO |
| 165 | RAD21 | RAD21 | RAD21 | 4715 | 0.065 | 0.54 | NO |
| 166 | E2F5 | E2F5 | E2F5 | 4735 | 0.065 | 0.54 | NO |
| 167 | RAD1 | RAD1 | RAD1 | 4744 | 0.065 | 0.54 | NO |
| 168 | RSF1 | RSF1 | RSF1 | 4751 | 0.064 | 0.54 | NO |
| 169 | CCNA1 | CCNA1 | CCNA1 | 4801 | 0.064 | 0.54 | NO |
| 170 | PSMD3 | PSMD3 | PSMD3 | 4810 | 0.063 | 0.54 | NO |
| 171 | MCM6 | MCM6 | MCM6 | 4854 | 0.063 | 0.54 | NO |
| 172 | CCNE1 | CCNE1 | CCNE1 | 4876 | 0.062 | 0.54 | NO |
| 173 | PSMB7 | PSMB7 | PSMB7 | 4880 | 0.062 | 0.54 | NO |
| 174 | MAD1L1 | MAD1L1 | MAD1L1 | 4921 | 0.061 | 0.54 | NO |
| 175 | ATRIP | ATRIP | ATRIP | 4957 | 0.06 | 0.54 | NO |
| 176 | ACD | ACD | ACD | 4983 | 0.06 | 0.54 | NO |
| 177 | ALMS1 | ALMS1 | ALMS1 | 5034 | 0.059 | 0.54 | NO |
| 178 | CENPC1 | CENPC1 | CENPC1 | 5058 | 0.058 | 0.54 | NO |
| 179 | CDKN1B | CDKN1B | CDKN1B | 5078 | 0.058 | 0.54 | NO |
| 180 | CENPQ | CENPQ | CENPQ | 5092 | 0.058 | 0.54 | NO |
| 181 | PCNA | PCNA | PCNA | 5204 | 0.055 | 0.53 | NO |
| 182 | SMC1A | SMC1A | SMC1A | 5224 | 0.055 | 0.54 | NO |
| 183 | CENPT | CENPT | CENPT | 5327 | 0.054 | 0.53 | NO |
| 184 | CKAP5 | CKAP5 | CKAP5 | 5376 | 0.053 | 0.53 | NO |
| 185 | ITGB3BP | ITGB3BP | ITGB3BP | 5426 | 0.052 | 0.53 | NO |
| 186 | MAPRE1 | MAPRE1 | MAPRE1 | 5500 | 0.05 | 0.52 | NO |
| 187 | POLD3 | POLD3 | POLD3 | 5511 | 0.05 | 0.52 | NO |
| 188 | TUBGCP6 | TUBGCP6 | TUBGCP6 | 5528 | 0.05 | 0.53 | NO |
| 189 | UBE2D1 | UBE2D1 | UBE2D1 | 5553 | 0.05 | 0.53 | NO |
| 190 | NUP43 | NUP43 | NUP43 | 5611 | 0.049 | 0.52 | NO |
| 191 | PSMD11 | PSMD11 | PSMD11 | 5614 | 0.049 | 0.52 | NO |
| 192 | RFWD2 | RFWD2 | RFWD2 | 5620 | 0.048 | 0.53 | NO |
| 193 | RBBP4 | RBBP4 | RBBP4 | 5621 | 0.048 | 0.53 | NO |
| 194 | FKBP6 | FKBP6 | FKBP6 | 5663 | 0.048 | 0.53 | NO |
| 195 | POLA1 | POLA1 | POLA1 | 5765 | 0.046 | 0.52 | NO |
| 196 | CEP76 | CEP76 | CEP76 | 5810 | 0.045 | 0.52 | NO |
| 197 | GMNN | GMNN | GMNN | 5874 | 0.044 | 0.52 | NO |
| 198 | CLASP1 | CLASP1 | CLASP1 | 5913 | 0.044 | 0.52 | NO |
| 199 | MIS12 | MIS12 | MIS12 | 5920 | 0.044 | 0.52 | NO |
| 200 | CDC25B | CDC25B | CDC25B | 5946 | 0.043 | 0.52 | NO |
| 201 | ANAPC1 | ANAPC1 | ANAPC1 | 5969 | 0.043 | 0.52 | NO |
| 202 | ANAPC7 | ANAPC7 | ANAPC7 | 5975 | 0.043 | 0.52 | NO |
| 203 | DKC1 | DKC1 | DKC1 | 6037 | 0.042 | 0.52 | NO |
| 204 | SUN2 | SUN2 | SUN2 | 6060 | 0.042 | 0.52 | NO |
| 205 | TERF2 | TERF2 | TERF2 | 6107 | 0.041 | 0.51 | NO |
| 206 | TUBGCP3 | TUBGCP3 | TUBGCP3 | 6132 | 0.041 | 0.51 | NO |
| 207 | CDK5RAP2 | CDK5RAP2 | CDK5RAP2 | 6146 | 0.04 | 0.51 | NO |
| 208 | RUVBL1 | RUVBL1 | RUVBL1 | 6164 | 0.04 | 0.51 | NO |
| 209 | HIST1H2AJ | HIST1H2AJ | HIST1H2AJ | 6270 | 0.038 | 0.51 | NO |
| 210 | PPP2R5B | PPP2R5B | PPP2R5B | 6273 | 0.038 | 0.51 | NO |
| 211 | SEC13 | SEC13 | SEC13 | 6329 | 0.037 | 0.51 | NO |
| 212 | TERF2IP | TERF2IP | TERF2IP | 6408 | 0.036 | 0.5 | NO |
| 213 | DCTN1 | DCTN1 | DCTN1 | 6543 | 0.034 | 0.5 | NO |
| 214 | ZW10 | ZW10 | ZW10 | 6580 | 0.034 | 0.5 | NO |
| 215 | MCM3 | MCM3 | MCM3 | 6596 | 0.034 | 0.5 | NO |
| 216 | CEP250 | CEP250 | CEP250 | 6601 | 0.034 | 0.5 | NO |
| 217 | HIST1H4I | HIST1H4I | HIST1H4I | 6630 | 0.033 | 0.5 | NO |
| 218 | DIDO1 | DIDO1 | DIDO1 | 6663 | 0.033 | 0.5 | NO |
| 219 | PAFAH1B1 | PAFAH1B1 | PAFAH1B1 | 6705 | 0.032 | 0.49 | NO |
| 220 | SMARCA5 | SMARCA5 | SMARCA5 | 6712 | 0.032 | 0.49 | NO |
| 221 | LIN54 | LIN54 | LIN54 | 6721 | 0.032 | 0.49 | NO |
| 222 | CCNH | CCNH | CCNH | 6757 | 0.032 | 0.49 | NO |
| 223 | PCNT | PCNT | PCNT | 6799 | 0.031 | 0.49 | NO |
| 224 | CDKN2C | CDKN2C | CDKN2C | 6817 | 0.031 | 0.49 | NO |
| 225 | CDC23 | CDC23 | CDC23 | 6843 | 0.03 | 0.49 | NO |
| 226 | TERF1 | TERF1 | TERF1 | 6924 | 0.03 | 0.49 | NO |
| 227 | CDC27 | CDC27 | CDC27 | 6980 | 0.029 | 0.48 | NO |
| 228 | ANAPC5 | ANAPC5 | ANAPC5 | 6998 | 0.029 | 0.48 | NO |
| 229 | PSMD2 | PSMD2 | PSMD2 | 7102 | 0.028 | 0.48 | NO |
| 230 | PPP2R1A | PPP2R1A | PPP2R1A | 7103 | 0.028 | 0.48 | NO |
| 231 | TERT | TERT | TERT | 7105 | 0.028 | 0.48 | NO |
| 232 | ANAPC2 | ANAPC2 | ANAPC2 | 7118 | 0.027 | 0.48 | NO |
| 233 | PPP2R1B | PPP2R1B | PPP2R1B | 7139 | 0.027 | 0.48 | NO |
| 234 | CEP192 | CEP192 | CEP192 | 7145 | 0.027 | 0.48 | NO |
| 235 | CDK2 | CDK2 | CDK2 | 7151 | 0.027 | 0.48 | NO |
| 236 | PSMB6 | PSMB6 | PSMB6 | 7187 | 0.026 | 0.48 | NO |
| 237 | TUBGCP2 | TUBGCP2 | TUBGCP2 | 7236 | 0.026 | 0.48 | NO |
| 238 | DYNC1I2 | DYNC1I2 | DYNC1I2 | 7275 | 0.025 | 0.48 | NO |
| 239 | TEX12 | TEX12 | TEX12 | 7286 | 0.025 | 0.48 | NO |
| 240 | NHP2 | NHP2 | NHP2 | 7381 | 0.024 | 0.47 | NO |
| 241 | CEP290 | CEP290 | CEP290 | 7398 | 0.024 | 0.47 | NO |
| 242 | PSMB3 | PSMB3 | PSMB3 | 7447 | 0.023 | 0.47 | NO |
| 243 | UBE2E1 | UBE2E1 | UBE2E1 | 7461 | 0.023 | 0.47 | NO |
| 244 | HIST4H4 | HIST4H4 | HIST4H4 | 7474 | 0.023 | 0.47 | NO |
| 245 | PPP2R5E | PPP2R5E | PPP2R5E | 7539 | 0.022 | 0.47 | NO |
| 246 | PSMB2 | PSMB2 | PSMB2 | 7540 | 0.022 | 0.47 | NO |
| 247 | YWHAE | YWHAE | YWHAE | 7564 | 0.022 | 0.47 | NO |
| 248 | RAD9A | RAD9A | RAD9A | 7625 | 0.021 | 0.46 | NO |
| 249 | STAG1 | STAG1 | STAG1 | 7627 | 0.021 | 0.46 | NO |
| 250 | ANAPC11 | ANAPC11 | ANAPC11 | 7649 | 0.02 | 0.46 | NO |
| 251 | SYNE2 | SYNE2 | SYNE2 | 7703 | 0.02 | 0.46 | NO |
| 252 | NSL1 | NSL1 | NSL1 | 7726 | 0.02 | 0.46 | NO |
| 253 | LIN52 | LIN52 | LIN52 | 7779 | 0.019 | 0.46 | NO |
| 254 | PSMD10 | PSMD10 | PSMD10 | 7801 | 0.019 | 0.46 | NO |
| 255 | PPP1CC | PPP1CC | PPP1CC | 7828 | 0.018 | 0.46 | NO |
| 256 | PMF1 | PMF1 | PMF1 | 7928 | 0.017 | 0.45 | NO |
| 257 | PSMD4 | PSMD4 | PSMD4 | 7961 | 0.017 | 0.45 | NO |
| 258 | XPO1 | XPO1 | XPO1 | 7986 | 0.016 | 0.45 | NO |
| 259 | SSNA1 | SSNA1 | SSNA1 | 8001 | 0.016 | 0.45 | NO |
| 260 | NUP85 | NUP85 | NUP85 | 8109 | 0.015 | 0.44 | NO |
| 261 | NPM1 | NPM1 | NPM1 | 8113 | 0.015 | 0.44 | NO |
| 262 | PPP2CA | PPP2CA | PPP2CA | 8148 | 0.015 | 0.44 | NO |
| 263 | NUP133 | NUP133 | NUP133 | 8173 | 0.014 | 0.44 | NO |
| 264 | NEDD1 | NEDD1 | NEDD1 | 8230 | 0.014 | 0.44 | NO |
| 265 | ATM | ATM | ATM | 8275 | 0.013 | 0.44 | NO |
| 266 | PSMD6 | PSMD6 | PSMD6 | 8285 | 0.013 | 0.43 | NO |
| 267 | DYNC1H1 | DYNC1H1 | DYNC1H1 | 8317 | 0.012 | 0.43 | NO |
| 268 | CCND3 | CCND3 | CCND3 | 8398 | 0.011 | 0.43 | NO |
| 269 | YWHAG | YWHAG | YWHAG | 8521 | 0.0094 | 0.42 | NO |
| 270 | RUVBL2 | RUVBL2 | RUVBL2 | 8533 | 0.0091 | 0.42 | NO |
| 271 | HIST1H2BC | HIST1H2BC | HIST1H2BC | 8581 | 0.0087 | 0.42 | NO |
| 272 | NUDC | NUDC | NUDC | 8662 | 0.0077 | 0.42 | NO |
| 273 | DYRK1A | DYRK1A | DYRK1A | 8718 | 0.0068 | 0.41 | NO |
| 274 | E2F4 | E2F4 | E2F4 | 8769 | 0.0062 | 0.41 | NO |
| 275 | STAG2 | STAG2 | STAG2 | 8809 | 0.0056 | 0.41 | NO |
| 276 | LIN37 | LIN37 | LIN37 | 8814 | 0.0056 | 0.41 | NO |
| 277 | PSMD1 | PSMD1 | PSMD1 | 8837 | 0.0053 | 0.41 | NO |
| 278 | CEP164 | CEP164 | CEP164 | 8868 | 0.0049 | 0.4 | NO |
| 279 | PCM1 | PCM1 | PCM1 | 8959 | 0.0039 | 0.4 | NO |
| 280 | PSMB5 | PSMB5 | PSMB5 | 9004 | 0.0034 | 0.4 | NO |
| 281 | RBL2 | RBL2 | RBL2 | 9141 | 0.0015 | 0.39 | NO |
| 282 | RAD17 | RAD17 | RAD17 | 9216 | 0.00066 | 0.39 | NO |
| 283 | RPA1 | RPA1 | RPA1 | 9256 | 0.00022 | 0.38 | NO |
| 284 | PSMA7 | PSMA7 | PSMA7 | 9321 | -0.00068 | 0.38 | NO |
| 285 | PSMA4 | PSMA4 | PSMA4 | 9323 | -0.0007 | 0.38 | NO |
| 286 | DYNLL1 | DYNLL1 | DYNLL1 | 9371 | -0.0013 | 0.38 | NO |
| 287 | PSMD14 | PSMD14 | PSMD14 | 9469 | -0.0025 | 0.37 | NO |
| 288 | HIST1H4H | HIST1H4H | HIST1H4H | 9581 | -0.0038 | 0.37 | NO |
| 289 | FGFR1OP | FGFR1OP | FGFR1OP | 9648 | -0.0045 | 0.36 | NO |
| 290 | GORASP1 | GORASP1 | GORASP1 | 9735 | -0.0056 | 0.36 | NO |
| 291 | PSMD7 | PSMD7 | PSMD7 | 9742 | -0.0056 | 0.36 | NO |
| 292 | MNAT1 | MNAT1 | MNAT1 | 9747 | -0.0057 | 0.36 | NO |
| 293 | PSMB1 | PSMB1 | PSMB1 | 9812 | -0.0065 | 0.35 | NO |
| 294 | RBBP7 | RBBP7 | RBBP7 | 9839 | -0.0069 | 0.35 | NO |
| 295 | PPP2R5C | PPP2R5C | PPP2R5C | 9860 | -0.0072 | 0.35 | NO |
| 296 | CDK6 | CDK6 | CDK6 | 9867 | -0.0073 | 0.35 | NO |
| 297 | PSME4 | PSME4 | PSME4 | 9874 | -0.0074 | 0.35 | NO |
| 298 | AKAP9 | AKAP9 | AKAP9 | 9941 | -0.0084 | 0.35 | NO |
| 299 | RB1 | RB1 | RB1 | 9968 | -0.0088 | 0.35 | NO |
| 300 | RPA2 | RPA2 | RPA2 | 10018 | -0.0096 | 0.34 | NO |
| 301 | PSMB4 | PSMB4 | PSMB4 | 10061 | -0.01 | 0.34 | NO |
| 302 | SEH1L | SEH1L | SEH1L | 10071 | -0.01 | 0.34 | NO |
| 303 | PSMC3 | PSMC3 | PSMC3 | 10166 | -0.012 | 0.34 | NO |
| 304 | PSMF1 | PSMF1 | PSMF1 | 10206 | -0.012 | 0.34 | NO |
| 305 | UBA52 | UBA52 | UBA52 | 10240 | -0.012 | 0.33 | NO |
| 306 | PSMD8 | PSMD8 | PSMD8 | 10290 | -0.013 | 0.33 | NO |
| 307 | RFC2 | RFC2 | RFC2 | 10352 | -0.014 | 0.33 | NO |
| 308 | PPP2CB | PPP2CB | PPP2CB | 10382 | -0.014 | 0.33 | NO |
| 309 | HIST1H2AC | HIST1H2AC | HIST1H2AC | 10411 | -0.015 | 0.32 | NO |
| 310 | ATR | ATR | ATR | 10455 | -0.015 | 0.32 | NO |
| 311 | POLD2 | POLD2 | POLD2 | 10505 | -0.016 | 0.32 | NO |
| 312 | RANBP2 | RANBP2 | RANBP2 | 10508 | -0.016 | 0.32 | NO |
| 313 | PSMC4 | PSMC4 | PSMC4 | 10516 | -0.016 | 0.32 | NO |
| 314 | RPA3 | RPA3 | RPA3 | 10532 | -0.016 | 0.32 | NO |
| 315 | PSMA6 | PSMA6 | PSMA6 | 10533 | -0.016 | 0.32 | NO |
| 316 | CSNK1D | CSNK1D | CSNK1D | 10609 | -0.017 | 0.32 | NO |
| 317 | PSMA5 | PSMA5 | PSMA5 | 10715 | -0.019 | 0.31 | NO |
| 318 | PSMD12 | PSMD12 | PSMD12 | 10787 | -0.02 | 0.31 | NO |
| 319 | PSMA2 | PSMA2 | PSMA2 | 10921 | -0.022 | 0.3 | NO |
| 320 | HIST1H2BD | HIST1H2BD | HIST1H2BD | 10941 | -0.022 | 0.3 | NO |
| 321 | RPS27 | RPS27 | RPS27 | 11012 | -0.023 | 0.3 | NO |
| 322 | PSMC5 | PSMC5 | PSMC5 | 11025 | -0.023 | 0.3 | NO |
| 323 | RPS27A | RPS27A | RPS27A | 11126 | -0.024 | 0.29 | NO |
| 324 | PSMD13 | PSMD13 | PSMD13 | 11151 | -0.024 | 0.29 | NO |
| 325 | SMC1B | SMC1B | SMC1B | 11153 | -0.024 | 0.29 | NO |
| 326 | ANAPC4 | ANAPC4 | ANAPC4 | 11228 | -0.025 | 0.29 | NO |
| 327 | HIST2H2AA3 | HIST2H2AA3 | HIST2H2AA3 | 11258 | -0.026 | 0.29 | NO |
| 328 | TFDP1 | TFDP1 | TFDP1 | 11264 | -0.026 | 0.29 | NO |
| 329 | AHCTF1 | AHCTF1 | AHCTF1 | 11348 | -0.027 | 0.28 | NO |
| 330 | PSMC6 | PSMC6 | PSMC6 | 11658 | -0.032 | 0.27 | NO |
| 331 | HDAC1 | HDAC1 | HDAC1 | 11661 | -0.032 | 0.27 | NO |
| 332 | PSMC2 | PSMC2 | PSMC2 | 11763 | -0.033 | 0.26 | NO |
| 333 | TP53 | TP53 | TP53 | 11824 | -0.034 | 0.26 | NO |
| 334 | HIST1H4J | HIST1H4J | HIST1H4J | 11837 | -0.034 | 0.26 | NO |
| 335 | APITD1 | APITD1 | APITD1 | 11842 | -0.034 | 0.26 | NO |
| 336 | CDC16 | CDC16 | CDC16 | 11943 | -0.036 | 0.26 | NO |
| 337 | HSP90AA1 | HSP90AA1 | HSP90AA1 | 11967 | -0.036 | 0.26 | NO |
| 338 | PRKACA | PRKACA | PRKACA | 12068 | -0.038 | 0.25 | NO |
| 339 | HAUS2 | HAUS2 | HAUS2 | 12193 | -0.039 | 0.25 | NO |
| 340 | NDEL1 | NDEL1 | NDEL1 | 12299 | -0.041 | 0.24 | NO |
| 341 | SDCCAG8 | SDCCAG8 | SDCCAG8 | 12351 | -0.042 | 0.24 | NO |
| 342 | OFD1 | OFD1 | OFD1 | 12404 | -0.042 | 0.24 | NO |
| 343 | PSMA1 | PSMA1 | PSMA1 | 12410 | -0.043 | 0.24 | NO |
| 344 | CDK7 | CDK7 | CDK7 | 12501 | -0.044 | 0.23 | NO |
| 345 | PSMC1 | PSMC1 | PSMC1 | 12549 | -0.045 | 0.23 | NO |
| 346 | SKP1 | SKP1 | SKP1 | 12556 | -0.045 | 0.23 | NO |
| 347 | TINF2 | TINF2 | TINF2 | 12647 | -0.047 | 0.23 | NO |
| 348 | TUBG2 | TUBG2 | TUBG2 | 12648 | -0.047 | 0.23 | NO |
| 349 | CDC14A | CDC14A | CDC14A | 12726 | -0.048 | 0.23 | NO |
| 350 | CUL1 | CUL1 | CUL1 | 12808 | -0.05 | 0.22 | NO |
| 351 | PSMD5 | PSMD5 | PSMD5 | 12919 | -0.052 | 0.22 | NO |
| 352 | MAX | MAX | MAX | 13086 | -0.055 | 0.21 | NO |
| 353 | NUP37 | NUP37 | NUP37 | 13141 | -0.056 | 0.21 | NO |
| 354 | POT1 | POT1 | POT1 | 13171 | -0.057 | 0.21 | NO |
| 355 | PSMD9 | PSMD9 | PSMD9 | 13349 | -0.06 | 0.2 | NO |
| 356 | HIST1H2BK | HIST1H2BK | HIST1H2BK | 13383 | -0.061 | 0.2 | NO |
| 357 | HUS1 | HUS1 | HUS1 | 13406 | -0.062 | 0.2 | NO |
| 358 | WEE1 | WEE1 | WEE1 | 13448 | -0.062 | 0.2 | NO |
| 359 | ANAPC10 | ANAPC10 | ANAPC10 | 13778 | -0.07 | 0.18 | NO |
| 360 | PSMA3 | PSMA3 | PSMA3 | 13897 | -0.073 | 0.18 | NO |
| 361 | TUBGCP5 | TUBGCP5 | TUBGCP5 | 13963 | -0.074 | 0.18 | NO |
| 362 | PPP2R5A | PPP2R5A | PPP2R5A | 14000 | -0.075 | 0.18 | NO |
| 363 | TK2 | TK2 | TK2 | 14418 | -0.086 | 0.16 | NO |
| 364 | CETN2 | CETN2 | CETN2 | 14640 | -0.093 | 0.15 | NO |
| 365 | CLIP1 | CLIP1 | CLIP1 | 14808 | -0.098 | 0.14 | NO |
| 366 | PSMB10 | PSMB10 | PSMB10 | 15166 | -0.11 | 0.12 | NO |
| 367 | POLD4 | POLD4 | POLD4 | 15443 | -0.12 | 0.11 | NO |
| 368 | PSME1 | PSME1 | PSME1 | 15535 | -0.12 | 0.11 | NO |
| 369 | PSME2 | PSME2 | PSME2 | 15537 | -0.12 | 0.11 | NO |
| 370 | CDKN1A | CDKN1A | CDKN1A | 15669 | -0.13 | 0.11 | NO |
| 371 | PSMA8 | PSMA8 | PSMA8 | 15685 | -0.13 | 0.11 | NO |
| 372 | PSMB8 | PSMB8 | PSMB8 | 15918 | -0.14 | 0.099 | NO |
| 373 | B9D2 | B9D2 | B9D2 | 15935 | -0.14 | 0.1 | NO |
| 374 | LMNA | LMNA | LMNA | 16004 | -0.15 | 0.1 | NO |
| 375 | HSPA2 | HSPA2 | HSPA2 | 16278 | -0.16 | 0.091 | NO |
| 376 | PSMB9 | PSMB9 | PSMB9 | 16846 | -0.2 | 0.064 | NO |
| 377 | SYCP2 | SYCP2 | SYCP2 | 16999 | -0.21 | 0.061 | NO |
| 378 | TUBA4A | TUBA4A | TUBA4A | 17350 | -0.25 | 0.047 | NO |
Figure S19. Get High-res Image This plot shows mRNAseq_cNMF expression data heatmap (on the left) a RunningEnrichmentScore(RES) plot (on the top right) and a Signal2Noise(S2N) plot (on the bottom right) of genes in the pathway: PID ERA GENOMIC PATHWAY.
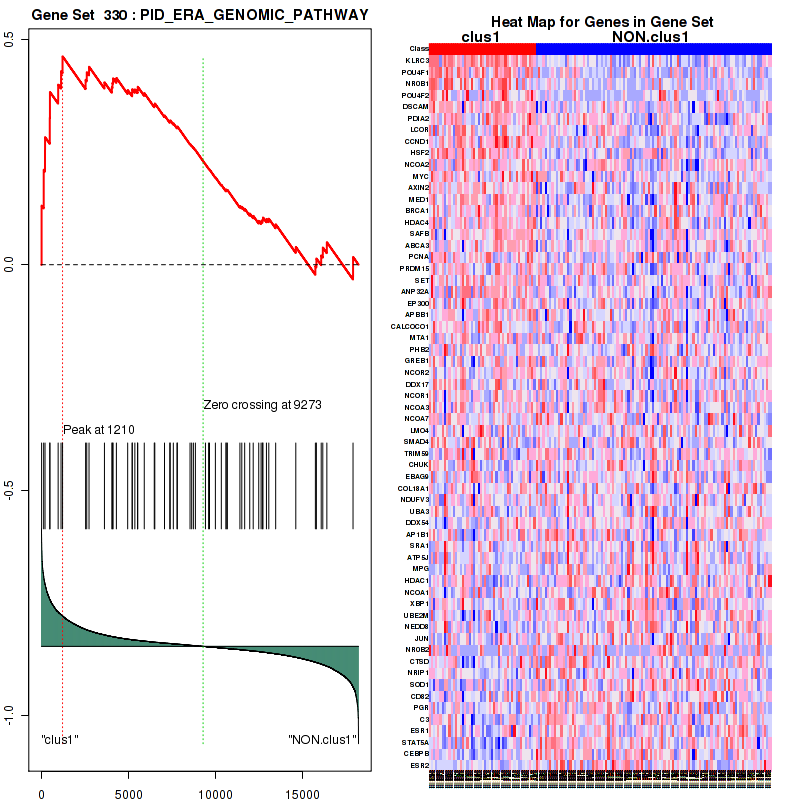
Figure S20. Get High-res Image For the top 5 core enriched genes in the pathway: PID ERA GENOMIC PATHWAY, this volcano plot shows how much they are up/down-regulated and significant. The significance was calculated by empirical bayesian fit
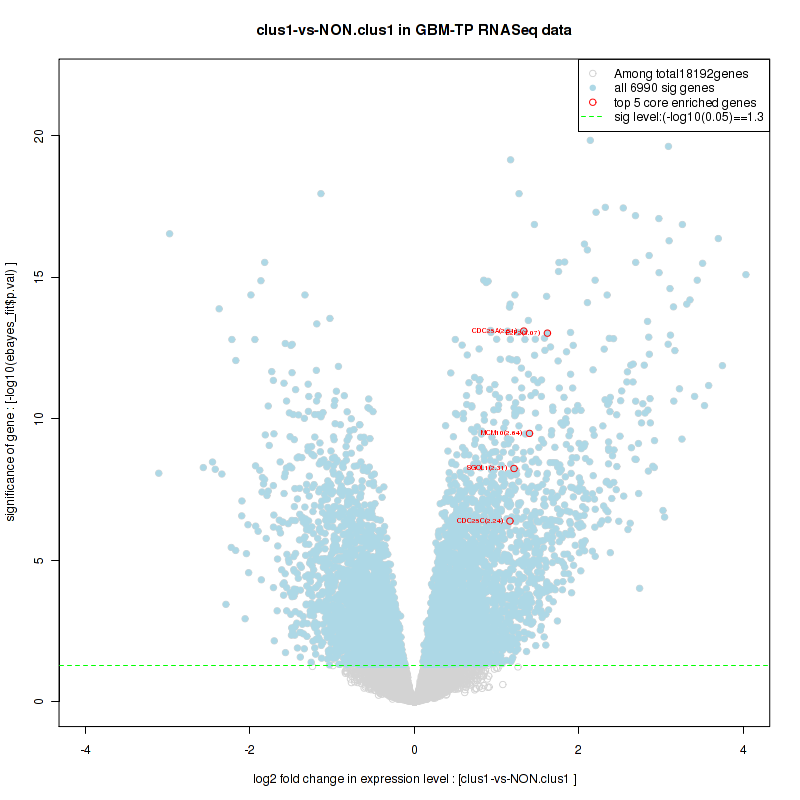
For the top enriched genes, if you want to check whether they are
-
up-regulated, please check the list of up-regulated genes
-
down-regulated, please check the list of down-regulated genes
For the top enriched genes, if you want to check whether they are
-
highly expressed genes, please check the list of high (top 30%) expressed genes
-
low expressed genes, please check the list of low (bottom 30%) expressed genes
An expression pattern of top(30%)/middle(30%)/low(30%) in this subtype against other subtypes is available in a heatmap
For the top enriched genes, if you want to check whether they are
-
significantly differently expressed genes by eBayes lm fit, please check the list of significant genes
Table 4. Get Full Table This table shows top 10 pathways which are significantly enriched in cluster clus2. It displays only significant gene sets satisfying nom.p.val.threshold (-1), fwer.p.val.threshold (-1) , fdr.q.val.threshold (0.25) and the default table is sorted by Normalized Enrichment Score (NES). Further details on NES statistics, please visit The Broad GSEA website.
| GeneSet(GS) | Size(#genes) | genes.ES.table | ES | NES | NOM.p.val | FDR.q.val | FWER.p.val | Tag.. | Gene.. | Signal | FDR..median. | glob.p.val |
|---|---|---|---|---|---|---|---|---|---|---|---|---|
| KEGG AMINO SUGAR AND NUCLEOTIDE SUGAR METABOLISM | 43 | genes.ES.table | 0.55 | 1.8 | 0.008 | 0.72 | 0.47 | 0.7 | 0.33 | 0.47 | 0 | 0.16 |
| BIOCARTA HIVNEF PATHWAY | 58 | genes.ES.table | 0.44 | 1.8 | 0.016 | 0.64 | 0.64 | 0.31 | 0.19 | 0.25 | 0.23 | 0.16 |
| BIOCARTA IL2RB PATHWAY | 38 | genes.ES.table | 0.64 | 1.7 | 0.02 | 0.5 | 0.85 | 0.4 | 0.14 | 0.34 | 0.24 | 0.13 |
| BIOCARTA DEATH PATHWAY | 33 | genes.ES.table | 0.55 | 1.7 | 0.012 | 0.42 | 0.73 | 0.48 | 0.19 | 0.39 | 0.16 | 0.092 |
| ST TUMOR NECROSIS FACTOR PATHWAY | 28 | genes.ES.table | 0.57 | 1.7 | 0.021 | 0.45 | 0.73 | 0.46 | 0.19 | 0.38 | 0.17 | 0.097 |
| PID SYNDECAN 4 PATHWAY | 28 | genes.ES.table | 0.71 | 1.8 | 0.002 | 0.55 | 0.64 | 0.68 | 0.22 | 0.53 | 0.2 | 0.13 |
| PID HIVNEFPATHWAY | 35 | genes.ES.table | 0.54 | 1.7 | 0.025 | 0.41 | 0.78 | 0.4 | 0.19 | 0.32 | 0.18 | 0.097 |
| REACTOME ANTIGEN PROCESSING CROSS PRESENTATION | 72 | genes.ES.table | 0.57 | 1.7 | 0.01 | 0.53 | 0.7 | 0.64 | 0.3 | 0.45 | 0.2 | 0.13 |
| REACTOME TRIF MEDIATED TLR3 SIGNALING | 72 | genes.ES.table | 0.43 | 1.7 | 0.022 | 0.54 | 0.73 | 0.35 | 0.22 | 0.27 | 0.21 | 0.13 |
| REACTOME ACTIVATION OF CHAPERONE GENES BY XBP1S | 44 | genes.ES.table | 0.42 | 1.7 | 0.077 | 0.48 | 0.86 | 0.3 | 0.18 | 0.24 | 0.23 | 0.12 |
Table S11. Get Full Table This table shows a Running Enrichment Score (RES) of each gene in this pathway, that is, the enrichment score at this point in the ranked list of genes. All genes are ranked by Signal-to-Noise (S2N), a measure of similarity as default and are used to obtain ES matrix of all genes. In this way, GSEA tool uses expression pattern of not only overlapped genes but also not-overlapped genes to produce ES matrix.
| Rank | GENE | SYMBOL | DESC | LIST.LOC | S2N | RES | CORE_ENRICHMENT |
|---|---|---|---|---|---|---|---|
| 1 | SAA1 | SAA1 | SAA1 | 332 | 0.29 | 0.042 | YES |
| 2 | CASP8 | CASP8 | CASP8 | 590 | 0.25 | 0.078 | YES |
| 3 | IRF1 | IRF1 | IRF1 | 842 | 0.22 | 0.11 | YES |
| 4 | TNFAIP3 | TNFAIP3 | TNFAIP3 | 1106 | 0.19 | 0.13 | YES |
| 5 | IFNB1 | IFNB1 | IFNB1 | 1215 | 0.18 | 0.16 | YES |
| 6 | DHX58 | DHX58 | DHX58 | 1247 | 0.18 | 0.2 | YES |
| 7 | S100A12 | S100A12 | S100A12 | 1378 | 0.17 | 0.23 | YES |
| 8 | IFIH1 | IFIH1 | IFIH1 | 1518 | 0.16 | 0.25 | YES |
| 9 | IKBKE | IKBKE | IKBKE | 1539 | 0.16 | 0.28 | YES |
| 10 | IRF7 | IRF7 | IRF7 | 1616 | 0.15 | 0.31 | YES |
| 11 | RNF135 | RNF135 | RNF135 | 1621 | 0.15 | 0.34 | YES |
| 12 | NFKBIA | NFKBIA | NFKBIA | 1772 | 0.14 | 0.36 | YES |
| 13 | TANK | TANK | TANK | 2061 | 0.13 | 0.37 | YES |
| 14 | HERC5 | HERC5 | HERC5 | 2201 | 0.12 | 0.39 | YES |
| 15 | IRF2 | IRF2 | IRF2 | 2250 | 0.12 | 0.41 | YES |
| 16 | ISG15 | ISG15 | ISG15 | 2406 | 0.11 | 0.42 | YES |
| 17 | NFKB2 | NFKB2 | NFKB2 | 2434 | 0.11 | 0.45 | YES |
| 18 | CASP10 | CASP10 | CASP10 | 2574 | 0.11 | 0.46 | YES |
| 19 | NLRC5 | NLRC5 | NLRC5 | 2755 | 0.1 | 0.47 | YES |
| 20 | IRF3 | IRF3 | IRF3 | 2930 | 0.093 | 0.48 | YES |
| 21 | DDX58 | DDX58 | DDX58 | 2961 | 0.092 | 0.5 | YES |
| 22 | TRAF6 | TRAF6 | TRAF6 | 3120 | 0.087 | 0.51 | YES |
| 23 | RIPK1 | RIPK1 | RIPK1 | 3235 | 0.084 | 0.52 | YES |
| 24 | UBA7 | UBA7 | UBA7 | 3300 | 0.082 | 0.53 | YES |
| 25 | UBE2L6 | UBE2L6 | UBE2L6 | 3377 | 0.08 | 0.54 | YES |
| 26 | TBK1 | TBK1 | TBK1 | 3485 | 0.076 | 0.55 | YES |
| 27 | TAX1BP1 | TAX1BP1 | TAX1BP1 | 3723 | 0.071 | 0.55 | YES |
| 28 | NLRX1 | NLRX1 | NLRX1 | 4286 | 0.059 | 0.53 | NO |
| 29 | FADD | FADD | FADD | 4758 | 0.05 | 0.52 | NO |
| 30 | RPS27A | RPS27A | RPS27A | 4814 | 0.049 | 0.52 | NO |
| 31 | APP | APP | APP | 5104 | 0.044 | 0.52 | NO |
| 32 | UBA52 | UBA52 | UBA52 | 5368 | 0.039 | 0.51 | NO |
| 33 | TRIM25 | TRIM25 | TRIM25 | 5375 | 0.039 | 0.52 | NO |
| 34 | CYLD | CYLD | CYLD | 5518 | 0.037 | 0.52 | NO |
| 35 | ATG5 | ATG5 | ATG5 | 6282 | 0.026 | 0.48 | NO |
| 36 | IKBKB | IKBKB | IKBKB | 6382 | 0.025 | 0.48 | NO |
| 37 | DAK | DAK | DAK | 6425 | 0.025 | 0.48 | NO |
| 38 | IKBKG | IKBKG | IKBKG | 6526 | 0.023 | 0.48 | NO |
| 39 | TRAF3 | TRAF3 | TRAF3 | 6548 | 0.023 | 0.49 | NO |
| 40 | UBE2D3 | UBE2D3 | UBE2D3 | 6559 | 0.023 | 0.49 | NO |
| 41 | NFKBIB | NFKBIB | NFKBIB | 7427 | 0.012 | 0.45 | NO |
| 42 | ATG12 | ATG12 | ATG12 | 7593 | 0.0094 | 0.44 | NO |
| 43 | HMGB1 | HMGB1 | HMGB1 | 7967 | 0.0046 | 0.42 | NO |
| 44 | RELA | RELA | RELA | 8026 | 0.0039 | 0.42 | NO |
| 45 | SIKE1 | SIKE1 | SIKE1 | 8117 | 0.0028 | 0.41 | NO |
| 46 | CHUK | CHUK | CHUK | 8196 | 0.0016 | 0.41 | NO |
| 47 | UBE2D2 | UBE2D2 | UBE2D2 | 8243 | 0.00087 | 0.41 | NO |
| 48 | S100B | S100B | S100B | 8291 | 0.00031 | 0.4 | NO |
| 49 | UBE2K | UBE2K | UBE2K | 8621 | -0.0038 | 0.39 | NO |
| 50 | PIN1 | PIN1 | PIN1 | 8836 | -0.0066 | 0.38 | NO |
| 51 | PCBP2 | PCBP2 | PCBP2 | 8918 | -0.0076 | 0.37 | NO |
| 52 | UBE2D1 | UBE2D1 | UBE2D1 | 9205 | -0.011 | 0.36 | NO |
| 53 | OTUD5 | OTUD5 | OTUD5 | 10030 | -0.023 | 0.32 | NO |
| 54 | TRAF2 | TRAF2 | TRAF2 | 10411 | -0.028 | 0.3 | NO |
| 55 | MAVS | MAVS | MAVS | 10789 | -0.033 | 0.29 | NO |
| 56 | EP300 | EP300 | EP300 | 11075 | -0.038 | 0.28 | NO |
| 57 | MAP3K1 | MAP3K1 | MAP3K1 | 13045 | -0.076 | 0.19 | NO |
| 58 | CREBBP | CREBBP | CREBBP | 13069 | -0.077 | 0.2 | NO |
| 59 | AGER | AGER | AGER | 15533 | -0.18 | 0.1 | NO |
| 60 | RNF125 | RNF125 | RNF125 | 15962 | -0.21 | 0.12 | NO |
Figure S21. Get High-res Image This plot shows mRNAseq_cNMF expression data heatmap (on the left) a RunningEnrichmentScore(RES) plot (on the top right) and a Signal2Noise(S2N) plot (on the bottom right) of genes in the pathway: KEGG AMINO SUGAR AND NUCLEOTIDE SUGAR METABOLISM.
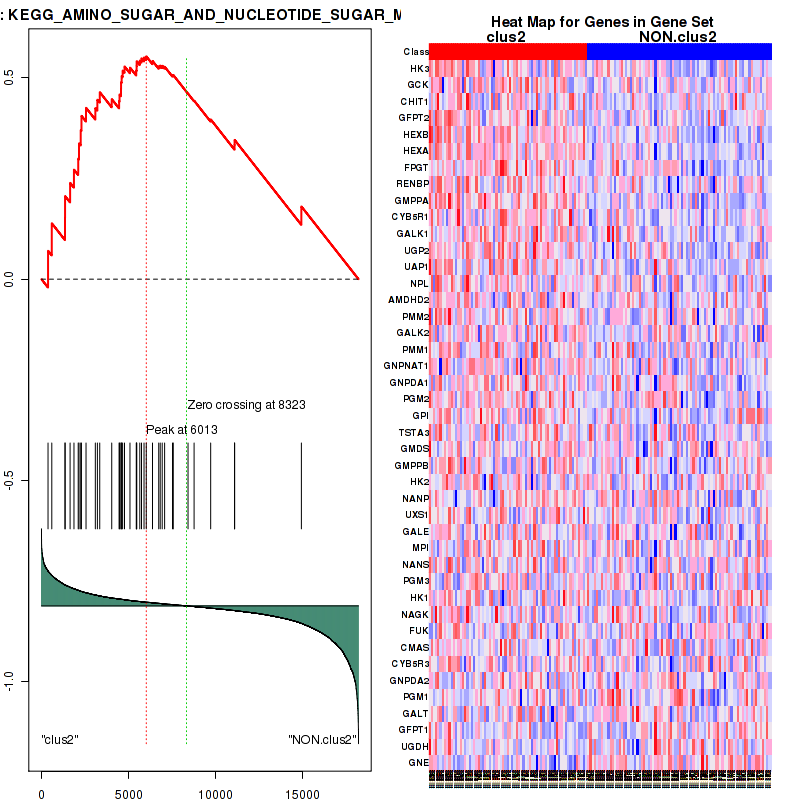
Figure S22. Get High-res Image For the top 5 core enriched genes in the pathway: KEGG AMINO SUGAR AND NUCLEOTIDE SUGAR METABOLISM, this volcano plot shows how much they are up/down-regulated and significant. The significance was calculated by empirical bayesian fit
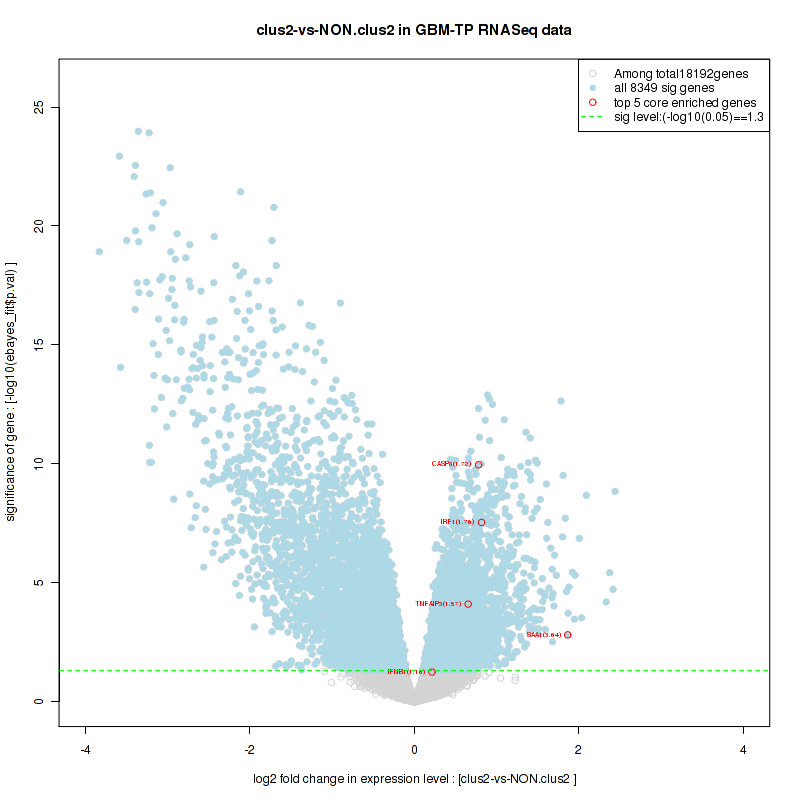
Table S12. Get Full Table This table shows a Running Enrichment Score (RES) of each gene in this pathway, that is, the enrichment score at this point in the ranked list of genes. All genes are ranked by Signal-to-Noise (S2N), a measure of similarity as default and are used to obtain ES matrix of all genes. In this way, GSEA tool uses expression pattern of not only overlapped genes but also not-overlapped genes to produce ES matrix.
| Rank | GENE | SYMBOL | DESC | LIST.LOC | S2N | RES | CORE_ENRICHMENT |
|---|---|---|---|---|---|---|---|
| 1 | BIRC3 | BIRC3 | BIRC3 | 183 | 0.33 | 0.094 | YES |
| 2 | CASP1 | CASP1 | CASP1 | 265 | 0.31 | 0.19 | YES |
| 3 | NOD2 | NOD2 | NOD2 | 386 | 0.28 | 0.27 | YES |
| 4 | MAPK13 | MAPK13 | MAPK13 | 393 | 0.28 | 0.36 | YES |
| 5 | CASP4 | CASP4 | CASP4 | 583 | 0.25 | 0.42 | YES |
| 6 | CASP8 | CASP8 | CASP8 | 590 | 0.25 | 0.5 | YES |
| 7 | NOD1 | NOD1 | NOD1 | 1052 | 0.2 | 0.54 | YES |
| 8 | TNFAIP3 | TNFAIP3 | TNFAIP3 | 1106 | 0.19 | 0.59 | YES |
| 9 | IRAK2 | IRAK2 | IRAK2 | 1255 | 0.18 | 0.64 | YES |
| 10 | CARD9 | CARD9 | CARD9 | 1563 | 0.16 | 0.67 | YES |
| 11 | TRAF6 | TRAF6 | TRAF6 | 3120 | 0.087 | 0.62 | NO |
| 12 | CYLD | CYLD | CYLD | 5518 | 0.037 | 0.49 | NO |
| 13 | IRAK1 | IRAK1 | IRAK1 | 5877 | 0.032 | 0.48 | NO |
| 14 | BIRC2 | BIRC2 | BIRC2 | 5922 | 0.031 | 0.49 | NO |
| 15 | IKBKB | IKBKB | IKBKB | 6382 | 0.025 | 0.48 | NO |
| 16 | IKBKG | IKBKG | IKBKG | 6526 | 0.023 | 0.47 | NO |
| 17 | MAPK14 | MAPK14 | MAPK14 | 6661 | 0.021 | 0.47 | NO |
| 18 | RIPK2 | RIPK2 | RIPK2 | 7049 | 0.016 | 0.46 | NO |
| 19 | TAB2 | TAB2 | TAB2 | 7665 | 0.0083 | 0.43 | NO |
| 20 | CHUK | CHUK | CHUK | 8196 | 0.0016 | 0.4 | NO |
| 21 | UBE2N | UBE2N | UBE2N | 8230 | 0.0011 | 0.4 | NO |
| 22 | MAP3K7 | MAP3K7 | MAP3K7 | 9323 | -0.013 | 0.34 | NO |
| 23 | CASP2 | CASP2 | CASP2 | 9854 | -0.02 | 0.32 | NO |
| 24 | TAB1 | TAB1 | TAB1 | 10033 | -0.023 | 0.31 | NO |
| 25 | TAB3 | TAB3 | TAB3 | 11157 | -0.039 | 0.26 | NO |
| 26 | MAP2K6 | MAP2K6 | MAP2K6 | 11839 | -0.051 | 0.24 | NO |
| 27 | MAPK11 | MAPK11 | MAPK11 | 12420 | -0.062 | 0.23 | NO |
| 28 | MAPK12 | MAPK12 | MAPK12 | 12435 | -0.062 | 0.25 | NO |
| 29 | CASP9 | CASP9 | CASP9 | 12543 | -0.064 | 0.26 | NO |
| 30 | TMEM189-UBE2V1 | TMEM189-UBE2V1 | TMEM189-UBE2V1 | 15064 | -0.15 | 0.17 | NO |
Figure S23. Get High-res Image This plot shows mRNAseq_cNMF expression data heatmap (on the left) a RunningEnrichmentScore(RES) plot (on the top right) and a Signal2Noise(S2N) plot (on the bottom right) of genes in the pathway: BIOCARTA HIVNEF PATHWAY.
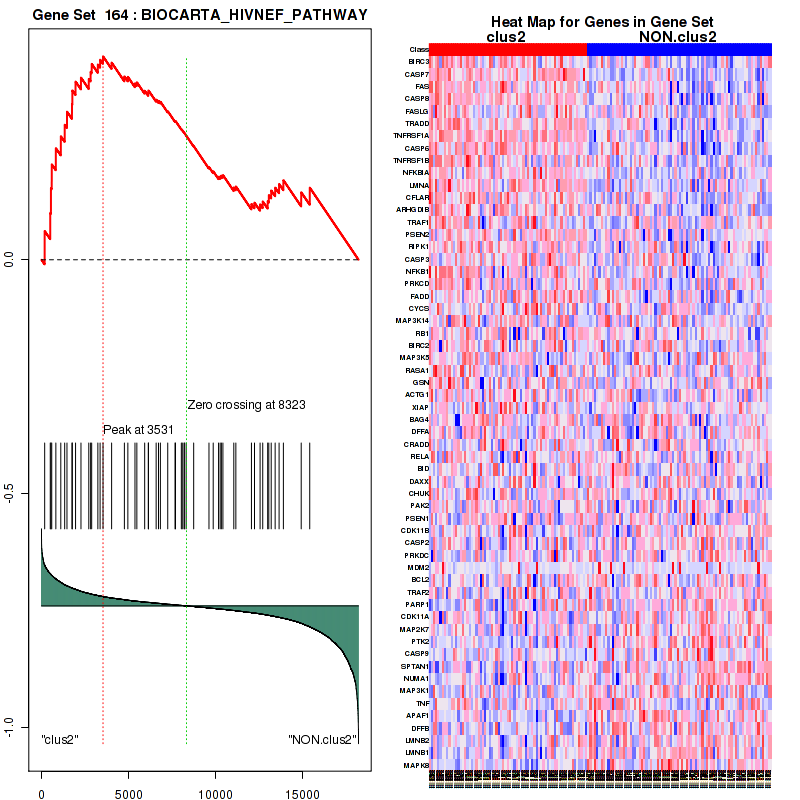
Figure S24. Get High-res Image For the top 5 core enriched genes in the pathway: BIOCARTA HIVNEF PATHWAY, this volcano plot shows how much they are up/down-regulated and significant. The significance was calculated by empirical bayesian fit
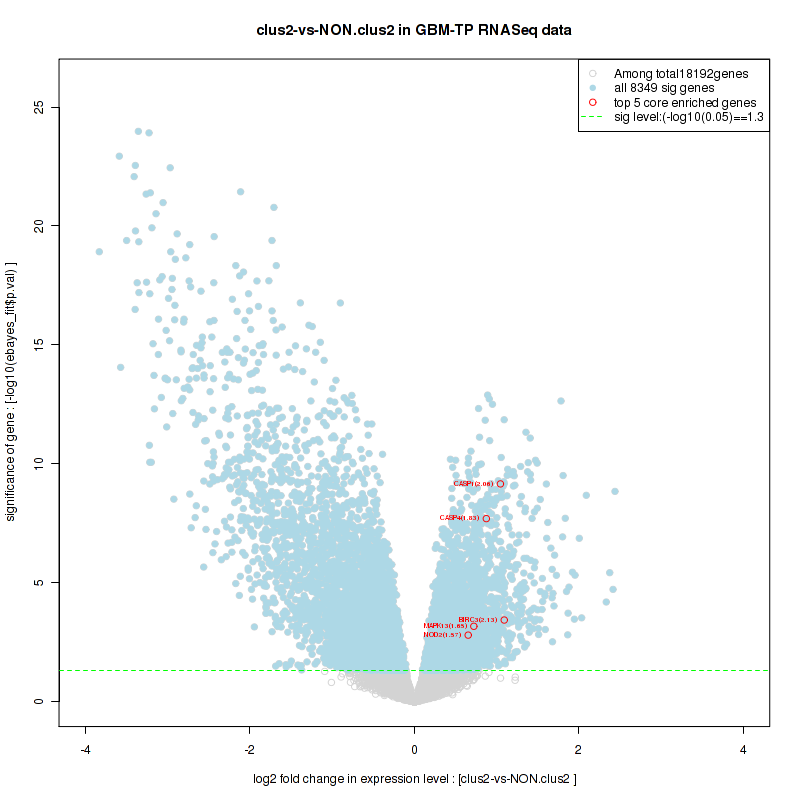
Table S13. Get Full Table This table shows a Running Enrichment Score (RES) of each gene in this pathway, that is, the enrichment score at this point in the ranked list of genes. All genes are ranked by Signal-to-Noise (S2N), a measure of similarity as default and are used to obtain ES matrix of all genes. In this way, GSEA tool uses expression pattern of not only overlapped genes but also not-overlapped genes to produce ES matrix.
| Rank | GENE | SYMBOL | DESC | LIST.LOC | S2N | RES | CORE_ENRICHMENT |
|---|---|---|---|---|---|---|---|
| 1 | HK3 | HK3 | HK3 | 378 | 0.28 | 0.071 | YES |
| 2 | GCK | GCK | GCK | 591 | 0.25 | 0.14 | YES |
| 3 | CHIT1 | CHIT1 | CHIT1 | 1352 | 0.17 | 0.15 | YES |
| 4 | GFPT2 | GFPT2 | GFPT2 | 1354 | 0.17 | 0.21 | YES |
| 5 | HEXB | HEXB | HEXB | 1644 | 0.15 | 0.24 | YES |
| 6 | HEXA | HEXA | HEXA | 1864 | 0.14 | 0.27 | YES |
| 7 | FPGT | FPGT | FPGT | 2109 | 0.13 | 0.3 | YES |
| 8 | RENBP | RENBP | RENBP | 2154 | 0.12 | 0.34 | YES |
| 9 | GMPPA | GMPPA | GMPPA | 2253 | 0.12 | 0.37 | YES |
| 10 | CYB5R1 | CYB5R1 | CYB5R1 | 2295 | 0.12 | 0.41 | YES |
| 11 | GALK1 | GALK1 | GALK1 | 2557 | 0.11 | 0.43 | YES |
| 12 | UGP2 | UGP2 | UGP2 | 3092 | 0.088 | 0.42 | YES |
| 13 | UAP1 | UAP1 | UAP1 | 3208 | 0.085 | 0.45 | YES |
| 14 | NPL | NPL | NPL | 3345 | 0.081 | 0.46 | YES |
| 15 | AMDHD2 | AMDHD2 | AMDHD2 | 4032 | 0.064 | 0.45 | YES |
| 16 | PMM2 | PMM2 | PMM2 | 4455 | 0.056 | 0.44 | YES |
| 17 | GALK2 | GALK2 | GALK2 | 4480 | 0.056 | 0.46 | YES |
| 18 | PMM1 | PMM1 | PMM1 | 4564 | 0.054 | 0.47 | YES |
| 19 | GNPNAT1 | GNPNAT1 | GNPNAT1 | 4568 | 0.054 | 0.49 | YES |
| 20 | GNPDA1 | GNPDA1 | GNPDA1 | 4600 | 0.053 | 0.5 | YES |
| 21 | PGM2 | PGM2 | PGM2 | 4658 | 0.052 | 0.52 | YES |
| 22 | GPI | GPI | GPI | 4766 | 0.05 | 0.53 | YES |
| 23 | TSTA3 | TSTA3 | TSTA3 | 5079 | 0.044 | 0.52 | YES |
| 24 | GMDS | GMDS | GMDS | 5439 | 0.038 | 0.52 | YES |
| 25 | GMPPB | GMPPB | GMPPB | 5460 | 0.038 | 0.53 | YES |
| 26 | HK2 | HK2 | HK2 | 5463 | 0.038 | 0.54 | YES |
| 27 | NANP | NANP | NANP | 5642 | 0.035 | 0.54 | YES |
| 28 | UXS1 | UXS1 | UXS1 | 5739 | 0.034 | 0.55 | YES |
| 29 | GALE | GALE | GALE | 5886 | 0.032 | 0.55 | YES |
| 30 | MPI | MPI | MPI | 6013 | 0.03 | 0.55 | YES |
| 31 | NANS | NANS | NANS | 6371 | 0.025 | 0.54 | NO |
| 32 | PGM3 | PGM3 | PGM3 | 6729 | 0.02 | 0.53 | NO |
| 33 | HK1 | HK1 | HK1 | 6814 | 0.019 | 0.53 | NO |
| 34 | NAGK | NAGK | NAGK | 6929 | 0.018 | 0.53 | NO |
| 35 | FUK | FUK | FUK | 7067 | 0.016 | 0.53 | NO |
| 36 | CMAS | CMAS | CMAS | 7519 | 0.01 | 0.51 | NO |
| 37 | CYB5R3 | CYB5R3 | CYB5R3 | 7564 | 0.0098 | 0.51 | NO |
| 38 | GNPDA2 | GNPDA2 | GNPDA2 | 8409 | -0.0011 | 0.46 | NO |
| 39 | PGM1 | PGM1 | PGM1 | 8759 | -0.0056 | 0.44 | NO |
| 40 | GALT | GALT | GALT | 9708 | -0.018 | 0.4 | NO |
| 41 | GFPT1 | GFPT1 | GFPT1 | 11079 | -0.038 | 0.33 | NO |
| 42 | UGDH | UGDH | UGDH | 11082 | -0.038 | 0.35 | NO |
| 43 | GNE | GNE | GNE | 14913 | -0.14 | 0.18 | NO |
Figure S25. Get High-res Image This plot shows mRNAseq_cNMF expression data heatmap (on the left) a RunningEnrichmentScore(RES) plot (on the top right) and a Signal2Noise(S2N) plot (on the bottom right) of genes in the pathway: BIOCARTA IL2RB PATHWAY.
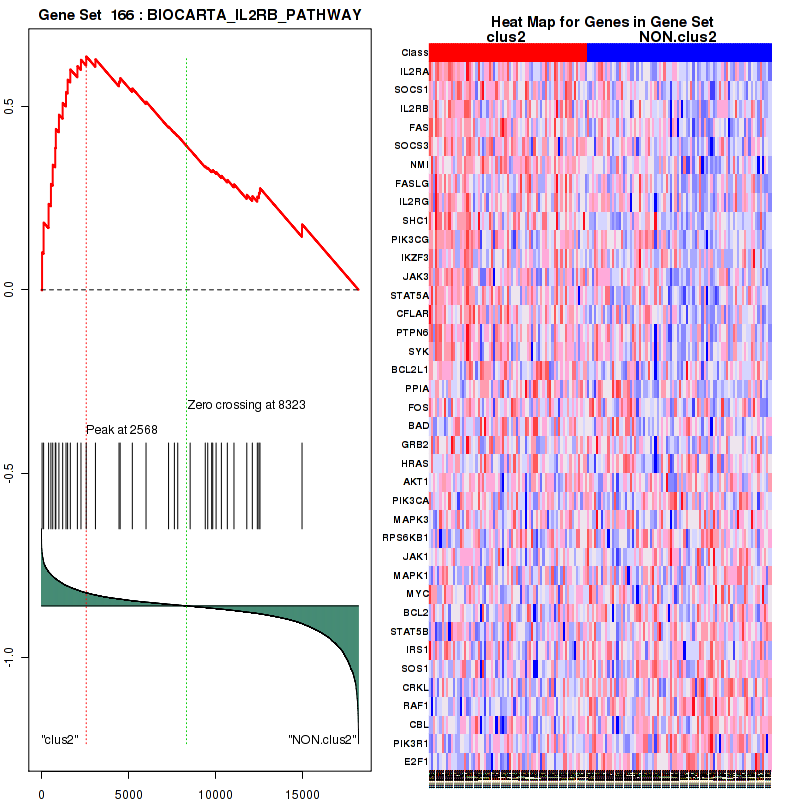
Figure S26. Get High-res Image For the top 5 core enriched genes in the pathway: BIOCARTA IL2RB PATHWAY, this volcano plot shows how much they are up/down-regulated and significant. The significance was calculated by empirical bayesian fit
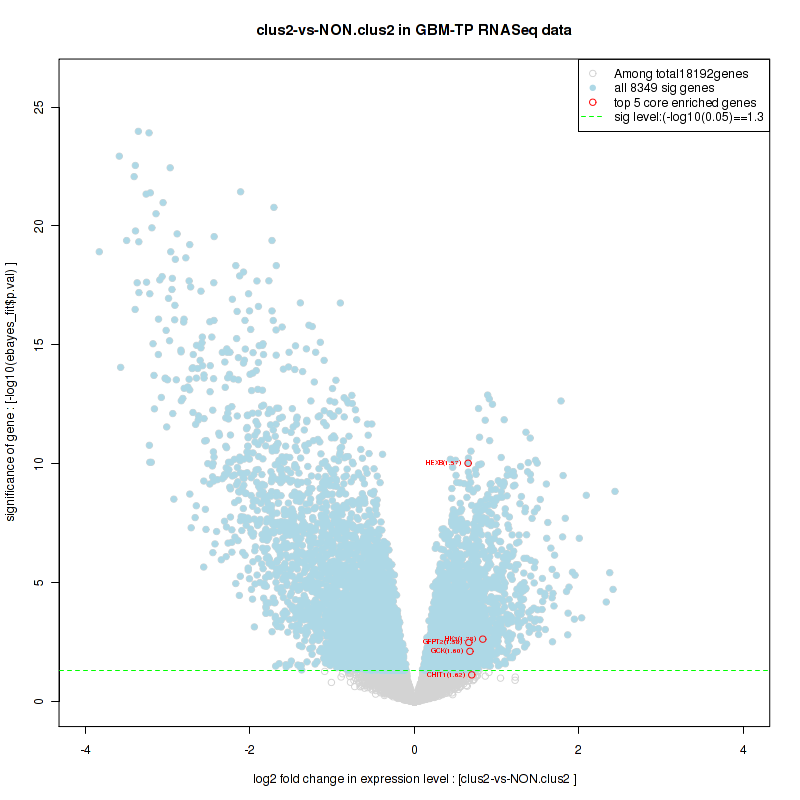
Table S14. Get Full Table This table shows a Running Enrichment Score (RES) of each gene in this pathway, that is, the enrichment score at this point in the ranked list of genes. All genes are ranked by Signal-to-Noise (S2N), a measure of similarity as default and are used to obtain ES matrix of all genes. In this way, GSEA tool uses expression pattern of not only overlapped genes but also not-overlapped genes to produce ES matrix.
| Rank | GENE | SYMBOL | DESC | LIST.LOC | S2N | RES | CORE_ENRICHMENT |
|---|---|---|---|---|---|---|---|
| 1 | GBP5 | GBP5 | GBP5 | 10 | 0.49 | 0.036 | YES |
| 2 | SOCS1 | SOCS1 | SOCS1 | 123 | 0.36 | 0.056 | YES |
| 3 | ISG20 | ISG20 | ISG20 | 368 | 0.28 | 0.064 | YES |
| 4 | ICAM1 | ICAM1 | ICAM1 | 370 | 0.28 | 0.086 | YES |
| 5 | GBP1 | GBP1 | GBP1 | 400 | 0.28 | 0.1 | YES |
| 6 | OASL | OASL | OASL | 471 | 0.26 | 0.12 | YES |
| 7 | SP100 | SP100 | SP100 | 625 | 0.24 | 0.13 | YES |
| 8 | SOCS3 | SOCS3 | SOCS3 | 647 | 0.24 | 0.15 | YES |
| 9 | IRF6 | IRF6 | IRF6 | 653 | 0.24 | 0.16 | YES |
| 10 | XAF1 | XAF1 | XAF1 | 730 | 0.23 | 0.18 | YES |
| 11 | OAS1 | OAS1 | OAS1 | 735 | 0.23 | 0.2 | YES |
| 12 | MT2A | MT2A | MT2A | 818 | 0.22 | 0.21 | YES |
| 13 | IRF1 | IRF1 | IRF1 | 842 | 0.22 | 0.22 | YES |
| 14 | GBP2 | GBP2 | GBP2 | 843 | 0.22 | 0.24 | YES |
| 15 | GBP4 | GBP4 | GBP4 | 862 | 0.21 | 0.25 | YES |
| 16 | IFI35 | IFI35 | IFI35 | 911 | 0.21 | 0.27 | YES |
| 17 | IFITM3 | IFITM3 | IFITM3 | 922 | 0.21 | 0.28 | YES |
| 18 | HLA-G | HLA-G | HLA-G | 929 | 0.21 | 0.3 | YES |
| 19 | IFITM1 | IFITM1 | IFITM1 | 1088 | 0.19 | 0.3 | YES |
| 20 | CIITA | CIITA | CIITA | 1153 | 0.19 | 0.31 | YES |
| 21 | IFNB1 | IFNB1 | IFNB1 | 1215 | 0.18 | 0.32 | YES |
| 22 | IFITM2 | IFITM2 | IFITM2 | 1221 | 0.18 | 0.34 | YES |
| 23 | OAS2 | OAS2 | OAS2 | 1320 | 0.17 | 0.34 | YES |
| 24 | HLA-F | HLA-F | HLA-F | 1346 | 0.17 | 0.36 | YES |
| 25 | VCAM1 | VCAM1 | VCAM1 | 1356 | 0.17 | 0.37 | YES |
| 26 | PSMB8 | PSMB8 | PSMB8 | 1359 | 0.17 | 0.38 | YES |
| 27 | CD44 | CD44 | CD44 | 1467 | 0.16 | 0.39 | YES |
| 28 | HLA-DQA2 | HLA-DQA2 | HLA-DQA2 | 1482 | 0.16 | 0.4 | YES |
| 29 | HLA-B | HLA-B | HLA-B | 1562 | 0.16 | 0.4 | YES |
| 30 | IRF7 | IRF7 | IRF7 | 1616 | 0.15 | 0.41 | YES |
| 31 | MX2 | MX2 | MX2 | 1735 | 0.15 | 0.42 | YES |
| 32 | HLA-DPB1 | HLA-DPB1 | HLA-DPB1 | 1738 | 0.14 | 0.43 | YES |
| 33 | FCGR1B | FCGR1B | FCGR1B | 1788 | 0.14 | 0.44 | YES |
| 34 | FCGR1A | FCGR1A | FCGR1A | 1796 | 0.14 | 0.45 | YES |
| 35 | MX1 | MX1 | MX1 | 1818 | 0.14 | 0.46 | YES |
| 36 | PTPN2 | PTPN2 | PTPN2 | 1829 | 0.14 | 0.47 | YES |
| 37 | HLA-DQA1 | HLA-DQA1 | HLA-DQA1 | 1858 | 0.14 | 0.48 | YES |
| 38 | HLA-A | HLA-A | HLA-A | 1936 | 0.14 | 0.48 | YES |
| 39 | GBP6 | GBP6 | GBP6 | 2001 | 0.13 | 0.49 | YES |
| 40 | HLA-C | HLA-C | HLA-C | 2002 | 0.13 | 0.5 | YES |
| 41 | OAS3 | OAS3 | OAS3 | 2031 | 0.13 | 0.51 | YES |
| 42 | HLA-DRB1 | HLA-DRB1 | HLA-DRB1 | 2099 | 0.13 | 0.51 | YES |
| 43 | HLA-DPA1 | HLA-DPA1 | HLA-DPA1 | 2177 | 0.12 | 0.52 | YES |
| 44 | HERC5 | HERC5 | HERC5 | 2201 | 0.12 | 0.52 | YES |
| 45 | IFI6 | IFI6 | IFI6 | 2216 | 0.12 | 0.53 | YES |
| 46 | B2M | B2M | B2M | 2237 | 0.12 | 0.54 | YES |
| 47 | IRF2 | IRF2 | IRF2 | 2250 | 0.12 | 0.55 | YES |
| 48 | IFIT3 | IFIT3 | IFIT3 | 2321 | 0.12 | 0.55 | YES |
| 49 | ISG15 | ISG15 | ISG15 | 2406 | 0.11 | 0.56 | YES |
| 50 | PTPN6 | PTPN6 | PTPN6 | 2568 | 0.11 | 0.56 | YES |
| 51 | IRF5 | IRF5 | IRF5 | 2602 | 0.1 | 0.56 | YES |
| 52 | HLA-DRB5 | HLA-DRB5 | HLA-DRB5 | 2609 | 0.1 | 0.57 | YES |
| 53 | PML | PML | PML | 2671 | 0.1 | 0.57 | YES |
| 54 | USP18 | USP18 | USP18 | 2746 | 0.1 | 0.58 | YES |
| 55 | IFI27 | IFI27 | IFI27 | 2865 | 0.095 | 0.58 | YES |
| 56 | NUP37 | NUP37 | NUP37 | 2881 | 0.094 | 0.58 | YES |
| 57 | IRF3 | IRF3 | IRF3 | 2930 | 0.093 | 0.59 | YES |
| 58 | IFNGR2 | IFNGR2 | IFNGR2 | 2945 | 0.092 | 0.6 | YES |
| 59 | DDX58 | DDX58 | DDX58 | 2961 | 0.092 | 0.6 | YES |
| 60 | CAMK2D | CAMK2D | CAMK2D | 2989 | 0.091 | 0.61 | YES |
| 61 | RNASEL | RNASEL | RNASEL | 3233 | 0.084 | 0.6 | YES |
| 62 | EIF2AK2 | EIF2AK2 | EIF2AK2 | 3249 | 0.083 | 0.6 | YES |
| 63 | UBA7 | UBA7 | UBA7 | 3300 | 0.082 | 0.61 | YES |
| 64 | UBE2L6 | UBE2L6 | UBE2L6 | 3377 | 0.08 | 0.61 | YES |
| 65 | STAT1 | STAT1 | STAT1 | 3588 | 0.074 | 0.6 | NO |
| 66 | IRF9 | IRF9 | IRF9 | 3929 | 0.066 | 0.59 | NO |
| 67 | PRKCD | PRKCD | PRKCD | 4024 | 0.064 | 0.59 | NO |
| 68 | IFIT1 | IFIT1 | IFIT1 | 4217 | 0.06 | 0.58 | NO |
| 69 | JAK2 | JAK2 | JAK2 | 4291 | 0.059 | 0.58 | NO |
| 70 | IRF8 | IRF8 | IRF8 | 4376 | 0.057 | 0.58 | NO |
| 71 | IFIT2 | IFIT2 | IFIT2 | 4379 | 0.057 | 0.59 | NO |
| 72 | STAT2 | STAT2 | STAT2 | 4443 | 0.056 | 0.59 | NO |
| 73 | RPS27A | RPS27A | RPS27A | 4814 | 0.049 | 0.57 | NO |
| 74 | IFNGR1 | IFNGR1 | IFNGR1 | 4825 | 0.049 | 0.57 | NO |
| 75 | NUP54 | NUP54 | NUP54 | 5268 | 0.041 | 0.55 | NO |
| 76 | UBA52 | UBA52 | UBA52 | 5368 | 0.039 | 0.55 | NO |
| 77 | IFNAR1 | IFNAR1 | IFNAR1 | 5373 | 0.039 | 0.55 | NO |
| 78 | TRIM25 | TRIM25 | TRIM25 | 5375 | 0.039 | 0.56 | NO |
| 79 | IRF4 | IRF4 | IRF4 | 5419 | 0.039 | 0.56 | NO |
| 80 | SEH1L | SEH1L | SEH1L | 5798 | 0.033 | 0.54 | NO |
| 81 | KPNA4 | KPNA4 | KPNA4 | 5937 | 0.031 | 0.53 | NO |
| 82 | NEDD4 | NEDD4 | NEDD4 | 6001 | 0.03 | 0.53 | NO |
| 83 | EIF4E | EIF4E | EIF4E | 6085 | 0.029 | 0.53 | NO |
| 84 | EIF4A3 | EIF4A3 | EIF4A3 | 6289 | 0.026 | 0.52 | NO |
| 85 | IFNAR2 | IFNAR2 | IFNAR2 | 6583 | 0.022 | 0.51 | NO |
| 86 | UBE2E1 | UBE2E1 | UBE2E1 | 6799 | 0.02 | 0.5 | NO |
| 87 | SUMO1 | SUMO1 | SUMO1 | 6841 | 0.019 | 0.49 | NO |
| 88 | EIF4G2 | EIF4G2 | EIF4G2 | 7026 | 0.016 | 0.49 | NO |
| 89 | NUP205 | NUP205 | NUP205 | 7244 | 0.014 | 0.48 | NO |
| 90 | EIF4A1 | EIF4A1 | EIF4A1 | 7254 | 0.013 | 0.48 | NO |
| 91 | PTPN1 | PTPN1 | PTPN1 | 7394 | 0.012 | 0.47 | NO |
| 92 | PTAFR | PTAFR | PTAFR | 7479 | 0.011 | 0.46 | NO |
| 93 | NUP210 | NUP210 | NUP210 | 7550 | 0.01 | 0.46 | NO |
| 94 | NUP85 | NUP85 | NUP85 | 7654 | 0.0085 | 0.46 | NO |
| 95 | ARIH1 | ARIH1 | ARIH1 | 7927 | 0.0051 | 0.44 | NO |
| 96 | TYK2 | TYK2 | TYK2 | 7945 | 0.0049 | 0.44 | NO |
| 97 | EIF4E2 | EIF4E2 | EIF4E2 | 8072 | 0.0033 | 0.43 | NO |
| 98 | EGR1 | EGR1 | EGR1 | 8093 | 0.0031 | 0.43 | NO |
| 99 | UBE2N | UBE2N | UBE2N | 8230 | 0.0011 | 0.43 | NO |
| 100 | NUP62 | NUP62 | NUP62 | 8292 | 0.00031 | 0.42 | NO |
| 101 | ADAR | ADAR | ADAR | 8365 | -0.00047 | 0.42 | NO |
| 102 | RAE1 | RAE1 | RAE1 | 8366 | -0.00047 | 0.42 | NO |
| 103 | RANBP2 | RANBP2 | RANBP2 | 8482 | -0.002 | 0.41 | NO |
| 104 | CAMK2B | CAMK2B | CAMK2B | 8549 | -0.003 | 0.41 | NO |
| 105 | TPR | TPR | TPR | 8560 | -0.0031 | 0.41 | NO |
| 106 | EIF4E3 | EIF4E3 | EIF4E3 | 8575 | -0.0034 | 0.41 | NO |
| 107 | EIF4A2 | EIF4A2 | EIF4A2 | 8744 | -0.0054 | 0.4 | NO |
| 108 | EIF4G1 | EIF4G1 | EIF4G1 | 8834 | -0.0066 | 0.4 | NO |
| 109 | PIN1 | PIN1 | PIN1 | 8836 | -0.0066 | 0.4 | NO |
| 110 | PIAS1 | PIAS1 | PIAS1 | 8974 | -0.0082 | 0.39 | NO |
| 111 | PLCG1 | PLCG1 | PLCG1 | 9029 | -0.0089 | 0.39 | NO |
| 112 | NUPL2 | NUPL2 | NUPL2 | 9113 | -0.0099 | 0.38 | NO |
| 113 | NUP50 | NUP50 | NUP50 | 9358 | -0.013 | 0.37 | NO |
| 114 | KPNB1 | KPNB1 | KPNB1 | 9366 | -0.013 | 0.37 | NO |
| 115 | NUP153 | NUP153 | NUP153 | 9385 | -0.014 | 0.37 | NO |
| 116 | MAPK3 | MAPK3 | MAPK3 | 9399 | -0.014 | 0.37 | NO |
| 117 | FLNB | FLNB | FLNB | 9566 | -0.016 | 0.36 | NO |
| 118 | NUP155 | NUP155 | NUP155 | 9674 | -0.018 | 0.36 | NO |
| 119 | JAK1 | JAK1 | JAK1 | 9768 | -0.019 | 0.35 | NO |
| 120 | KPNA2 | KPNA2 | KPNA2 | 10084 | -0.023 | 0.34 | NO |
| 121 | KPNA1 | KPNA1 | KPNA1 | 10115 | -0.024 | 0.34 | NO |
| 122 | NUPL1 | NUPL1 | NUPL1 | 10158 | -0.024 | 0.34 | NO |
| 123 | NUP133 | NUP133 | NUP133 | 10239 | -0.025 | 0.34 | NO |
| 124 | IFNG | IFNG | IFNG | 10336 | -0.026 | 0.33 | NO |
| 125 | POM121 | POM121 | POM121 | 10381 | -0.027 | 0.33 | NO |
| 126 | KPNA3 | KPNA3 | KPNA3 | 10418 | -0.028 | 0.33 | NO |
| 127 | PPM1B | PPM1B | PPM1B | 10550 | -0.03 | 0.33 | NO |
| 128 | NUP88 | NUP88 | NUP88 | 10911 | -0.035 | 0.31 | NO |
| 129 | NUP214 | NUP214 | NUP214 | 11172 | -0.039 | 0.3 | NO |
| 130 | NUP43 | NUP43 | NUP43 | 11364 | -0.043 | 0.29 | NO |
| 131 | NUP107 | NUP107 | NUP107 | 11465 | -0.045 | 0.29 | NO |
| 132 | EIF4G3 | EIF4G3 | EIF4G3 | 11609 | -0.047 | 0.28 | NO |
| 133 | NUP93 | NUP93 | NUP93 | 12060 | -0.055 | 0.26 | NO |
| 134 | NUP35 | NUP35 | NUP35 | 12071 | -0.055 | 0.27 | NO |
| 135 | IP6K2 | IP6K2 | IP6K2 | 12509 | -0.064 | 0.25 | NO |
| 136 | AAAS | AAAS | AAAS | 12546 | -0.064 | 0.25 | NO |
| 137 | NUP188 | NUP188 | NUP188 | 12782 | -0.07 | 0.24 | NO |
| 138 | GBP7 | GBP7 | GBP7 | 12960 | -0.074 | 0.24 | NO |
| 139 | KPNA5 | KPNA5 | KPNA5 | 14470 | -0.12 | 0.16 | NO |
| 140 | NCAM1 | NCAM1 | NCAM1 | 15874 | -0.2 | 0.1 | NO |
| 141 | CAMK2A | CAMK2A | CAMK2A | 17233 | -0.36 | 0.053 | NO |
Figure S27. Get High-res Image This plot shows mRNAseq_cNMF expression data heatmap (on the left) a RunningEnrichmentScore(RES) plot (on the top right) and a Signal2Noise(S2N) plot (on the bottom right) of genes in the pathway: BIOCARTA DEATH PATHWAY.
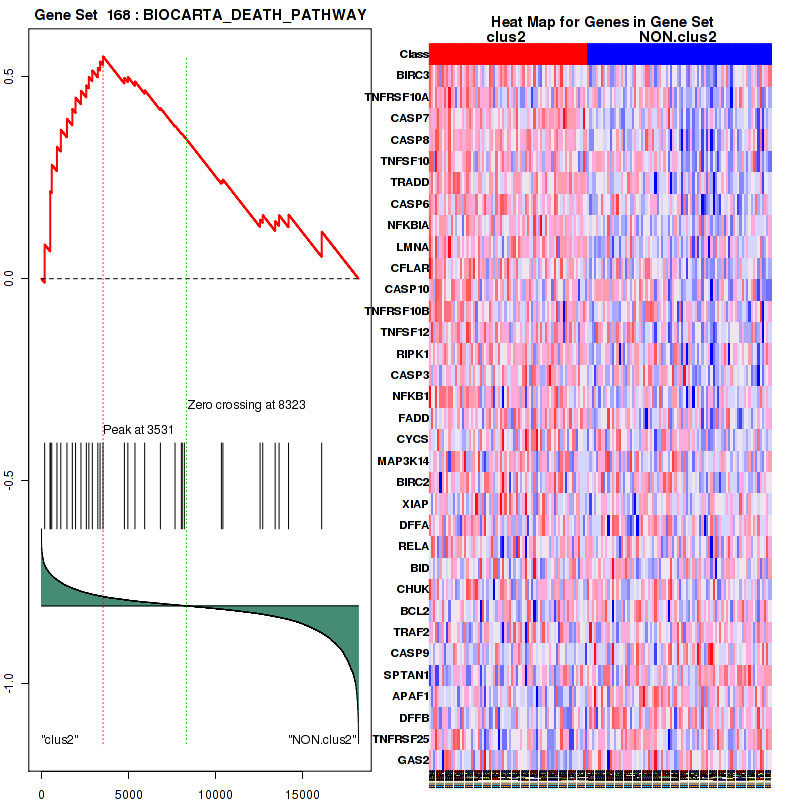
Figure S28. Get High-res Image For the top 5 core enriched genes in the pathway: BIOCARTA DEATH PATHWAY, this volcano plot shows how much they are up/down-regulated and significant. The significance was calculated by empirical bayesian fit
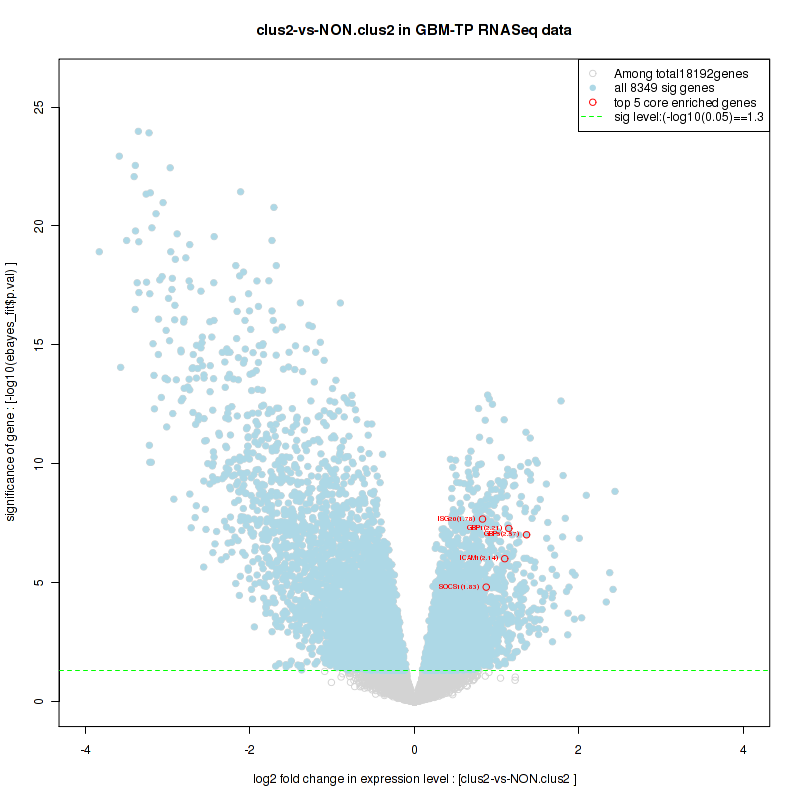
Table S15. Get Full Table This table shows a Running Enrichment Score (RES) of each gene in this pathway, that is, the enrichment score at this point in the ranked list of genes. All genes are ranked by Signal-to-Noise (S2N), a measure of similarity as default and are used to obtain ES matrix of all genes. In this way, GSEA tool uses expression pattern of not only overlapped genes but also not-overlapped genes to produce ES matrix.
| Rank | GENE | SYMBOL | DESC | LIST.LOC | S2N | RES | CORE_ENRICHMENT |
|---|---|---|---|---|---|---|---|
| 1 | GBP5 | GBP5 | GBP5 | 10 | 0.49 | 0.02 | YES |
| 2 | IL2RA | IL2RA | IL2RA | 35 | 0.43 | 0.037 | YES |
| 3 | SOCS1 | SOCS1 | SOCS1 | 123 | 0.36 | 0.047 | YES |
| 4 | TEC | TEC | TEC | 130 | 0.35 | 0.062 | YES |
| 5 | IL7R | IL7R | IL7R | 174 | 0.33 | 0.074 | YES |
| 6 | LCK | LCK | LCK | 245 | 0.31 | 0.083 | YES |
| 7 | CASP1 | CASP1 | CASP1 | 265 | 0.31 | 0.095 | YES |
| 8 | IL7 | IL7 | IL7 | 302 | 0.3 | 0.11 | YES |
| 9 | ISG20 | ISG20 | ISG20 | 368 | 0.28 | 0.11 | YES |
| 10 | ICAM1 | ICAM1 | ICAM1 | 370 | 0.28 | 0.13 | YES |
| 11 | NOD2 | NOD2 | NOD2 | 386 | 0.28 | 0.14 | YES |
| 12 | GBP1 | GBP1 | GBP1 | 400 | 0.28 | 0.15 | YES |
| 13 | IL2RB | IL2RB | IL2RB | 409 | 0.28 | 0.16 | YES |
| 14 | MAP3K8 | MAP3K8 | MAP3K8 | 432 | 0.27 | 0.17 | YES |
| 15 | OASL | OASL | OASL | 471 | 0.26 | 0.18 | YES |
| 16 | CISH | CISH | CISH | 584 | 0.25 | 0.18 | YES |
| 17 | IL1R1 | IL1R1 | IL1R1 | 588 | 0.25 | 0.19 | YES |
| 18 | SP100 | SP100 | SP100 | 625 | 0.24 | 0.2 | YES |
| 19 | SOCS3 | SOCS3 | SOCS3 | 647 | 0.24 | 0.21 | YES |
| 20 | IRF6 | IRF6 | IRF6 | 653 | 0.24 | 0.22 | YES |
| 21 | IL1RN | IL1RN | IL1RN | 720 | 0.23 | 0.23 | YES |
| 22 | XAF1 | XAF1 | XAF1 | 730 | 0.23 | 0.24 | YES |
| 23 | OAS1 | OAS1 | OAS1 | 735 | 0.23 | 0.25 | YES |
| 24 | MT2A | MT2A | MT2A | 818 | 0.22 | 0.25 | YES |
| 25 | IRF1 | IRF1 | IRF1 | 842 | 0.22 | 0.26 | YES |
| 26 | GBP2 | GBP2 | GBP2 | 843 | 0.22 | 0.27 | YES |
| 27 | GBP4 | GBP4 | GBP4 | 862 | 0.21 | 0.28 | YES |
| 28 | IFI35 | IFI35 | IFI35 | 911 | 0.21 | 0.28 | YES |
| 29 | IL1R2 | IL1R2 | IL1R2 | 919 | 0.21 | 0.29 | YES |
| 30 | IFITM3 | IFITM3 | IFITM3 | 922 | 0.21 | 0.3 | YES |
| 31 | IL1A | IL1A | IL1A | 925 | 0.21 | 0.31 | YES |
| 32 | HLA-G | HLA-G | HLA-G | 929 | 0.21 | 0.32 | YES |
| 33 | CSF2RB | CSF2RB | CSF2RB | 942 | 0.2 | 0.32 | YES |
| 34 | IL2RG | IL2RG | IL2RG | 1002 | 0.2 | 0.33 | YES |
| 35 | NOD1 | NOD1 | NOD1 | 1052 | 0.2 | 0.34 | YES |
| 36 | IFITM1 | IFITM1 | IFITM1 | 1088 | 0.19 | 0.34 | YES |
| 37 | CIITA | CIITA | CIITA | 1153 | 0.19 | 0.35 | YES |
| 38 | IFNB1 | IFNB1 | IFNB1 | 1215 | 0.18 | 0.35 | YES |
| 39 | SHC1 | SHC1 | SHC1 | 1217 | 0.18 | 0.36 | YES |
| 40 | IFITM2 | IFITM2 | IFITM2 | 1221 | 0.18 | 0.37 | YES |
| 41 | IRAK2 | IRAK2 | IRAK2 | 1255 | 0.18 | 0.37 | YES |
| 42 | OAS2 | OAS2 | OAS2 | 1320 | 0.17 | 0.38 | YES |
| 43 | IL6 | IL6 | IL6 | 1345 | 0.17 | 0.38 | YES |
| 44 | HLA-F | HLA-F | HLA-F | 1346 | 0.17 | 0.39 | YES |
| 45 | VCAM1 | VCAM1 | VCAM1 | 1356 | 0.17 | 0.4 | YES |
| 46 | PSMB8 | PSMB8 | PSMB8 | 1359 | 0.17 | 0.4 | YES |
| 47 | SOCS2 | SOCS2 | SOCS2 | 1410 | 0.17 | 0.41 | YES |
| 48 | CD44 | CD44 | CD44 | 1467 | 0.16 | 0.41 | YES |
| 49 | HLA-DQA2 | HLA-DQA2 | HLA-DQA2 | 1482 | 0.16 | 0.42 | YES |
| 50 | HLA-B | HLA-B | HLA-B | 1562 | 0.16 | 0.42 | YES |
| 51 | IRF7 | IRF7 | IRF7 | 1616 | 0.15 | 0.42 | YES |
| 52 | JAK3 | JAK3 | JAK3 | 1656 | 0.15 | 0.43 | YES |
| 53 | IL18 | IL18 | IL18 | 1701 | 0.15 | 0.43 | YES |
| 54 | VAV1 | VAV1 | VAV1 | 1726 | 0.15 | 0.44 | YES |
| 55 | MX2 | MX2 | MX2 | 1735 | 0.15 | 0.44 | YES |
| 56 | HLA-DPB1 | HLA-DPB1 | HLA-DPB1 | 1738 | 0.14 | 0.45 | YES |
| 57 | IL1B | IL1B | IL1B | 1749 | 0.14 | 0.45 | YES |
| 58 | FCGR1B | FCGR1B | FCGR1B | 1788 | 0.14 | 0.46 | YES |
| 59 | FCGR1A | FCGR1A | FCGR1A | 1796 | 0.14 | 0.46 | YES |
| 60 | LYN | LYN | LYN | 1802 | 0.14 | 0.47 | YES |
| 61 | MX1 | MX1 | MX1 | 1818 | 0.14 | 0.47 | YES |
| 62 | PTPN2 | PTPN2 | PTPN2 | 1829 | 0.14 | 0.48 | YES |
| 63 | HLA-DQA1 | HLA-DQA1 | HLA-DQA1 | 1858 | 0.14 | 0.48 | YES |
| 64 | HLA-A | HLA-A | HLA-A | 1936 | 0.14 | 0.48 | YES |
| 65 | IL1RAP | IL1RAP | IL1RAP | 1945 | 0.14 | 0.49 | YES |
| 66 | GBP6 | GBP6 | GBP6 | 2001 | 0.13 | 0.49 | YES |
| 67 | HLA-C | HLA-C | HLA-C | 2002 | 0.13 | 0.5 | YES |
| 68 | OAS3 | OAS3 | OAS3 | 2031 | 0.13 | 0.5 | YES |
| 69 | HCK | HCK | HCK | 2040 | 0.13 | 0.51 | YES |
| 70 | IRAK3 | IRAK3 | IRAK3 | 2057 | 0.13 | 0.51 | YES |
| 71 | STAT5A | STAT5A | STAT5A | 2062 | 0.13 | 0.52 | YES |
| 72 | HLA-DRB1 | HLA-DRB1 | HLA-DRB1 | 2099 | 0.13 | 0.52 | YES |
| 73 | HLA-DPA1 | HLA-DPA1 | HLA-DPA1 | 2177 | 0.12 | 0.52 | YES |
| 74 | HERC5 | HERC5 | HERC5 | 2201 | 0.12 | 0.52 | YES |
| 75 | IFI6 | IFI6 | IFI6 | 2216 | 0.12 | 0.53 | YES |
| 76 | B2M | B2M | B2M | 2237 | 0.12 | 0.53 | YES |
| 77 | IRF2 | IRF2 | IRF2 | 2250 | 0.12 | 0.54 | YES |
| 78 | IFIT3 | IFIT3 | IFIT3 | 2321 | 0.12 | 0.54 | YES |
| 79 | ISG15 | ISG15 | ISG15 | 2406 | 0.11 | 0.54 | YES |
| 80 | NFKB2 | NFKB2 | NFKB2 | 2434 | 0.11 | 0.54 | YES |
| 81 | PTPN6 | PTPN6 | PTPN6 | 2568 | 0.11 | 0.54 | YES |
| 82 | IRF5 | IRF5 | IRF5 | 2602 | 0.1 | 0.54 | YES |
| 83 | HLA-DRB5 | HLA-DRB5 | HLA-DRB5 | 2609 | 0.1 | 0.55 | YES |
| 84 | PML | PML | PML | 2671 | 0.1 | 0.55 | YES |
| 85 | USP18 | USP18 | USP18 | 2746 | 0.1 | 0.55 | YES |
| 86 | IFI27 | IFI27 | IFI27 | 2865 | 0.095 | 0.54 | YES |
| 87 | NUP37 | NUP37 | NUP37 | 2881 | 0.094 | 0.55 | YES |
| 88 | SQSTM1 | SQSTM1 | SQSTM1 | 2929 | 0.093 | 0.55 | YES |
| 89 | IRF3 | IRF3 | IRF3 | 2930 | 0.093 | 0.55 | YES |
| 90 | IFNGR2 | IFNGR2 | IFNGR2 | 2945 | 0.092 | 0.56 | YES |
| 91 | DDX58 | DDX58 | DDX58 | 2961 | 0.092 | 0.56 | YES |
| 92 | IRAK4 | IRAK4 | IRAK4 | 2965 | 0.092 | 0.56 | YES |
| 93 | MYD88 | MYD88 | MYD88 | 2966 | 0.092 | 0.57 | YES |
| 94 | CAMK2D | CAMK2D | CAMK2D | 2989 | 0.091 | 0.57 | YES |
| 95 | IRS2 | IRS2 | IRS2 | 3068 | 0.089 | 0.57 | YES |
| 96 | SYK | SYK | SYK | 3096 | 0.088 | 0.57 | YES |
| 97 | TRAF6 | TRAF6 | TRAF6 | 3120 | 0.087 | 0.57 | YES |
| 98 | RNASEL | RNASEL | RNASEL | 3233 | 0.084 | 0.57 | YES |
| 99 | EIF2AK2 | EIF2AK2 | EIF2AK2 | 3249 | 0.083 | 0.57 | YES |
| 100 | UBA7 | UBA7 | UBA7 | 3300 | 0.082 | 0.57 | YES |
| 101 | CSF2RA | CSF2RA | CSF2RA | 3335 | 0.081 | 0.58 | YES |
| 102 | UBE2L6 | UBE2L6 | UBE2L6 | 3377 | 0.08 | 0.58 | YES |
| 103 | STAT1 | STAT1 | STAT1 | 3588 | 0.074 | 0.57 | NO |
| 104 | IL6R | IL6R | IL6R | 3625 | 0.073 | 0.57 | NO |
| 105 | IRF9 | IRF9 | IRF9 | 3929 | 0.066 | 0.56 | NO |
| 106 | PRKCD | PRKCD | PRKCD | 4024 | 0.064 | 0.55 | NO |
| 107 | PTK2B | PTK2B | PTK2B | 4106 | 0.062 | 0.55 | NO |
| 108 | PRLR | PRLR | PRLR | 4152 | 0.062 | 0.55 | NO |
| 109 | IFIT1 | IFIT1 | IFIT1 | 4217 | 0.06 | 0.55 | NO |
| 110 | JAK2 | JAK2 | JAK2 | 4291 | 0.059 | 0.55 | NO |
| 111 | IRF8 | IRF8 | IRF8 | 4376 | 0.057 | 0.55 | NO |
| 112 | IFIT2 | IFIT2 | IFIT2 | 4379 | 0.057 | 0.55 | NO |
| 113 | STAT2 | STAT2 | STAT2 | 4443 | 0.056 | 0.55 | NO |
| 114 | RBX1 | RBX1 | RBX1 | 4469 | 0.056 | 0.55 | NO |
| 115 | CUL1 | CUL1 | CUL1 | 4793 | 0.049 | 0.53 | NO |
| 116 | RPS27A | RPS27A | RPS27A | 4814 | 0.049 | 0.53 | NO |
| 117 | IFNGR1 | IFNGR1 | IFNGR1 | 4825 | 0.049 | 0.54 | NO |
| 118 | BLNK | BLNK | BLNK | 4869 | 0.048 | 0.53 | NO |
| 119 | STAT3 | STAT3 | STAT3 | 4888 | 0.047 | 0.54 | NO |
| 120 | ADAM17 | ADAM17 | ADAM17 | 5060 | 0.044 | 0.53 | NO |
| 121 | NUP54 | NUP54 | NUP54 | 5268 | 0.041 | 0.52 | NO |
| 122 | UBA52 | UBA52 | UBA52 | 5368 | 0.039 | 0.51 | NO |
| 123 | IFNAR1 | IFNAR1 | IFNAR1 | 5373 | 0.039 | 0.52 | NO |
| 124 | TRIM25 | TRIM25 | TRIM25 | 5375 | 0.039 | 0.52 | NO |
| 125 | IRF4 | IRF4 | IRF4 | 5419 | 0.039 | 0.52 | NO |
| 126 | SKP1 | SKP1 | SKP1 | 5672 | 0.035 | 0.5 | NO |
| 127 | SEH1L | SEH1L | SEH1L | 5798 | 0.033 | 0.5 | NO |
| 128 | IRAK1 | IRAK1 | IRAK1 | 5877 | 0.032 | 0.5 | NO |
| 129 | IL6ST | IL6ST | IL6ST | 5887 | 0.032 | 0.5 | NO |
| 130 | KPNA4 | KPNA4 | KPNA4 | 5937 | 0.031 | 0.5 | NO |
| 131 | NEDD4 | NEDD4 | NEDD4 | 6001 | 0.03 | 0.49 | NO |
| 132 | PIK3CD | PIK3CD | PIK3CD | 6029 | 0.03 | 0.49 | NO |
| 133 | TNIP2 | TNIP2 | TNIP2 | 6064 | 0.029 | 0.49 | NO |
| 134 | EIF4E | EIF4E | EIF4E | 6085 | 0.029 | 0.49 | NO |
| 135 | EIF4A3 | EIF4A3 | EIF4A3 | 6289 | 0.026 | 0.48 | NO |
| 136 | IKBKB | IKBKB | IKBKB | 6382 | 0.025 | 0.48 | NO |
| 137 | IKBKG | IKBKG | IKBKG | 6526 | 0.023 | 0.47 | NO |
| 138 | IFNAR2 | IFNAR2 | IFNAR2 | 6583 | 0.022 | 0.47 | NO |
| 139 | UBE2E1 | UBE2E1 | UBE2E1 | 6799 | 0.02 | 0.46 | NO |
| 140 | SUMO1 | SUMO1 | SUMO1 | 6841 | 0.019 | 0.46 | NO |
| 141 | EIF4G2 | EIF4G2 | EIF4G2 | 7026 | 0.016 | 0.45 | NO |
| 142 | RIPK2 | RIPK2 | RIPK2 | 7049 | 0.016 | 0.45 | NO |
| 143 | YWHAZ | YWHAZ | YWHAZ | 7211 | 0.014 | 0.44 | NO |
| 144 | NUP205 | NUP205 | NUP205 | 7244 | 0.014 | 0.44 | NO |
| 145 | EIF4A1 | EIF4A1 | EIF4A1 | 7254 | 0.013 | 0.44 | NO |
| 146 | GRB2 | GRB2 | GRB2 | 7292 | 0.013 | 0.44 | NO |
| 147 | PTPN1 | PTPN1 | PTPN1 | 7394 | 0.012 | 0.43 | NO |
| 148 | YES1 | YES1 | YES1 | 7401 | 0.012 | 0.43 | NO |
| 149 | PTAFR | PTAFR | PTAFR | 7479 | 0.011 | 0.43 | NO |
| 150 | NRAS | NRAS | NRAS | 7535 | 0.01 | 0.42 | NO |
| 151 | NUP210 | NUP210 | NUP210 | 7550 | 0.01 | 0.42 | NO |
| 152 | HRAS | HRAS | HRAS | 7626 | 0.009 | 0.42 | NO |
| 153 | PIK3CB | PIK3CB | PIK3CB | 7628 | 0.0089 | 0.42 | NO |
| 154 | NUP85 | NUP85 | NUP85 | 7654 | 0.0085 | 0.42 | NO |
| 155 | TAB2 | TAB2 | TAB2 | 7665 | 0.0083 | 0.42 | NO |
| 156 | CRK | CRK | CRK | 7833 | 0.0062 | 0.41 | NO |
| 157 | ARIH1 | ARIH1 | ARIH1 | 7927 | 0.0051 | 0.4 | NO |
| 158 | TYK2 | TYK2 | TYK2 | 7945 | 0.0049 | 0.4 | NO |
| 159 | RELA | RELA | RELA | 8026 | 0.0039 | 0.4 | NO |
| 160 | EIF4E2 | EIF4E2 | EIF4E2 | 8072 | 0.0033 | 0.4 | NO |
| 161 | EGR1 | EGR1 | EGR1 | 8093 | 0.0031 | 0.4 | NO |
| 162 | CHUK | CHUK | CHUK | 8196 | 0.0016 | 0.39 | NO |
| 163 | UBE2N | UBE2N | UBE2N | 8230 | 0.0011 | 0.39 | NO |
| 164 | NUP62 | NUP62 | NUP62 | 8292 | 0.00031 | 0.38 | NO |
| 165 | ADAR | ADAR | ADAR | 8365 | -0.00047 | 0.38 | NO |
| 166 | RAE1 | RAE1 | RAE1 | 8366 | -0.00047 | 0.38 | NO |
| 167 | RANBP2 | RANBP2 | RANBP2 | 8482 | -0.002 | 0.38 | NO |
| 168 | PIK3CA | PIK3CA | PIK3CA | 8531 | -0.0027 | 0.37 | NO |
| 169 | CAMK2B | CAMK2B | CAMK2B | 8549 | -0.003 | 0.37 | NO |
| 170 | TPR | TPR | TPR | 8560 | -0.0031 | 0.37 | NO |
| 171 | EIF4E3 | EIF4E3 | EIF4E3 | 8575 | -0.0034 | 0.37 | NO |
| 172 | EIF4A2 | EIF4A2 | EIF4A2 | 8744 | -0.0054 | 0.36 | NO |
| 173 | EIF4G1 | EIF4G1 | EIF4G1 | 8834 | -0.0066 | 0.36 | NO |
| 174 | PIN1 | PIN1 | PIN1 | 8836 | -0.0066 | 0.36 | NO |
| 175 | TOLLIP | TOLLIP | TOLLIP | 8857 | -0.0068 | 0.36 | NO |
| 176 | IL3RA | IL3RA | IL3RA | 8932 | -0.0078 | 0.35 | NO |
| 177 | MAP2K1 | MAP2K1 | MAP2K1 | 8969 | -0.0081 | 0.35 | NO |
| 178 | PIAS1 | PIAS1 | PIAS1 | 8974 | -0.0082 | 0.35 | NO |
| 179 | PLCG1 | PLCG1 | PLCG1 | 9029 | -0.0089 | 0.35 | NO |
| 180 | NUPL2 | NUPL2 | NUPL2 | 9113 | -0.0099 | 0.34 | NO |
| 181 | INPPL1 | INPPL1 | INPPL1 | 9176 | -0.011 | 0.34 | NO |
| 182 | MAP3K7 | MAP3K7 | MAP3K7 | 9323 | -0.013 | 0.33 | NO |
| 183 | NUP50 | NUP50 | NUP50 | 9358 | -0.013 | 0.33 | NO |
| 184 | KPNB1 | KPNB1 | KPNB1 | 9366 | -0.013 | 0.33 | NO |
| 185 | NUP153 | NUP153 | NUP153 | 9385 | -0.014 | 0.33 | NO |
| 186 | MAPK3 | MAPK3 | MAPK3 | 9399 | -0.014 | 0.33 | NO |
| 187 | FLNB | FLNB | FLNB | 9566 | -0.016 | 0.32 | NO |
| 188 | NUP155 | NUP155 | NUP155 | 9674 | -0.018 | 0.32 | NO |
| 189 | MAP2K2 | MAP2K2 | MAP2K2 | 9725 | -0.018 | 0.32 | NO |
| 190 | JAK1 | JAK1 | JAK1 | 9768 | -0.019 | 0.31 | NO |
| 191 | MAPK1 | MAPK1 | MAPK1 | 9826 | -0.02 | 0.31 | NO |
| 192 | TAB1 | TAB1 | TAB1 | 10033 | -0.023 | 0.3 | NO |
| 193 | KPNA2 | KPNA2 | KPNA2 | 10084 | -0.023 | 0.3 | NO |
| 194 | KPNA1 | KPNA1 | KPNA1 | 10115 | -0.024 | 0.3 | NO |
| 195 | NUPL1 | NUPL1 | NUPL1 | 10158 | -0.024 | 0.3 | NO |
| 196 | NUP133 | NUP133 | NUP133 | 10239 | -0.025 | 0.29 | NO |
| 197 | IFNG | IFNG | IFNG | 10336 | -0.026 | 0.29 | NO |
| 198 | POM121 | POM121 | POM121 | 10381 | -0.027 | 0.29 | NO |
| 199 | KPNA3 | KPNA3 | KPNA3 | 10418 | -0.028 | 0.29 | NO |
| 200 | YWHAB | YWHAB | YWHAB | 10422 | -0.028 | 0.29 | NO |
| 201 | CDK1 | CDK1 | CDK1 | 10503 | -0.029 | 0.28 | NO |
| 202 | PPM1B | PPM1B | PPM1B | 10550 | -0.03 | 0.28 | NO |
| 203 | STAT5B | STAT5B | STAT5B | 10664 | -0.031 | 0.28 | NO |
| 204 | HGF | HGF | HGF | 10779 | -0.033 | 0.27 | NO |
| 205 | IL5RA | IL5RA | IL5RA | 10893 | -0.035 | 0.27 | NO |
| 206 | NUP88 | NUP88 | NUP88 | 10911 | -0.035 | 0.27 | NO |
| 207 | IRS1 | IRS1 | IRS1 | 11046 | -0.037 | 0.26 | NO |
| 208 | MAP3K3 | MAP3K3 | MAP3K3 | 11151 | -0.039 | 0.26 | NO |
| 209 | TAB3 | TAB3 | TAB3 | 11157 | -0.039 | 0.26 | NO |
| 210 | NUP214 | NUP214 | NUP214 | 11172 | -0.039 | 0.26 | NO |
| 211 | NUP43 | NUP43 | NUP43 | 11364 | -0.043 | 0.25 | NO |
| 212 | KRAS | KRAS | KRAS | 11412 | -0.044 | 0.25 | NO |
| 213 | NUP107 | NUP107 | NUP107 | 11465 | -0.045 | 0.25 | NO |
| 214 | EIF4G3 | EIF4G3 | EIF4G3 | 11609 | -0.047 | 0.25 | NO |
| 215 | SOS1 | SOS1 | SOS1 | 11782 | -0.05 | 0.24 | NO |
| 216 | MAP2K6 | MAP2K6 | MAP2K6 | 11839 | -0.051 | 0.24 | NO |
| 217 | NUP93 | NUP93 | NUP93 | 12060 | -0.055 | 0.23 | NO |
| 218 | NUP35 | NUP35 | NUP35 | 12071 | -0.055 | 0.23 | NO |
| 219 | RAPGEF1 | RAPGEF1 | RAPGEF1 | 12092 | -0.056 | 0.23 | NO |
| 220 | CRKL | CRKL | CRKL | 12099 | -0.056 | 0.23 | NO |
| 221 | GAB2 | GAB2 | GAB2 | 12194 | -0.057 | 0.23 | NO |
| 222 | SH2B1 | SH2B1 | SH2B1 | 12250 | -0.058 | 0.23 | NO |
| 223 | RAF1 | RAF1 | RAF1 | 12385 | -0.061 | 0.22 | NO |
| 224 | PELI2 | PELI2 | PELI2 | 12468 | -0.063 | 0.22 | NO |
| 225 | CBL | CBL | CBL | 12478 | -0.063 | 0.22 | NO |
| 226 | IP6K2 | IP6K2 | IP6K2 | 12509 | -0.064 | 0.22 | NO |
| 227 | PIK3R1 | PIK3R1 | PIK3R1 | 12536 | -0.064 | 0.23 | NO |
| 228 | AAAS | AAAS | AAAS | 12546 | -0.064 | 0.23 | NO |
| 229 | NUP188 | NUP188 | NUP188 | 12782 | -0.07 | 0.22 | NO |
| 230 | PRKACB | PRKACB | PRKACB | 12789 | -0.07 | 0.22 | NO |
| 231 | PELI3 | PELI3 | PELI3 | 12840 | -0.071 | 0.22 | NO |
| 232 | GBP7 | GBP7 | GBP7 | 12960 | -0.074 | 0.22 | NO |
| 233 | PIK3R2 | PIK3R2 | PIK3R2 | 13126 | -0.079 | 0.21 | NO |
| 234 | PELI1 | PELI1 | PELI1 | 13646 | -0.093 | 0.19 | NO |
| 235 | FYN | FYN | FYN | 13731 | -0.096 | 0.19 | NO |
| 236 | MAP2K4 | MAP2K4 | MAP2K4 | 13766 | -0.097 | 0.19 | NO |
| 237 | GHR | GHR | GHR | 14098 | -0.11 | 0.18 | NO |
| 238 | IL5 | IL5 | IL5 | 14401 | -0.12 | 0.16 | NO |
| 239 | KPNA5 | KPNA5 | KPNA5 | 14470 | -0.12 | 0.16 | NO |
| 240 | PIK3R3 | PIK3R3 | PIK3R3 | 14862 | -0.14 | 0.15 | NO |
| 241 | BTRC | BTRC | BTRC | 14930 | -0.14 | 0.15 | NO |
| 242 | TMEM189-UBE2V1 | TMEM189-UBE2V1 | TMEM189-UBE2V1 | 15064 | -0.15 | 0.15 | NO |
| 243 | NCAM1 | NCAM1 | NCAM1 | 15874 | -0.2 | 0.11 | NO |
| 244 | CAMK2A | CAMK2A | CAMK2A | 17233 | -0.36 | 0.053 | NO |
Figure S29. Get High-res Image This plot shows mRNAseq_cNMF expression data heatmap (on the left) a RunningEnrichmentScore(RES) plot (on the top right) and a Signal2Noise(S2N) plot (on the bottom right) of genes in the pathway: ST TUMOR NECROSIS FACTOR PATHWAY.
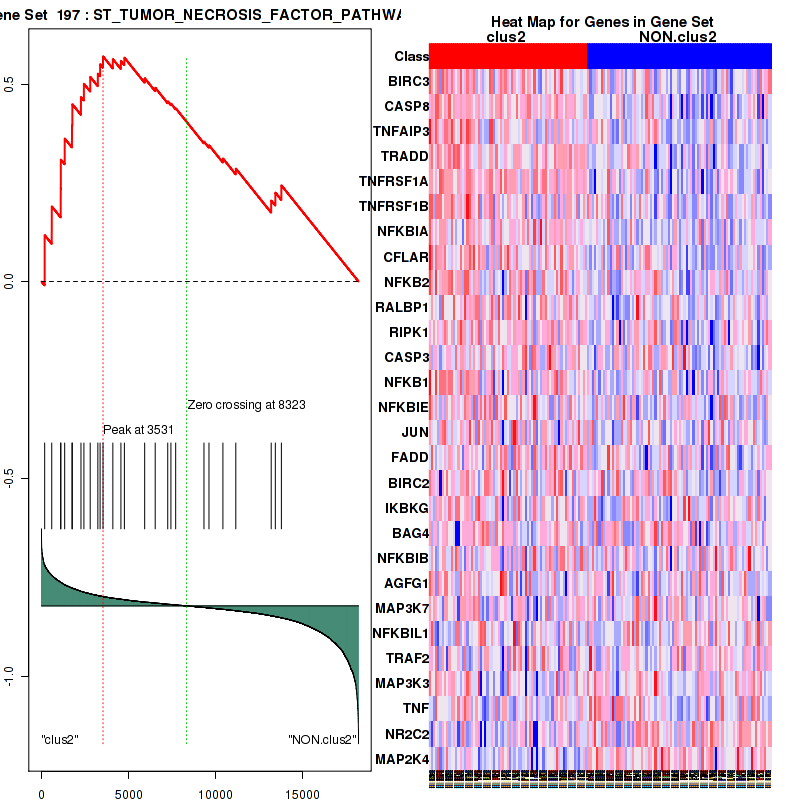
Figure S30. Get High-res Image For the top 5 core enriched genes in the pathway: ST TUMOR NECROSIS FACTOR PATHWAY, this volcano plot shows how much they are up/down-regulated and significant. The significance was calculated by empirical bayesian fit
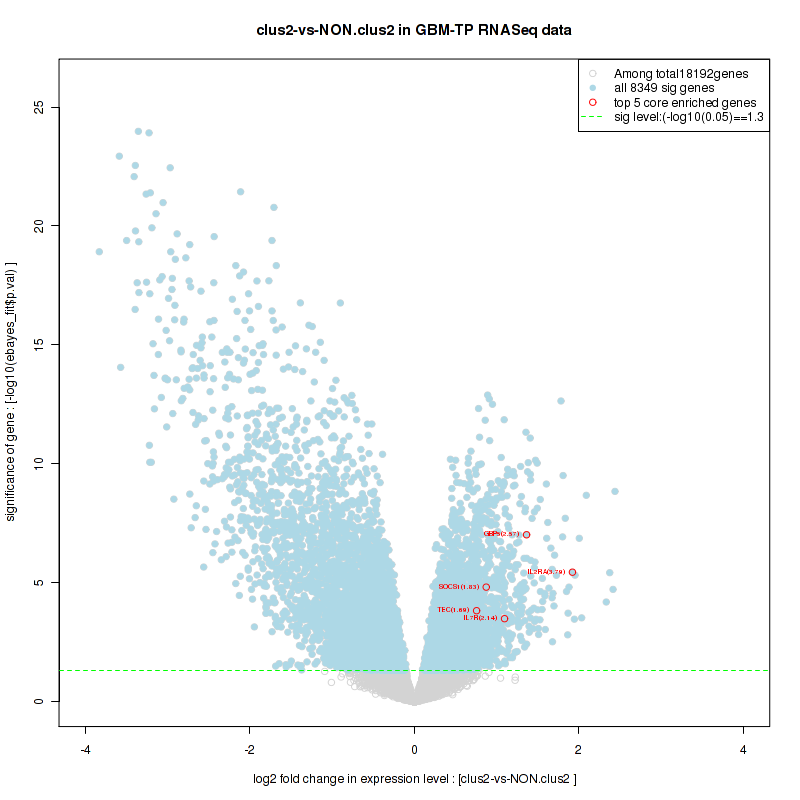
Table S16. Get Full Table This table shows a Running Enrichment Score (RES) of each gene in this pathway, that is, the enrichment score at this point in the ranked list of genes. All genes are ranked by Signal-to-Noise (S2N), a measure of similarity as default and are used to obtain ES matrix of all genes. In this way, GSEA tool uses expression pattern of not only overlapped genes but also not-overlapped genes to produce ES matrix.
| Rank | GENE | SYMBOL | DESC | LIST.LOC | S2N | RES | CORE_ENRICHMENT |
|---|---|---|---|---|---|---|---|
| 1 | BIRC3 | BIRC3 | BIRC3 | 183 | 0.33 | 0.062 | YES |
| 2 | CASP7 | CASP7 | CASP7 | 504 | 0.26 | 0.1 | YES |
| 3 | FAS | FAS | FAS | 543 | 0.26 | 0.15 | YES |
| 4 | CASP8 | CASP8 | CASP8 | 590 | 0.25 | 0.2 | YES |
| 5 | FASLG | FASLG | FASLG | 824 | 0.22 | 0.24 | YES |
| 6 | TRADD | TRADD | TRADD | 1110 | 0.19 | 0.26 | YES |
| 7 | TNFRSF1A | TNFRSF1A | TNFRSF1A | 1333 | 0.17 | 0.29 | YES |
| 8 | CASP6 | CASP6 | CASP6 | 1465 | 0.16 | 0.32 | YES |
| 9 | TNFRSF1B | TNFRSF1B | TNFRSF1B | 1751 | 0.14 | 0.33 | YES |
| 10 | NFKBIA | NFKBIA | NFKBIA | 1772 | 0.14 | 0.36 | YES |
| 11 | LMNA | LMNA | LMNA | 1956 | 0.13 | 0.38 | YES |
| 12 | CFLAR | CFLAR | CFLAR | 2266 | 0.12 | 0.39 | YES |
| 13 | ARHGDIB | ARHGDIB | ARHGDIB | 2715 | 0.1 | 0.39 | YES |
| 14 | TRAF1 | TRAF1 | TRAF1 | 2819 | 0.097 | 0.4 | YES |
| 15 | PSEN2 | PSEN2 | PSEN2 | 2882 | 0.094 | 0.42 | YES |
| 16 | RIPK1 | RIPK1 | RIPK1 | 3235 | 0.084 | 0.42 | YES |
| 17 | CASP3 | CASP3 | CASP3 | 3365 | 0.08 | 0.43 | YES |
| 18 | NFKB1 | NFKB1 | NFKB1 | 3531 | 0.075 | 0.44 | YES |
| 19 | PRKCD | PRKCD | PRKCD | 4024 | 0.064 | 0.42 | NO |
| 20 | FADD | FADD | FADD | 4758 | 0.05 | 0.39 | NO |
| 21 | CYCS | CYCS | CYCS | 4958 | 0.046 | 0.39 | NO |
| 22 | MAP3K14 | MAP3K14 | MAP3K14 | 5365 | 0.04 | 0.38 | NO |
| 23 | RB1 | RB1 | RB1 | 5473 | 0.038 | 0.38 | NO |
| 24 | BIRC2 | BIRC2 | BIRC2 | 5922 | 0.031 | 0.36 | NO |
| 25 | MAP3K5 | MAP3K5 | MAP3K5 | 6130 | 0.029 | 0.36 | NO |
| 26 | RASA1 | RASA1 | RASA1 | 6139 | 0.028 | 0.36 | NO |
| 27 | GSN | GSN | GSN | 6581 | 0.022 | 0.34 | NO |
| 28 | ACTG1 | ACTG1 | ACTG1 | 6714 | 0.021 | 0.34 | NO |
| 29 | XIAP | XIAP | XIAP | 6825 | 0.019 | 0.34 | NO |
| 30 | BAG4 | BAG4 | BAG4 | 7246 | 0.013 | 0.32 | NO |
| 31 | DFFA | DFFA | DFFA | 7663 | 0.0083 | 0.3 | NO |
| 32 | CRADD | CRADD | CRADD | 7692 | 0.0078 | 0.3 | NO |
| 33 | RELA | RELA | RELA | 8026 | 0.0039 | 0.28 | NO |
| 34 | BID | BID | BID | 8078 | 0.0032 | 0.28 | NO |
| 35 | DAXX | DAXX | DAXX | 8185 | 0.0017 | 0.27 | NO |
| 36 | CHUK | CHUK | CHUK | 8196 | 0.0016 | 0.27 | NO |
| 37 | PAK2 | PAK2 | PAK2 | 8301 | 0.0002 | 0.27 | NO |
| 38 | PSEN1 | PSEN1 | PSEN1 | 8732 | -0.0053 | 0.24 | NO |
| 39 | CDK11B | CDK11B | CDK11B | 9611 | -0.017 | 0.2 | NO |
| 40 | CASP2 | CASP2 | CASP2 | 9854 | -0.02 | 0.19 | NO |
| 41 | PRKDC | PRKDC | PRKDC | 10163 | -0.024 | 0.18 | NO |
| 42 | MDM2 | MDM2 | MDM2 | 10254 | -0.025 | 0.18 | NO |
| 43 | BCL2 | BCL2 | BCL2 | 10322 | -0.026 | 0.18 | NO |
| 44 | TRAF2 | TRAF2 | TRAF2 | 10411 | -0.028 | 0.18 | NO |
| 45 | PARP1 | PARP1 | PARP1 | 11036 | -0.037 | 0.16 | NO |
| 46 | CDK11A | CDK11A | CDK11A | 11153 | -0.039 | 0.16 | NO |
| 47 | MAP2K7 | MAP2K7 | MAP2K7 | 12049 | -0.055 | 0.12 | NO |
| 48 | PTK2 | PTK2 | PTK2 | 12222 | -0.058 | 0.12 | NO |
| 49 | CASP9 | CASP9 | CASP9 | 12543 | -0.064 | 0.12 | NO |
| 50 | SPTAN1 | SPTAN1 | SPTAN1 | 12695 | -0.068 | 0.12 | NO |
| 51 | NUMA1 | NUMA1 | NUMA1 | 12980 | -0.075 | 0.12 | NO |
| 52 | MAP3K1 | MAP3K1 | MAP3K1 | 13045 | -0.076 | 0.14 | NO |
| 53 | TNF | TNF | TNF | 13181 | -0.08 | 0.15 | NO |
| 54 | APAF1 | APAF1 | APAF1 | 13410 | -0.086 | 0.15 | NO |
| 55 | DFFB | DFFB | DFFB | 13633 | -0.093 | 0.16 | NO |
| 56 | LMNB2 | LMNB2 | LMNB2 | 13881 | -0.1 | 0.17 | NO |
| 57 | LMNB1 | LMNB1 | LMNB1 | 14904 | -0.14 | 0.14 | NO |
| 58 | MAPK8 | MAPK8 | MAPK8 | 15394 | -0.17 | 0.15 | NO |
Figure S31. Get High-res Image This plot shows mRNAseq_cNMF expression data heatmap (on the left) a RunningEnrichmentScore(RES) plot (on the top right) and a Signal2Noise(S2N) plot (on the bottom right) of genes in the pathway: PID SYNDECAN 4 PATHWAY.
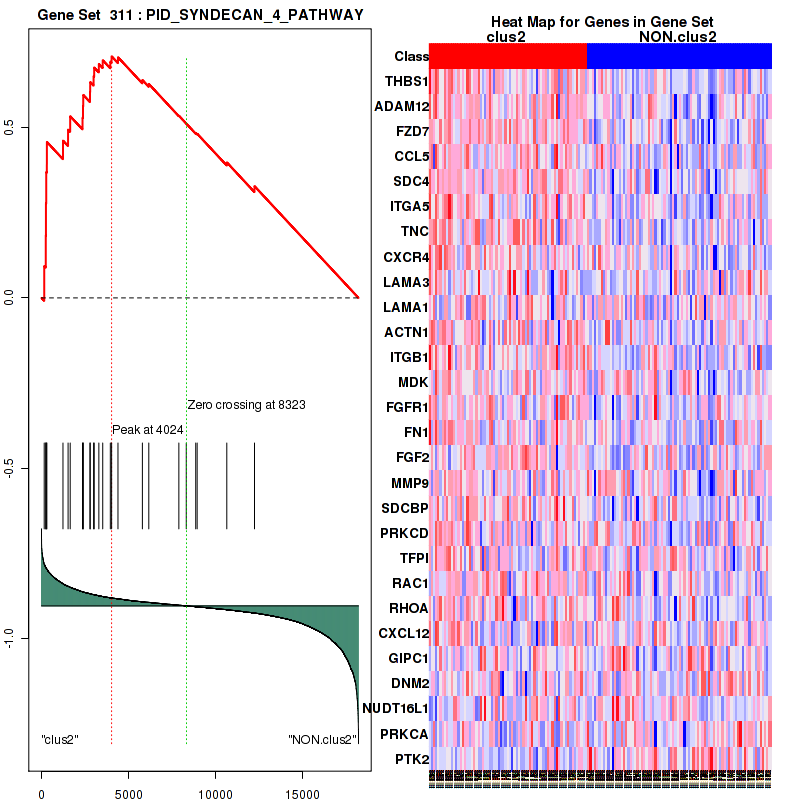
Figure S32. Get High-res Image For the top 5 core enriched genes in the pathway: PID SYNDECAN 4 PATHWAY, this volcano plot shows how much they are up/down-regulated and significant. The significance was calculated by empirical bayesian fit
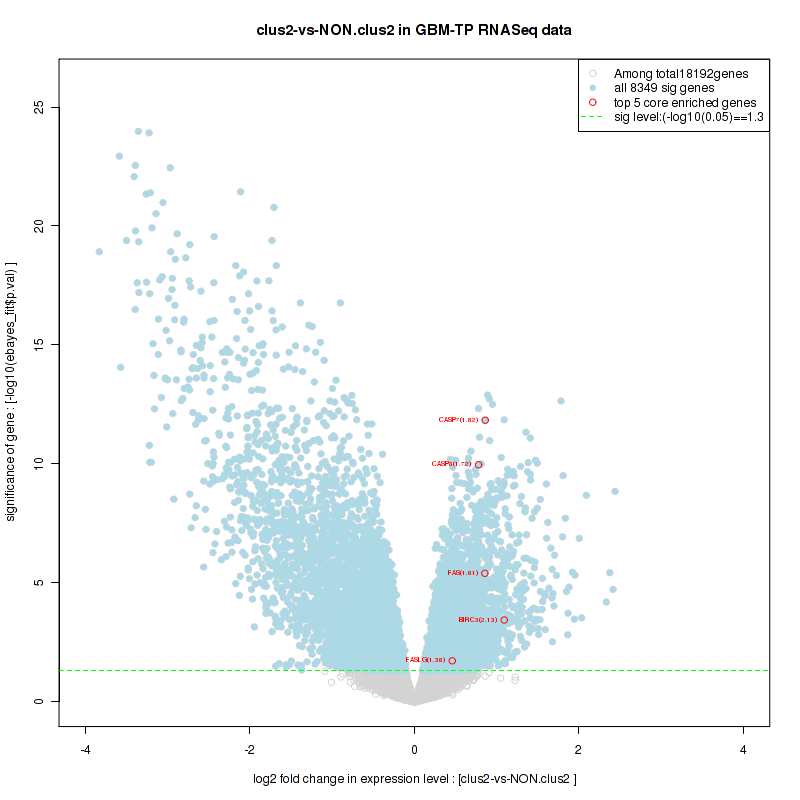
Table S17. Get Full Table This table shows a Running Enrichment Score (RES) of each gene in this pathway, that is, the enrichment score at this point in the ranked list of genes. All genes are ranked by Signal-to-Noise (S2N), a measure of similarity as default and are used to obtain ES matrix of all genes. In this way, GSEA tool uses expression pattern of not only overlapped genes but also not-overlapped genes to produce ES matrix.
| Rank | GENE | SYMBOL | DESC | LIST.LOC | S2N | RES | CORE_ENRICHMENT |
|---|---|---|---|---|---|---|---|
| 1 | THBS1 | THBS1 | THBS1 | 159 | 0.34 | 0.094 | YES |
| 2 | ADAM12 | ADAM12 | ADAM12 | 247 | 0.31 | 0.18 | YES |
| 3 | FZD7 | FZD7 | FZD7 | 258 | 0.31 | 0.28 | YES |
| 4 | CCL5 | CCL5 | CCL5 | 275 | 0.3 | 0.37 | YES |
| 5 | SDC4 | SDC4 | SDC4 | 310 | 0.3 | 0.46 | YES |
| 6 | ITGA5 | ITGA5 | ITGA5 | 1235 | 0.18 | 0.46 | YES |
| 7 | TNC | TNC | TNC | 1527 | 0.16 | 0.5 | YES |
| 8 | CXCR4 | CXCR4 | CXCR4 | 1649 | 0.15 | 0.53 | YES |
| 9 | LAMA3 | LAMA3 | LAMA3 | 2356 | 0.11 | 0.53 | YES |
| 10 | LAMA1 | LAMA1 | LAMA1 | 2383 | 0.11 | 0.56 | YES |
| 11 | ACTN1 | ACTN1 | ACTN1 | 2397 | 0.11 | 0.6 | YES |
| 12 | ITGB1 | ITGB1 | ITGB1 | 2784 | 0.098 | 0.6 | YES |
| 13 | MDK | MDK | MDK | 2797 | 0.098 | 0.64 | YES |
| 14 | FGFR1 | FGFR1 | FGFR1 | 2992 | 0.091 | 0.65 | YES |
| 15 | FN1 | FN1 | FN1 | 3025 | 0.09 | 0.68 | YES |
| 16 | FGF2 | FGF2 | FGF2 | 3292 | 0.082 | 0.69 | YES |
| 17 | MMP9 | MMP9 | MMP9 | 3514 | 0.076 | 0.7 | YES |
| 18 | SDCBP | SDCBP | SDCBP | 3951 | 0.065 | 0.7 | YES |
| 19 | PRKCD | PRKCD | PRKCD | 4024 | 0.064 | 0.71 | YES |
| 20 | TFPI | TFPI | TFPI | 4391 | 0.057 | 0.71 | NO |
| 21 | RAC1 | RAC1 | RAC1 | 5790 | 0.033 | 0.64 | NO |
| 22 | RHOA | RHOA | RHOA | 6157 | 0.028 | 0.63 | NO |
| 23 | CXCL12 | CXCL12 | CXCL12 | 7882 | 0.0055 | 0.54 | NO |
| 24 | GIPC1 | GIPC1 | GIPC1 | 8309 | 0.00013 | 0.51 | NO |
| 25 | DNM2 | DNM2 | DNM2 | 8852 | -0.0068 | 0.48 | NO |
| 26 | NUDT16L1 | NUDT16L1 | NUDT16L1 | 8934 | -0.0078 | 0.48 | NO |
| 27 | PRKCA | PRKCA | PRKCA | 10635 | -0.031 | 0.4 | NO |
| 28 | PTK2 | PTK2 | PTK2 | 12222 | -0.058 | 0.33 | NO |
Figure S33. Get High-res Image This plot shows mRNAseq_cNMF expression data heatmap (on the left) a RunningEnrichmentScore(RES) plot (on the top right) and a Signal2Noise(S2N) plot (on the bottom right) of genes in the pathway: PID HIVNEFPATHWAY.
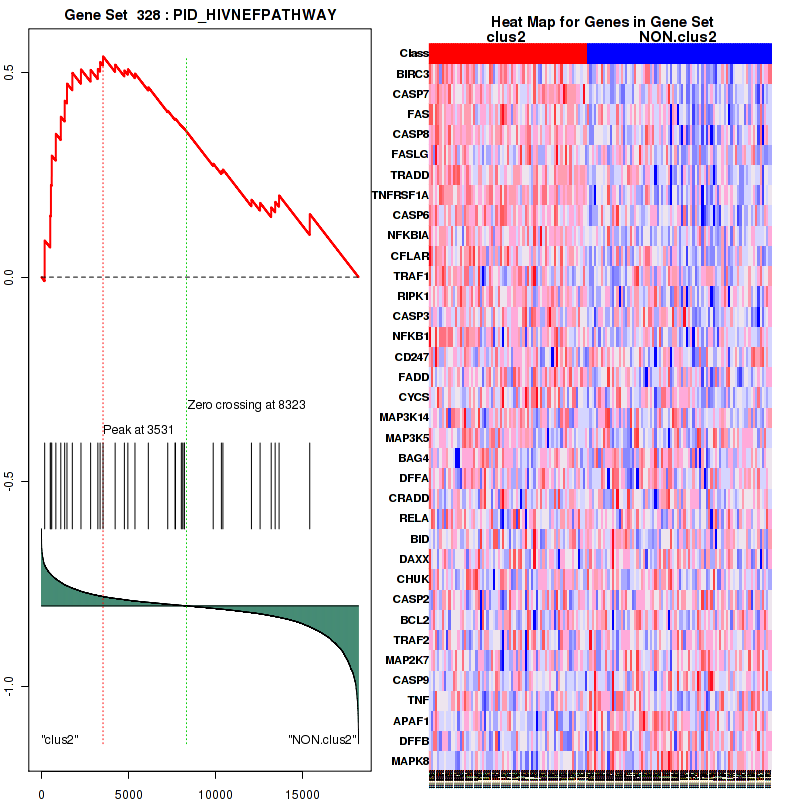
Figure S34. Get High-res Image For the top 5 core enriched genes in the pathway: PID HIVNEFPATHWAY, this volcano plot shows how much they are up/down-regulated and significant. The significance was calculated by empirical bayesian fit
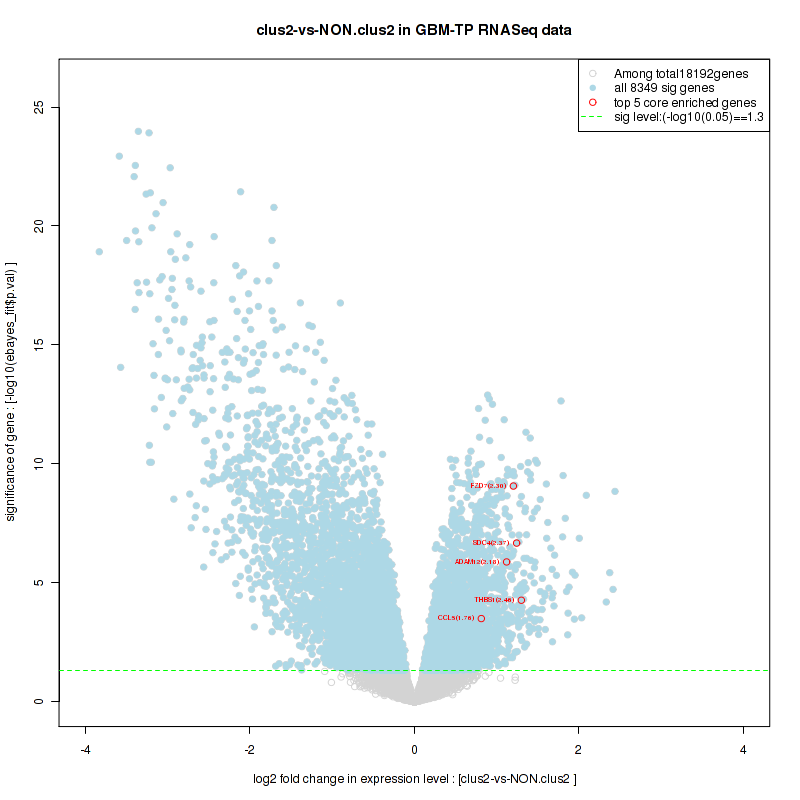
Table S18. Get Full Table This table shows a Running Enrichment Score (RES) of each gene in this pathway, that is, the enrichment score at this point in the ranked list of genes. All genes are ranked by Signal-to-Noise (S2N), a measure of similarity as default and are used to obtain ES matrix of all genes. In this way, GSEA tool uses expression pattern of not only overlapped genes but also not-overlapped genes to produce ES matrix.
| Rank | GENE | SYMBOL | DESC | LIST.LOC | S2N | RES | CORE_ENRICHMENT |
|---|---|---|---|---|---|---|---|
| 1 | KDELR3 | KDELR3 | KDELR3 | 9 | 0.49 | 0.095 | YES |
| 2 | CCL2 | CCL2 | CCL2 | 142 | 0.35 | 0.16 | YES |
| 3 | PDIA5 | PDIA5 | PDIA5 | 530 | 0.26 | 0.18 | YES |
| 4 | IL8 | IL8 | IL8 | 696 | 0.23 | 0.22 | YES |
| 5 | WIPI1 | WIPI1 | WIPI1 | 1124 | 0.19 | 0.23 | YES |
| 6 | SHC1 | SHC1 | SHC1 | 1217 | 0.18 | 0.26 | YES |
| 7 | LMNA | LMNA | LMNA | 1956 | 0.13 | 0.25 | YES |
| 8 | IGFBP1 | IGFBP1 | IGFBP1 | 2137 | 0.12 | 0.26 | YES |
| 9 | CUL7 | CUL7 | CUL7 | 2255 | 0.12 | 0.28 | YES |
| 10 | ATF3 | ATF3 | ATF3 | 2554 | 0.11 | 0.28 | YES |
| 11 | FKBP14 | FKBP14 | FKBP14 | 2599 | 0.1 | 0.3 | YES |
| 12 | TPP1 | TPP1 | TPP1 | 2689 | 0.1 | 0.32 | YES |
| 13 | XBP1 | XBP1 | XBP1 | 2856 | 0.095 | 0.33 | YES |
| 14 | C19orf10 | C19orf10 | C19orf10 | 2952 | 0.092 | 0.34 | YES |
| 15 | PDIA6 | PDIA6 | PDIA6 | 3034 | 0.09 | 0.35 | YES |
| 16 | DNAJC3 | DNAJC3 | DNAJC3 | 3211 | 0.085 | 0.36 | YES |
| 17 | DNAJB9 | DNAJB9 | DNAJB9 | 3258 | 0.083 | 0.37 | YES |
| 18 | HERPUD1 | HERPUD1 | HERPUD1 | 3321 | 0.081 | 0.39 | YES |
| 19 | CALR | CALR | CALR | 3362 | 0.08 | 0.4 | YES |
| 20 | HSPA5 | HSPA5 | HSPA5 | 3560 | 0.074 | 0.4 | YES |
| 21 | HSP90B1 | HSP90B1 | HSP90B1 | 3878 | 0.067 | 0.4 | NO |
| 22 | EDEM1 | EDEM1 | EDEM1 | 4050 | 0.063 | 0.4 | NO |
| 23 | EIF2S1 | EIF2S1 | EIF2S1 | 5489 | 0.038 | 0.33 | NO |
| 24 | SRPRB | SRPRB | SRPRB | 5676 | 0.035 | 0.33 | NO |
| 25 | YIF1A | YIF1A | YIF1A | 5785 | 0.033 | 0.33 | NO |
| 26 | PREB | PREB | PREB | 5844 | 0.032 | 0.33 | NO |
| 27 | TLN1 | TLN1 | TLN1 | 6008 | 0.03 | 0.33 | NO |
| 28 | SSR1 | SSR1 | SSR1 | 6042 | 0.03 | 0.33 | NO |
| 29 | SRPR | SRPR | SRPR | 6070 | 0.029 | 0.34 | NO |
| 30 | SERP1 | SERP1 | SERP1 | 6164 | 0.028 | 0.34 | NO |
| 31 | DNAJB11 | DNAJB11 | DNAJB11 | 6232 | 0.027 | 0.34 | NO |
| 32 | SEC31A | SEC31A | SEC31A | 6247 | 0.027 | 0.34 | NO |
| 33 | EIF2AK3 | EIF2AK3 | EIF2AK3 | 6291 | 0.026 | 0.34 | NO |
| 34 | ATF6 | ATF6 | ATF6 | 6353 | 0.026 | 0.35 | NO |
| 35 | PARN | PARN | PARN | 6395 | 0.025 | 0.35 | NO |
| 36 | EXOSC4 | EXOSC4 | EXOSC4 | 6522 | 0.023 | 0.35 | NO |
| 37 | ERN1 | ERN1 | ERN1 | 6643 | 0.022 | 0.34 | NO |
| 38 | ACADVL | ACADVL | ACADVL | 6660 | 0.021 | 0.35 | NO |
| 39 | ATF4 | ATF4 | ATF4 | 6833 | 0.019 | 0.34 | NO |
| 40 | MBTPS2 | MBTPS2 | MBTPS2 | 7037 | 0.016 | 0.33 | NO |
| 41 | EXTL3 | EXTL3 | EXTL3 | 7296 | 0.013 | 0.32 | NO |
| 42 | EXOSC3 | EXOSC3 | EXOSC3 | 7895 | 0.0053 | 0.29 | NO |
| 43 | HDGF | HDGF | HDGF | 8031 | 0.0037 | 0.28 | NO |
| 44 | DIS3 | DIS3 | DIS3 | 8082 | 0.0032 | 0.28 | NO |
| 45 | NFYB | NFYB | NFYB | 8326 | -0.000051 | 0.27 | NO |
| 46 | GOSR2 | GOSR2 | GOSR2 | 8362 | -0.00041 | 0.27 | NO |
| 47 | EXOSC9 | EXOSC9 | EXOSC9 | 8486 | -0.0021 | 0.26 | NO |
| 48 | EXOSC1 | EXOSC1 | EXOSC1 | 8721 | -0.0052 | 0.25 | NO |
| 49 | ATP6V0D1 | ATP6V0D1 | ATP6V0D1 | 9210 | -0.011 | 0.22 | NO |
| 50 | DCP2 | DCP2 | DCP2 | 9386 | -0.014 | 0.22 | NO |
| 51 | SYVN1 | SYVN1 | SYVN1 | 9398 | -0.014 | 0.22 | NO |
| 52 | HYOU1 | HYOU1 | HYOU1 | 9520 | -0.015 | 0.21 | NO |
| 53 | EXOSC8 | EXOSC8 | EXOSC8 | 9636 | -0.017 | 0.21 | NO |
| 54 | EXOSC5 | EXOSC5 | EXOSC5 | 9801 | -0.019 | 0.21 | NO |
| 55 | WFS1 | WFS1 | WFS1 | 9907 | -0.021 | 0.2 | NO |
| 56 | MBTPS1 | MBTPS1 | MBTPS1 | 9968 | -0.022 | 0.2 | NO |
| 57 | GSK3A | GSK3A | GSK3A | 9973 | -0.022 | 0.21 | NO |
| 58 | EXOSC7 | EXOSC7 | EXOSC7 | 9975 | -0.022 | 0.21 | NO |
| 59 | EXOSC6 | EXOSC6 | EXOSC6 | 10330 | -0.026 | 0.2 | NO |
| 60 | TATDN2 | TATDN2 | TATDN2 | 11198 | -0.04 | 0.16 | NO |
| 61 | CXXC1 | CXXC1 | CXXC1 | 11351 | -0.043 | 0.16 | NO |
| 62 | ASNS | ASNS | ASNS | 11422 | -0.044 | 0.16 | NO |
| 63 | DDIT3 | DDIT3 | DDIT3 | 11536 | -0.046 | 0.17 | NO |
| 64 | ADD1 | ADD1 | ADD1 | 11652 | -0.048 | 0.17 | NO |
| 65 | KHSRP | KHSRP | KHSRP | 11800 | -0.05 | 0.17 | NO |
| 66 | EXOSC2 | EXOSC2 | EXOSC2 | 12107 | -0.056 | 0.16 | NO |
| 67 | ARFGAP1 | ARFGAP1 | ARFGAP1 | 12391 | -0.061 | 0.16 | NO |
| 68 | DCTN1 | DCTN1 | DCTN1 | 12402 | -0.061 | 0.17 | NO |
| 69 | ZBTB17 | ZBTB17 | ZBTB17 | 12409 | -0.062 | 0.18 | NO |
| 70 | PPP2R5B | PPP2R5B | PPP2R5B | 12580 | -0.065 | 0.19 | NO |
| 71 | KLHDC3 | KLHDC3 | KLHDC3 | 12828 | -0.071 | 0.19 | NO |
| 72 | DDX11 | DDX11 | DDX11 | 13106 | -0.078 | 0.19 | NO |
| 73 | NFYA | NFYA | NFYA | 13542 | -0.09 | 0.18 | NO |
| 74 | TSPYL2 | TSPYL2 | TSPYL2 | 14508 | -0.12 | 0.15 | NO |
| 75 | CTDSP2 | CTDSP2 | CTDSP2 | 14659 | -0.13 | 0.17 | NO |
| 76 | SULT1A3 | SULT1A3 | SULT1A3 | 14744 | -0.13 | 0.19 | NO |
Figure S35. Get High-res Image This plot shows mRNAseq_cNMF expression data heatmap (on the left) a RunningEnrichmentScore(RES) plot (on the top right) and a Signal2Noise(S2N) plot (on the bottom right) of genes in the pathway: REACTOME ANTIGEN PROCESSING CROSS PRESENTATION.
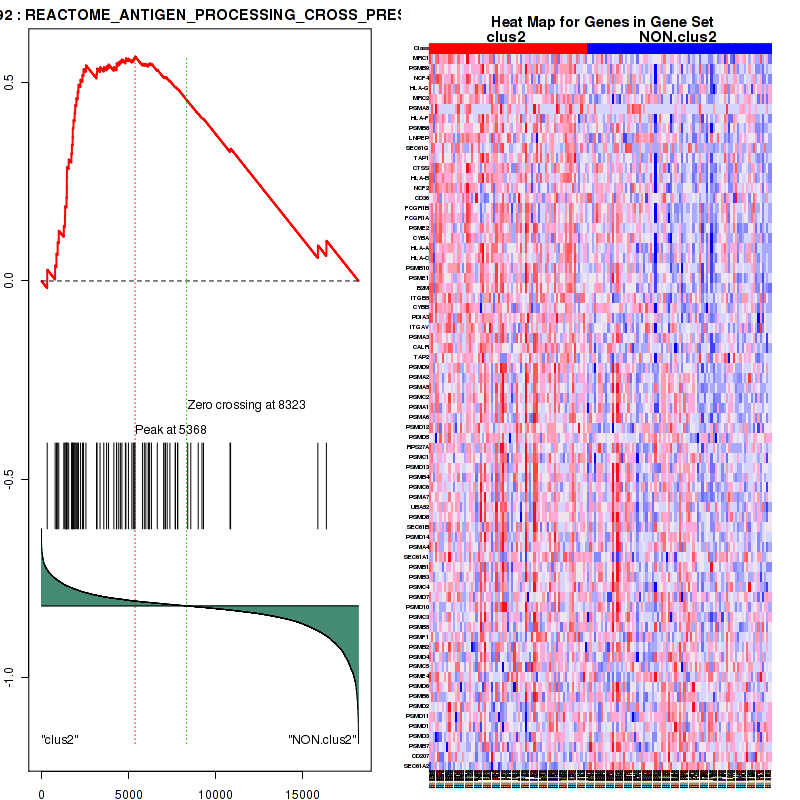
Figure S36. Get High-res Image For the top 5 core enriched genes in the pathway: REACTOME ANTIGEN PROCESSING CROSS PRESENTATION, this volcano plot shows how much they are up/down-regulated and significant. The significance was calculated by empirical bayesian fit
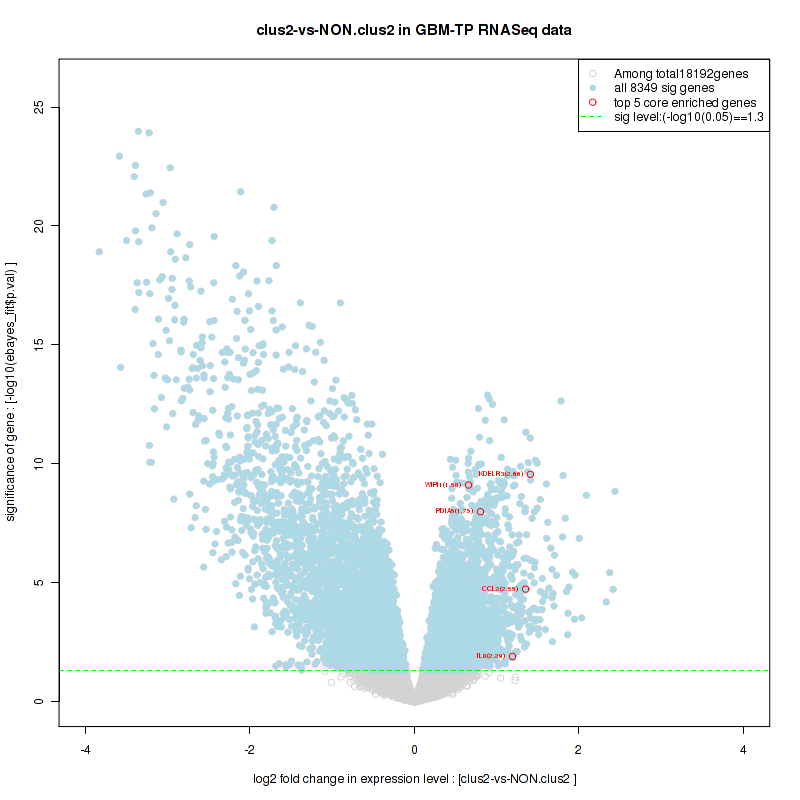
Table S19. Get Full Table This table shows a Running Enrichment Score (RES) of each gene in this pathway, that is, the enrichment score at this point in the ranked list of genes. All genes are ranked by Signal-to-Noise (S2N), a measure of similarity as default and are used to obtain ES matrix of all genes. In this way, GSEA tool uses expression pattern of not only overlapped genes but also not-overlapped genes to produce ES matrix.
| Rank | GENE | SYMBOL | DESC | LIST.LOC | S2N | RES | CORE_ENRICHMENT |
|---|---|---|---|---|---|---|---|
| 1 | MRC1 | MRC1 | MRC1 | 330 | 0.29 | 0.029 | YES |
| 2 | PSMB9 | PSMB9 | PSMB9 | 785 | 0.22 | 0.039 | YES |
| 3 | NCF4 | NCF4 | NCF4 | 859 | 0.21 | 0.069 | YES |
| 4 | HLA-G | HLA-G | HLA-G | 929 | 0.21 | 0.098 | YES |
| 5 | MRC2 | MRC2 | MRC2 | 993 | 0.2 | 0.13 | YES |
| 6 | PSMA8 | PSMA8 | PSMA8 | 1282 | 0.18 | 0.14 | YES |
| 7 | HLA-F | HLA-F | HLA-F | 1346 | 0.17 | 0.16 | YES |
| 8 | PSMB8 | PSMB8 | PSMB8 | 1359 | 0.17 | 0.19 | YES |
| 9 | LNPEP | LNPEP | LNPEP | 1438 | 0.16 | 0.21 | YES |
| 10 | SEC61G | SEC61G | SEC61G | 1453 | 0.16 | 0.24 | YES |
| 11 | TAP1 | TAP1 | TAP1 | 1457 | 0.16 | 0.26 | YES |
| 12 | CTSS | CTSS | CTSS | 1463 | 0.16 | 0.29 | YES |
| 13 | HLA-B | HLA-B | HLA-B | 1562 | 0.16 | 0.31 | YES |
| 14 | NCF2 | NCF2 | NCF2 | 1719 | 0.15 | 0.32 | YES |
| 15 | CD36 | CD36 | CD36 | 1746 | 0.14 | 0.34 | YES |
| 16 | FCGR1B | FCGR1B | FCGR1B | 1788 | 0.14 | 0.36 | YES |
| 17 | FCGR1A | FCGR1A | FCGR1A | 1796 | 0.14 | 0.39 | YES |
| 18 | PSME2 | PSME2 | PSME2 | 1836 | 0.14 | 0.41 | YES |
| 19 | CYBA | CYBA | CYBA | 1905 | 0.14 | 0.42 | YES |
| 20 | HLA-A | HLA-A | HLA-A | 1936 | 0.14 | 0.44 | YES |
| 21 | HLA-C | HLA-C | HLA-C | 2002 | 0.13 | 0.46 | YES |
| 22 | PSMB10 | PSMB10 | PSMB10 | 2076 | 0.13 | 0.48 | YES |
| 23 | PSME1 | PSME1 | PSME1 | 2122 | 0.12 | 0.5 | YES |
| 24 | B2M | B2M | B2M | 2237 | 0.12 | 0.51 | YES |
| 25 | ITGB5 | ITGB5 | ITGB5 | 2352 | 0.12 | 0.52 | YES |
| 26 | CYBB | CYBB | CYBB | 2414 | 0.11 | 0.53 | YES |
| 27 | PDIA3 | PDIA3 | PDIA3 | 2549 | 0.11 | 0.54 | YES |
| 28 | ITGAV | ITGAV | ITGAV | 3162 | 0.086 | 0.52 | YES |
| 29 | PSMA3 | PSMA3 | PSMA3 | 3190 | 0.085 | 0.54 | YES |
| 30 | CALR | CALR | CALR | 3362 | 0.08 | 0.54 | YES |
| 31 | TAP2 | TAP2 | TAP2 | 3577 | 0.074 | 0.54 | YES |
| 32 | PSMD9 | PSMD9 | PSMD9 | 3737 | 0.07 | 0.54 | YES |
| 33 | PSMA2 | PSMA2 | PSMA2 | 3851 | 0.068 | 0.55 | YES |
| 34 | PSMA5 | PSMA5 | PSMA5 | 4155 | 0.062 | 0.54 | YES |
| 35 | PSMC2 | PSMC2 | PSMC2 | 4308 | 0.058 | 0.54 | YES |
| 36 | PSMA1 | PSMA1 | PSMA1 | 4313 | 0.058 | 0.55 | YES |
| 37 | PSMA6 | PSMA6 | PSMA6 | 4433 | 0.056 | 0.55 | YES |
| 38 | PSMD12 | PSMD12 | PSMD12 | 4527 | 0.055 | 0.56 | YES |
| 39 | PSMD5 | PSMD5 | PSMD5 | 4617 | 0.053 | 0.56 | YES |
| 40 | RPS27A | RPS27A | RPS27A | 4814 | 0.049 | 0.56 | YES |
| 41 | PSMC1 | PSMC1 | PSMC1 | 4846 | 0.048 | 0.56 | YES |
| 42 | PSMD13 | PSMD13 | PSMD13 | 4991 | 0.046 | 0.56 | YES |
| 43 | PSMB4 | PSMB4 | PSMB4 | 5187 | 0.042 | 0.56 | YES |
| 44 | PSMC6 | PSMC6 | PSMC6 | 5270 | 0.041 | 0.56 | YES |
| 45 | PSMA7 | PSMA7 | PSMA7 | 5322 | 0.04 | 0.56 | YES |
| 46 | UBA52 | UBA52 | UBA52 | 5368 | 0.039 | 0.57 | YES |
| 47 | PSMD8 | PSMD8 | PSMD8 | 5794 | 0.033 | 0.55 | NO |
| 48 | SEC61B | SEC61B | SEC61B | 5902 | 0.031 | 0.55 | NO |
| 49 | PSMD14 | PSMD14 | PSMD14 | 5988 | 0.03 | 0.55 | NO |
| 50 | PSMA4 | PSMA4 | PSMA4 | 6126 | 0.029 | 0.54 | NO |
| 51 | SEC61A1 | SEC61A1 | SEC61A1 | 6152 | 0.028 | 0.55 | NO |
| 52 | PSMB1 | PSMB1 | PSMB1 | 6205 | 0.028 | 0.55 | NO |
| 53 | PSMB3 | PSMB3 | PSMB3 | 6310 | 0.026 | 0.55 | NO |
| 54 | PSMC4 | PSMC4 | PSMC4 | 6646 | 0.022 | 0.53 | NO |
| 55 | PSMD7 | PSMD7 | PSMD7 | 7009 | 0.017 | 0.52 | NO |
| 56 | PSMD10 | PSMD10 | PSMD10 | 7092 | 0.015 | 0.51 | NO |
| 57 | PSMC3 | PSMC3 | PSMC3 | 7111 | 0.015 | 0.51 | NO |
| 58 | PSMB5 | PSMB5 | PSMB5 | 7215 | 0.014 | 0.51 | NO |
| 59 | PSMF1 | PSMF1 | PSMF1 | 7369 | 0.012 | 0.5 | NO |
| 60 | PSMB2 | PSMB2 | PSMB2 | 7675 | 0.008 | 0.49 | NO |
| 61 | PSMD4 | PSMD4 | PSMD4 | 7689 | 0.0078 | 0.49 | NO |
| 62 | PSMC5 | PSMC5 | PSMC5 | 7811 | 0.0064 | 0.48 | NO |
| 63 | PSME4 | PSME4 | PSME4 | 7818 | 0.0064 | 0.48 | NO |
| 64 | PSMD6 | PSMD6 | PSMD6 | 8392 | -0.00078 | 0.45 | NO |
| 65 | PSMB6 | PSMB6 | PSMB6 | 8569 | -0.0032 | 0.44 | NO |
| 66 | PSMD2 | PSMD2 | PSMD2 | 8995 | -0.0084 | 0.42 | NO |
| 67 | PSMD11 | PSMD11 | PSMD11 | 9211 | -0.011 | 0.41 | NO |
| 68 | PSMD1 | PSMD1 | PSMD1 | 9297 | -0.012 | 0.41 | NO |
| 69 | PSMD3 | PSMD3 | PSMD3 | 10820 | -0.034 | 0.33 | NO |
| 70 | PSMB7 | PSMB7 | PSMB7 | 10852 | -0.034 | 0.33 | NO |
| 71 | CD207 | CD207 | CD207 | 15860 | -0.2 | 0.09 | NO |
| 72 | SEC61A2 | SEC61A2 | SEC61A2 | 16349 | -0.24 | 0.1 | NO |
Figure S37. Get High-res Image This plot shows mRNAseq_cNMF expression data heatmap (on the left) a RunningEnrichmentScore(RES) plot (on the top right) and a Signal2Noise(S2N) plot (on the bottom right) of genes in the pathway: REACTOME TRIF MEDIATED TLR3 SIGNALING.
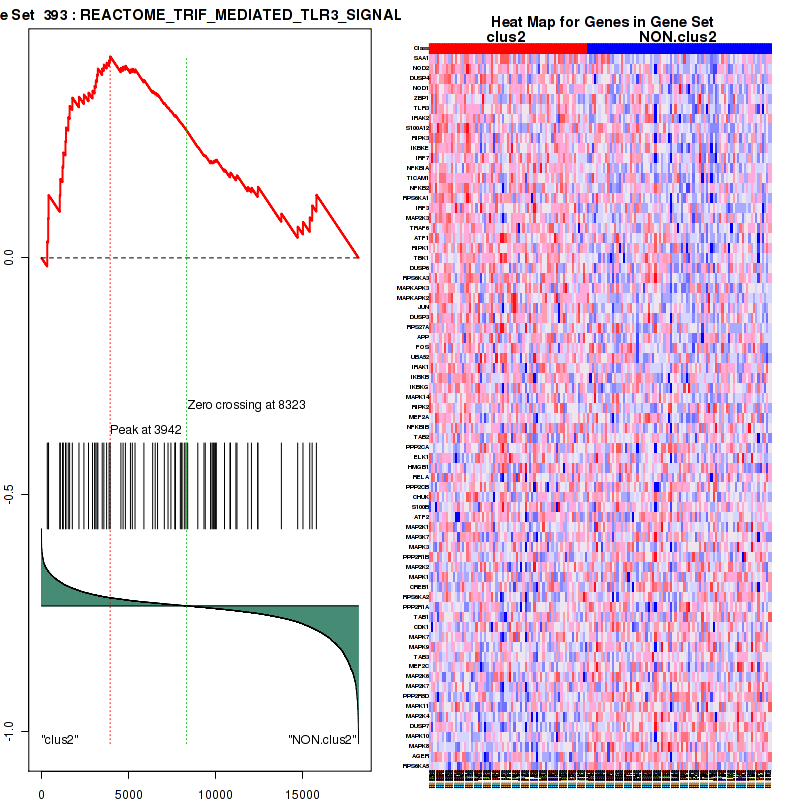
Figure S38. Get High-res Image For the top 5 core enriched genes in the pathway: REACTOME TRIF MEDIATED TLR3 SIGNALING, this volcano plot shows how much they are up/down-regulated and significant. The significance was calculated by empirical bayesian fit
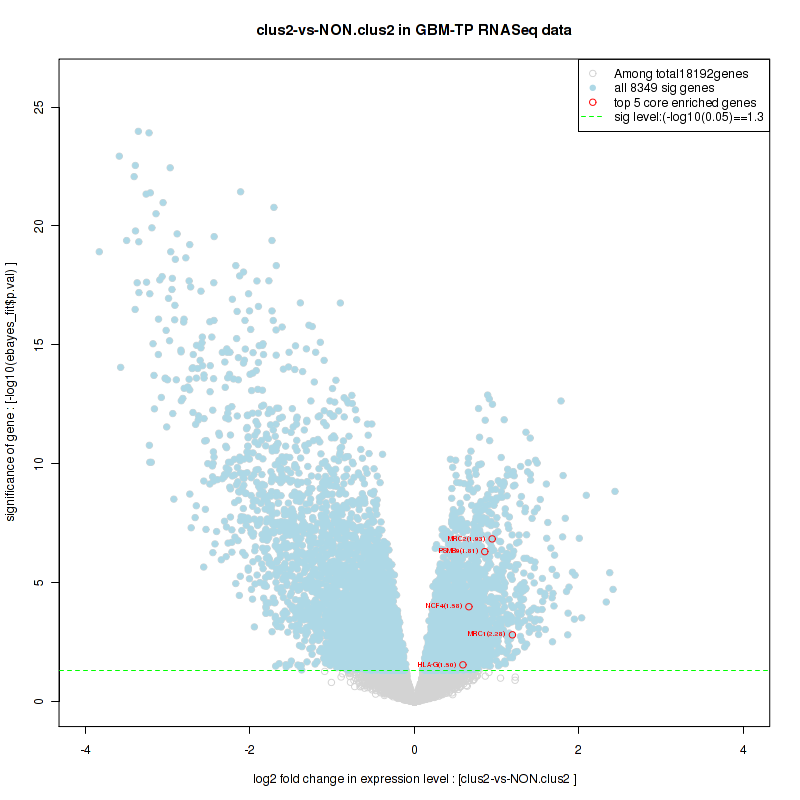
Table S20. Get Full Table This table shows a Running Enrichment Score (RES) of each gene in this pathway, that is, the enrichment score at this point in the ranked list of genes. All genes are ranked by Signal-to-Noise (S2N), a measure of similarity as default and are used to obtain ES matrix of all genes. In this way, GSEA tool uses expression pattern of not only overlapped genes but also not-overlapped genes to produce ES matrix.
| Rank | GENE | SYMBOL | DESC | LIST.LOC | S2N | RES | CORE_ENRICHMENT |
|---|---|---|---|---|---|---|---|
| 1 | SAA1 | SAA1 | SAA1 | 332 | 0.29 | 0.035 | YES |
| 2 | NOD2 | NOD2 | NOD2 | 386 | 0.28 | 0.084 | YES |
| 3 | DUSP4 | DUSP4 | DUSP4 | 407 | 0.28 | 0.13 | YES |
| 4 | NOD1 | NOD1 | NOD1 | 1052 | 0.2 | 0.13 | YES |
| 5 | ZBP1 | ZBP1 | ZBP1 | 1082 | 0.19 | 0.17 | YES |
| 6 | TLR3 | TLR3 | TLR3 | 1208 | 0.18 | 0.19 | YES |
| 7 | IRAK2 | IRAK2 | IRAK2 | 1255 | 0.18 | 0.22 | YES |
| 8 | S100A12 | S100A12 | S100A12 | 1378 | 0.17 | 0.25 | YES |
| 9 | RIPK3 | RIPK3 | RIPK3 | 1409 | 0.17 | 0.28 | YES |
| 10 | IKBKE | IKBKE | IKBKE | 1539 | 0.16 | 0.3 | YES |
| 11 | IRF7 | IRF7 | IRF7 | 1616 | 0.15 | 0.32 | YES |
| 12 | NFKBIA | NFKBIA | NFKBIA | 1772 | 0.14 | 0.34 | YES |
| 13 | TICAM1 | TICAM1 | TICAM1 | 2151 | 0.12 | 0.34 | YES |
| 14 | NFKB2 | NFKB2 | NFKB2 | 2434 | 0.11 | 0.34 | YES |
| 15 | RPS6KA1 | RPS6KA1 | RPS6KA1 | 2700 | 0.1 | 0.35 | YES |
| 16 | IRF3 | IRF3 | IRF3 | 2930 | 0.093 | 0.35 | YES |
| 17 | MAP2K3 | MAP2K3 | MAP2K3 | 3048 | 0.09 | 0.36 | YES |
| 18 | TRAF6 | TRAF6 | TRAF6 | 3120 | 0.087 | 0.38 | YES |
| 19 | ATF1 | ATF1 | ATF1 | 3192 | 0.085 | 0.39 | YES |
| 20 | RIPK1 | RIPK1 | RIPK1 | 3235 | 0.084 | 0.4 | YES |
| 21 | TBK1 | TBK1 | TBK1 | 3485 | 0.076 | 0.4 | YES |
| 22 | DUSP6 | DUSP6 | DUSP6 | 3580 | 0.074 | 0.41 | YES |
| 23 | RPS6KA3 | RPS6KA3 | RPS6KA3 | 3739 | 0.07 | 0.41 | YES |
| 24 | MAPKAPK3 | MAPKAPK3 | MAPKAPK3 | 3879 | 0.067 | 0.42 | YES |
| 25 | MAPKAPK2 | MAPKAPK2 | MAPKAPK2 | 3942 | 0.066 | 0.43 | YES |
| 26 | JUN | JUN | JUN | 4557 | 0.054 | 0.4 | NO |
| 27 | DUSP3 | DUSP3 | DUSP3 | 4683 | 0.052 | 0.4 | NO |
| 28 | RPS27A | RPS27A | RPS27A | 4814 | 0.049 | 0.41 | NO |
| 29 | APP | APP | APP | 5104 | 0.044 | 0.4 | NO |
| 30 | FOS | FOS | FOS | 5212 | 0.042 | 0.4 | NO |
| 31 | UBA52 | UBA52 | UBA52 | 5368 | 0.039 | 0.4 | NO |
| 32 | IRAK1 | IRAK1 | IRAK1 | 5877 | 0.032 | 0.38 | NO |
| 33 | IKBKB | IKBKB | IKBKB | 6382 | 0.025 | 0.35 | NO |
| 34 | IKBKG | IKBKG | IKBKG | 6526 | 0.023 | 0.35 | NO |
| 35 | MAPK14 | MAPK14 | MAPK14 | 6661 | 0.021 | 0.35 | NO |
| 36 | RIPK2 | RIPK2 | RIPK2 | 7049 | 0.016 | 0.33 | NO |
| 37 | MEF2A | MEF2A | MEF2A | 7263 | 0.013 | 0.32 | NO |
| 38 | NFKBIB | NFKBIB | NFKBIB | 7427 | 0.012 | 0.31 | NO |
| 39 | TAB2 | TAB2 | TAB2 | 7665 | 0.0083 | 0.3 | NO |
| 40 | PPP2CA | PPP2CA | PPP2CA | 7667 | 0.0082 | 0.3 | NO |
| 41 | ELK1 | ELK1 | ELK1 | 7683 | 0.0079 | 0.3 | NO |
| 42 | HMGB1 | HMGB1 | HMGB1 | 7967 | 0.0046 | 0.29 | NO |
| 43 | RELA | RELA | RELA | 8026 | 0.0039 | 0.28 | NO |
| 44 | PPP2CB | PPP2CB | PPP2CB | 8069 | 0.0033 | 0.28 | NO |
| 45 | CHUK | CHUK | CHUK | 8196 | 0.0016 | 0.28 | NO |
| 46 | S100B | S100B | S100B | 8291 | 0.00031 | 0.27 | NO |
| 47 | ATF2 | ATF2 | ATF2 | 8388 | -0.00072 | 0.27 | NO |
| 48 | MAP2K1 | MAP2K1 | MAP2K1 | 8969 | -0.0081 | 0.24 | NO |
| 49 | MAP3K7 | MAP3K7 | MAP3K7 | 9323 | -0.013 | 0.22 | NO |
| 50 | MAPK3 | MAPK3 | MAPK3 | 9399 | -0.014 | 0.22 | NO |
| 51 | PPP2R1B | PPP2R1B | PPP2R1B | 9706 | -0.018 | 0.2 | NO |
| 52 | MAP2K2 | MAP2K2 | MAP2K2 | 9725 | -0.018 | 0.2 | NO |
| 53 | MAPK1 | MAPK1 | MAPK1 | 9826 | -0.02 | 0.2 | NO |
| 54 | CREB1 | CREB1 | CREB1 | 9879 | -0.02 | 0.2 | NO |
| 55 | RPS6KA2 | RPS6KA2 | RPS6KA2 | 9920 | -0.021 | 0.21 | NO |
| 56 | PPP2R1A | PPP2R1A | PPP2R1A | 9983 | -0.022 | 0.21 | NO |
| 57 | TAB1 | TAB1 | TAB1 | 10033 | -0.023 | 0.21 | NO |
| 58 | CDK1 | CDK1 | CDK1 | 10503 | -0.029 | 0.19 | NO |
| 59 | MAPK7 | MAPK7 | MAPK7 | 10816 | -0.034 | 0.18 | NO |
| 60 | MAPK9 | MAPK9 | MAPK9 | 10848 | -0.034 | 0.18 | NO |
| 61 | TAB3 | TAB3 | TAB3 | 11157 | -0.039 | 0.17 | NO |
| 62 | MEF2C | MEF2C | MEF2C | 11217 | -0.04 | 0.18 | NO |
| 63 | MAP2K6 | MAP2K6 | MAP2K6 | 11839 | -0.051 | 0.15 | NO |
| 64 | MAP2K7 | MAP2K7 | MAP2K7 | 12049 | -0.055 | 0.15 | NO |
| 65 | PPP2R5D | PPP2R5D | PPP2R5D | 12406 | -0.061 | 0.14 | NO |
| 66 | MAPK11 | MAPK11 | MAPK11 | 12420 | -0.062 | 0.15 | NO |
| 67 | MAP2K4 | MAP2K4 | MAP2K4 | 13766 | -0.097 | 0.094 | NO |
| 68 | DUSP7 | DUSP7 | DUSP7 | 14700 | -0.13 | 0.066 | NO |
| 69 | MAPK10 | MAPK10 | MAPK10 | 15005 | -0.15 | 0.076 | NO |
| 70 | MAPK8 | MAPK8 | MAPK8 | 15394 | -0.17 | 0.086 | NO |
| 71 | AGER | AGER | AGER | 15533 | -0.18 | 0.11 | NO |
| 72 | RPS6KA5 | RPS6KA5 | RPS6KA5 | 15776 | -0.2 | 0.13 | NO |
Figure S39. Get High-res Image This plot shows mRNAseq_cNMF expression data heatmap (on the left) a RunningEnrichmentScore(RES) plot (on the top right) and a Signal2Noise(S2N) plot (on the bottom right) of genes in the pathway: REACTOME ACTIVATION OF CHAPERONE GENES BY XBP1S.
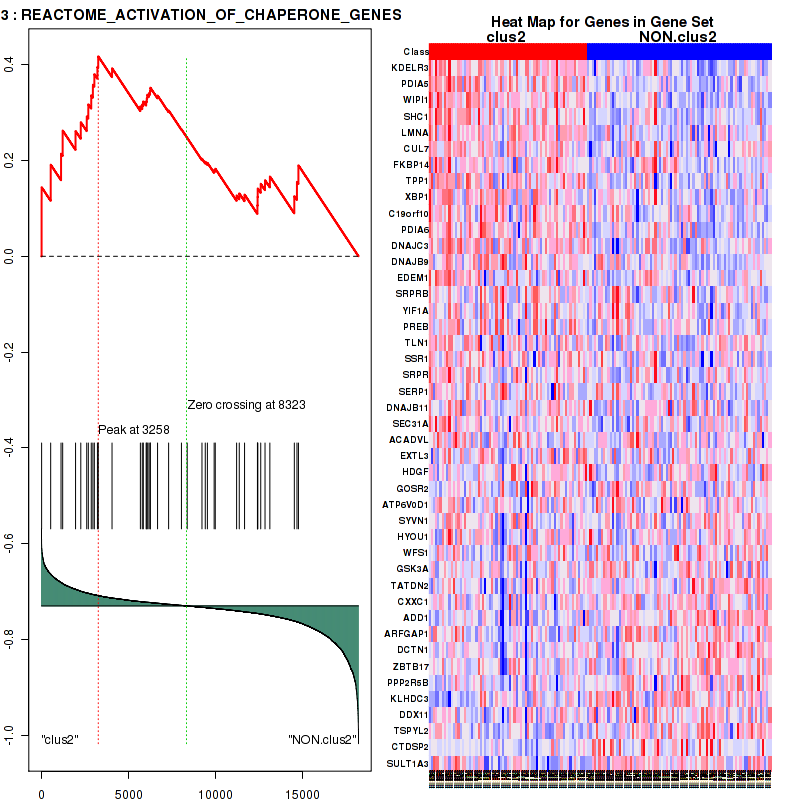
Figure S40. Get High-res Image For the top 5 core enriched genes in the pathway: REACTOME ACTIVATION OF CHAPERONE GENES BY XBP1S, this volcano plot shows how much they are up/down-regulated and significant. The significance was calculated by empirical bayesian fit
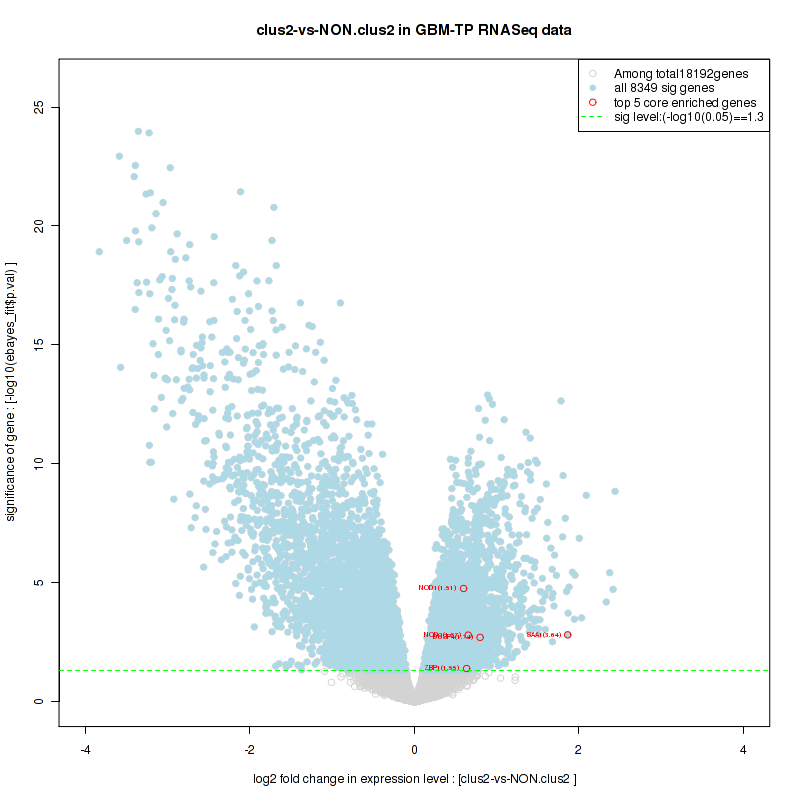
For the top enriched genes, if you want to check whether they are
-
up-regulated, please check the list of up-regulated genes
-
down-regulated, please check the list of down-regulated genes
For the top enriched genes, if you want to check whether they are
-
highly expressed genes, please check the list of high (top 30%) expressed genes
-
low expressed genes, please check the list of low (bottom 30%) expressed genes
An expression pattern of top(30%)/middle(30%)/low(30%) in this subtype against other subtypes is available in a heatmap
For the top enriched genes, if you want to check whether they are
-
significantly differently expressed genes by eBayes lm fit, please check the list of significant genes
Table 5. Get Full Table This table shows top 10 pathways which are significantly enriched in cluster clus3. It displays only significant gene sets satisfying nom.p.val.threshold (-1), fwer.p.val.threshold (-1) , fdr.q.val.threshold (0.25) and the default table is sorted by Normalized Enrichment Score (NES). Further details on NES statistics, please visit The Broad GSEA website.
| GeneSet(GS) | Size(#genes) | genes.ES.table | ES | NES | NOM.p.val | FDR.q.val | FWER.p.val | Tag.. | Gene.. | Signal | FDR..median. | glob.p.val |
|---|---|---|---|---|---|---|---|---|---|---|---|---|
| KEGG ALANINE ASPARTATE AND GLUTAMATE METABOLISM | 31 | genes.ES.table | 0.54 | 1.5 | 0.031 | 0.2 | 0.96 | 0.26 | 0.15 | 0.22 | 0.13 | 0.012 |
| KEGG O GLYCAN BIOSYNTHESIS | 30 | genes.ES.table | 0.66 | 1.7 | 0 | 0.15 | 0.84 | 0.17 | 0.022 | 0.16 | 0.078 | 0.017 |
| KEGG INOSITOL PHOSPHATE METABOLISM | 53 | genes.ES.table | 0.47 | 1.6 | 0.026 | 0.16 | 0.92 | 0.51 | 0.31 | 0.35 | 0.092 | 0.013 |
| KEGG GLYCOSPHINGOLIPID BIOSYNTHESIS LACTO AND NEOLACTO SERIES | 25 | genes.ES.table | 0.62 | 1.6 | 0.016 | 0.17 | 0.94 | 0.28 | 0.078 | 0.26 | 0.1 | 0.013 |
| KEGG BUTANOATE METABOLISM | 30 | genes.ES.table | 0.53 | 1.6 | 0.034 | 0.19 | 0.95 | 0.47 | 0.28 | 0.33 | 0.11 | 0.013 |
| KEGG MAPK SIGNALING PATHWAY | 252 | genes.ES.table | 0.48 | 1.7 | 0.0021 | 0.15 | 0.78 | 0.3 | 0.23 | 0.23 | 0.069 | 0.021 |
| KEGG ERBB SIGNALING PATHWAY | 86 | genes.ES.table | 0.48 | 1.7 | 0.0019 | 0.16 | 0.73 | 0.15 | 0.11 | 0.14 | 0.066 | 0.025 |
| KEGG CALCIUM SIGNALING PATHWAY | 172 | genes.ES.table | 0.66 | 1.7 | 0 | 0.16 | 0.72 | 0.38 | 0.14 | 0.33 | 0.065 | 0.028 |
| KEGG PHOSPHATIDYLINOSITOL SIGNALING SYSTEM | 73 | genes.ES.table | 0.57 | 1.8 | 0.0042 | 0.28 | 0.52 | 0.55 | 0.3 | 0.38 | 0.092 | 0.066 |
| KEGG NEUROACTIVE LIGAND RECEPTOR INTERACTION | 241 | genes.ES.table | 0.66 | 1.6 | 0 | 0.16 | 0.9 | 0.46 | 0.16 | 0.39 | 0.092 | 0.016 |
Table S21. Get Full Table This table shows a Running Enrichment Score (RES) of each gene in this pathway, that is, the enrichment score at this point in the ranked list of genes. All genes are ranked by Signal-to-Noise (S2N), a measure of similarity as default and are used to obtain ES matrix of all genes. In this way, GSEA tool uses expression pattern of not only overlapped genes but also not-overlapped genes to produce ES matrix.
| Rank | GENE | SYMBOL | DESC | LIST.LOC | S2N | RES | CORE_ENRICHMENT |
|---|---|---|---|---|---|---|---|
| 1 | CAMK2A | CAMK2A | CAMK2A | 102 | 0.79 | 0.24 | YES |
| 2 | CAMK2B | CAMK2B | CAMK2B | 546 | 0.41 | 0.34 | YES |
| 3 | PRKCB | PRKCB | PRKCB | 576 | 0.4 | 0.46 | YES |
| 4 | STAT4 | STAT4 | STAT4 | 842 | 0.32 | 0.54 | YES |
| 5 | CAMK2G | CAMK2G | CAMK2G | 2070 | 0.18 | 0.53 | YES |
| 6 | PTK2B | PTK2B | PTK2B | 2348 | 0.16 | 0.56 | YES |
| 7 | CALM1 | CALM1 | CALM1 | 3455 | 0.1 | 0.53 | NO |
| 8 | MAPT | MAPT | MAPT | 3761 | 0.094 | 0.54 | NO |
| 9 | PRKCA | PRKCA | PRKCA | 3986 | 0.087 | 0.56 | NO |
| 10 | CALM3 | CALM3 | CALM3 | 5028 | 0.062 | 0.52 | NO |
| 11 | AGT | AGT | AGT | 5168 | 0.059 | 0.53 | NO |
| 12 | MAPK3 | MAPK3 | MAPK3 | 5591 | 0.051 | 0.52 | NO |
| 13 | PLCG1 | PLCG1 | PLCG1 | 5688 | 0.049 | 0.53 | NO |
| 14 | MAP2K1 | MAP2K1 | MAP2K1 | 5877 | 0.046 | 0.53 | NO |
| 15 | STAT2 | STAT2 | STAT2 | 5990 | 0.044 | 0.54 | NO |
| 16 | MAPK1 | MAPK1 | MAPK1 | 6398 | 0.038 | 0.53 | NO |
| 17 | CAMK2D | CAMK2D | CAMK2D | 6931 | 0.031 | 0.51 | NO |
| 18 | HRAS | HRAS | HRAS | 7361 | 0.025 | 0.49 | NO |
| 19 | GNA11 | GNA11 | GNA11 | 7699 | 0.021 | 0.48 | NO |
| 20 | SOS1 | SOS1 | SOS1 | 7754 | 0.021 | 0.48 | NO |
| 21 | FYN | FYN | FYN | 8397 | 0.014 | 0.45 | NO |
| 22 | STAT5B | STAT5B | STAT5B | 8438 | 0.013 | 0.46 | NO |
| 23 | JAK2 | JAK2 | JAK2 | 9264 | 0.0044 | 0.41 | NO |
| 24 | STAT5A | STAT5A | STAT5A | 9391 | 0.0032 | 0.4 | NO |
| 25 | MAP2K2 | MAP2K2 | MAP2K2 | 9418 | 0.003 | 0.4 | NO |
| 26 | STAT1 | STAT1 | STAT1 | 9429 | 0.0028 | 0.4 | NO |
| 27 | STAT6 | STAT6 | STAT6 | 9713 | 0.00028 | 0.39 | NO |
| 28 | GRB2 | GRB2 | GRB2 | 9969 | -0.002 | 0.38 | NO |
| 29 | CALM2 | CALM2 | CALM2 | 10046 | -0.0028 | 0.37 | NO |
| 30 | MYLK | MYLK | MYLK | 10486 | -0.0072 | 0.35 | NO |
| 31 | GNB1 | GNB1 | GNB1 | 10611 | -0.0083 | 0.35 | NO |
| 32 | STAT3 | STAT3 | STAT3 | 10983 | -0.012 | 0.33 | NO |
| 33 | MAPK8 | MAPK8 | MAPK8 | 11395 | -0.016 | 0.31 | NO |
| 34 | RAF1 | RAF1 | RAF1 | 11525 | -0.017 | 0.31 | NO |
| 35 | MAPK14 | MAPK14 | MAPK14 | 12406 | -0.026 | 0.27 | NO |
| 36 | CDK5 | CDK5 | CDK5 | 12648 | -0.028 | 0.26 | NO |
| 37 | GNAI1 | GNAI1 | GNAI1 | 15188 | -0.062 | 0.14 | NO |
| 38 | SHC1 | SHC1 | SHC1 | 15576 | -0.07 | 0.14 | NO |
Figure S41. Get High-res Image This plot shows mRNAseq_cNMF expression data heatmap (on the left) a RunningEnrichmentScore(RES) plot (on the top right) and a Signal2Noise(S2N) plot (on the bottom right) of genes in the pathway: KEGG ALANINE ASPARTATE AND GLUTAMATE METABOLISM.
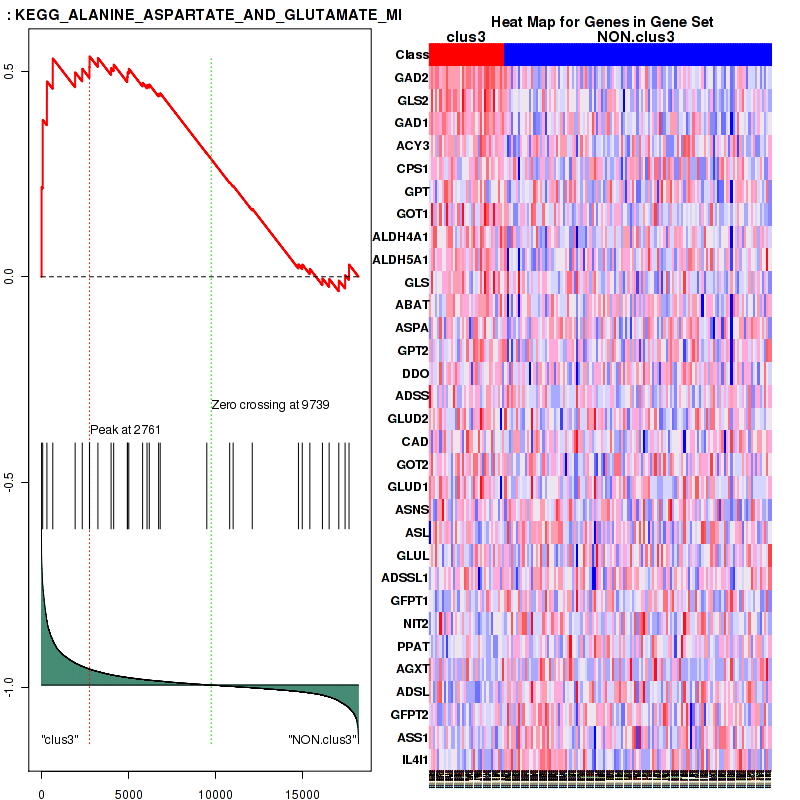
Figure S42. Get High-res Image For the top 5 core enriched genes in the pathway: KEGG ALANINE ASPARTATE AND GLUTAMATE METABOLISM, this volcano plot shows how much they are up/down-regulated and significant. The significance was calculated by empirical bayesian fit
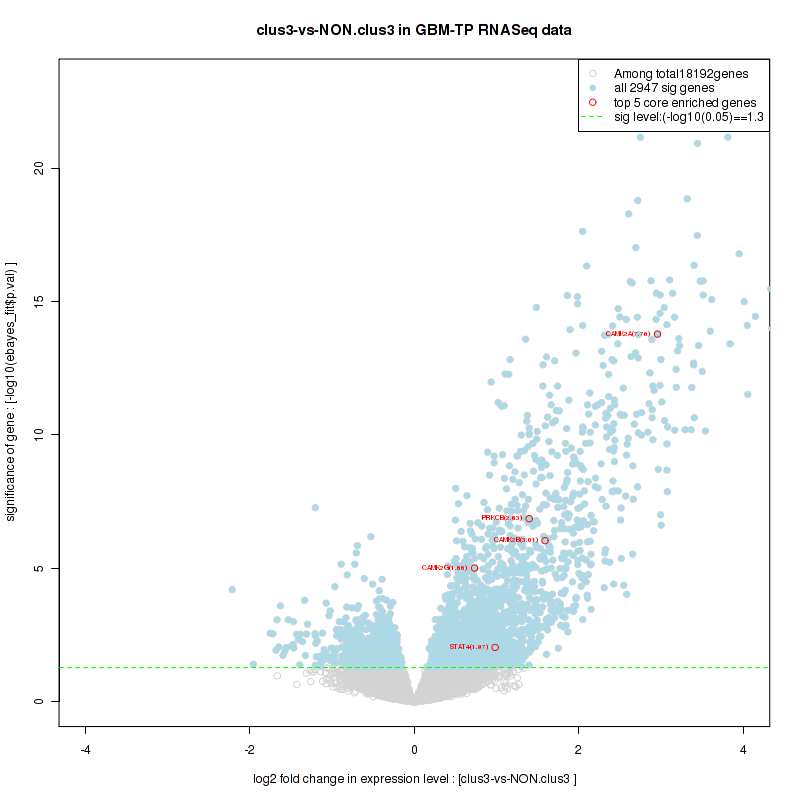
Table S22. Get Full Table This table shows a Running Enrichment Score (RES) of each gene in this pathway, that is, the enrichment score at this point in the ranked list of genes. All genes are ranked by Signal-to-Noise (S2N), a measure of similarity as default and are used to obtain ES matrix of all genes. In this way, GSEA tool uses expression pattern of not only overlapped genes but also not-overlapped genes to produce ES matrix.
| Rank | GENE | SYMBOL | DESC | LIST.LOC | S2N | RES | CORE_ENRICHMENT |
|---|---|---|---|---|---|---|---|
| 1 | GRIN1 | GRIN1 | GRIN1 | 25 | 0.99 | 0.13 | YES |
| 2 | CAMK2A | CAMK2A | CAMK2A | 102 | 0.79 | 0.24 | YES |
| 3 | RASGRF1 | RASGRF1 | RASGRF1 | 167 | 0.7 | 0.33 | YES |
| 4 | NEFL | NEFL | NEFL | 203 | 0.65 | 0.41 | YES |
| 5 | GRIN2A | GRIN2A | GRIN2A | 284 | 0.56 | 0.48 | YES |
| 6 | CAMK4 | CAMK4 | CAMK4 | 379 | 0.49 | 0.55 | YES |
| 7 | RASGRF2 | RASGRF2 | RASGRF2 | 452 | 0.46 | 0.6 | YES |
| 8 | CAMK2B | CAMK2B | CAMK2B | 546 | 0.41 | 0.65 | YES |
| 9 | CAMKK1 | CAMKK1 | CAMKK1 | 560 | 0.4 | 0.71 | YES |
| 10 | GRIN2C | GRIN2C | GRIN2C | 740 | 0.35 | 0.74 | YES |
| 11 | ACTN2 | ACTN2 | ACTN2 | 1167 | 0.26 | 0.76 | YES |
| 12 | ADCY1 | ADCY1 | ADCY1 | 1227 | 0.26 | 0.79 | YES |
| 13 | GRIN2B | GRIN2B | GRIN2B | 3305 | 0.11 | 0.69 | NO |
| 14 | CALM1 | CALM1 | CALM1 | 3455 | 0.1 | 0.7 | NO |
| 15 | RPS6KA6 | RPS6KA6 | RPS6KA6 | 3612 | 0.099 | 0.7 | NO |
| 16 | GRIN2D | GRIN2D | GRIN2D | 3874 | 0.09 | 0.7 | NO |
| 17 | RPS6KA2 | RPS6KA2 | RPS6KA2 | 4404 | 0.076 | 0.68 | NO |
| 18 | PDPK1 | PDPK1 | PDPK1 | 4524 | 0.073 | 0.68 | NO |
| 19 | PRKACB | PRKACB | PRKACB | 4583 | 0.071 | 0.69 | NO |
| 20 | CALM3 | CALM3 | CALM3 | 5028 | 0.062 | 0.67 | NO |
| 21 | MAPK1 | MAPK1 | MAPK1 | 6398 | 0.038 | 0.6 | NO |
| 22 | ADCY3 | ADCY3 | ADCY3 | 6537 | 0.036 | 0.6 | NO |
| 23 | CAMK2D | CAMK2D | CAMK2D | 6931 | 0.031 | 0.58 | NO |
| 24 | HRAS | HRAS | HRAS | 7361 | 0.025 | 0.56 | NO |
| 25 | ADCY8 | ADCY8 | ADCY8 | 7557 | 0.023 | 0.55 | NO |
| 26 | AKAP9 | AKAP9 | AKAP9 | 8653 | 0.011 | 0.5 | NO |
| 27 | RPS6KA3 | RPS6KA3 | RPS6KA3 | 9176 | 0.0052 | 0.47 | NO |
| 28 | CALM2 | CALM2 | CALM2 | 10046 | -0.0028 | 0.42 | NO |
| 29 | CREB1 | CREB1 | CREB1 | 10811 | -0.01 | 0.38 | NO |
| 30 | RAF1 | RAF1 | RAF1 | 11525 | -0.017 | 0.34 | NO |
| 31 | BRAF | BRAF | BRAF | 14260 | -0.048 | 0.2 | NO |
| 32 | RPS6KA1 | RPS6KA1 | RPS6KA1 | 15195 | -0.062 | 0.16 | NO |
| 33 | RRAS | RRAS | RRAS | 15850 | -0.076 | 0.13 | NO |
Figure S43. Get High-res Image This plot shows mRNAseq_cNMF expression data heatmap (on the left) a RunningEnrichmentScore(RES) plot (on the top right) and a Signal2Noise(S2N) plot (on the bottom right) of genes in the pathway: KEGG O GLYCAN BIOSYNTHESIS.
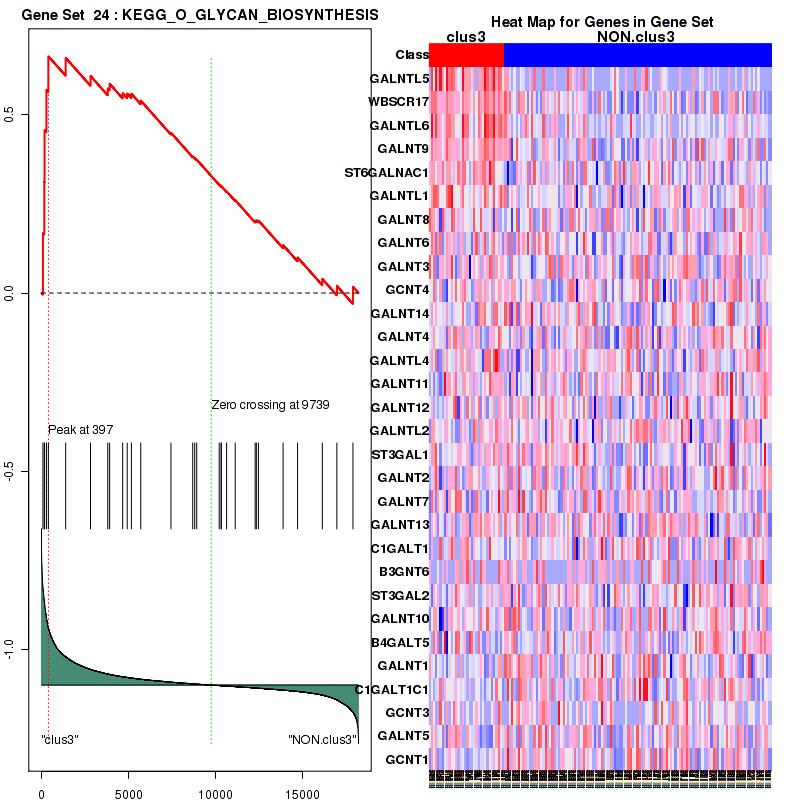
Figure S44. Get High-res Image For the top 5 core enriched genes in the pathway: KEGG O GLYCAN BIOSYNTHESIS, this volcano plot shows how much they are up/down-regulated and significant. The significance was calculated by empirical bayesian fit
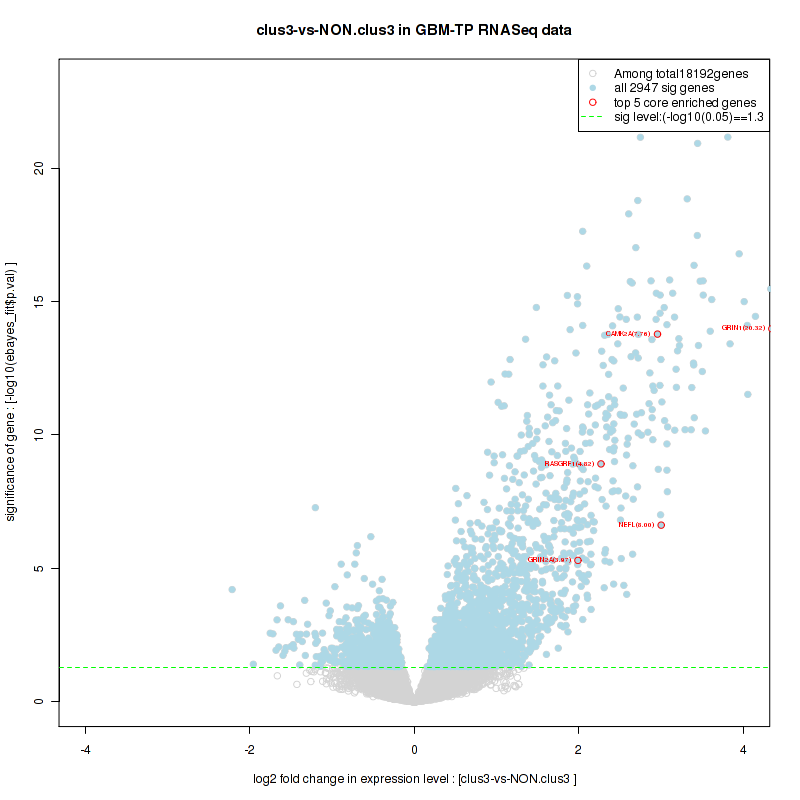
Table S23. Get Full Table This table shows a Running Enrichment Score (RES) of each gene in this pathway, that is, the enrichment score at this point in the ranked list of genes. All genes are ranked by Signal-to-Noise (S2N), a measure of similarity as default and are used to obtain ES matrix of all genes. In this way, GSEA tool uses expression pattern of not only overlapped genes but also not-overlapped genes to produce ES matrix.
| Rank | GENE | SYMBOL | DESC | LIST.LOC | S2N | RES | CORE_ENRICHMENT |
|---|---|---|---|---|---|---|---|
| 1 | GRIN1 | GRIN1 | GRIN1 | 25 | 0.99 | 0.16 | YES |
| 2 | CAMK2A | CAMK2A | CAMK2A | 102 | 0.79 | 0.29 | YES |
| 3 | RASGRF1 | RASGRF1 | RASGRF1 | 167 | 0.7 | 0.4 | YES |
| 4 | NEFL | NEFL | NEFL | 203 | 0.65 | 0.5 | YES |
| 5 | GRIN2A | GRIN2A | GRIN2A | 284 | 0.56 | 0.59 | YES |
| 6 | RASGRF2 | RASGRF2 | RASGRF2 | 452 | 0.46 | 0.65 | YES |
| 7 | CAMK2B | CAMK2B | CAMK2B | 546 | 0.41 | 0.72 | YES |
| 8 | GRIN2C | GRIN2C | GRIN2C | 740 | 0.35 | 0.76 | YES |
| 9 | ACTN2 | ACTN2 | ACTN2 | 1167 | 0.26 | 0.78 | YES |
| 10 | GRIN2B | GRIN2B | GRIN2B | 3305 | 0.11 | 0.68 | NO |
| 11 | CALM1 | CALM1 | CALM1 | 3455 | 0.1 | 0.69 | NO |
| 12 | RPS6KA6 | RPS6KA6 | RPS6KA6 | 3612 | 0.099 | 0.7 | NO |
| 13 | GRIN2D | GRIN2D | GRIN2D | 3874 | 0.09 | 0.7 | NO |
| 14 | RPS6KA2 | RPS6KA2 | RPS6KA2 | 4404 | 0.076 | 0.68 | NO |
| 15 | PDPK1 | PDPK1 | PDPK1 | 4524 | 0.073 | 0.69 | NO |
| 16 | CALM3 | CALM3 | CALM3 | 5028 | 0.062 | 0.67 | NO |
| 17 | MAPK1 | MAPK1 | MAPK1 | 6398 | 0.038 | 0.6 | NO |
| 18 | CAMK2D | CAMK2D | CAMK2D | 6931 | 0.031 | 0.58 | NO |
| 19 | HRAS | HRAS | HRAS | 7361 | 0.025 | 0.56 | NO |
| 20 | AKAP9 | AKAP9 | AKAP9 | 8653 | 0.011 | 0.49 | NO |
| 21 | RPS6KA3 | RPS6KA3 | RPS6KA3 | 9176 | 0.0052 | 0.46 | NO |
| 22 | CALM2 | CALM2 | CALM2 | 10046 | -0.0028 | 0.41 | NO |
| 23 | CREB1 | CREB1 | CREB1 | 10811 | -0.01 | 0.37 | NO |
| 24 | RAF1 | RAF1 | RAF1 | 11525 | -0.017 | 0.34 | NO |
| 25 | BRAF | BRAF | BRAF | 14260 | -0.048 | 0.19 | NO |
| 26 | RPS6KA1 | RPS6KA1 | RPS6KA1 | 15195 | -0.062 | 0.15 | NO |
| 27 | RRAS | RRAS | RRAS | 15850 | -0.076 | 0.13 | NO |
Figure S45. Get High-res Image This plot shows mRNAseq_cNMF expression data heatmap (on the left) a RunningEnrichmentScore(RES) plot (on the top right) and a Signal2Noise(S2N) plot (on the bottom right) of genes in the pathway: KEGG INOSITOL PHOSPHATE METABOLISM.
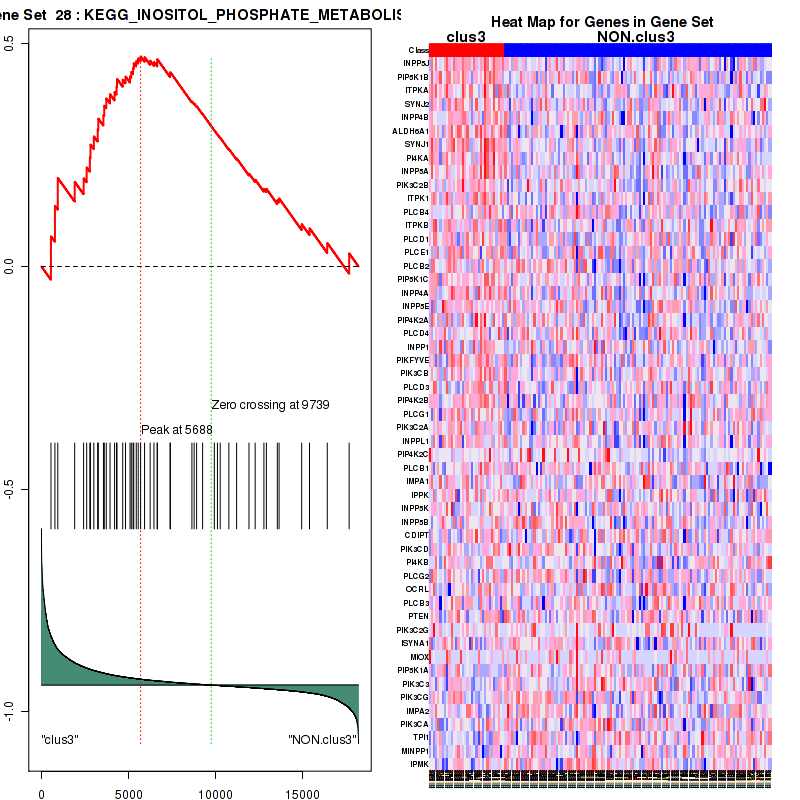
Figure S46. Get High-res Image For the top 5 core enriched genes in the pathway: KEGG INOSITOL PHOSPHATE METABOLISM, this volcano plot shows how much they are up/down-regulated and significant. The significance was calculated by empirical bayesian fit
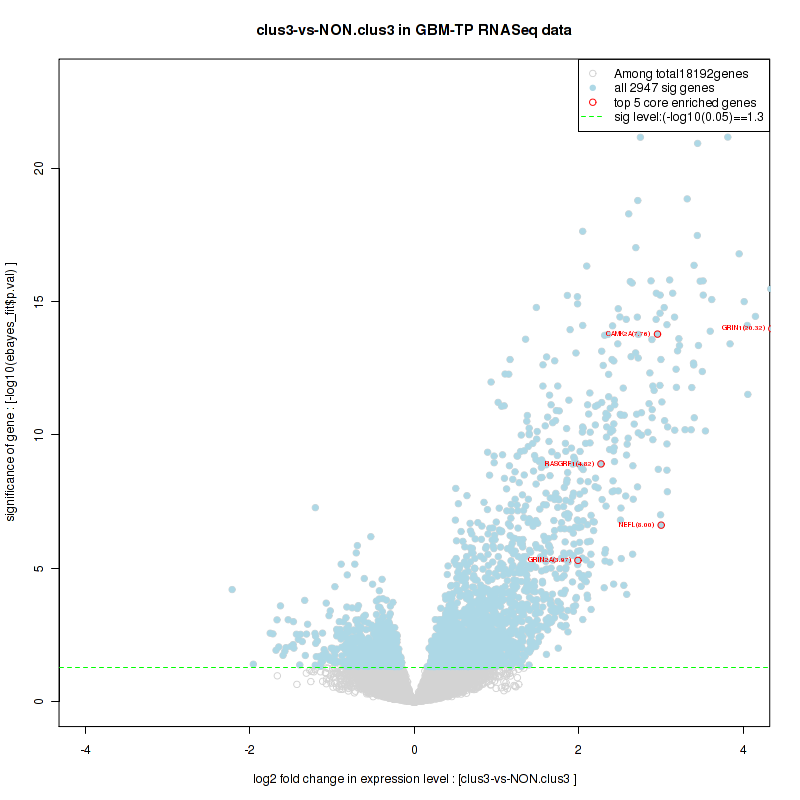
Table S24. Get Full Table This table shows a Running Enrichment Score (RES) of each gene in this pathway, that is, the enrichment score at this point in the ranked list of genes. All genes are ranked by Signal-to-Noise (S2N), a measure of similarity as default and are used to obtain ES matrix of all genes. In this way, GSEA tool uses expression pattern of not only overlapped genes but also not-overlapped genes to produce ES matrix.
| Rank | GENE | SYMBOL | DESC | LIST.LOC | S2N | RES | CORE_ENRICHMENT |
|---|---|---|---|---|---|---|---|
| 1 | DYNC1I1 | DYNC1I1 | DYNC1I1 | 682 | 0.36 | 0.1 | YES |
| 2 | CREB3L3 | CREB3L3 | CREB3L3 | 726 | 0.35 | 0.23 | YES |
| 3 | AQP3 | AQP3 | AQP3 | 2336 | 0.16 | 0.2 | YES |
| 4 | AQP2 | AQP2 | AQP2 | 2436 | 0.15 | 0.26 | YES |
| 5 | VAMP2 | VAMP2 | VAMP2 | 2571 | 0.14 | 0.3 | YES |
| 6 | NSF | NSF | NSF | 2975 | 0.12 | 0.33 | YES |
| 7 | AQP4 | AQP4 | AQP4 | 3382 | 0.11 | 0.34 | YES |
| 8 | CREB3L1 | CREB3L1 | CREB3L1 | 3640 | 0.098 | 0.37 | YES |
| 9 | DYNC2H1 | DYNC2H1 | DYNC2H1 | 4277 | 0.079 | 0.36 | YES |
| 10 | DYNC1LI2 | DYNC1LI2 | DYNC1LI2 | 4365 | 0.076 | 0.39 | YES |
| 11 | DYNLL2 | DYNLL2 | DYNLL2 | 4463 | 0.074 | 0.41 | YES |
| 12 | PRKACB | PRKACB | PRKACB | 4583 | 0.071 | 0.43 | YES |
| 13 | DYNC1H1 | DYNC1H1 | DYNC1H1 | 4633 | 0.07 | 0.45 | YES |
| 14 | CREB5 | CREB5 | CREB5 | 5128 | 0.06 | 0.45 | NO |
| 15 | DCTN1 | DCTN1 | DCTN1 | 5942 | 0.045 | 0.42 | NO |
| 16 | RAB11B | RAB11B | RAB11B | 6447 | 0.038 | 0.41 | NO |
| 17 | RAB5B | RAB5B | RAB5B | 6484 | 0.037 | 0.42 | NO |
| 18 | ADCY3 | ADCY3 | ADCY3 | 6537 | 0.036 | 0.43 | NO |
| 19 | ADCY6 | ADCY6 | ADCY6 | 6683 | 0.035 | 0.44 | NO |
| 20 | RAB5A | RAB5A | RAB5A | 6813 | 0.033 | 0.44 | NO |
| 21 | DYNC2LI1 | DYNC2LI1 | DYNC2LI1 | 6848 | 0.032 | 0.45 | NO |
| 22 | GNAS | GNAS | GNAS | 7760 | 0.02 | 0.41 | NO |
| 23 | ADCY9 | ADCY9 | ADCY9 | 7958 | 0.018 | 0.41 | NO |
| 24 | PRKX | PRKX | PRKX | 8035 | 0.018 | 0.41 | NO |
| 25 | PRKACA | PRKACA | PRKACA | 8454 | 0.013 | 0.39 | NO |
| 26 | DCTN6 | DCTN6 | DCTN6 | 8993 | 0.0073 | 0.36 | NO |
| 27 | DYNC1I2 | DYNC1I2 | DYNC1I2 | 9659 | 0.00083 | 0.33 | NO |
| 28 | RAB11A | RAB11A | RAB11A | 9792 | -0.00041 | 0.32 | NO |
| 29 | ARHGDIA | ARHGDIA | ARHGDIA | 10808 | -0.01 | 0.27 | NO |
| 30 | CREB1 | CREB1 | CREB1 | 10811 | -0.01 | 0.27 | NO |
| 31 | DCTN4 | DCTN4 | DCTN4 | 10843 | -0.01 | 0.27 | NO |
| 32 | DYNC1LI1 | DYNC1LI1 | DYNC1LI1 | 11023 | -0.012 | 0.27 | NO |
| 33 | DCTN2 | DCTN2 | DCTN2 | 11124 | -0.013 | 0.27 | NO |
| 34 | STX4 | STX4 | STX4 | 11141 | -0.013 | 0.27 | NO |
| 35 | RAB5C | RAB5C | RAB5C | 11488 | -0.017 | 0.26 | NO |
| 36 | DCTN5 | DCTN5 | DCTN5 | 12096 | -0.023 | 0.24 | NO |
| 37 | DYNLL1 | DYNLL1 | DYNLL1 | 12475 | -0.027 | 0.22 | NO |
| 38 | CREB3 | CREB3 | CREB3 | 13082 | -0.033 | 0.2 | NO |
| 39 | AVPR2 | AVPR2 | AVPR2 | 13880 | -0.043 | 0.18 | NO |
| 40 | CREB3L2 | CREB3L2 | CREB3L2 | 14276 | -0.048 | 0.17 | NO |
| 41 | CREB3L4 | CREB3L4 | CREB3L4 | 14726 | -0.054 | 0.17 | NO |
| 42 | ARHGDIB | ARHGDIB | ARHGDIB | 15179 | -0.062 | 0.17 | NO |
Figure S47. Get High-res Image This plot shows mRNAseq_cNMF expression data heatmap (on the left) a RunningEnrichmentScore(RES) plot (on the top right) and a Signal2Noise(S2N) plot (on the bottom right) of genes in the pathway: KEGG GLYCOSPHINGOLIPID BIOSYNTHESIS LACTO AND NEOLACTO SERIES.
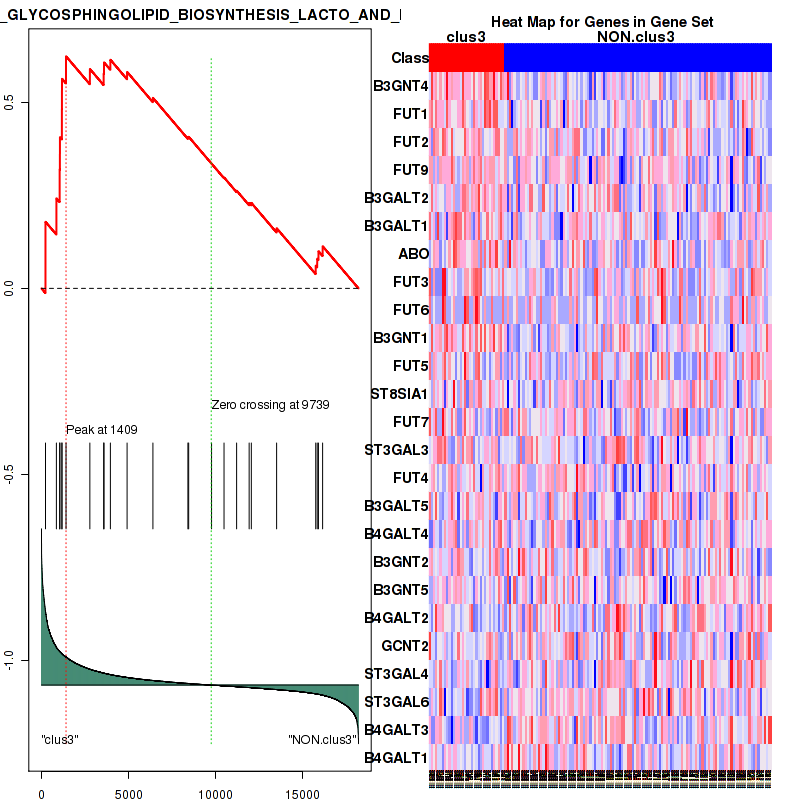
Figure S48. Get High-res Image For the top 5 core enriched genes in the pathway: KEGG GLYCOSPHINGOLIPID BIOSYNTHESIS LACTO AND NEOLACTO SERIES, this volcano plot shows how much they are up/down-regulated and significant. The significance was calculated by empirical bayesian fit
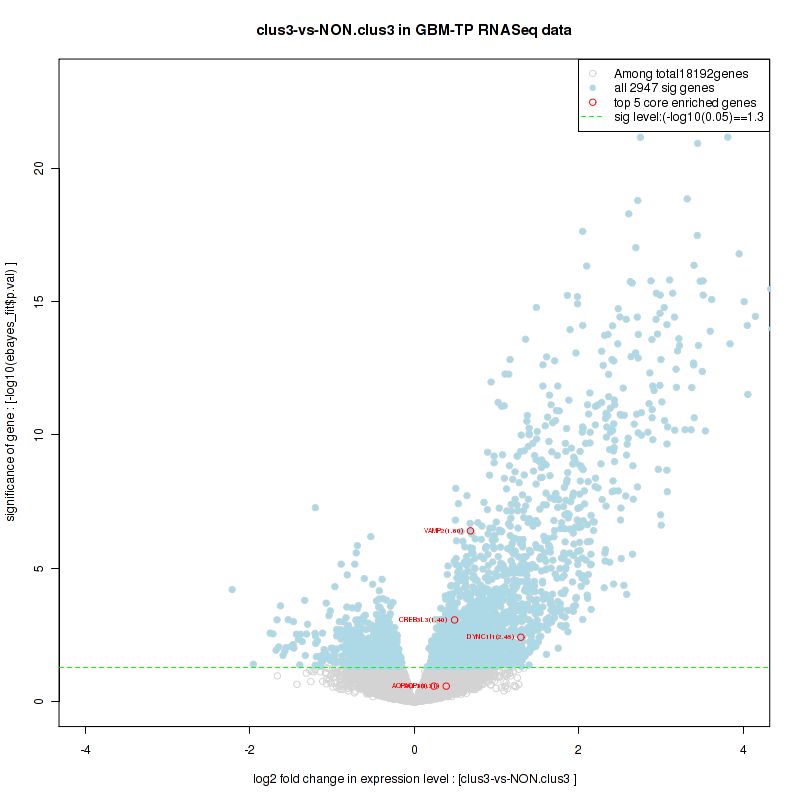
Table S25. Get Full Table This table shows a Running Enrichment Score (RES) of each gene in this pathway, that is, the enrichment score at this point in the ranked list of genes. All genes are ranked by Signal-to-Noise (S2N), a measure of similarity as default and are used to obtain ES matrix of all genes. In this way, GSEA tool uses expression pattern of not only overlapped genes but also not-overlapped genes to produce ES matrix.
| Rank | GENE | SYMBOL | DESC | LIST.LOC | S2N | RES | CORE_ENRICHMENT |
|---|---|---|---|---|---|---|---|
| 1 | GRIN1 | GRIN1 | GRIN1 | 25 | 0.99 | 0.13 | YES |
| 2 | NEFM | NEFM | NEFM | 70 | 0.84 | 0.24 | YES |
| 3 | NEFL | NEFL | NEFL | 203 | 0.65 | 0.31 | YES |
| 4 | NEFH | NEFH | NEFH | 204 | 0.65 | 0.4 | YES |
| 5 | GRIN2A | GRIN2A | GRIN2A | 284 | 0.56 | 0.47 | YES |
| 6 | PRPH2 | PRPH2 | PRPH2 | 659 | 0.37 | 0.5 | YES |
| 7 | GRIN2C | GRIN2C | GRIN2C | 740 | 0.35 | 0.54 | YES |
| 8 | NOS1 | NOS1 | NOS1 | 763 | 0.34 | 0.58 | YES |
| 9 | SLC1A2 | SLC1A2 | SLC1A2 | 1091 | 0.28 | 0.6 | YES |
| 10 | CHP2 | CHP2 | CHP2 | 1322 | 0.24 | 0.62 | YES |
| 11 | GRIA2 | GRIA2 | GRIA2 | 2112 | 0.17 | 0.6 | NO |
| 12 | GRIN2B | GRIN2B | GRIN2B | 3305 | 0.11 | 0.54 | NO |
| 13 | TNF | TNF | TNF | 3509 | 0.1 | 0.55 | NO |
| 14 | MAP3K5 | MAP3K5 | MAP3K5 | 3600 | 0.1 | 0.55 | NO |
| 15 | GRIA1 | GRIA1 | GRIA1 | 3678 | 0.097 | 0.56 | NO |
| 16 | BCL2 | BCL2 | BCL2 | 3703 | 0.096 | 0.57 | NO |
| 17 | GRIN2D | GRIN2D | GRIN2D | 3874 | 0.09 | 0.58 | NO |
| 18 | PPP3CB | PPP3CB | PPP3CB | 3935 | 0.088 | 0.58 | NO |
| 19 | MAPK11 | MAPK11 | MAPK11 | 4023 | 0.086 | 0.59 | NO |
| 20 | PPP3CA | PPP3CA | PPP3CA | 4465 | 0.074 | 0.58 | NO |
| 21 | PPP3R1 | PPP3R1 | PPP3R1 | 4511 | 0.073 | 0.58 | NO |
| 22 | CHP | CHP | CHP | 6725 | 0.034 | 0.47 | NO |
| 23 | RAB5A | RAB5A | RAB5A | 6813 | 0.033 | 0.46 | NO |
| 24 | CCS | CCS | CCS | 7074 | 0.029 | 0.46 | NO |
| 25 | ALS2 | ALS2 | ALS2 | 7127 | 0.029 | 0.46 | NO |
| 26 | PRPH | PRPH | PRPH | 7659 | 0.022 | 0.43 | NO |
| 27 | CASP9 | CASP9 | CASP9 | 7802 | 0.02 | 0.42 | NO |
| 28 | TP53 | TP53 | TP53 | 8157 | 0.016 | 0.41 | NO |
| 29 | SOD1 | SOD1 | SOD1 | 8865 | 0.0085 | 0.37 | NO |
| 30 | MAPK12 | MAPK12 | MAPK12 | 9600 | 0.0014 | 0.33 | NO |
| 31 | BCL2L1 | BCL2L1 | BCL2L1 | 10080 | -0.0031 | 0.3 | NO |
| 32 | APAF1 | APAF1 | APAF1 | 10237 | -0.0046 | 0.29 | NO |
| 33 | RAC1 | RAC1 | RAC1 | 10594 | -0.0082 | 0.28 | NO |
| 34 | BAD | BAD | BAD | 11291 | -0.015 | 0.24 | NO |
| 35 | CAT | CAT | CAT | 11346 | -0.015 | 0.24 | NO |
| 36 | MAP2K3 | MAP2K3 | MAP2K3 | 11467 | -0.017 | 0.23 | NO |
| 37 | TOMM40L | TOMM40L | TOMM40L | 11804 | -0.02 | 0.22 | NO |
| 38 | MAPK14 | MAPK14 | MAPK14 | 12406 | -0.026 | 0.19 | NO |
| 39 | TNFRSF1A | TNFRSF1A | TNFRSF1A | 12945 | -0.032 | 0.16 | NO |
| 40 | CASP3 | CASP3 | CASP3 | 12984 | -0.032 | 0.16 | NO |
| 41 | CYCS | CYCS | CYCS | 13150 | -0.034 | 0.16 | NO |
| 42 | TOMM40 | TOMM40 | TOMM40 | 13453 | -0.038 | 0.15 | NO |
| 43 | GPX1 | GPX1 | GPX1 | 14255 | -0.047 | 0.11 | NO |
| 44 | BAX | BAX | BAX | 14456 | -0.05 | 0.11 | NO |
| 45 | DAXX | DAXX | DAXX | 14538 | -0.051 | 0.11 | NO |
| 46 | PPP3CC | PPP3CC | PPP3CC | 14614 | -0.052 | 0.11 | NO |
| 47 | DERL1 | DERL1 | DERL1 | 14895 | -0.057 | 0.1 | NO |
| 48 | CASP1 | CASP1 | CASP1 | 15097 | -0.06 | 0.099 | NO |
| 49 | MAP2K6 | MAP2K6 | MAP2K6 | 15709 | -0.073 | 0.075 | NO |
| 50 | BID | BID | BID | 16013 | -0.081 | 0.069 | NO |
| 51 | TNFRSF1B | TNFRSF1B | TNFRSF1B | 16273 | -0.091 | 0.067 | NO |
| 52 | PPP3R2 | PPP3R2 | PPP3R2 | 16669 | -0.11 | 0.059 | NO |
| 53 | MAPK13 | MAPK13 | MAPK13 | 17650 | -0.19 | 0.03 | NO |
Figure S49. Get High-res Image This plot shows mRNAseq_cNMF expression data heatmap (on the left) a RunningEnrichmentScore(RES) plot (on the top right) and a Signal2Noise(S2N) plot (on the bottom right) of genes in the pathway: KEGG BUTANOATE METABOLISM.
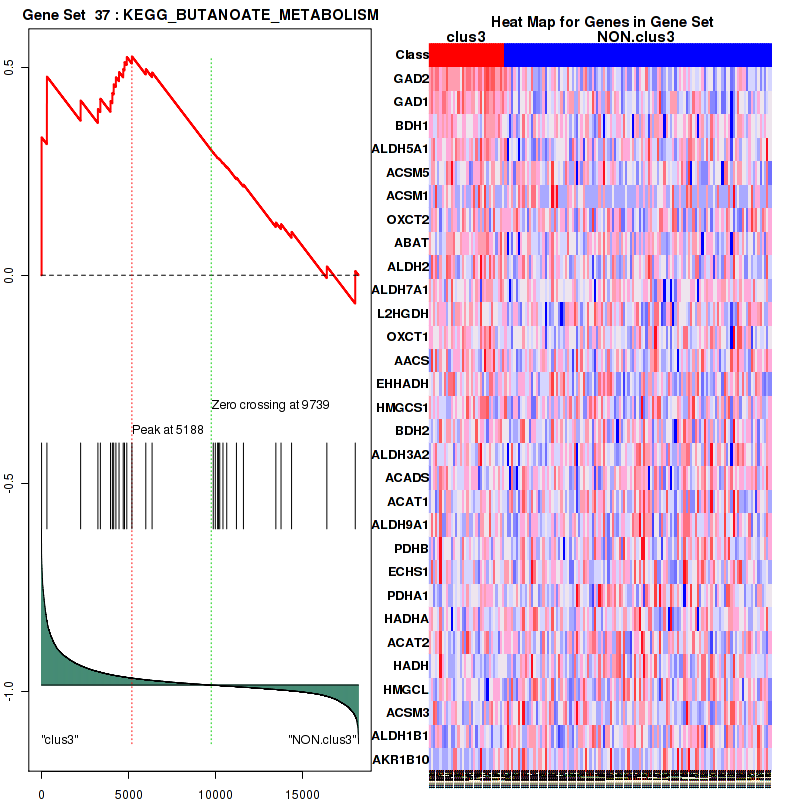
Figure S50. Get High-res Image For the top 5 core enriched genes in the pathway: KEGG BUTANOATE METABOLISM, this volcano plot shows how much they are up/down-regulated and significant. The significance was calculated by empirical bayesian fit
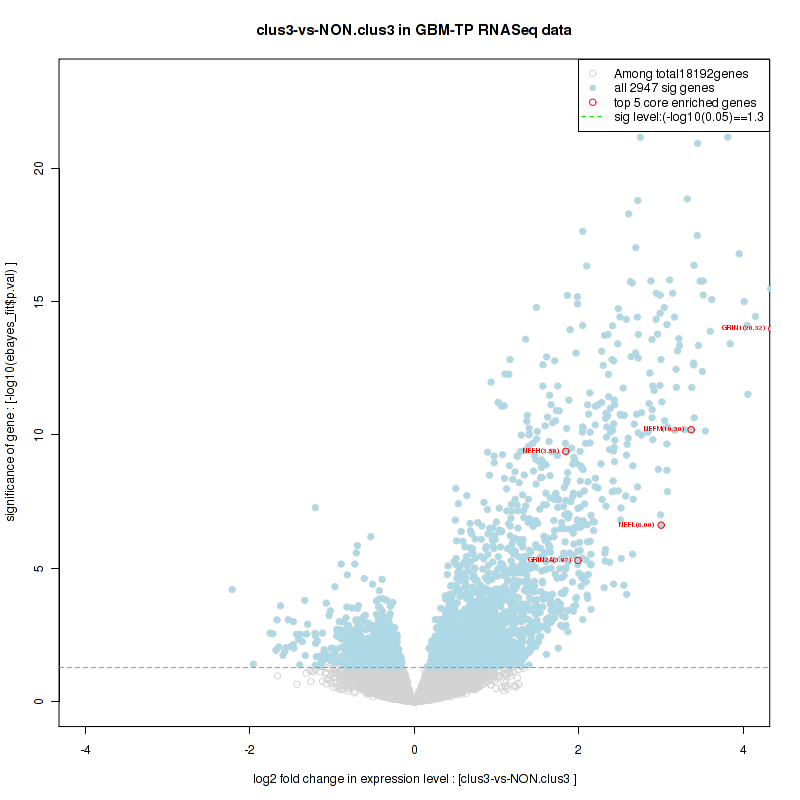
Table S26. Get Full Table This table shows a Running Enrichment Score (RES) of each gene in this pathway, that is, the enrichment score at this point in the ranked list of genes. All genes are ranked by Signal-to-Noise (S2N), a measure of similarity as default and are used to obtain ES matrix of all genes. In this way, GSEA tool uses expression pattern of not only overlapped genes but also not-overlapped genes to produce ES matrix.
| Rank | GENE | SYMBOL | DESC | LIST.LOC | S2N | RES | CORE_ENRICHMENT |
|---|---|---|---|---|---|---|---|
| 1 | PRKCB | PRKCB | PRKCB | 576 | 0.4 | 0.16 | YES |
| 2 | EGFR | EGFR | EGFR | 1945 | 0.18 | 0.18 | YES |
| 3 | PTK2B | PTK2B | PTK2B | 2348 | 0.16 | 0.23 | YES |
| 4 | CALM1 | CALM1 | CALM1 | 3455 | 0.1 | 0.22 | YES |
| 5 | MEF2C | MEF2C | MEF2C | 3698 | 0.096 | 0.26 | YES |
| 6 | PAK1 | PAK1 | PAK1 | 3710 | 0.096 | 0.3 | YES |
| 7 | GNAQ | GNAQ | GNAQ | 3851 | 0.091 | 0.34 | YES |
| 8 | PRKCA | PRKCA | PRKCA | 3986 | 0.087 | 0.37 | YES |
| 9 | MEF2D | MEF2D | MEF2D | 4688 | 0.069 | 0.37 | YES |
| 10 | MEF2A | MEF2A | MEF2A | 4838 | 0.066 | 0.39 | YES |
| 11 | MAP2K4 | MAP2K4 | MAP2K4 | 4955 | 0.063 | 0.42 | YES |
| 12 | CALM3 | CALM3 | CALM3 | 5028 | 0.062 | 0.44 | YES |
| 13 | AGT | AGT | AGT | 5168 | 0.059 | 0.46 | YES |
| 14 | MAPK3 | MAPK3 | MAPK3 | 5591 | 0.051 | 0.46 | YES |
| 15 | MAP2K1 | MAP2K1 | MAP2K1 | 5877 | 0.046 | 0.47 | YES |
| 16 | ELK1 | ELK1 | ELK1 | 6322 | 0.039 | 0.46 | YES |
| 17 | MAPK1 | MAPK1 | MAPK1 | 6398 | 0.038 | 0.48 | YES |
| 18 | MAP3K1 | MAP3K1 | MAP3K1 | 7315 | 0.026 | 0.44 | NO |
| 19 | HRAS | HRAS | HRAS | 7361 | 0.025 | 0.45 | NO |
| 20 | SOS1 | SOS1 | SOS1 | 7754 | 0.021 | 0.44 | NO |
| 21 | PTK2 | PTK2 | PTK2 | 7999 | 0.018 | 0.44 | NO |
| 22 | MAP2K2 | MAP2K2 | MAP2K2 | 9418 | 0.003 | 0.36 | NO |
| 23 | GRB2 | GRB2 | GRB2 | 9969 | -0.002 | 0.33 | NO |
| 24 | CALM2 | CALM2 | CALM2 | 10046 | -0.0028 | 0.33 | NO |
| 25 | RAC1 | RAC1 | RAC1 | 10594 | -0.0082 | 0.3 | NO |
| 26 | MAPK8 | MAPK8 | MAPK8 | 11395 | -0.016 | 0.26 | NO |
| 27 | RAF1 | RAF1 | RAF1 | 11525 | -0.017 | 0.26 | NO |
| 28 | ATF2 | ATF2 | ATF2 | 11699 | -0.019 | 0.26 | NO |
| 29 | JUN | JUN | JUN | 11722 | -0.019 | 0.27 | NO |
| 30 | SRC | SRC | SRC | 12696 | -0.029 | 0.23 | NO |
| 31 | SHC1 | SHC1 | SHC1 | 15576 | -0.07 | 0.11 | NO |
| 32 | AGTR1 | AGTR1 | AGTR1 | 15698 | -0.073 | 0.14 | NO |
Figure S51. Get High-res Image This plot shows mRNAseq_cNMF expression data heatmap (on the left) a RunningEnrichmentScore(RES) plot (on the top right) and a Signal2Noise(S2N) plot (on the bottom right) of genes in the pathway: KEGG MAPK SIGNALING PATHWAY.
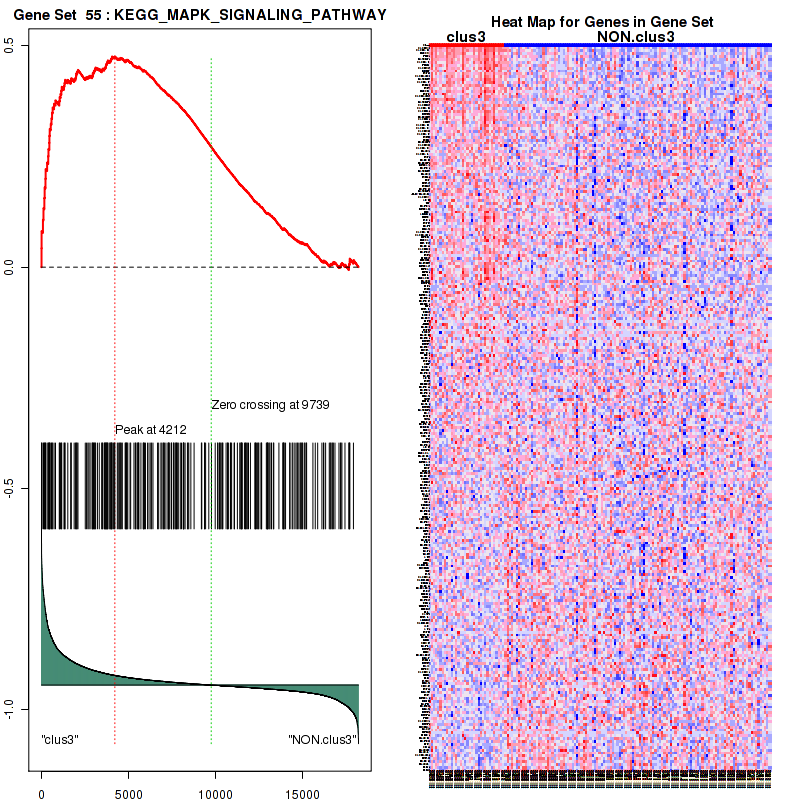
Figure S52. Get High-res Image For the top 5 core enriched genes in the pathway: KEGG MAPK SIGNALING PATHWAY, this volcano plot shows how much they are up/down-regulated and significant. The significance was calculated by empirical bayesian fit
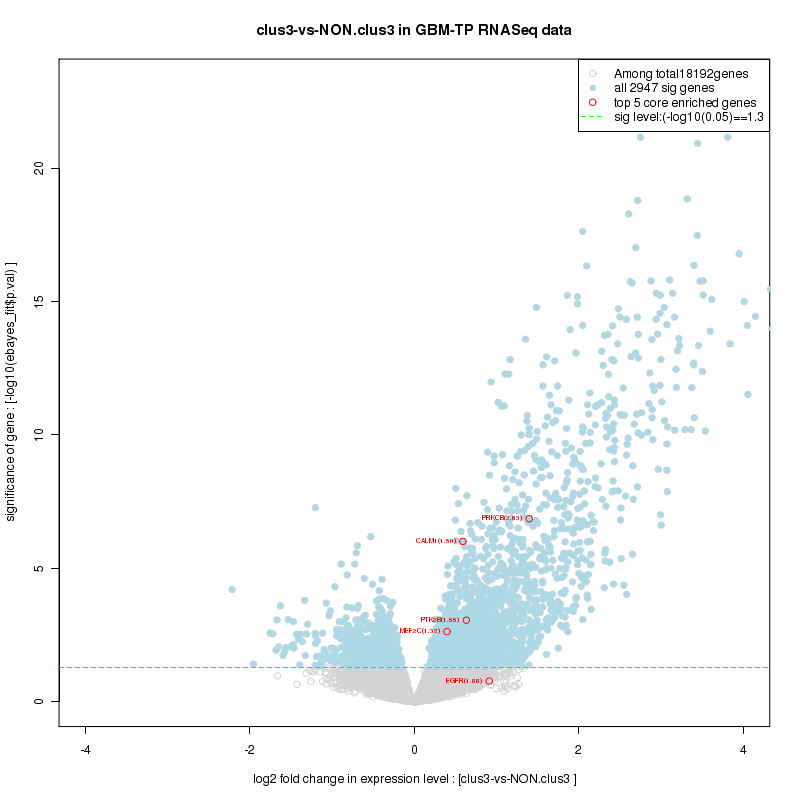
Table S27. Get Full Table This table shows a Running Enrichment Score (RES) of each gene in this pathway, that is, the enrichment score at this point in the ranked list of genes. All genes are ranked by Signal-to-Noise (S2N), a measure of similarity as default and are used to obtain ES matrix of all genes. In this way, GSEA tool uses expression pattern of not only overlapped genes but also not-overlapped genes to produce ES matrix.
| Rank | GENE | SYMBOL | DESC | LIST.LOC | S2N | RES | CORE_ENRICHMENT |
|---|---|---|---|---|---|---|---|
| 1 | SNAP25 | SNAP25 | SNAP25 | 257 | 0.59 | 0.17 | YES |
| 2 | STX1B | STX1B | STX1B | 504 | 0.43 | 0.29 | YES |
| 3 | STX1A | STX1A | STX1A | 666 | 0.37 | 0.4 | YES |
| 4 | VAMP1 | VAMP1 | VAMP1 | 974 | 0.29 | 0.48 | YES |
| 5 | STX19 | STX19 | STX19 | 1746 | 0.2 | 0.5 | YES |
| 6 | VAMP2 | VAMP2 | VAMP2 | 2571 | 0.14 | 0.5 | YES |
| 7 | TSNARE1 | TSNARE1 | TSNARE1 | 3277 | 0.11 | 0.5 | NO |
| 8 | STX17 | STX17 | STX17 | 4881 | 0.065 | 0.43 | NO |
| 9 | STX16 | STX16 | STX16 | 5726 | 0.049 | 0.4 | NO |
| 10 | VTI1B | VTI1B | VTI1B | 6736 | 0.034 | 0.35 | NO |
| 11 | STX7 | STX7 | STX7 | 7023 | 0.03 | 0.34 | NO |
| 12 | SNAP47 | SNAP47 | SNAP47 | 7701 | 0.021 | 0.31 | NO |
| 13 | STX3 | STX3 | STX3 | 8007 | 0.018 | 0.3 | NO |
| 14 | STX2 | STX2 | STX2 | 9267 | 0.0043 | 0.24 | NO |
| 15 | USE1 | USE1 | USE1 | 9769 | -0.00025 | 0.21 | NO |
| 16 | YKT6 | YKT6 | YKT6 | 10047 | -0.0028 | 0.19 | NO |
| 17 | GOSR1 | GOSR1 | GOSR1 | 10068 | -0.003 | 0.19 | NO |
| 18 | VAMP4 | VAMP4 | VAMP4 | 10099 | -0.0032 | 0.19 | NO |
| 19 | VTI1A | VTI1A | VTI1A | 10985 | -0.012 | 0.15 | NO |
| 20 | SNAP23 | SNAP23 | SNAP23 | 11130 | -0.013 | 0.14 | NO |
| 21 | STX4 | STX4 | STX4 | 11141 | -0.013 | 0.15 | NO |
| 22 | STX12 | STX12 | STX12 | 11215 | -0.014 | 0.15 | NO |
| 23 | BET1L | BET1L | BET1L | 11221 | -0.014 | 0.15 | NO |
| 24 | STX18 | STX18 | STX18 | 11356 | -0.016 | 0.15 | NO |
| 25 | STX6 | STX6 | STX6 | 11433 | -0.016 | 0.15 | NO |
| 26 | GOSR2 | GOSR2 | GOSR2 | 11501 | -0.017 | 0.15 | NO |
| 27 | VAMP3 | VAMP3 | VAMP3 | 11815 | -0.02 | 0.14 | NO |
| 28 | STX5 | STX5 | STX5 | 12339 | -0.025 | 0.12 | NO |
| 29 | SNAP29 | SNAP29 | SNAP29 | 12378 | -0.026 | 0.13 | NO |
| 30 | STX10 | STX10 | STX10 | 13486 | -0.038 | 0.077 | NO |
| 31 | VAMP7 | VAMP7 | VAMP7 | 13897 | -0.043 | 0.068 | NO |
| 32 | SEC22B | SEC22B | SEC22B | 14044 | -0.045 | 0.074 | NO |
| 33 | VAMP5 | VAMP5 | VAMP5 | 14085 | -0.045 | 0.086 | NO |
| 34 | STX8 | STX8 | STX8 | 14268 | -0.048 | 0.091 | NO |
| 35 | BET1 | BET1 | BET1 | 15409 | -0.066 | 0.049 | NO |
| 36 | BNIP1 | BNIP1 | BNIP1 | 16352 | -0.094 | 0.027 | NO |
| 37 | STX11 | STX11 | STX11 | 16685 | -0.11 | 0.043 | NO |
| 38 | VAMP8 | VAMP8 | VAMP8 | 16976 | -0.13 | 0.067 | NO |
Figure S53. Get High-res Image This plot shows mRNAseq_cNMF expression data heatmap (on the left) a RunningEnrichmentScore(RES) plot (on the top right) and a Signal2Noise(S2N) plot (on the bottom right) of genes in the pathway: KEGG ERBB SIGNALING PATHWAY.
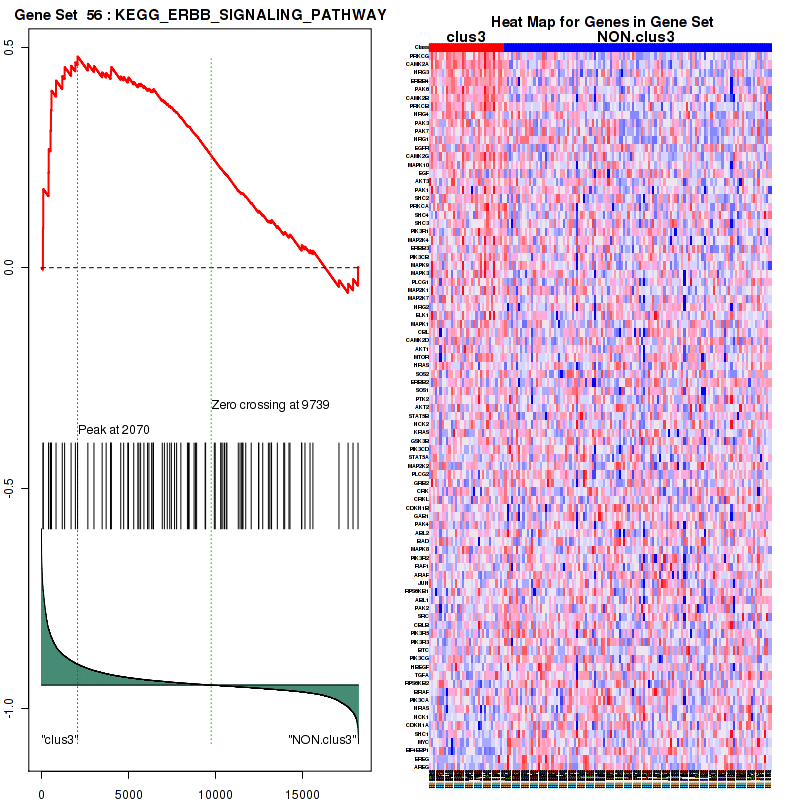
Figure S54. Get High-res Image For the top 5 core enriched genes in the pathway: KEGG ERBB SIGNALING PATHWAY, this volcano plot shows how much they are up/down-regulated and significant. The significance was calculated by empirical bayesian fit
Table S28. Get Full Table This table shows a Running Enrichment Score (RES) of each gene in this pathway, that is, the enrichment score at this point in the ranked list of genes. All genes are ranked by Signal-to-Noise (S2N), a measure of similarity as default and are used to obtain ES matrix of all genes. In this way, GSEA tool uses expression pattern of not only overlapped genes but also not-overlapped genes to produce ES matrix.
| Rank | GENE | SYMBOL | DESC | LIST.LOC | S2N | RES | CORE_ENRICHMENT |
|---|---|---|---|---|---|---|---|
| 1 | PRKCG | PRKCG | PRKCG | 86 | 0.82 | 0.11 | YES |
| 2 | CDS1 | CDS1 | CDS1 | 424 | 0.46 | 0.15 | YES |
| 3 | INPP5J | INPP5J | INPP5J | 545 | 0.41 | 0.2 | YES |
| 4 | DGKE | DGKE | DGKE | 566 | 0.4 | 0.25 | YES |
| 5 | PRKCB | PRKCB | PRKCB | 576 | 0.4 | 0.31 | YES |
| 6 | PIP5K1B | PIP5K1B | PIP5K1B | 773 | 0.34 | 0.34 | YES |
| 7 | ITPKA | ITPKA | ITPKA | 937 | 0.3 | 0.38 | YES |
| 8 | CALML6 | CALML6 | CALML6 | 1245 | 0.25 | 0.39 | YES |
| 9 | SYNJ2 | SYNJ2 | SYNJ2 | 1907 | 0.19 | 0.38 | YES |
| 10 | DGKZ | DGKZ | DGKZ | 2397 | 0.15 | 0.38 | YES |
| 11 | INPP4B | INPP4B | INPP4B | 2420 | 0.15 | 0.4 | YES |
| 12 | DGKB | DGKB | DGKB | 2447 | 0.15 | 0.41 | YES |
| 13 | SYNJ1 | SYNJ1 | SYNJ1 | 2777 | 0.13 | 0.41 | YES |
| 14 | PI4KA | PI4KA | PI4KA | 2811 | 0.13 | 0.43 | YES |
| 15 | INPP5A | INPP5A | INPP5A | 3006 | 0.12 | 0.44 | YES |
| 16 | PIK3C2B | PIK3C2B | PIK3C2B | 3227 | 0.11 | 0.44 | YES |
| 17 | ITPR1 | ITPR1 | ITPR1 | 3257 | 0.11 | 0.45 | YES |
| 18 | ITPK1 | ITPK1 | ITPK1 | 3262 | 0.11 | 0.47 | YES |
| 19 | DGKQ | DGKQ | DGKQ | 3402 | 0.11 | 0.47 | YES |
| 20 | CALM1 | CALM1 | CALM1 | 3455 | 0.1 | 0.49 | YES |
| 21 | PLCB4 | PLCB4 | PLCB4 | 3556 | 0.1 | 0.49 | YES |
| 22 | ITPKB | ITPKB | ITPKB | 3602 | 0.099 | 0.5 | YES |
| 23 | INPP5D | INPP5D | INPP5D | 3606 | 0.099 | 0.52 | YES |
| 24 | PLCD1 | PLCD1 | PLCD1 | 3719 | 0.095 | 0.52 | YES |
| 25 | PLCE1 | PLCE1 | PLCE1 | 3933 | 0.089 | 0.52 | YES |
| 26 | PRKCA | PRKCA | PRKCA | 3986 | 0.087 | 0.53 | YES |
| 27 | PLCB2 | PLCB2 | PLCB2 | 4194 | 0.081 | 0.53 | YES |
| 28 | PIP5K1C | PIP5K1C | PIP5K1C | 4309 | 0.078 | 0.54 | YES |
| 29 | INPP4A | INPP4A | INPP4A | 4334 | 0.077 | 0.55 | YES |
| 30 | ITPR2 | ITPR2 | ITPR2 | 4594 | 0.071 | 0.54 | YES |
| 31 | INPP5E | INPP5E | INPP5E | 4663 | 0.07 | 0.55 | YES |
| 32 | PIK3R1 | PIK3R1 | PIK3R1 | 4716 | 0.068 | 0.56 | YES |
| 33 | PIP4K2A | PIP4K2A | PIP4K2A | 4823 | 0.066 | 0.56 | YES |
| 34 | CALM3 | CALM3 | CALM3 | 5028 | 0.062 | 0.56 | YES |
| 35 | PLCD4 | PLCD4 | PLCD4 | 5080 | 0.061 | 0.56 | YES |
| 36 | INPP1 | INPP1 | INPP1 | 5153 | 0.059 | 0.56 | YES |
| 37 | PIKFYVE | PIKFYVE | PIKFYVE | 5255 | 0.057 | 0.57 | YES |
| 38 | PIK3CB | PIK3CB | PIK3CB | 5294 | 0.056 | 0.57 | YES |
| 39 | PLCD3 | PLCD3 | PLCD3 | 5439 | 0.054 | 0.57 | YES |
| 40 | PIP4K2B | PIP4K2B | PIP4K2B | 5552 | 0.052 | 0.57 | YES |
| 41 | PLCG1 | PLCG1 | PLCG1 | 5688 | 0.049 | 0.57 | NO |
| 42 | PIK3C2A | PIK3C2A | PIK3C2A | 5917 | 0.046 | 0.56 | NO |
| 43 | DGKG | DGKG | DGKG | 6221 | 0.041 | 0.55 | NO |
| 44 | INPPL1 | INPPL1 | INPPL1 | 6237 | 0.04 | 0.56 | NO |
| 45 | PIP4K2C | PIP4K2C | PIP4K2C | 6456 | 0.038 | 0.55 | NO |
| 46 | ITPR3 | ITPR3 | ITPR3 | 6508 | 0.037 | 0.55 | NO |
| 47 | PLCB1 | PLCB1 | PLCB1 | 6644 | 0.035 | 0.55 | NO |
| 48 | IMPA1 | IMPA1 | IMPA1 | 6646 | 0.035 | 0.56 | NO |
| 49 | IPPK | IPPK | IPPK | 7379 | 0.025 | 0.52 | NO |
| 50 | INPP5K | INPP5K | INPP5K | 7393 | 0.025 | 0.52 | NO |
| 51 | INPP5B | INPP5B | INPP5B | 8632 | 0.011 | 0.46 | NO |
| 52 | CDIPT | CDIPT | CDIPT | 8760 | 0.0095 | 0.45 | NO |
| 53 | PIK3CD | PIK3CD | PIK3CD | 8902 | 0.0082 | 0.44 | NO |
| 54 | DGKA | DGKA | DGKA | 8924 | 0.008 | 0.44 | NO |
| 55 | DGKD | DGKD | DGKD | 9223 | 0.0047 | 0.43 | NO |
| 56 | PI4KB | PI4KB | PI4KB | 9246 | 0.0045 | 0.43 | NO |
| 57 | PLCG2 | PLCG2 | PLCG2 | 9917 | -0.0015 | 0.39 | NO |
| 58 | CALM2 | CALM2 | CALM2 | 10046 | -0.0028 | 0.38 | NO |
| 59 | OCRL | OCRL | OCRL | 10097 | -0.0032 | 0.38 | NO |
| 60 | PLCB3 | PLCB3 | PLCB3 | 10256 | -0.0048 | 0.37 | NO |
| 61 | PTEN | PTEN | PTEN | 10752 | -0.0095 | 0.35 | NO |
| 62 | PIK3C2G | PIK3C2G | PIK3C2G | 11198 | -0.014 | 0.32 | NO |
| 63 | PIK3R2 | PIK3R2 | PIK3R2 | 11487 | -0.017 | 0.31 | NO |
| 64 | CDS2 | CDS2 | CDS2 | 12170 | -0.024 | 0.28 | NO |
| 65 | PIP5K1A | PIP5K1A | PIP5K1A | 12763 | -0.03 | 0.25 | NO |
| 66 | PIK3C3 | PIK3C3 | PIK3C3 | 12906 | -0.031 | 0.24 | NO |
| 67 | PIK3R5 | PIK3R5 | PIK3R5 | 13102 | -0.034 | 0.24 | NO |
| 68 | PIK3R3 | PIK3R3 | PIK3R3 | 13190 | -0.035 | 0.24 | NO |
| 69 | PIK3CG | PIK3CG | PIK3CG | 13533 | -0.038 | 0.22 | NO |
| 70 | IMPA2 | IMPA2 | IMPA2 | 13633 | -0.04 | 0.22 | NO |
| 71 | PIK3CA | PIK3CA | PIK3CA | 14929 | -0.057 | 0.16 | NO |
| 72 | DGKI | DGKI | DGKI | 15779 | -0.075 | 0.12 | NO |
| 73 | DGKH | DGKH | DGKH | 15872 | -0.077 | 0.13 | NO |
Figure S55. Get High-res Image This plot shows mRNAseq_cNMF expression data heatmap (on the left) a RunningEnrichmentScore(RES) plot (on the top right) and a Signal2Noise(S2N) plot (on the bottom right) of genes in the pathway: KEGG CALCIUM SIGNALING PATHWAY.
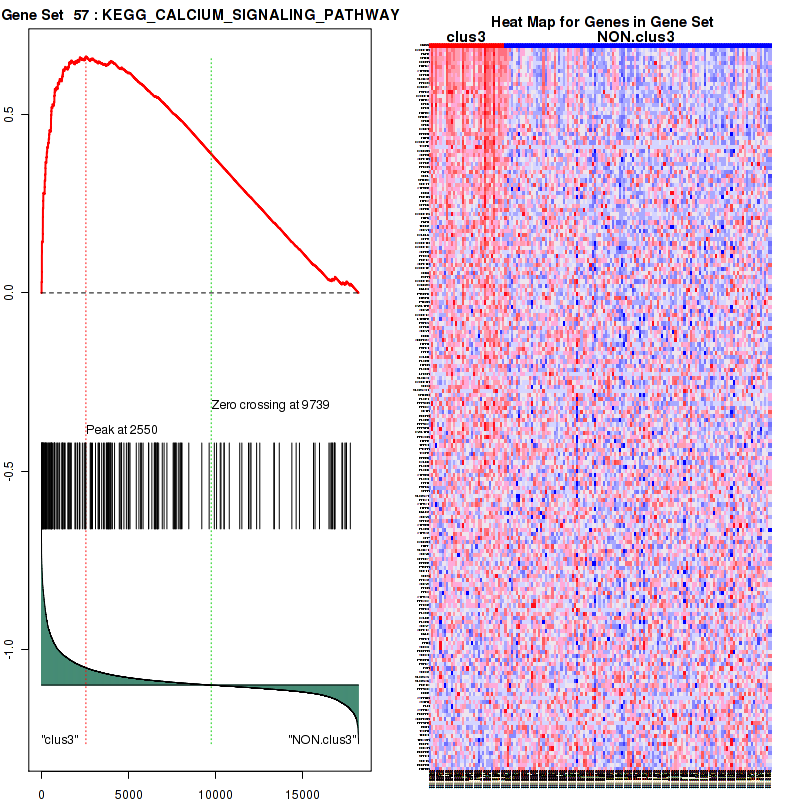
Figure S56. Get High-res Image For the top 5 core enriched genes in the pathway: KEGG CALCIUM SIGNALING PATHWAY, this volcano plot shows how much they are up/down-regulated and significant. The significance was calculated by empirical bayesian fit
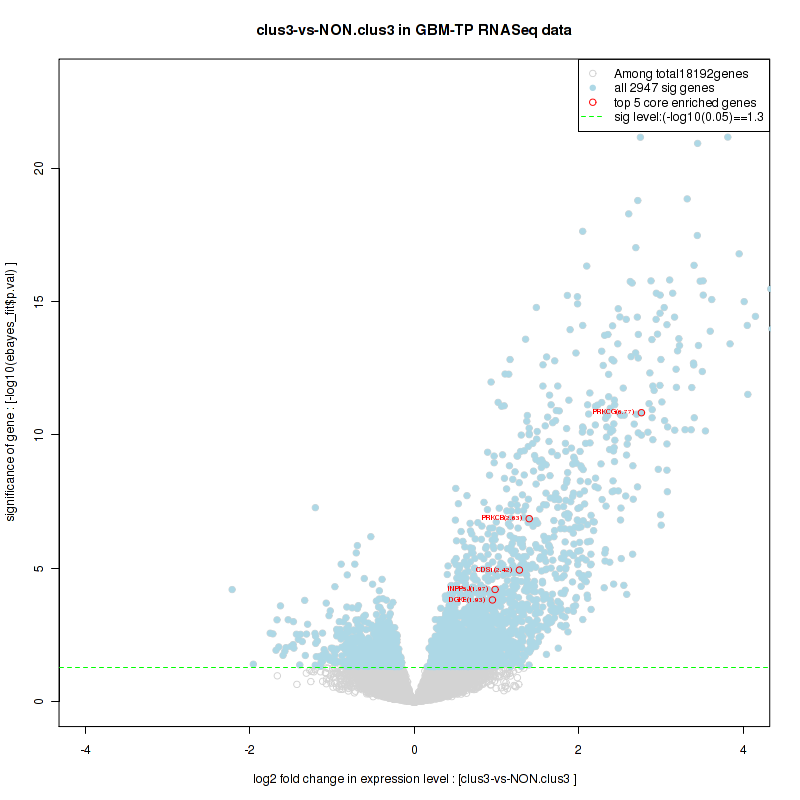
Table S29. Get Full Table This table shows a Running Enrichment Score (RES) of each gene in this pathway, that is, the enrichment score at this point in the ranked list of genes. All genes are ranked by Signal-to-Noise (S2N), a measure of similarity as default and are used to obtain ES matrix of all genes. In this way, GSEA tool uses expression pattern of not only overlapped genes but also not-overlapped genes to produce ES matrix.
| Rank | GENE | SYMBOL | DESC | LIST.LOC | S2N | RES | CORE_ENRICHMENT |
|---|---|---|---|---|---|---|---|
| 1 | RASAL1 | RASAL1 | RASAL1 | 43 | 0.94 | 0.18 | YES |
| 2 | RASGRF1 | RASGRF1 | RASGRF1 | 167 | 0.7 | 0.31 | YES |
| 3 | RASGRF2 | RASGRF2 | RASGRF2 | 452 | 0.46 | 0.38 | YES |
| 4 | CAMK2B | CAMK2B | CAMK2B | 546 | 0.41 | 0.46 | YES |
| 5 | PRKCB | PRKCB | PRKCB | 576 | 0.4 | 0.54 | YES |
| 6 | RASGRP1 | RASGRP1 | RASGRP1 | 804 | 0.33 | 0.59 | YES |
| 7 | PRKCZ | PRKCZ | PRKCZ | 979 | 0.29 | 0.64 | YES |
| 8 | RIN1 | RIN1 | RIN1 | 2158 | 0.17 | 0.61 | YES |
| 9 | PRKCE | PRKCE | PRKCE | 2224 | 0.16 | 0.63 | YES |
| 10 | SYNGAP1 | SYNGAP1 | SYNGAP1 | 2836 | 0.13 | 0.63 | YES |
| 11 | RASGRP2 | RASGRP2 | RASGRP2 | 2939 | 0.12 | 0.64 | YES |
| 12 | RASA4 | RASA4 | RASA4 | 3002 | 0.12 | 0.67 | YES |
| 13 | RASGRP3 | RASGRP3 | RASGRP3 | 3212 | 0.11 | 0.68 | YES |
| 14 | PLCE1 | PLCE1 | PLCE1 | 3933 | 0.089 | 0.65 | NO |
| 15 | PRKCA | PRKCA | PRKCA | 3986 | 0.087 | 0.67 | NO |
| 16 | NF1 | NF1 | NF1 | 5309 | 0.056 | 0.61 | NO |
| 17 | DAB2IP | DAB2IP | DAB2IP | 5539 | 0.052 | 0.6 | NO |
| 18 | HRAS | HRAS | HRAS | 7361 | 0.025 | 0.51 | NO |
| 19 | SOS2 | SOS2 | SOS2 | 7454 | 0.024 | 0.51 | NO |
| 20 | RASA1 | RASA1 | RASA1 | 7565 | 0.023 | 0.51 | NO |
| 21 | RASGRP4 | RASGRP4 | RASGRP4 | 7663 | 0.022 | 0.51 | NO |
| 22 | SOS1 | SOS1 | SOS1 | 7754 | 0.021 | 0.5 | NO |
| 23 | KRAS | KRAS | KRAS | 8756 | 0.0095 | 0.45 | NO |
| 24 | RABGEF1 | RABGEF1 | RABGEF1 | 8992 | 0.0073 | 0.44 | NO |
| 25 | GRB2 | GRB2 | GRB2 | 9969 | -0.002 | 0.39 | NO |
| 26 | RASA2 | RASA2 | RASA2 | 10207 | -0.0044 | 0.37 | NO |
| 27 | NRAS | NRAS | NRAS | 14931 | -0.057 | 0.13 | NO |
| 28 | RRAS | RRAS | RRAS | 15850 | -0.076 | 0.09 | NO |
| 29 | LGALS3 | LGALS3 | LGALS3 | 16427 | -0.097 | 0.077 | NO |
| 30 | LGALS1 | LGALS1 | LGALS1 | 16547 | -0.1 | 0.091 | NO |
Figure S57. Get High-res Image This plot shows mRNAseq_cNMF expression data heatmap (on the left) a RunningEnrichmentScore(RES) plot (on the top right) and a Signal2Noise(S2N) plot (on the bottom right) of genes in the pathway: KEGG PHOSPHATIDYLINOSITOL SIGNALING SYSTEM.
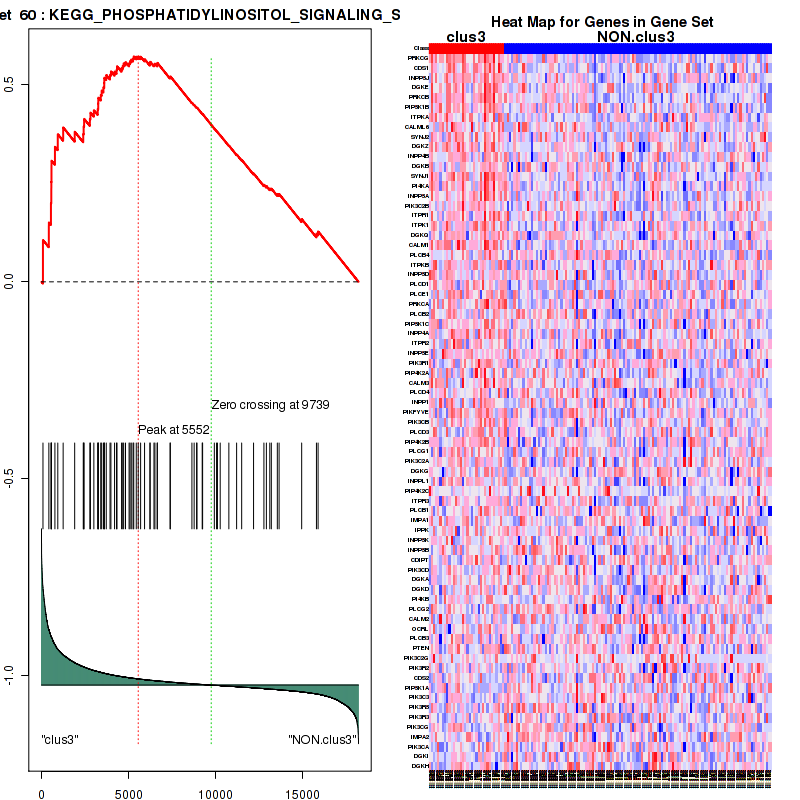
Figure S58. Get High-res Image For the top 5 core enriched genes in the pathway: KEGG PHOSPHATIDYLINOSITOL SIGNALING SYSTEM, this volcano plot shows how much they are up/down-regulated and significant. The significance was calculated by empirical bayesian fit
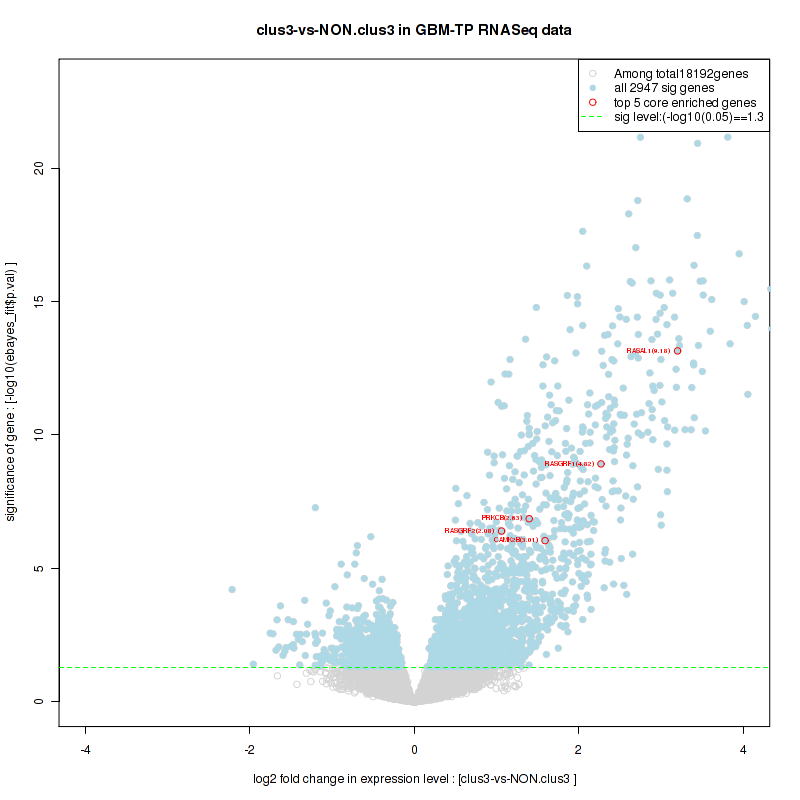
Table S30. Get Full Table This table shows a Running Enrichment Score (RES) of each gene in this pathway, that is, the enrichment score at this point in the ranked list of genes. All genes are ranked by Signal-to-Noise (S2N), a measure of similarity as default and are used to obtain ES matrix of all genes. In this way, GSEA tool uses expression pattern of not only overlapped genes but also not-overlapped genes to produce ES matrix.
| Rank | GENE | SYMBOL | DESC | LIST.LOC | S2N | RES | CORE_ENRICHMENT |
|---|---|---|---|---|---|---|---|
| 1 | PRKCG | PRKCG | PRKCG | 86 | 0.82 | 0.17 | YES |
| 2 | CAMK4 | CAMK4 | CAMK4 | 379 | 0.49 | 0.26 | YES |
| 3 | PRKCB | PRKCB | PRKCB | 576 | 0.4 | 0.34 | YES |
| 4 | AKAP5 | AKAP5 | AKAP5 | 667 | 0.37 | 0.42 | YES |
| 5 | PRKCZ | PRKCZ | PRKCZ | 979 | 0.29 | 0.46 | YES |
| 6 | RCAN2 | RCAN2 | RCAN2 | 1196 | 0.26 | 0.51 | YES |
| 7 | PRKCE | PRKCE | PRKCE | 2224 | 0.16 | 0.48 | YES |
| 8 | BCL2 | BCL2 | BCL2 | 3703 | 0.096 | 0.42 | YES |
| 9 | PPP3CB | PPP3CB | PPP3CB | 3935 | 0.088 | 0.43 | YES |
| 10 | PRKCA | PRKCA | PRKCA | 3986 | 0.087 | 0.45 | YES |
| 11 | NFATC2 | NFATC2 | NFATC2 | 3992 | 0.087 | 0.47 | YES |
| 12 | PPP3CA | PPP3CA | PPP3CA | 4465 | 0.074 | 0.46 | YES |
| 13 | PPP3R1 | PPP3R1 | PPP3R1 | 4511 | 0.073 | 0.47 | YES |
| 14 | PRKCQ | PRKCQ | PRKCQ | 4542 | 0.072 | 0.48 | YES |
| 15 | MEF2D | MEF2D | MEF2D | 4688 | 0.069 | 0.49 | YES |
| 16 | PRKCD | PRKCD | PRKCD | 4774 | 0.067 | 0.5 | YES |
| 17 | YWHAH | YWHAH | YWHAH | 4805 | 0.066 | 0.51 | YES |
| 18 | MAPK9 | MAPK9 | MAPK9 | 5530 | 0.052 | 0.48 | NO |
| 19 | MAPK3 | MAPK3 | MAPK3 | 5591 | 0.051 | 0.49 | NO |
| 20 | PRKCH | PRKCH | PRKCH | 6170 | 0.041 | 0.47 | NO |
| 21 | FKBP8 | FKBP8 | FKBP8 | 6568 | 0.036 | 0.46 | NO |
| 22 | CREBBP | CREBBP | CREBBP | 6652 | 0.035 | 0.46 | NO |
| 23 | CHP | CHP | CHP | 6725 | 0.034 | 0.46 | NO |
| 24 | YWHAB | YWHAB | YWHAB | 7180 | 0.028 | 0.44 | NO |
| 25 | YWHAG | YWHAG | YWHAG | 7301 | 0.026 | 0.44 | NO |
| 26 | MAP3K1 | MAP3K1 | MAP3K1 | 7315 | 0.026 | 0.45 | NO |
| 27 | NR4A1 | NR4A1 | NR4A1 | 7815 | 0.02 | 0.42 | NO |
| 28 | NFATC1 | NFATC1 | NFATC1 | 8342 | 0.014 | 0.4 | NO |
| 29 | SFN | SFN | SFN | 8404 | 0.013 | 0.4 | NO |
| 30 | PRKACA | PRKACA | PRKACA | 8454 | 0.013 | 0.4 | NO |
| 31 | GSK3B | GSK3B | GSK3B | 8842 | 0.0088 | 0.38 | NO |
| 32 | CABIN1 | CABIN1 | CABIN1 | 8978 | 0.0074 | 0.37 | NO |
| 33 | NUP214 | NUP214 | NUP214 | 8984 | 0.0074 | 0.37 | NO |
| 34 | NFATC3 | NFATC3 | NFATC3 | 9356 | 0.0036 | 0.35 | NO |
| 35 | CSNK2A1 | CSNK2A1 | CSNK2A1 | 9647 | 0.00097 | 0.34 | NO |
| 36 | BCL2L1 | BCL2L1 | BCL2L1 | 10080 | -0.0031 | 0.32 | NO |
| 37 | YWHAZ | YWHAZ | YWHAZ | 10456 | -0.0068 | 0.3 | NO |
| 38 | PIM1 | PIM1 | PIM1 | 10471 | -0.007 | 0.3 | NO |
| 39 | EP300 | EP300 | EP300 | 10585 | -0.0081 | 0.29 | NO |
| 40 | YWHAE | YWHAE | YWHAE | 11033 | -0.012 | 0.27 | NO |
| 41 | FKBP1A | FKBP1A | FKBP1A | 11216 | -0.014 | 0.26 | NO |
| 42 | KPNB1 | KPNB1 | KPNB1 | 11250 | -0.014 | 0.26 | NO |
| 43 | BAD | BAD | BAD | 11291 | -0.015 | 0.27 | NO |
| 44 | YWHAQ | YWHAQ | YWHAQ | 11358 | -0.016 | 0.26 | NO |
| 45 | MAPK8 | MAPK8 | MAPK8 | 11395 | -0.016 | 0.27 | NO |
| 46 | XPO1 | XPO1 | XPO1 | 12253 | -0.024 | 0.22 | NO |
| 47 | MAPK14 | MAPK14 | MAPK14 | 12406 | -0.026 | 0.22 | NO |
| 48 | CSNK1A1 | CSNK1A1 | CSNK1A1 | 12868 | -0.031 | 0.2 | NO |
| 49 | CASP3 | CASP3 | CASP3 | 12984 | -0.032 | 0.2 | NO |
| 50 | RAN | RAN | RAN | 13972 | -0.044 | 0.16 | NO |
| 51 | BAX | BAX | BAX | 14456 | -0.05 | 0.14 | NO |
| 52 | KPNA2 | KPNA2 | KPNA2 | 16103 | -0.084 | 0.071 | NO |
| 53 | RCAN1 | RCAN1 | RCAN1 | 16110 | -0.084 | 0.089 | NO |
| 54 | MAP3K8 | MAP3K8 | MAP3K8 | 16840 | -0.12 | 0.074 | NO |
Figure S59. Get High-res Image This plot shows mRNAseq_cNMF expression data heatmap (on the left) a RunningEnrichmentScore(RES) plot (on the top right) and a Signal2Noise(S2N) plot (on the bottom right) of genes in the pathway: KEGG NEUROACTIVE LIGAND RECEPTOR INTERACTION.
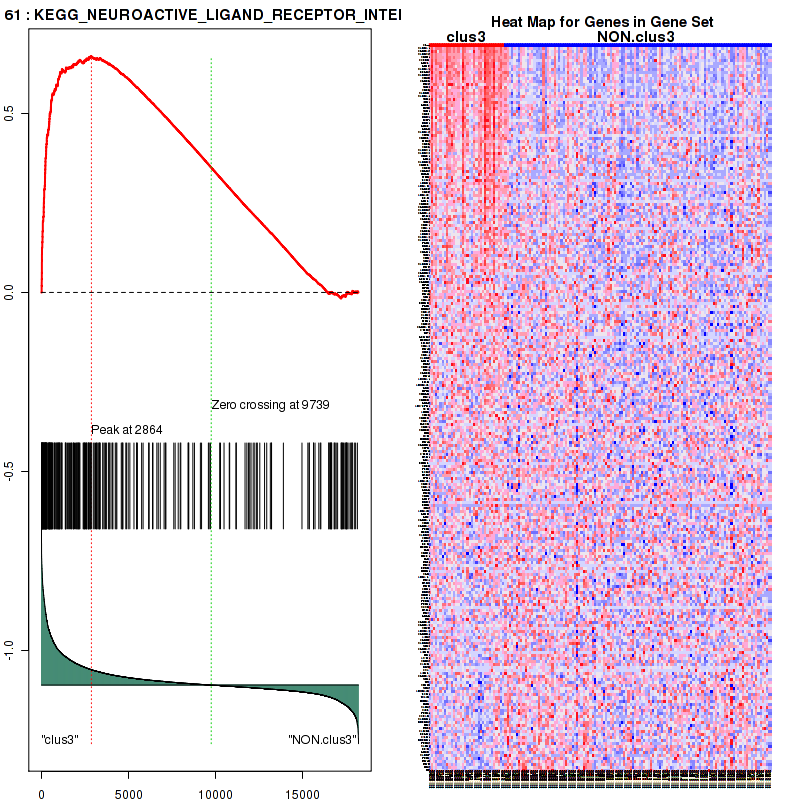
Figure S60. Get High-res Image For the top 5 core enriched genes in the pathway: KEGG NEUROACTIVE LIGAND RECEPTOR INTERACTION, this volcano plot shows how much they are up/down-regulated and significant. The significance was calculated by empirical bayesian fit
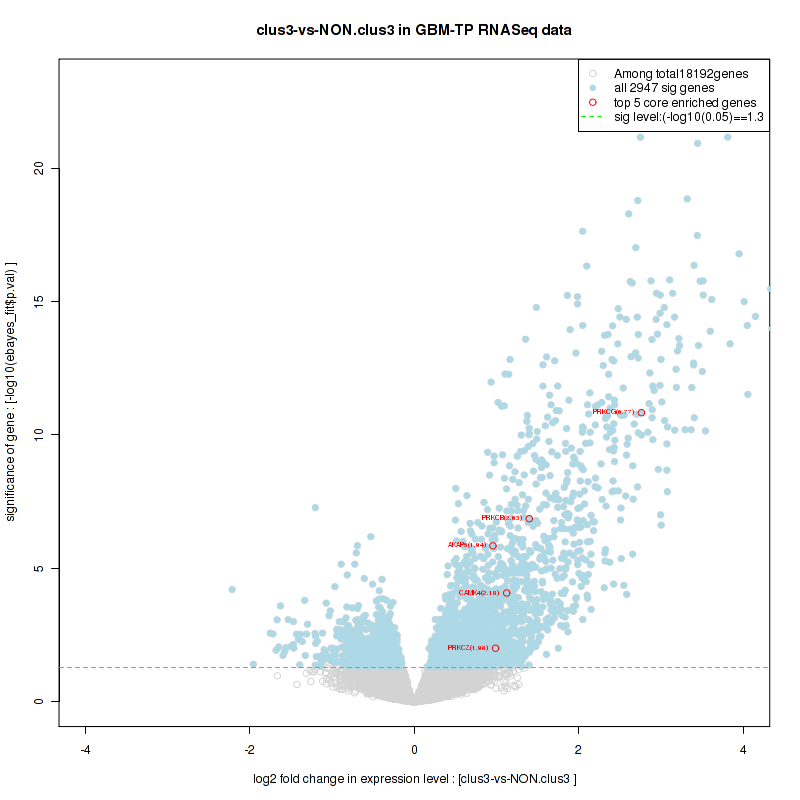
For the top enriched genes, if you want to check whether they are
-
up-regulated, please check the list of up-regulated genes
-
down-regulated, please check the list of down-regulated genes
For the top enriched genes, if you want to check whether they are
-
highly expressed genes, please check the list of high (top 30%) expressed genes
-
low expressed genes, please check the list of low (bottom 30%) expressed genes
An expression pattern of top(30%)/middle(30%)/low(30%) in this subtype against other subtypes is available in a heatmap
For the top enriched genes, if you want to check whether they are
-
significantly differently expressed genes by eBayes lm fit, please check the list of significant genes
-
Gene set database = c2.cp.v4.0.symbols.gmt
-
Expression data file = GBM-TP.uncv2.mRNAseq_RSEM_normalized_log2.txt
-
Phenotype data file = GBM-TP.mergedcluster.txt
For the Gene Set Enrichment Analysis (GSEA), Broad GSEA-P-R.1.0 version is used with class2: canonical pathways geneses from MSigDB. Further details about statistics are available inThe Broad GSEA website.
In addition to the links below, the full results of the analysis summarized in this report can also be downloaded programmatically using firehose_get, or interactively from either the Broad GDAC website or TCGA Data Coordination Center Portal.