This pipeline performs Gene Set Enrichment Analysis (GSEA) using The Broad Institute GSEA tool with MSigDB - Class2: Canonical Pathways gene sets. For a given phenotype subtype, it shows what pathways are significantly enriched in each subtype by comparing gene expression profiles between subtypes. Here, the phenotype is mRNAseq_cNMF subtypes having more than three samples and the input expression file "TGCT-TP.uncv2.mRNAseq_RSEM_normalized_log2.txt" is generated in the pipeline mRNAseq_Preprocess in the stddata run. This pipeline has the following features:
-
For each subtype, calculates enrichment scores (ES) using signal to noise (S2N) that checks similarity between subtypes in expression level then calculates p values through permutation test.
-
Lists pathways significantly enriched in each phenotype subtype and their enrichment scores (ES).
-
Lists top 20 core genes enriched in each significant gene set and their enrichment scores (ES).
-
Checks if the top core genes are up-regulated or down-regulated.
-
Checks if the top core genes are high expressed or low expressed.
-
Checks if the top core genes are significantly differently expressed genes.
Table 1. Get Full Table basic data info
| basic data info |
|---|
| Number of Gene Sets: 731 |
| Number of samples: 150 |
| Original number of Gene Sets: 1320 |
| Maximum gene set size: 933 |
Table 2. Get Full Table pheno data info
| phenotype info |
|---|
| pheno.type: 1 - 7 :[ clus1 ] 34 |
| pheno.type: 2 - 7 :[ clus2 ] 30 |
| pheno.type: 3 - 7 :[ clus3 ] 33 |
| pheno.type: 4 - 7 :[ clus4 ] 22 |
| pheno.type: 5 - 7 :[ clus5 ] 8 |
| pheno.type: 6 - 7 :[ clus6 ] 22 |
| pheno.type: 7 - 7 :[ clus7 ] 1 |
For the expression subtypes of 19071 genes in 151 samples, GSEA found enriched gene sets in each cluster using 150 gene sets in MSigDB canonical pathways. Top enriched gene sets are listed as below.
-
clus1
-
Top enriched gene sets are KEGG CYTOSOLIC DNA SENSING PATHWAY, KEGG T CELL RECEPTOR SIGNALING PATHWAY, KEGG AUTOIMMUNE THYROID DISEASE, KEGG ALLOGRAFT REJECTION, ST T CELL SIGNAL TRANSDUCTION, PID ATM PATHWAY, PID PI3KCIPATHWAY, PID IFNGPATHWAY, PID IL23PATHWAY, PID IL8CXCR2 PATHWAY
-
And common core enriched genes are PIK3R3, CSF2, CSF2RA, CSF2RB, GAB2, IL2, IL2RA, IL2RB, IL2RG, IL3RA
-
clus2
-
Top enriched gene sets are KEGG HOMOLOGOUS RECOMBINATION, PID BARD1PATHWAY, REACTOME FORMATION OF THE TERNARY COMPLEX AND SUBSEQUENTLY THE 43S COMPLEX, REACTOME MEIOSIS, REACTOME ACTIVATION OF THE MRNA UPON BINDING OF THE CAP BINDING COMPLEX AND EIFS AND SUBSEQUENT BINDING TO 43S, REACTOME GENERIC TRANSCRIPTION PATHWAY, REACTOME RNA POL I TRANSCRIPTION, REACTOME RNA POL III TRANSCRIPTION, REACTOME OLFACTORY SIGNALING PATHWAY, REACTOME 3 UTR MEDIATED TRANSLATIONAL REGULATION
-
And common core enriched genes are HIST1H2AB, HIST1H2AC, HIST1H2AD, HIST1H2AE, HIST1H2AJ, HIST1H2BA, HIST1H2BB, HIST1H2BC, HIST1H2BD, HIST1H2BE
-
clus3
-
Top enriched gene sets are KEGG CITRATE CYCLE TCA CYCLE, KEGG SELENOAMINO ACID METABOLISM, KEGG RNA DEGRADATION, KEGG RNA POLYMERASE, KEGG SPLICEOSOME, KEGG HUNTINGTONS DISEASE, BIOCARTA MPR PATHWAY, PID HIF2PATHWAY, PID MYC ACTIVPATHWAY, REACTOME TRANSLATION
-
And common core enriched genes are EXOSC1, EXOSC2, EXOSC3, EXOSC4, EXOSC7, EXOSC8, EXOSC9, KHSRP, PARN, ASNS
-
clus4
-
Top enriched gene sets are KEGG LONG TERM POTENTIATION, KEGG NEUROTROPHIN SIGNALING PATHWAY, BIOCARTA AGR PATHWAY, BIOCARTA AT1R PATHWAY, SIG REGULATION OF THE ACTIN CYTOSKELETON BY RHO GTPASES, PID ENDOTHELINPATHWAY, PID NOTCH PATHWAY, PID EPHBFWDPATHWAY, PID PS1PATHWAY, PID P75NTRPATHWAY
-
And common core enriched genes are JUN, EGFR, CCND1, EIF2C4, MAML2, MAML3, MAMLD1, NOTCH2, NOTCH3, NOTCH4
-
clus5
-
Top enriched gene sets are KEGG GLYCOLYSIS GLUCONEOGENESIS, KEGG OXIDATIVE PHOSPHORYLATION, KEGG GLUTATHIONE METABOLISM, KEGG ETHER LIPID METABOLISM, KEGG PYRUVATE METABOLISM, KEGG PROPANOATE METABOLISM, KEGG VASOPRESSIN REGULATED WATER REABSORPTION, KEGG PARKINSONS DISEASE, KEGG PRION DISEASES, KEGG PATHOGENIC ESCHERICHIA COLI INFECTION
-
And common core enriched genes are ATP5C1, ATP5D, ATP5E, ATP5F1, ATP5G3, ATP5H, ATP5O, COX4I1, COX4I2, COX5A
-
clus6
-
Top enriched gene sets are KEGG ALANINE ASPARTATE AND GLUTAMATE METABOLISM, KEGG VALINE LEUCINE AND ISOLEUCINE DEGRADATION, KEGG GLYCOSYLPHOSPHATIDYLINOSITOL GPI ANCHOR BIOSYNTHESIS, KEGG PPAR SIGNALING PATHWAY, KEGG PEROXISOME, ST WNT BETA CATENIN PATHWAY, PID HNF3BPATHWAY, PID P75NTRPATHWAY, PID SYNDECAN 4 PATHWAY, REACTOME PTM GAMMA CARBOXYLATION HYPUSINE FORMATION AND ARYLSULFATASE ACTIVATION
-
And common core enriched genes are F2, ABAT, ACAA1, ACAA2, ACAD8, ACADSB, ACAT1, ALDH1B1, ALDH2, ALDH3A2
Table 3. Get Full Table This table shows top 10 pathways which are significantly enriched in cluster clus1. It displays only significant gene sets satisfying nom.p.val.threshold (-1), fwer.p.val.threshold (-1) , fdr.q.val.threshold (0.25) and the default table is sorted by Normalized Enrichment Score (NES). Further details on NES statistics, please visit The Broad GSEA website.
| GeneSet(GS) | Size(#genes) | genes.ES.table | ES | NES | NOM.p.val | FDR.q.val | FWER.p.val | Tag.. | Gene.. | Signal | FDR..median. | glob.p.val |
|---|---|---|---|---|---|---|---|---|---|---|---|---|
| KEGG CYTOSOLIC DNA SENSING PATHWAY | 43 | genes.ES.table | 0.64 | 1.5 | 0.089 | 1 | 0.96 | 0.46 | 0.21 | 0.37 | 1 | 0.78 |
| KEGG T CELL RECEPTOR SIGNALING PATHWAY | 108 | genes.ES.table | 0.51 | 1.4 | 0.17 | 1 | 0.99 | 0.32 | 0.11 | 0.28 | 1 | 0.57 |
| KEGG AUTOIMMUNE THYROID DISEASE | 37 | genes.ES.table | 0.71 | 1.4 | 0.14 | 1 | 0.99 | 0.81 | 0.2 | 0.65 | 1 | 0.56 |
| KEGG ALLOGRAFT REJECTION | 35 | genes.ES.table | 0.73 | 1.3 | 0.18 | 1 | 1 | 0.77 | 0.19 | 0.63 | 1 | 0.6 |
| ST T CELL SIGNAL TRANSDUCTION | 44 | genes.ES.table | 0.56 | 1.4 | 0.13 | 1 | 0.98 | 0.36 | 0.1 | 0.33 | 1 | 0.72 |
| PID ATM PATHWAY | 34 | genes.ES.table | 0.4 | 1.4 | 0.18 | 1 | 1 | 0.65 | 0.38 | 0.4 | 1 | 0.6 |
| PID PI3KCIPATHWAY | 49 | genes.ES.table | 0.52 | 1.4 | 0.2 | 1 | 0.99 | 0.39 | 0.22 | 0.3 | 1 | 0.53 |
| PID IFNGPATHWAY | 40 | genes.ES.table | 0.43 | 1.5 | 0.13 | 1 | 0.98 | 0.3 | 0.19 | 0.24 | 1 | 0.74 |
| PID IL23PATHWAY | 36 | genes.ES.table | 0.67 | 1.4 | 0.095 | 1 | 0.98 | 0.5 | 0.14 | 0.43 | 1 | 0.68 |
| PID IL8CXCR2 PATHWAY | 34 | genes.ES.table | 0.53 | 1.4 | 0.14 | 1 | 0.99 | 0.32 | 0.12 | 0.28 | 1 | 0.6 |
Table S1. Get Full Table This table shows a Running Enrichment Score (RES) of each gene in this pathway, that is, the enrichment score at this point in the ranked list of genes. All genes are ranked by Signal-to-Noise (S2N), a measure of similarity as default and are used to obtain ES matrix of all genes. In this way, GSEA tool uses expression pattern of not only overlapped genes but also not-overlapped genes to produce ES matrix.
| Rank | GENE | SYMBOL | DESC | LIST.LOC | S2N | RES | CORE_ENRICHMENT |
|---|---|---|---|---|---|---|---|
| 1 | CSF2 | CSF2 | CSF2 | 328 | 0.63 | 0.083 | YES |
| 2 | IL2RA | IL2RA | IL2RA | 666 | 0.51 | 0.15 | YES |
| 3 | CSF2RB | CSF2RB | CSF2RB | 744 | 0.49 | 0.22 | YES |
| 4 | IL2 | IL2 | IL2 | 923 | 0.45 | 0.28 | YES |
| 5 | PIK3CD | PIK3CD | PIK3CD | 989 | 0.43 | 0.34 | YES |
| 6 | IL2RG | IL2RG | IL2RG | 1067 | 0.41 | 0.41 | YES |
| 7 | GAB2 | GAB2 | GAB2 | 1252 | 0.38 | 0.46 | YES |
| 8 | PIK3R3 | PIK3R3 | PIK3R3 | 1335 | 0.37 | 0.51 | YES |
| 9 | IL2RB | IL2RB | IL2RB | 1937 | 0.29 | 0.53 | YES |
| 10 | JAK3 | JAK3 | JAK3 | 2100 | 0.27 | 0.56 | YES |
| 11 | CSF2RA | CSF2RA | CSF2RA | 2179 | 0.26 | 0.6 | YES |
| 12 | JAK2 | JAK2 | JAK2 | 2468 | 0.24 | 0.62 | YES |
| 13 | IL3RA | IL3RA | IL3RA | 2627 | 0.22 | 0.65 | YES |
| 14 | IL5 | IL5 | IL5 | 2684 | 0.22 | 0.68 | YES |
| 15 | JAK1 | JAK1 | JAK1 | 4654 | 0.12 | 0.59 | NO |
| 16 | IL3 | IL3 | IL3 | 4717 | 0.11 | 0.61 | NO |
| 17 | SOS1 | SOS1 | SOS1 | 5109 | 0.098 | 0.6 | NO |
| 18 | PTPN6 | PTPN6 | PTPN6 | 5159 | 0.097 | 0.62 | NO |
| 19 | PIK3R2 | PIK3R2 | PIK3R2 | 5400 | 0.089 | 0.62 | NO |
| 20 | INPPL1 | INPPL1 | INPPL1 | 7174 | 0.04 | 0.53 | NO |
| 21 | PIK3R1 | PIK3R1 | PIK3R1 | 8082 | 0.018 | 0.48 | NO |
| 22 | PIK3CB | PIK3CB | PIK3CB | 9588 | -0.018 | 0.41 | NO |
| 23 | GRB2 | GRB2 | GRB2 | 9946 | -0.027 | 0.39 | NO |
| 24 | PIK3CA | PIK3CA | PIK3CA | 10184 | -0.032 | 0.39 | NO |
| 25 | IL5RA | IL5RA | IL5RA | 13315 | -0.13 | 0.24 | NO |
| 26 | HRAS | HRAS | HRAS | 14393 | -0.18 | 0.21 | NO |
| 27 | SHC1 | SHC1 | SHC1 | 14614 | -0.19 | 0.23 | NO |
Figure S1. Get High-res Image This plot shows mRNAseq_cNMF expression data heatmap (on the left) a RunningEnrichmentScore(RES) plot (on the top right) and a Signal2Noise(S2N) plot (on the bottom right) of genes in the pathway: KEGG CYTOSOLIC DNA SENSING PATHWAY.
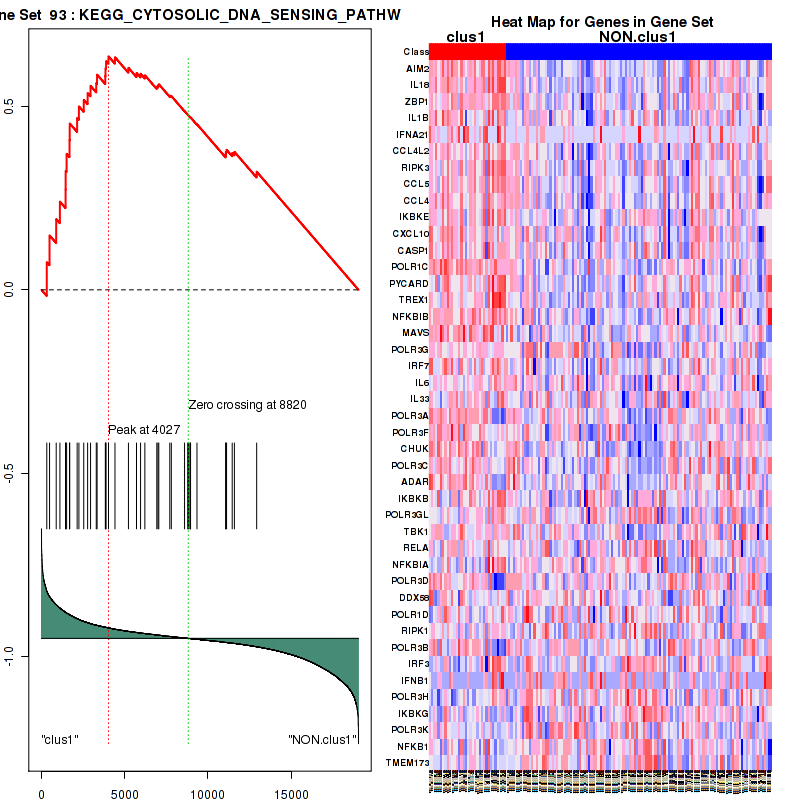
Figure S2. Get High-res Image For the top 5 core enriched genes in the pathway: KEGG CYTOSOLIC DNA SENSING PATHWAY, this volcano plot shows how much they are up/down-regulated and significant. The significance was calculated by empirical bayesian fit

Table S2. Get Full Table This table shows a Running Enrichment Score (RES) of each gene in this pathway, that is, the enrichment score at this point in the ranked list of genes. All genes are ranked by Signal-to-Noise (S2N), a measure of similarity as default and are used to obtain ES matrix of all genes. In this way, GSEA tool uses expression pattern of not only overlapped genes but also not-overlapped genes to produce ES matrix.
| Rank | GENE | SYMBOL | DESC | LIST.LOC | S2N | RES | CORE_ENRICHMENT |
|---|---|---|---|---|---|---|---|
| 1 | CSF2 | CSF2 | CSF2 | 328 | 0.63 | 0.054 | YES |
| 2 | IL2RA | IL2RA | IL2RA | 666 | 0.51 | 0.093 | YES |
| 3 | CSF2RB | CSF2RB | CSF2RB | 744 | 0.49 | 0.14 | YES |
| 4 | IL2 | IL2 | IL2 | 923 | 0.45 | 0.18 | YES |
| 5 | PIK3CD | PIK3CD | PIK3CD | 989 | 0.43 | 0.23 | YES |
| 6 | IL2RG | IL2RG | IL2RG | 1067 | 0.41 | 0.27 | YES |
| 7 | GAB2 | GAB2 | GAB2 | 1252 | 0.38 | 0.3 | YES |
| 8 | TEC | TEC | TEC | 1295 | 0.38 | 0.34 | YES |
| 9 | HCK | HCK | HCK | 1310 | 0.38 | 0.39 | YES |
| 10 | PIK3R3 | PIK3R3 | PIK3R3 | 1335 | 0.37 | 0.43 | YES |
| 11 | CBL | CBL | CBL | 1731 | 0.31 | 0.44 | YES |
| 12 | VAV1 | VAV1 | VAV1 | 1750 | 0.31 | 0.48 | YES |
| 13 | IL2RB | IL2RB | IL2RB | 1937 | 0.29 | 0.5 | YES |
| 14 | JAK3 | JAK3 | JAK3 | 2100 | 0.27 | 0.52 | YES |
| 15 | CSF2RA | CSF2RA | CSF2RA | 2179 | 0.26 | 0.55 | YES |
| 16 | BLNK | BLNK | BLNK | 2446 | 0.24 | 0.56 | YES |
| 17 | JAK2 | JAK2 | JAK2 | 2468 | 0.24 | 0.58 | YES |
| 18 | IL3RA | IL3RA | IL3RA | 2627 | 0.22 | 0.6 | YES |
| 19 | IL5 | IL5 | IL5 | 2684 | 0.22 | 0.62 | YES |
| 20 | STAT5A | STAT5A | STAT5A | 3932 | 0.15 | 0.57 | NO |
| 21 | SYK | SYK | SYK | 4158 | 0.14 | 0.58 | NO |
| 22 | CRK | CRK | CRK | 4509 | 0.12 | 0.57 | NO |
| 23 | JAK1 | JAK1 | JAK1 | 4654 | 0.12 | 0.58 | NO |
| 24 | IL3 | IL3 | IL3 | 4717 | 0.11 | 0.58 | NO |
| 25 | STAT5B | STAT5B | STAT5B | 4776 | 0.11 | 0.6 | NO |
| 26 | SOS1 | SOS1 | SOS1 | 5109 | 0.098 | 0.59 | NO |
| 27 | PTPN6 | PTPN6 | PTPN6 | 5159 | 0.097 | 0.6 | NO |
| 28 | PIK3R2 | PIK3R2 | PIK3R2 | 5400 | 0.089 | 0.59 | NO |
| 29 | INPPL1 | INPPL1 | INPPL1 | 7174 | 0.04 | 0.5 | NO |
| 30 | LYN | LYN | LYN | 7362 | 0.034 | 0.5 | NO |
| 31 | RAPGEF1 | RAPGEF1 | RAPGEF1 | 7499 | 0.031 | 0.5 | NO |
| 32 | FYN | FYN | FYN | 7696 | 0.027 | 0.49 | NO |
| 33 | PIK3R1 | PIK3R1 | PIK3R1 | 8082 | 0.018 | 0.47 | NO |
| 34 | PIK3CB | PIK3CB | PIK3CB | 9588 | -0.018 | 0.39 | NO |
| 35 | GRB2 | GRB2 | GRB2 | 9946 | -0.027 | 0.38 | NO |
| 36 | PIK3CA | PIK3CA | PIK3CA | 10184 | -0.032 | 0.37 | NO |
| 37 | PRKACB | PRKACB | PRKACB | 10671 | -0.043 | 0.35 | NO |
| 38 | YWHAZ | YWHAZ | YWHAZ | 11816 | -0.074 | 0.3 | NO |
| 39 | CRKL | CRKL | CRKL | 12707 | -0.1 | 0.26 | NO |
| 40 | IL5RA | IL5RA | IL5RA | 13315 | -0.13 | 0.24 | NO |
| 41 | YES1 | YES1 | YES1 | 13789 | -0.15 | 0.24 | NO |
| 42 | HRAS | HRAS | HRAS | 14393 | -0.18 | 0.22 | NO |
| 43 | SHC1 | SHC1 | SHC1 | 14614 | -0.19 | 0.23 | NO |
Figure S3. Get High-res Image This plot shows mRNAseq_cNMF expression data heatmap (on the left) a RunningEnrichmentScore(RES) plot (on the top right) and a Signal2Noise(S2N) plot (on the bottom right) of genes in the pathway: KEGG T CELL RECEPTOR SIGNALING PATHWAY.

Figure S4. Get High-res Image For the top 5 core enriched genes in the pathway: KEGG T CELL RECEPTOR SIGNALING PATHWAY, this volcano plot shows how much they are up/down-regulated and significant. The significance was calculated by empirical bayesian fit

Table S3. Get Full Table This table shows a Running Enrichment Score (RES) of each gene in this pathway, that is, the enrichment score at this point in the ranked list of genes. All genes are ranked by Signal-to-Noise (S2N), a measure of similarity as default and are used to obtain ES matrix of all genes. In this way, GSEA tool uses expression pattern of not only overlapped genes but also not-overlapped genes to produce ES matrix.
| Rank | GENE | SYMBOL | DESC | LIST.LOC | S2N | RES | CORE_ENRICHMENT |
|---|---|---|---|---|---|---|---|
| 1 | AIM2 | AIM2 | AIM2 | 319 | 0.64 | 0.076 | YES |
| 2 | IL18 | IL18 | IL18 | 485 | 0.56 | 0.15 | YES |
| 3 | ZBP1 | ZBP1 | ZBP1 | 886 | 0.45 | 0.19 | YES |
| 4 | IL1B | IL1B | IL1B | 1107 | 0.41 | 0.24 | YES |
| 5 | IFNA21 | IFNA21 | IFNA21 | 1449 | 0.35 | 0.27 | YES |
| 6 | CCL4L2 | CCL4L2 | CCL4L2 | 1454 | 0.35 | 0.32 | YES |
| 7 | RIPK3 | RIPK3 | RIPK3 | 1511 | 0.34 | 0.37 | YES |
| 8 | CCL5 | CCL5 | CCL5 | 1686 | 0.32 | 0.41 | YES |
| 9 | CCL4 | CCL4 | CCL4 | 1699 | 0.32 | 0.45 | YES |
| 10 | IKBKE | IKBKE | IKBKE | 2144 | 0.27 | 0.47 | YES |
| 11 | CXCL10 | CXCL10 | CXCL10 | 2250 | 0.26 | 0.5 | YES |
| 12 | CASP1 | CASP1 | CASP1 | 2541 | 0.23 | 0.52 | YES |
| 13 | POLR1C | POLR1C | POLR1C | 2774 | 0.21 | 0.54 | YES |
| 14 | PYCARD | PYCARD | PYCARD | 2949 | 0.2 | 0.56 | YES |
| 15 | TREX1 | TREX1 | TREX1 | 3293 | 0.18 | 0.56 | YES |
| 16 | NFKBIB | NFKBIB | NFKBIB | 3341 | 0.18 | 0.59 | YES |
| 17 | MAVS | MAVS | MAVS | 3836 | 0.15 | 0.58 | YES |
| 18 | POLR3G | POLR3G | POLR3G | 3848 | 0.15 | 0.6 | YES |
| 19 | IRF7 | IRF7 | IRF7 | 3884 | 0.15 | 0.62 | YES |
| 20 | IL6 | IL6 | IL6 | 4027 | 0.14 | 0.64 | YES |
| 21 | IL33 | IL33 | IL33 | 4416 | 0.12 | 0.63 | NO |
| 22 | POLR3A | POLR3A | POLR3A | 5225 | 0.094 | 0.6 | NO |
| 23 | POLR3F | POLR3F | POLR3F | 5712 | 0.08 | 0.59 | NO |
| 24 | CHUK | CHUK | CHUK | 5954 | 0.073 | 0.59 | NO |
| 25 | POLR3C | POLR3C | POLR3C | 6212 | 0.065 | 0.58 | NO |
| 26 | ADAR | ADAR | ADAR | 6930 | 0.046 | 0.55 | NO |
| 27 | IKBKB | IKBKB | IKBKB | 7000 | 0.045 | 0.56 | NO |
| 28 | POLR3GL | POLR3GL | POLR3GL | 7050 | 0.043 | 0.56 | NO |
| 29 | TBK1 | TBK1 | TBK1 | 7710 | 0.026 | 0.53 | NO |
| 30 | RELA | RELA | RELA | 7802 | 0.024 | 0.53 | NO |
| 31 | NFKBIA | NFKBIA | NFKBIA | 8597 | 0.0051 | 0.49 | NO |
| 32 | POLR3D | POLR3D | POLR3D | 8785 | 0.00086 | 0.48 | NO |
| 33 | DDX58 | DDX58 | DDX58 | 8838 | -0.00043 | 0.48 | NO |
| 34 | POLR1D | POLR1D | POLR1D | 8919 | -0.0023 | 0.47 | NO |
| 35 | RIPK1 | RIPK1 | RIPK1 | 8953 | -0.0029 | 0.47 | NO |
| 36 | POLR3B | POLR3B | POLR3B | 8959 | -0.003 | 0.47 | NO |
| 37 | IRF3 | IRF3 | IRF3 | 9344 | -0.012 | 0.45 | NO |
| 38 | IFNB1 | IFNB1 | IFNB1 | 11071 | -0.054 | 0.37 | NO |
| 39 | POLR3H | POLR3H | POLR3H | 11076 | -0.054 | 0.38 | NO |
| 40 | IKBKG | IKBKG | IKBKG | 11121 | -0.056 | 0.38 | NO |
| 41 | POLR3K | POLR3K | POLR3K | 11461 | -0.064 | 0.37 | NO |
| 42 | NFKB1 | NFKB1 | NFKB1 | 11593 | -0.068 | 0.38 | NO |
| 43 | TMEM173 | TMEM173 | TMEM173 | 12930 | -0.11 | 0.32 | NO |
Figure S5. Get High-res Image This plot shows mRNAseq_cNMF expression data heatmap (on the left) a RunningEnrichmentScore(RES) plot (on the top right) and a Signal2Noise(S2N) plot (on the bottom right) of genes in the pathway: KEGG AUTOIMMUNE THYROID DISEASE.
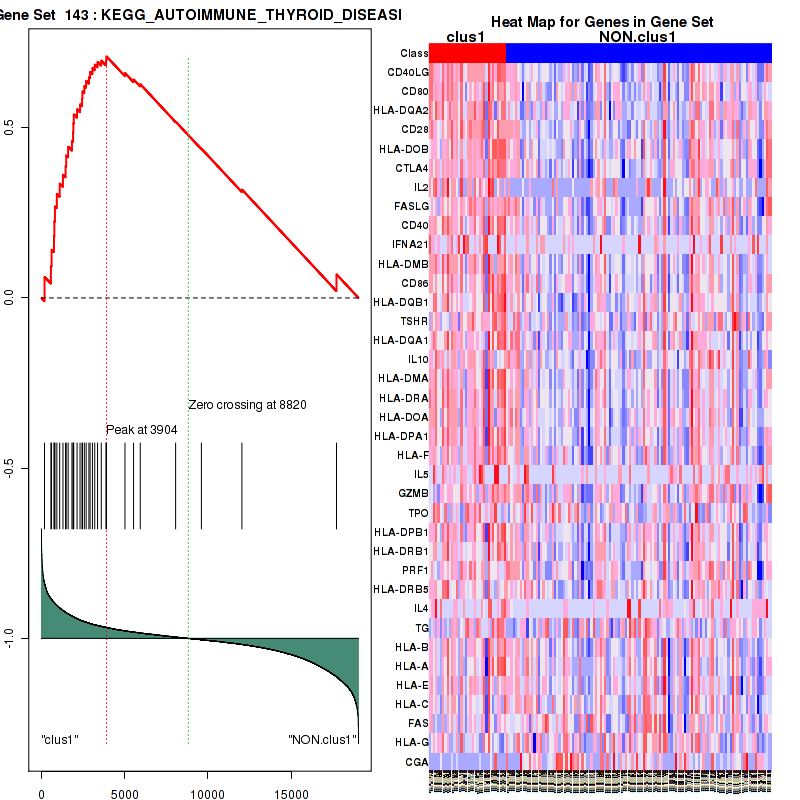
Figure S6. Get High-res Image For the top 5 core enriched genes in the pathway: KEGG AUTOIMMUNE THYROID DISEASE, this volcano plot shows how much they are up/down-regulated and significant. The significance was calculated by empirical bayesian fit

Table S4. Get Full Table This table shows a Running Enrichment Score (RES) of each gene in this pathway, that is, the enrichment score at this point in the ranked list of genes. All genes are ranked by Signal-to-Noise (S2N), a measure of similarity as default and are used to obtain ES matrix of all genes. In this way, GSEA tool uses expression pattern of not only overlapped genes but also not-overlapped genes to produce ES matrix.
| Rank | GENE | SYMBOL | DESC | LIST.LOC | S2N | RES | CORE_ENRICHMENT |
|---|---|---|---|---|---|---|---|
| 1 | CD80 | CD80 | CD80 | 568 | 0.54 | 0.09 | YES |
| 2 | CD28 | CD28 | CD28 | 755 | 0.48 | 0.19 | YES |
| 3 | GRAP2 | GRAP2 | GRAP2 | 1174 | 0.4 | 0.26 | YES |
| 4 | PIK3R3 | PIK3R3 | PIK3R3 | 1335 | 0.37 | 0.33 | YES |
| 5 | MAP3K8 | MAP3K8 | MAP3K8 | 1580 | 0.34 | 0.39 | YES |
| 6 | CD86 | CD86 | CD86 | 1603 | 0.33 | 0.46 | YES |
| 7 | VAV1 | VAV1 | VAV1 | 1750 | 0.31 | 0.53 | YES |
| 8 | LCK | LCK | LCK | 3268 | 0.18 | 0.49 | NO |
| 9 | RICTOR | RICTOR | RICTOR | 3905 | 0.15 | 0.49 | NO |
| 10 | MAP3K14 | MAP3K14 | MAP3K14 | 4727 | 0.11 | 0.47 | NO |
| 11 | TRIB3 | TRIB3 | TRIB3 | 4799 | 0.11 | 0.49 | NO |
| 12 | PIK3R2 | PIK3R2 | PIK3R2 | 5400 | 0.089 | 0.48 | NO |
| 13 | MTOR | MTOR | MTOR | 5870 | 0.075 | 0.47 | NO |
| 14 | LYN | LYN | LYN | 7362 | 0.034 | 0.4 | NO |
| 15 | FYN | FYN | FYN | 7696 | 0.027 | 0.39 | NO |
| 16 | PIK3R1 | PIK3R1 | PIK3R1 | 8082 | 0.018 | 0.37 | NO |
| 17 | AKT2 | AKT2 | AKT2 | 9255 | -0.0099 | 0.31 | NO |
| 18 | RAC1 | RAC1 | RAC1 | 9270 | -0.01 | 0.31 | NO |
| 19 | GRB2 | GRB2 | GRB2 | 9946 | -0.027 | 0.28 | NO |
| 20 | AKT3 | AKT3 | AKT3 | 10036 | -0.029 | 0.28 | NO |
| 21 | PIK3CA | PIK3CA | PIK3CA | 10184 | -0.032 | 0.28 | NO |
| 22 | SRC | SRC | SRC | 10831 | -0.048 | 0.26 | NO |
| 23 | AKT1 | AKT1 | AKT1 | 10865 | -0.049 | 0.27 | NO |
| 24 | MLST8 | MLST8 | MLST8 | 11033 | -0.053 | 0.27 | NO |
| 25 | CDC42 | CDC42 | CDC42 | 11253 | -0.059 | 0.27 | NO |
| 26 | MAPKAP1 | MAPKAP1 | MAPKAP1 | 11670 | -0.07 | 0.27 | NO |
| 27 | PAK2 | PAK2 | PAK2 | 11806 | -0.074 | 0.28 | NO |
| 28 | THEM4 | THEM4 | THEM4 | 12435 | -0.095 | 0.26 | NO |
| 29 | PAK1 | PAK1 | PAK1 | 12688 | -0.1 | 0.28 | NO |
| 30 | PDPK1 | PDPK1 | PDPK1 | 13023 | -0.12 | 0.28 | NO |
| 31 | YES1 | YES1 | YES1 | 13789 | -0.15 | 0.28 | NO |
Figure S7. Get High-res Image This plot shows mRNAseq_cNMF expression data heatmap (on the left) a RunningEnrichmentScore(RES) plot (on the top right) and a Signal2Noise(S2N) plot (on the bottom right) of genes in the pathway: KEGG ALLOGRAFT REJECTION.

Figure S8. Get High-res Image For the top 5 core enriched genes in the pathway: KEGG ALLOGRAFT REJECTION, this volcano plot shows how much they are up/down-regulated and significant. The significance was calculated by empirical bayesian fit
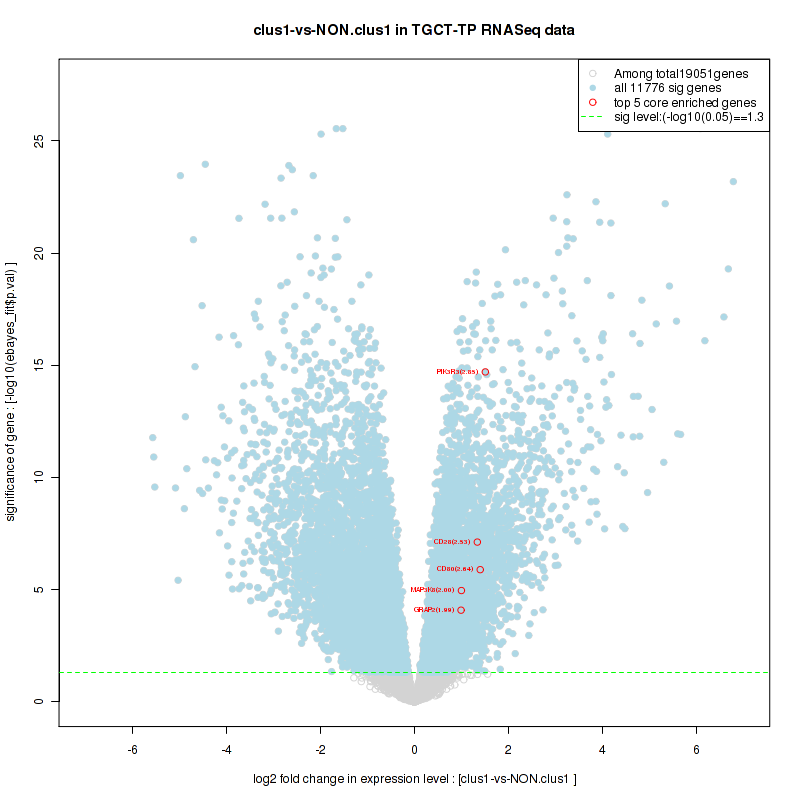
Table S5. Get Full Table This table shows a Running Enrichment Score (RES) of each gene in this pathway, that is, the enrichment score at this point in the ranked list of genes. All genes are ranked by Signal-to-Noise (S2N), a measure of similarity as default and are used to obtain ES matrix of all genes. In this way, GSEA tool uses expression pattern of not only overlapped genes but also not-overlapped genes to produce ES matrix.
| Rank | GENE | SYMBOL | DESC | LIST.LOC | S2N | RES | CORE_ENRICHMENT |
|---|---|---|---|---|---|---|---|
| 1 | TUBA3D | TUBA3D | TUBA3D | 62 | 0.94 | 0.25 | YES |
| 2 | TUBA3C | TUBA3C | TUBA3C | 73 | 0.92 | 0.49 | YES |
| 3 | TUBB3 | TUBB3 | TUBB3 | 4108 | 0.14 | 0.32 | NO |
| 4 | TCP1 | TCP1 | TCP1 | 4733 | 0.11 | 0.32 | NO |
| 5 | CCT2 | CCT2 | CCT2 | 4971 | 0.1 | 0.33 | NO |
| 6 | CCT6A | CCT6A | CCT6A | 5247 | 0.094 | 0.34 | NO |
| 7 | CCT8 | CCT8 | CCT8 | 5508 | 0.086 | 0.35 | NO |
| 8 | PFDN2 | PFDN2 | PFDN2 | 5746 | 0.079 | 0.36 | NO |
| 9 | PFDN1 | PFDN1 | PFDN1 | 7088 | 0.042 | 0.3 | NO |
| 10 | CCT5 | CCT5 | CCT5 | 7406 | 0.033 | 0.29 | NO |
| 11 | CCT3 | CCT3 | CCT3 | 7459 | 0.032 | 0.3 | NO |
| 12 | CCT4 | CCT4 | CCT4 | 7709 | 0.026 | 0.29 | NO |
| 13 | TUBA4A | TUBA4A | TUBA4A | 8642 | 0.0044 | 0.25 | NO |
| 14 | PFDN6 | PFDN6 | PFDN6 | 8646 | 0.0043 | 0.25 | NO |
| 15 | CCT7 | CCT7 | CCT7 | 8900 | -0.0019 | 0.23 | NO |
| 16 | PFDN5 | PFDN5 | PFDN5 | 8981 | -0.0034 | 0.23 | NO |
| 17 | TUBB1 | TUBB1 | TUBB1 | 10081 | -0.03 | 0.18 | NO |
| 18 | TUBA1C | TUBA1C | TUBA1C | 10160 | -0.031 | 0.18 | NO |
| 19 | ACTB | ACTB | ACTB | 10340 | -0.036 | 0.18 | NO |
| 20 | TUBA1A | TUBA1A | TUBA1A | 12272 | -0.089 | 0.11 | NO |
| 21 | PFDN4 | PFDN4 | PFDN4 | 12910 | -0.11 | 0.1 | NO |
| 22 | VBP1 | VBP1 | VBP1 | 13838 | -0.15 | 0.096 | NO |
| 23 | TUBB6 | TUBB6 | TUBB6 | 13946 | -0.16 | 0.13 | NO |
| 24 | TUBB2B | TUBB2B | TUBB2B | 14808 | -0.21 | 0.14 | NO |
| 25 | TUBB2A | TUBB2A | TUBB2A | 15956 | -0.3 | 0.16 | NO |
Figure S9. Get High-res Image This plot shows mRNAseq_cNMF expression data heatmap (on the left) a RunningEnrichmentScore(RES) plot (on the top right) and a Signal2Noise(S2N) plot (on the bottom right) of genes in the pathway: ST T CELL SIGNAL TRANSDUCTION.
Figure S10. Get High-res Image For the top 5 core enriched genes in the pathway: ST T CELL SIGNAL TRANSDUCTION, this volcano plot shows how much they are up/down-regulated and significant. The significance was calculated by empirical bayesian fit
Table S6. Get Full Table This table shows a Running Enrichment Score (RES) of each gene in this pathway, that is, the enrichment score at this point in the ranked list of genes. All genes are ranked by Signal-to-Noise (S2N), a measure of similarity as default and are used to obtain ES matrix of all genes. In this way, GSEA tool uses expression pattern of not only overlapped genes but also not-overlapped genes to produce ES matrix.
| Rank | GENE | SYMBOL | DESC | LIST.LOC | S2N | RES | CORE_ENRICHMENT |
|---|---|---|---|---|---|---|---|
| 1 | IFNG | IFNG | IFNG | 644 | 0.52 | 0.07 | YES |
| 2 | IL1B | IL1B | IL1B | 1107 | 0.41 | 0.13 | YES |
| 3 | CBL | CBL | CBL | 1731 | 0.31 | 0.16 | YES |
| 4 | PIAS1 | PIAS1 | PIAS1 | 2300 | 0.25 | 0.18 | YES |
| 5 | JAK2 | JAK2 | JAK2 | 2468 | 0.24 | 0.22 | YES |
| 6 | CASP1 | CASP1 | CASP1 | 2541 | 0.23 | 0.26 | YES |
| 7 | IRF1 | IRF1 | IRF1 | 2669 | 0.22 | 0.3 | YES |
| 8 | DAPK1 | DAPK1 | DAPK1 | 3089 | 0.19 | 0.32 | YES |
| 9 | STAT1 | STAT1 | STAT1 | 3093 | 0.19 | 0.35 | YES |
| 10 | IRF9 | IRF9 | IRF9 | 3235 | 0.18 | 0.38 | YES |
| 11 | CAMK2G | CAMK2G | CAMK2G | 3342 | 0.18 | 0.41 | YES |
| 12 | IFNGR1 | IFNGR1 | IFNGR1 | 3666 | 0.16 | 0.43 | YES |
| 13 | JAK1 | JAK1 | JAK1 | 4654 | 0.12 | 0.4 | NO |
| 14 | PIAS4 | PIAS4 | PIAS4 | 4999 | 0.1 | 0.4 | NO |
| 15 | MAPK1 | MAPK1 | MAPK1 | 5497 | 0.086 | 0.39 | NO |
| 16 | RAP1B | RAP1B | RAP1B | 5547 | 0.085 | 0.41 | NO |
| 17 | MTOR | MTOR | MTOR | 5870 | 0.075 | 0.41 | NO |
| 18 | MAP3K1 | MAP3K1 | MAP3K1 | 5945 | 0.073 | 0.42 | NO |
| 19 | PTPN2 | PTPN2 | PTPN2 | 6898 | 0.047 | 0.38 | NO |
| 20 | EP300 | EP300 | EP300 | 7177 | 0.04 | 0.37 | NO |
| 21 | RAPGEF1 | RAPGEF1 | RAPGEF1 | 7499 | 0.031 | 0.36 | NO |
| 22 | PRKCD | PRKCD | PRKCD | 7675 | 0.027 | 0.36 | NO |
| 23 | PIK3R1 | PIK3R1 | PIK3R1 | 8082 | 0.018 | 0.34 | NO |
| 24 | CREBBP | CREBBP | CREBBP | 8270 | 0.013 | 0.33 | NO |
| 25 | MAP3K11 | MAP3K11 | MAP3K11 | 8359 | 0.01 | 0.33 | NO |
| 26 | PTGES2 | PTGES2 | PTGES2 | 9087 | -0.0058 | 0.29 | NO |
| 27 | MAP2K1 | MAP2K1 | MAP2K1 | 9247 | -0.0097 | 0.28 | NO |
| 28 | STAT3 | STAT3 | STAT3 | 9399 | -0.014 | 0.28 | NO |
| 29 | SOCS1 | SOCS1 | SOCS1 | 9959 | -0.027 | 0.26 | NO |
| 30 | PIK3CA | PIK3CA | PIK3CA | 10184 | -0.032 | 0.25 | NO |
| 31 | CEBPB | CEBPB | CEBPB | 10298 | -0.034 | 0.25 | NO |
| 32 | AKT1 | AKT1 | AKT1 | 10865 | -0.049 | 0.23 | NO |
| 33 | PTPN11 | PTPN11 | PTPN11 | 11337 | -0.061 | 0.22 | NO |
| 34 | RAP1A | RAP1A | RAP1A | 11551 | -0.067 | 0.22 | NO |
| 35 | CAMK2D | CAMK2D | CAMK2D | 12072 | -0.083 | 0.21 | NO |
| 36 | CAMK2A | CAMK2A | CAMK2A | 12250 | -0.089 | 0.22 | NO |
| 37 | CRKL | CRKL | CRKL | 12707 | -0.1 | 0.22 | NO |
| 38 | MAPK3 | MAPK3 | MAPK3 | 12851 | -0.11 | 0.23 | NO |
| 39 | CAMK2B | CAMK2B | CAMK2B | 15047 | -0.22 | 0.16 | NO |
| 40 | SMAD7 | SMAD7 | SMAD7 | 15375 | -0.25 | 0.19 | NO |
Figure S11. Get High-res Image This plot shows mRNAseq_cNMF expression data heatmap (on the left) a RunningEnrichmentScore(RES) plot (on the top right) and a Signal2Noise(S2N) plot (on the bottom right) of genes in the pathway: PID ATM PATHWAY.

Figure S12. Get High-res Image For the top 5 core enriched genes in the pathway: PID ATM PATHWAY, this volcano plot shows how much they are up/down-regulated and significant. The significance was calculated by empirical bayesian fit
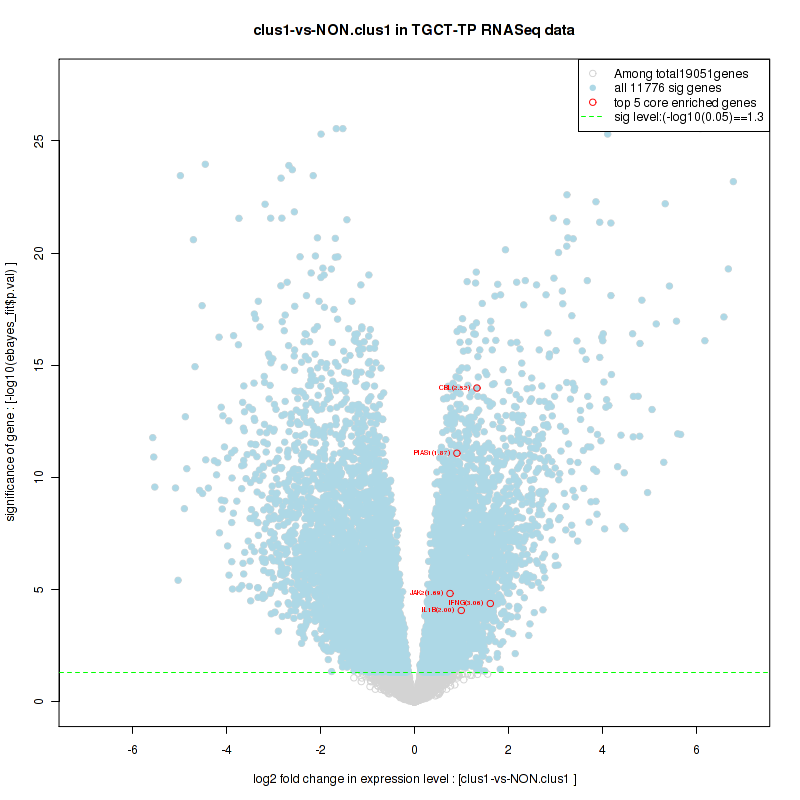
Table S7. Get Full Table This table shows a Running Enrichment Score (RES) of each gene in this pathway, that is, the enrichment score at this point in the ranked list of genes. All genes are ranked by Signal-to-Noise (S2N), a measure of similarity as default and are used to obtain ES matrix of all genes. In this way, GSEA tool uses expression pattern of not only overlapped genes but also not-overlapped genes to produce ES matrix.
| Rank | GENE | SYMBOL | DESC | LIST.LOC | S2N | RES | CORE_ENRICHMENT |
|---|---|---|---|---|---|---|---|
| 1 | CD28 | CD28 | CD28 | 755 | 0.48 | 0.011 | YES |
| 2 | CTLA4 | CTLA4 | CTLA4 | 810 | 0.47 | 0.058 | YES |
| 3 | ITK | ITK | ITK | 826 | 0.47 | 0.1 | YES |
| 4 | RASGRP4 | RASGRP4 | RASGRP4 | 844 | 0.46 | 0.15 | YES |
| 5 | RASGRP2 | RASGRP2 | RASGRP2 | 912 | 0.45 | 0.2 | YES |
| 6 | CD3D | CD3D | CD3D | 940 | 0.44 | 0.24 | YES |
| 7 | ITPKA | ITPKA | ITPKA | 975 | 0.44 | 0.28 | YES |
| 8 | GRAP2 | GRAP2 | GRAP2 | 1174 | 0.4 | 0.32 | YES |
| 9 | PTPRC | PTPRC | PTPRC | 1261 | 0.38 | 0.35 | YES |
| 10 | LCP2 | LCP2 | LCP2 | 1316 | 0.37 | 0.39 | YES |
| 11 | PAK7 | PAK7 | PAK7 | 1373 | 0.36 | 0.42 | YES |
| 12 | RASGRP1 | RASGRP1 | RASGRP1 | 1470 | 0.35 | 0.46 | YES |
| 13 | CBL | CBL | CBL | 1731 | 0.31 | 0.47 | YES |
| 14 | VAV1 | VAV1 | VAV1 | 1750 | 0.31 | 0.51 | YES |
| 15 | ZAP70 | ZAP70 | ZAP70 | 1830 | 0.3 | 0.53 | YES |
| 16 | LAT | LAT | LAT | 1935 | 0.29 | 0.56 | YES |
| 17 | LCK | LCK | LCK | 3268 | 0.18 | 0.51 | NO |
| 18 | NFKBIB | NFKBIB | NFKBIB | 3341 | 0.18 | 0.52 | NO |
| 19 | NFKBIE | NFKBIE | NFKBIE | 3532 | 0.17 | 0.53 | NO |
| 20 | PAK3 | PAK3 | PAK3 | 3739 | 0.16 | 0.53 | NO |
| 21 | FBXW7 | FBXW7 | FBXW7 | 4021 | 0.14 | 0.53 | NO |
| 22 | NCK1 | NCK1 | NCK1 | 4335 | 0.13 | 0.53 | NO |
| 23 | SOS1 | SOS1 | SOS1 | 5109 | 0.098 | 0.5 | NO |
| 24 | CSK | CSK | CSK | 5114 | 0.098 | 0.51 | NO |
| 25 | MAPK1 | MAPK1 | MAPK1 | 5497 | 0.086 | 0.5 | NO |
| 26 | NFKB2 | NFKB2 | NFKB2 | 5955 | 0.073 | 0.48 | NO |
| 27 | ITPKB | ITPKB | ITPKB | 6104 | 0.069 | 0.48 | NO |
| 28 | RASGRP3 | RASGRP3 | RASGRP3 | 6515 | 0.057 | 0.47 | NO |
| 29 | PLCG1 | PLCG1 | PLCG1 | 6988 | 0.045 | 0.45 | NO |
| 30 | RAF1 | RAF1 | RAF1 | 8160 | 0.016 | 0.39 | NO |
| 31 | NFKBIA | NFKBIA | NFKBIA | 8597 | 0.0051 | 0.36 | NO |
| 32 | DTYMK | DTYMK | DTYMK | 8827 | -0.00013 | 0.35 | NO |
| 33 | PRDX1 | PRDX1 | PRDX1 | 9296 | -0.011 | 0.33 | NO |
| 34 | GRB2 | GRB2 | GRB2 | 9946 | -0.027 | 0.3 | NO |
| 35 | PAK4 | PAK4 | PAK4 | 10642 | -0.042 | 0.26 | NO |
| 36 | NFKB1 | NFKB1 | NFKB1 | 11593 | -0.068 | 0.22 | NO |
| 37 | NFAT5 | NFAT5 | NFAT5 | 11754 | -0.072 | 0.22 | NO |
| 38 | PAK2 | PAK2 | PAK2 | 11806 | -0.074 | 0.23 | NO |
| 39 | PAK1 | PAK1 | PAK1 | 12688 | -0.1 | 0.19 | NO |
| 40 | DAG1 | DAG1 | DAG1 | 13310 | -0.13 | 0.17 | NO |
| 41 | NFKBIL1 | NFKBIL1 | NFKBIL1 | 14439 | -0.18 | 0.13 | NO |
| 42 | SOS2 | SOS2 | SOS2 | 15880 | -0.29 | 0.086 | NO |
| 43 | PAK6 | PAK6 | PAK6 | 16481 | -0.35 | 0.091 | NO |
| 44 | EPHB2 | EPHB2 | EPHB2 | 17051 | -0.42 | 0.1 | NO |
Figure S13. Get High-res Image This plot shows mRNAseq_cNMF expression data heatmap (on the left) a RunningEnrichmentScore(RES) plot (on the top right) and a Signal2Noise(S2N) plot (on the bottom right) of genes in the pathway: PID PI3KCIPATHWAY.

Figure S14. Get High-res Image For the top 5 core enriched genes in the pathway: PID PI3KCIPATHWAY, this volcano plot shows how much they are up/down-regulated and significant. The significance was calculated by empirical bayesian fit
Table S8. Get Full Table This table shows a Running Enrichment Score (RES) of each gene in this pathway, that is, the enrichment score at this point in the ranked list of genes. All genes are ranked by Signal-to-Noise (S2N), a measure of similarity as default and are used to obtain ES matrix of all genes. In this way, GSEA tool uses expression pattern of not only overlapped genes but also not-overlapped genes to produce ES matrix.
| Rank | GENE | SYMBOL | DESC | LIST.LOC | S2N | RES | CORE_ENRICHMENT |
|---|---|---|---|---|---|---|---|
| 1 | IL12B | IL12B | IL12B | 4 | 1.3 | 0.12 | YES |
| 2 | MPO | MPO | MPO | 130 | 0.81 | 0.18 | YES |
| 3 | IL18RAP | IL18RAP | IL18RAP | 288 | 0.66 | 0.23 | YES |
| 4 | IL23R | IL23R | IL23R | 357 | 0.62 | 0.28 | YES |
| 5 | TNF | TNF | TNF | 403 | 0.6 | 0.34 | YES |
| 6 | IL18 | IL18 | IL18 | 485 | 0.56 | 0.38 | YES |
| 7 | CXCL9 | CXCL9 | CXCL9 | 575 | 0.54 | 0.42 | YES |
| 8 | IFNG | IFNG | IFNG | 644 | 0.52 | 0.47 | YES |
| 9 | IL12RB1 | IL12RB1 | IL12RB1 | 811 | 0.47 | 0.5 | YES |
| 10 | CD3E | CD3E | CD3E | 879 | 0.46 | 0.54 | YES |
| 11 | IL2 | IL2 | IL2 | 923 | 0.45 | 0.57 | YES |
| 12 | IL1B | IL1B | IL1B | 1107 | 0.41 | 0.6 | YES |
| 13 | STAT4 | STAT4 | STAT4 | 1111 | 0.41 | 0.64 | YES |
| 14 | IL19 | IL19 | IL19 | 1219 | 0.39 | 0.67 | YES |
| 15 | CD4 | CD4 | CD4 | 2120 | 0.27 | 0.64 | YES |
| 16 | JAK2 | JAK2 | JAK2 | 2468 | 0.24 | 0.65 | YES |
| 17 | IL24 | IL24 | IL24 | 2662 | 0.22 | 0.66 | YES |
| 18 | IL18R1 | IL18R1 | IL18R1 | 2768 | 0.21 | 0.67 | YES |
| 19 | STAT1 | STAT1 | STAT1 | 3093 | 0.19 | 0.67 | NO |
| 20 | STAT5A | STAT5A | STAT5A | 3932 | 0.15 | 0.64 | NO |
| 21 | IL6 | IL6 | IL6 | 4027 | 0.14 | 0.64 | NO |
| 22 | TYK2 | TYK2 | TYK2 | 6053 | 0.07 | 0.54 | NO |
| 23 | NOS2 | NOS2 | NOS2 | 6874 | 0.048 | 0.51 | NO |
| 24 | RELA | RELA | RELA | 7802 | 0.024 | 0.46 | NO |
| 25 | IL17F | IL17F | IL17F | 7890 | 0.022 | 0.46 | NO |
| 26 | PIK3R1 | PIK3R1 | PIK3R1 | 8082 | 0.018 | 0.45 | NO |
| 27 | NFKBIA | NFKBIA | NFKBIA | 8597 | 0.0051 | 0.42 | NO |
| 28 | STAT3 | STAT3 | STAT3 | 9399 | -0.014 | 0.38 | NO |
| 29 | PIK3CA | PIK3CA | PIK3CA | 10184 | -0.032 | 0.34 | NO |
| 30 | CCL2 | CCL2 | CCL2 | 11311 | -0.061 | 0.29 | NO |
| 31 | NFKB1 | NFKB1 | NFKB1 | 11593 | -0.068 | 0.28 | NO |
| 32 | SOCS3 | SOCS3 | SOCS3 | 13921 | -0.16 | 0.17 | NO |
| 33 | ALOX12B | ALOX12B | ALOX12B | 14926 | -0.21 | 0.14 | NO |
| 34 | CXCL1 | CXCL1 | CXCL1 | 15031 | -0.22 | 0.15 | NO |
| 35 | ITGA3 | ITGA3 | ITGA3 | 15910 | -0.29 | 0.13 | NO |
| 36 | IL23A | IL23A | IL23A | 16751 | -0.38 | 0.12 | NO |
Figure S15. Get High-res Image This plot shows mRNAseq_cNMF expression data heatmap (on the left) a RunningEnrichmentScore(RES) plot (on the top right) and a Signal2Noise(S2N) plot (on the bottom right) of genes in the pathway: PID IFNGPATHWAY.
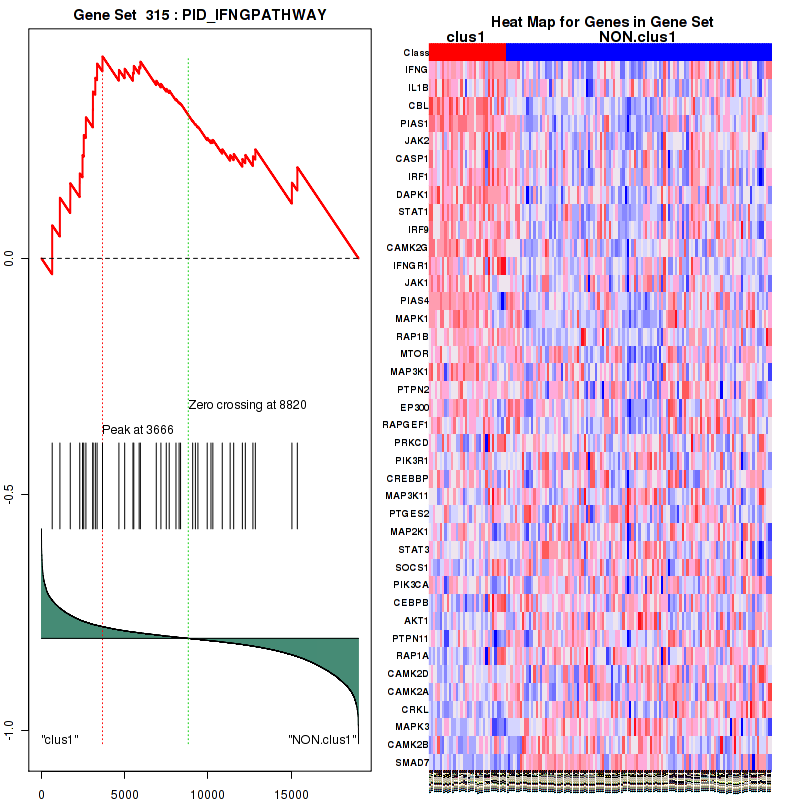
Figure S16. Get High-res Image For the top 5 core enriched genes in the pathway: PID IFNGPATHWAY, this volcano plot shows how much they are up/down-regulated and significant. The significance was calculated by empirical bayesian fit

Table S9. Get Full Table This table shows a Running Enrichment Score (RES) of each gene in this pathway, that is, the enrichment score at this point in the ranked list of genes. All genes are ranked by Signal-to-Noise (S2N), a measure of similarity as default and are used to obtain ES matrix of all genes. In this way, GSEA tool uses expression pattern of not only overlapped genes but also not-overlapped genes to produce ES matrix.
| Rank | GENE | SYMBOL | DESC | LIST.LOC | S2N | RES | CORE_ENRICHMENT |
|---|---|---|---|---|---|---|---|
| 1 | BLK | BLK | BLK | 735 | 0.49 | 0.06 | YES |
| 2 | CD19 | CD19 | CD19 | 929 | 0.44 | 0.14 | YES |
| 3 | PIK3CD | PIK3CD | PIK3CD | 989 | 0.43 | 0.22 | YES |
| 4 | CD79A | CD79A | CD79A | 1247 | 0.38 | 0.29 | YES |
| 5 | BTK | BTK | BTK | 1391 | 0.36 | 0.35 | YES |
| 6 | CBL | CBL | CBL | 1731 | 0.31 | 0.4 | YES |
| 7 | VAV1 | VAV1 | VAV1 | 1750 | 0.31 | 0.46 | YES |
| 8 | CD79B | CD79B | CD79B | 2336 | 0.25 | 0.48 | YES |
| 9 | BLNK | BLNK | BLNK | 2446 | 0.24 | 0.52 | YES |
| 10 | PLCG2 | PLCG2 | PLCG2 | 2854 | 0.21 | 0.54 | YES |
| 11 | PIK3AP1 | PIK3AP1 | PIK3AP1 | 3318 | 0.18 | 0.55 | YES |
| 12 | STIM1 | STIM1 | STIM1 | 3728 | 0.16 | 0.56 | YES |
| 13 | CBLB | CBLB | CBLB | 3772 | 0.15 | 0.59 | YES |
| 14 | SYK | SYK | SYK | 4158 | 0.14 | 0.6 | YES |
| 15 | NCK1 | NCK1 | NCK1 | 4335 | 0.13 | 0.61 | YES |
| 16 | CALM2 | CALM2 | CALM2 | 5097 | 0.099 | 0.59 | NO |
| 17 | SOS1 | SOS1 | SOS1 | 5109 | 0.098 | 0.61 | NO |
| 18 | ITPR3 | ITPR3 | ITPR3 | 6415 | 0.06 | 0.56 | NO |
| 19 | PLCG1 | PLCG1 | PLCG1 | 6988 | 0.045 | 0.53 | NO |
| 20 | LYN | LYN | LYN | 7362 | 0.034 | 0.52 | NO |
| 21 | FYN | FYN | FYN | 7696 | 0.027 | 0.51 | NO |
| 22 | PIK3R1 | PIK3R1 | PIK3R1 | 8082 | 0.018 | 0.49 | NO |
| 23 | GRB2 | GRB2 | GRB2 | 9946 | -0.027 | 0.4 | NO |
| 24 | ORAI1 | ORAI1 | ORAI1 | 9964 | -0.027 | 0.4 | NO |
| 25 | SH3KBP1 | SH3KBP1 | SH3KBP1 | 10028 | -0.028 | 0.41 | NO |
| 26 | CALM1 | CALM1 | CALM1 | 10278 | -0.034 | 0.4 | NO |
| 27 | ITPR2 | ITPR2 | ITPR2 | 10773 | -0.046 | 0.38 | NO |
| 28 | CALM3 | CALM3 | CALM3 | 11375 | -0.062 | 0.36 | NO |
| 29 | SHC1 | SHC1 | SHC1 | 14614 | -0.19 | 0.23 | NO |
Figure S17. Get High-res Image This plot shows mRNAseq_cNMF expression data heatmap (on the left) a RunningEnrichmentScore(RES) plot (on the top right) and a Signal2Noise(S2N) plot (on the bottom right) of genes in the pathway: PID IL23PATHWAY.

Figure S18. Get High-res Image For the top 5 core enriched genes in the pathway: PID IL23PATHWAY, this volcano plot shows how much they are up/down-regulated and significant. The significance was calculated by empirical bayesian fit
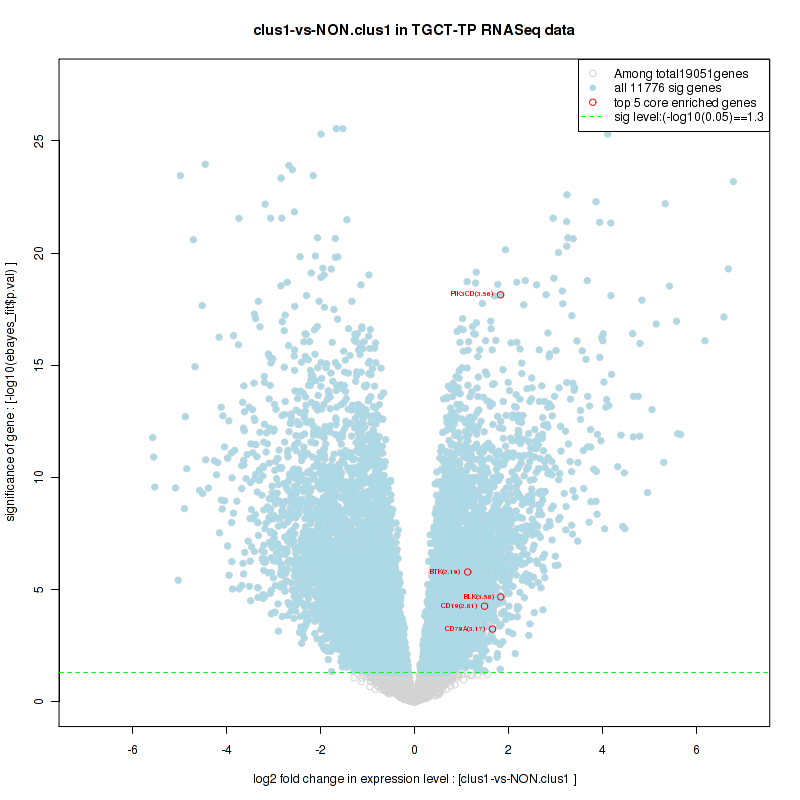
Table S10. Get Full Table This table shows a Running Enrichment Score (RES) of each gene in this pathway, that is, the enrichment score at this point in the ranked list of genes. All genes are ranked by Signal-to-Noise (S2N), a measure of similarity as default and are used to obtain ES matrix of all genes. In this way, GSEA tool uses expression pattern of not only overlapped genes but also not-overlapped genes to produce ES matrix.
| Rank | GENE | SYMBOL | DESC | LIST.LOC | S2N | RES | CORE_ENRICHMENT |
|---|---|---|---|---|---|---|---|
| 1 | ELOVL3 | ELOVL3 | ELOVL3 | 65 | 0.93 | 0.12 | YES |
| 2 | GPAT2 | GPAT2 | GPAT2 | 268 | 0.68 | 0.2 | YES |
| 3 | DGAT2 | DGAT2 | DGAT2 | 508 | 0.56 | 0.26 | YES |
| 4 | ELOVL6 | ELOVL6 | ELOVL6 | 818 | 0.47 | 0.31 | YES |
| 5 | LPIN2 | LPIN2 | LPIN2 | 2109 | 0.27 | 0.27 | YES |
| 6 | GK | GK | GK | 2259 | 0.25 | 0.3 | YES |
| 7 | ACSL4 | ACSL4 | ACSL4 | 2635 | 0.22 | 0.31 | YES |
| 8 | LPCAT4 | LPCAT4 | LPCAT4 | 2941 | 0.2 | 0.32 | YES |
| 9 | AGPAT6 | AGPAT6 | AGPAT6 | 2959 | 0.2 | 0.34 | YES |
| 10 | LPIN1 | LPIN1 | LPIN1 | 3138 | 0.19 | 0.36 | YES |
| 11 | ACSL5 | ACSL5 | ACSL5 | 3648 | 0.16 | 0.36 | YES |
| 12 | ELOVL4 | ELOVL4 | ELOVL4 | 3718 | 0.16 | 0.37 | YES |
| 13 | ACSL1 | ACSL1 | ACSL1 | 3730 | 0.16 | 0.39 | YES |
| 14 | LCLAT1 | LCLAT1 | LCLAT1 | 5361 | 0.09 | 0.32 | NO |
| 15 | AGPAT4 | AGPAT4 | AGPAT4 | 5447 | 0.087 | 0.32 | NO |
| 16 | ACSL6 | ACSL6 | ACSL6 | 5637 | 0.082 | 0.33 | NO |
| 17 | TECR | TECR | TECR | 6444 | 0.059 | 0.29 | NO |
| 18 | AGPAT5 | AGPAT5 | AGPAT5 | 6734 | 0.052 | 0.28 | NO |
| 19 | ACLY | ACLY | ACLY | 7411 | 0.033 | 0.25 | NO |
| 20 | LPCAT1 | LPCAT1 | LPCAT1 | 7558 | 0.03 | 0.25 | NO |
| 21 | AGPAT2 | AGPAT2 | AGPAT2 | 8371 | 0.01 | 0.21 | NO |
| 22 | ACACA | ACACA | ACACA | 9966 | -0.027 | 0.13 | NO |
| 23 | DGAT1 | DGAT1 | DGAT1 | 10377 | -0.036 | 0.11 | NO |
| 24 | ELOVL7 | ELOVL7 | ELOVL7 | 10576 | -0.041 | 0.1 | NO |
| 25 | AGPAT1 | AGPAT1 | AGPAT1 | 11512 | -0.066 | 0.064 | NO |
| 26 | ELOVL5 | ELOVL5 | ELOVL5 | 11583 | -0.068 | 0.07 | NO |
| 27 | HSD17B12 | HSD17B12 | HSD17B12 | 12111 | -0.084 | 0.053 | NO |
| 28 | ACSL3 | ACSL3 | ACSL3 | 12302 | -0.09 | 0.055 | NO |
| 29 | LPIN3 | LPIN3 | LPIN3 | 13477 | -0.14 | 0.011 | NO |
| 30 | GPD1 | GPD1 | GPD1 | 13828 | -0.15 | 0.013 | NO |
| 31 | ELOVL2 | ELOVL2 | ELOVL2 | 13987 | -0.16 | 0.026 | NO |
| 32 | FASN | FASN | FASN | 14207 | -0.17 | 0.037 | NO |
| 33 | SLC25A1 | SLC25A1 | SLC25A1 | 14276 | -0.18 | 0.056 | NO |
| 34 | GPAM | GPAM | GPAM | 14754 | -0.2 | 0.058 | NO |
| 35 | GPD1L | GPD1L | GPD1L | 14957 | -0.22 | 0.076 | NO |
| 36 | ELOVL1 | ELOVL1 | ELOVL1 | 14992 | -0.22 | 0.1 | NO |
| 37 | AGPAT3 | AGPAT3 | AGPAT3 | 15161 | -0.23 | 0.12 | NO |
| 38 | AGPAT9 | AGPAT9 | AGPAT9 | 18161 | -0.6 | 0.047 | NO |
Figure S19. Get High-res Image This plot shows mRNAseq_cNMF expression data heatmap (on the left) a RunningEnrichmentScore(RES) plot (on the top right) and a Signal2Noise(S2N) plot (on the bottom right) of genes in the pathway: PID IL8CXCR2 PATHWAY.
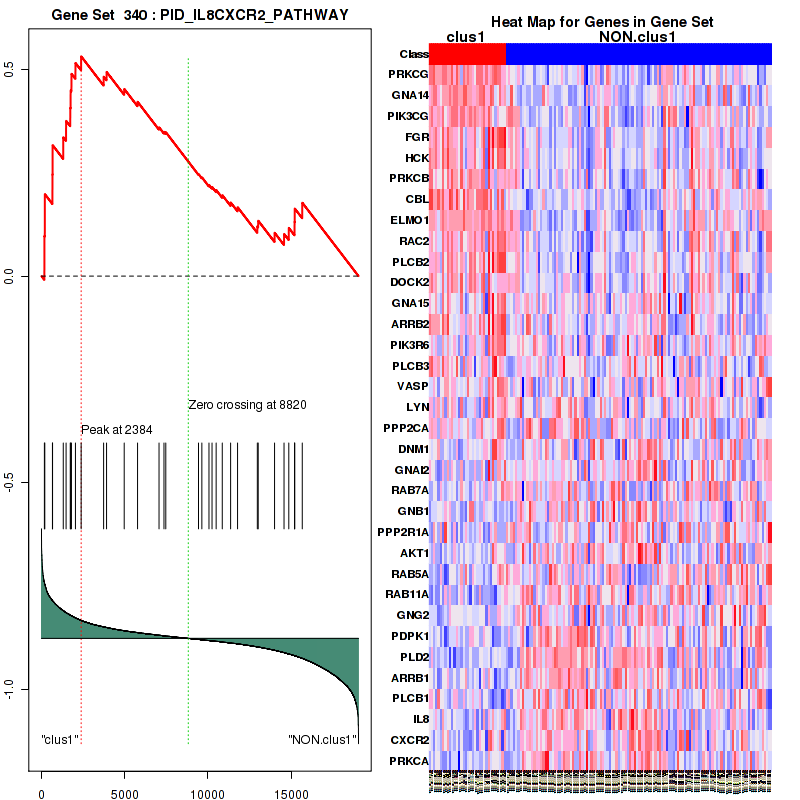
Figure S20. Get High-res Image For the top 5 core enriched genes in the pathway: PID IL8CXCR2 PATHWAY, this volcano plot shows how much they are up/down-regulated and significant. The significance was calculated by empirical bayesian fit

For the top enriched genes, if you want to check whether they are
-
up-regulated, please check the list of up-regulated genes
-
down-regulated, please check the list of down-regulated genes
For the top enriched genes, if you want to check whether they are
-
highly expressed genes, please check the list of high (top 30%) expressed genes
-
low expressed genes, please check the list of low (bottom 30%) expressed genes
An expression pattern of top(30%)/middle(30%)/low(30%) in this subtype against other subtypes is available in a heatmap
For the top enriched genes, if you want to check whether they are
-
significantly differently expressed genes by eBayes lm fit, please check the list of significant genes
Table 4. Get Full Table This table shows top 10 pathways which are significantly enriched in cluster clus2. It displays only significant gene sets satisfying nom.p.val.threshold (-1), fwer.p.val.threshold (-1) , fdr.q.val.threshold (0.25) and the default table is sorted by Normalized Enrichment Score (NES). Further details on NES statistics, please visit The Broad GSEA website.
| GeneSet(GS) | Size(#genes) | genes.ES.table | ES | NES | NOM.p.val | FDR.q.val | FWER.p.val | Tag.. | Gene.. | Signal | FDR..median. | glob.p.val |
|---|---|---|---|---|---|---|---|---|---|---|---|---|
| KEGG HOMOLOGOUS RECOMBINATION | 26 | genes.ES.table | 0.52 | 1.4 | 0.17 | 1 | 0.99 | 0.62 | 0.34 | 0.4 | 0.81 | 0.43 |
| PID BARD1PATHWAY | 29 | genes.ES.table | 0.53 | 1.5 | 0.082 | 1 | 0.93 | 0.69 | 0.38 | 0.43 | 0.56 | 0.33 |
| REACTOME FORMATION OF THE TERNARY COMPLEX AND SUBSEQUENTLY THE 43S COMPLEX | 49 | genes.ES.table | 0.53 | 1.4 | 0.16 | 1 | 0.99 | 0.76 | 0.41 | 0.45 | 0.76 | 0.41 |
| REACTOME MEIOSIS | 105 | genes.ES.table | 0.67 | 1.6 | 0.06 | 1 | 0.91 | 0.45 | 0.12 | 0.4 | 1 | 0.6 |
| REACTOME ACTIVATION OF THE MRNA UPON BINDING OF THE CAP BINDING COMPLEX AND EIFS AND SUBSEQUENT BINDING TO 43S | 57 | genes.ES.table | 0.51 | 1.4 | 0.18 | 1 | 0.99 | 0.7 | 0.41 | 0.42 | 0.84 | 0.44 |
| REACTOME GENERIC TRANSCRIPTION PATHWAY | 342 | genes.ES.table | 0.39 | 1.5 | 0.1 | 1 | 0.98 | 0.49 | 0.24 | 0.38 | 0.67 | 0.37 |
| REACTOME RNA POL I TRANSCRIPTION | 81 | genes.ES.table | 0.71 | 1.5 | 0.069 | 1 | 0.92 | 0.47 | 0.12 | 0.42 | 0.68 | 0.38 |
| REACTOME RNA POL III TRANSCRIPTION | 33 | genes.ES.table | 0.47 | 1.5 | 0.1 | 1 | 0.92 | 0.46 | 0.24 | 0.35 | 0.79 | 0.42 |
| REACTOME OLFACTORY SIGNALING PATHWAY | 53 | genes.ES.table | 0.59 | 1.4 | 0.059 | 1 | 1 | 0.47 | 0.13 | 0.41 | 0.86 | 0.44 |
| REACTOME 3 UTR MEDIATED TRANSLATIONAL REGULATION | 106 | genes.ES.table | 0.47 | 1.4 | 0.21 | 1 | 1 | 0.74 | 0.41 | 0.44 | 0.89 | 0.46 |
Table S11. Get Full Table This table shows a Running Enrichment Score (RES) of each gene in this pathway, that is, the enrichment score at this point in the ranked list of genes. All genes are ranked by Signal-to-Noise (S2N), a measure of similarity as default and are used to obtain ES matrix of all genes. In this way, GSEA tool uses expression pattern of not only overlapped genes but also not-overlapped genes to produce ES matrix.
| Rank | GENE | SYMBOL | DESC | LIST.LOC | S2N | RES | CORE_ENRICHMENT |
|---|---|---|---|---|---|---|---|
| 1 | HIST1H2AJ | HIST1H2AJ | HIST1H2AJ | 3 | 1.1 | 0.063 | YES |
| 2 | HIST1H2BL | HIST1H2BL | HIST1H2BL | 11 | 0.96 | 0.12 | YES |
| 3 | HIST1H2AB | HIST1H2AB | HIST1H2AB | 22 | 0.9 | 0.16 | YES |
| 4 | HIST1H4C | HIST1H4C | HIST1H4C | 170 | 0.65 | 0.19 | YES |
| 5 | HIST1H4D | HIST1H4D | HIST1H4D | 174 | 0.64 | 0.23 | YES |
| 6 | HIST1H4J | HIST1H4J | HIST1H4J | 190 | 0.63 | 0.26 | YES |
| 7 | HIST1H2BM | HIST1H2BM | HIST1H2BM | 217 | 0.61 | 0.29 | YES |
| 8 | HIST1H2BA | HIST1H2BA | HIST1H2BA | 268 | 0.57 | 0.32 | YES |
| 9 | HIST1H2AE | HIST1H2AE | HIST1H2AE | 273 | 0.57 | 0.36 | YES |
| 10 | HIST1H2BE | HIST1H2BE | HIST1H2BE | 353 | 0.53 | 0.38 | YES |
| 11 | HIST1H2BO | HIST1H2BO | HIST1H2BO | 374 | 0.53 | 0.41 | YES |
| 12 | HIST1H2BB | HIST1H2BB | HIST1H2BB | 454 | 0.49 | 0.43 | YES |
| 13 | HIST1H2AC | HIST1H2AC | HIST1H2AC | 485 | 0.48 | 0.46 | YES |
| 14 | HIST1H4H | HIST1H4H | HIST1H4H | 487 | 0.48 | 0.48 | YES |
| 15 | HIST1H2BG | HIST1H2BG | HIST1H2BG | 558 | 0.46 | 0.5 | YES |
| 16 | HIST1H2BD | HIST1H2BD | HIST1H2BD | 569 | 0.46 | 0.53 | YES |
| 17 | HIST1H4E | HIST1H4E | HIST1H4E | 574 | 0.45 | 0.56 | YES |
| 18 | HIST1H4K | HIST1H4K | HIST1H4K | 597 | 0.45 | 0.58 | YES |
| 19 | HIST1H4I | HIST1H4I | HIST1H4I | 733 | 0.41 | 0.59 | YES |
| 20 | HIST1H2BK | HIST1H2BK | HIST1H2BK | 845 | 0.38 | 0.61 | YES |
| 21 | HIST3H2BB | HIST3H2BB | HIST3H2BB | 883 | 0.38 | 0.63 | YES |
| 22 | HIST1H2BC | HIST1H2BC | HIST1H2BC | 885 | 0.38 | 0.65 | YES |
| 23 | HIST1H2BJ | HIST1H2BJ | HIST1H2BJ | 1103 | 0.34 | 0.66 | YES |
| 24 | HIST1H2BF | HIST1H2BF | HIST1H2BF | 1571 | 0.28 | 0.65 | YES |
| 25 | HIST1H4F | HIST1H4F | HIST1H4F | 1831 | 0.25 | 0.65 | YES |
| 26 | HIST1H4B | HIST1H4B | HIST1H4B | 1838 | 0.25 | 0.66 | YES |
| 27 | POLE2 | POLE2 | POLE2 | 1988 | 0.23 | 0.66 | YES |
| 28 | HIST1H2AD | HIST1H2AD | HIST1H2AD | 1989 | 0.23 | 0.68 | YES |
| 29 | HIST4H4 | HIST4H4 | HIST4H4 | 2055 | 0.23 | 0.69 | YES |
| 30 | HIST1H2BI | HIST1H2BI | HIST1H2BI | 2106 | 0.22 | 0.7 | YES |
| 31 | DNA2 | DNA2 | DNA2 | 2397 | 0.2 | 0.69 | NO |
| 32 | HIST1H2BH | HIST1H2BH | HIST1H2BH | 2727 | 0.18 | 0.68 | NO |
| 33 | HIST1H4A | HIST1H4A | HIST1H4A | 3146 | 0.16 | 0.67 | NO |
| 34 | LIG1 | LIG1 | LIG1 | 3404 | 0.15 | 0.67 | NO |
| 35 | POLE | POLE | POLE | 3724 | 0.13 | 0.66 | NO |
| 36 | PRIM2 | PRIM2 | PRIM2 | 4083 | 0.12 | 0.64 | NO |
| 37 | HIST2H2BE | HIST2H2BE | HIST2H2BE | 4377 | 0.11 | 0.64 | NO |
| 38 | PRIM1 | PRIM1 | PRIM1 | 4601 | 0.1 | 0.63 | NO |
| 39 | HIST1H2BN | HIST1H2BN | HIST1H2BN | 4694 | 0.1 | 0.63 | NO |
| 40 | POLD1 | POLD1 | POLD1 | 5593 | 0.077 | 0.59 | NO |
| 41 | RPA1 | RPA1 | RPA1 | 5703 | 0.074 | 0.58 | NO |
| 42 | RUVBL2 | RUVBL2 | RUVBL2 | 6088 | 0.064 | 0.57 | NO |
| 43 | RUVBL1 | RUVBL1 | RUVBL1 | 6173 | 0.061 | 0.57 | NO |
| 44 | POT1 | POT1 | POT1 | 6678 | 0.049 | 0.54 | NO |
| 45 | FEN1 | FEN1 | FEN1 | 6977 | 0.042 | 0.53 | NO |
| 46 | RPA3 | RPA3 | RPA3 | 7048 | 0.04 | 0.53 | NO |
| 47 | NHP2 | NHP2 | NHP2 | 7138 | 0.038 | 0.53 | NO |
| 48 | PCNA | PCNA | PCNA | 7766 | 0.024 | 0.5 | NO |
| 49 | RFC4 | RFC4 | RFC4 | 8066 | 0.018 | 0.48 | NO |
| 50 | TERT | TERT | TERT | 8558 | 0.0058 | 0.45 | NO |
| 51 | RFC2 | RFC2 | RFC2 | 8660 | 0.0035 | 0.45 | NO |
| 52 | RFC3 | RFC3 | RFC3 | 9044 | -0.0052 | 0.43 | NO |
| 53 | POLD2 | POLD2 | POLD2 | 9052 | -0.0054 | 0.43 | NO |
| 54 | POLA1 | POLA1 | POLA1 | 9355 | -0.013 | 0.41 | NO |
| 55 | TERF2IP | TERF2IP | TERF2IP | 9522 | -0.017 | 0.41 | NO |
| 56 | RPA2 | RPA2 | RPA2 | 9883 | -0.025 | 0.39 | NO |
| 57 | ACD | ACD | ACD | 9974 | -0.028 | 0.38 | NO |
| 58 | POLD3 | POLD3 | POLD3 | 10139 | -0.032 | 0.38 | NO |
| 59 | DKC1 | DKC1 | DKC1 | 10217 | -0.035 | 0.38 | NO |
| 60 | HIST1H4L | HIST1H4L | HIST1H4L | 10796 | -0.05 | 0.35 | NO |
| 61 | H2AFZ | H2AFZ | H2AFZ | 10901 | -0.053 | 0.35 | NO |
| 62 | TERF2 | TERF2 | TERF2 | 11071 | -0.058 | 0.34 | NO |
| 63 | HIST2H2AC | HIST2H2AC | HIST2H2AC | 11111 | -0.059 | 0.34 | NO |
| 64 | POLA2 | POLA2 | POLA2 | 11932 | -0.082 | 0.3 | NO |
| 65 | RFC5 | RFC5 | RFC5 | 13112 | -0.13 | 0.25 | NO |
| 66 | TINF2 | TINF2 | TINF2 | 13335 | -0.14 | 0.24 | NO |
| 67 | WRAP53 | WRAP53 | WRAP53 | 13393 | -0.14 | 0.25 | NO |
| 68 | POLD4 | POLD4 | POLD4 | 13499 | -0.14 | 0.25 | NO |
| 69 | HIST2H2AA3 | HIST2H2AA3 | HIST2H2AA3 | 13602 | -0.15 | 0.25 | NO |
| 70 | H2AFX | H2AFX | H2AFX | 14283 | -0.19 | 0.23 | NO |
| 71 | TERF1 | TERF1 | TERF1 | 14294 | -0.19 | 0.24 | NO |
| 72 | HIST2H4A | HIST2H4A | HIST2H4A | 14707 | -0.22 | 0.23 | NO |
Figure S21. Get High-res Image This plot shows mRNAseq_cNMF expression data heatmap (on the left) a RunningEnrichmentScore(RES) plot (on the top right) and a Signal2Noise(S2N) plot (on the bottom right) of genes in the pathway: KEGG HOMOLOGOUS RECOMBINATION.
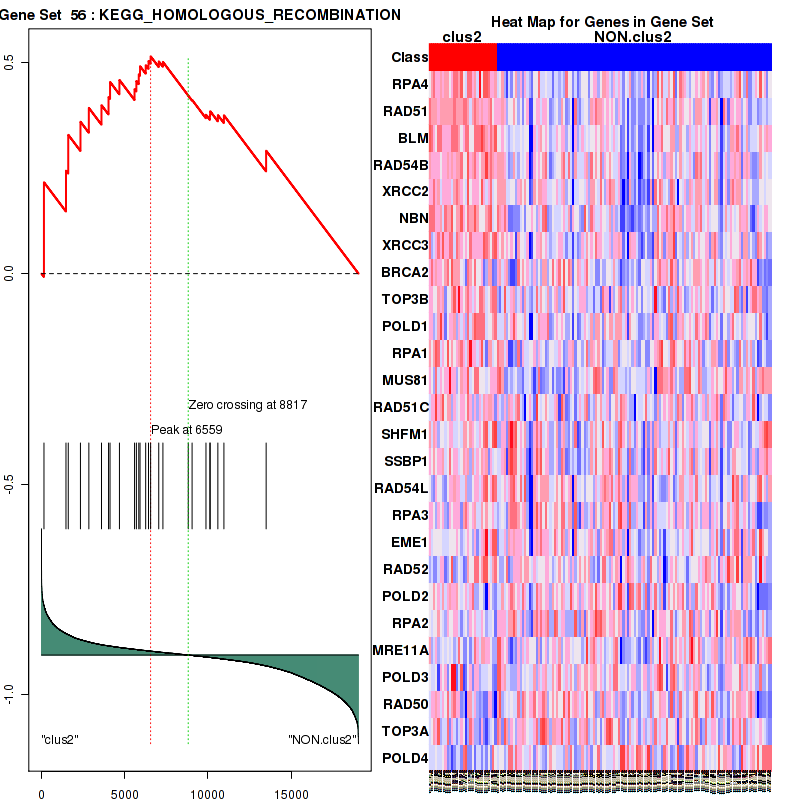
Figure S22. Get High-res Image For the top 5 core enriched genes in the pathway: KEGG HOMOLOGOUS RECOMBINATION, this volcano plot shows how much they are up/down-regulated and significant. The significance was calculated by empirical bayesian fit
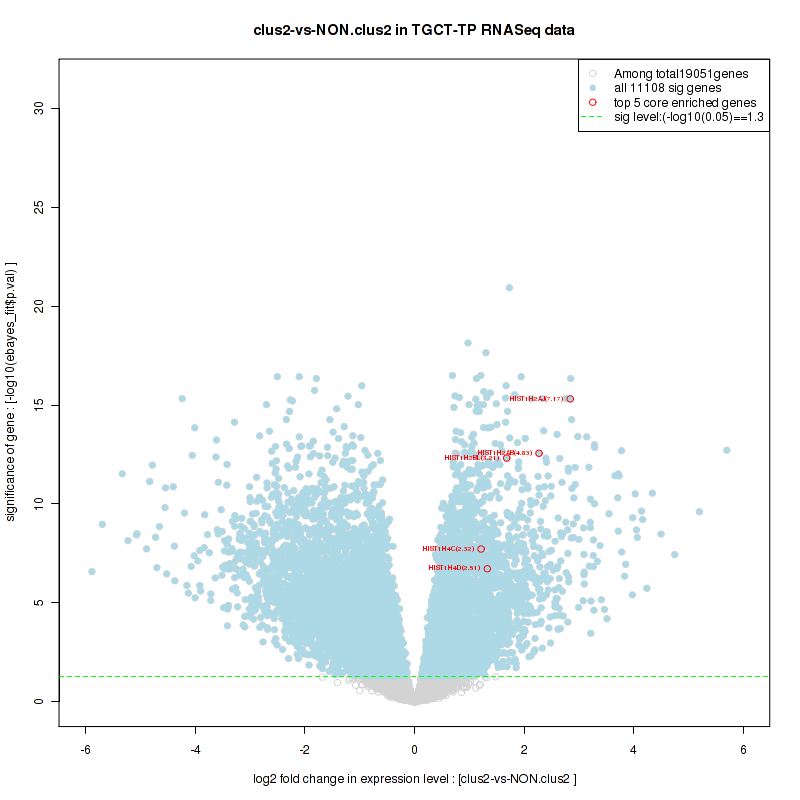
Table S12. Get Full Table This table shows a Running Enrichment Score (RES) of each gene in this pathway, that is, the enrichment score at this point in the ranked list of genes. All genes are ranked by Signal-to-Noise (S2N), a measure of similarity as default and are used to obtain ES matrix of all genes. In this way, GSEA tool uses expression pattern of not only overlapped genes but also not-overlapped genes to produce ES matrix.
| Rank | GENE | SYMBOL | DESC | LIST.LOC | S2N | RES | CORE_ENRICHMENT |
|---|---|---|---|---|---|---|---|
| 1 | HIST1H2AJ | HIST1H2AJ | HIST1H2AJ | 3 | 1.1 | 0.036 | YES |
| 2 | HIST1H3C | HIST1H3C | HIST1H3C | 5 | 1.1 | 0.07 | YES |
| 3 | HIST1H2BL | HIST1H2BL | HIST1H2BL | 11 | 0.96 | 0.1 | YES |
| 4 | HIST1H2AB | HIST1H2AB | HIST1H2AB | 22 | 0.9 | 0.13 | YES |
| 5 | HIST1H3A | HIST1H3A | HIST1H3A | 67 | 0.76 | 0.15 | YES |
| 6 | HIST1H3H | HIST1H3H | HIST1H3H | 139 | 0.67 | 0.17 | YES |
| 7 | HIST1H4C | HIST1H4C | HIST1H4C | 170 | 0.65 | 0.18 | YES |
| 8 | HIST1H4D | HIST1H4D | HIST1H4D | 174 | 0.64 | 0.2 | YES |
| 9 | HIST1H4J | HIST1H4J | HIST1H4J | 190 | 0.63 | 0.22 | YES |
| 10 | HIST1H2BM | HIST1H2BM | HIST1H2BM | 217 | 0.61 | 0.24 | YES |
| 11 | HIST1H2BA | HIST1H2BA | HIST1H2BA | 268 | 0.57 | 0.26 | YES |
| 12 | HIST1H2AE | HIST1H2AE | HIST1H2AE | 273 | 0.57 | 0.28 | YES |
| 13 | HIST1H2BE | HIST1H2BE | HIST1H2BE | 353 | 0.53 | 0.29 | YES |
| 14 | HIST1H2BO | HIST1H2BO | HIST1H2BO | 374 | 0.53 | 0.3 | YES |
| 15 | HIST1H2BB | HIST1H2BB | HIST1H2BB | 454 | 0.49 | 0.31 | YES |
| 16 | HIST1H2AC | HIST1H2AC | HIST1H2AC | 485 | 0.48 | 0.33 | YES |
| 17 | HIST1H4H | HIST1H4H | HIST1H4H | 487 | 0.48 | 0.34 | YES |
| 18 | HIST1H2BG | HIST1H2BG | HIST1H2BG | 558 | 0.46 | 0.35 | YES |
| 19 | HIST1H2BD | HIST1H2BD | HIST1H2BD | 569 | 0.46 | 0.37 | YES |
| 20 | HIST1H4E | HIST1H4E | HIST1H4E | 574 | 0.45 | 0.38 | YES |
| 21 | HIST1H4K | HIST1H4K | HIST1H4K | 597 | 0.45 | 0.39 | YES |
| 22 | HIST1H4I | HIST1H4I | HIST1H4I | 733 | 0.41 | 0.4 | YES |
| 23 | HIST1H2BK | HIST1H2BK | HIST1H2BK | 845 | 0.38 | 0.41 | YES |
| 24 | HIST3H2BB | HIST3H2BB | HIST3H2BB | 883 | 0.38 | 0.42 | YES |
| 25 | HIST1H2BC | HIST1H2BC | HIST1H2BC | 885 | 0.38 | 0.43 | YES |
| 26 | HIST1H2BJ | HIST1H2BJ | HIST1H2BJ | 1103 | 0.34 | 0.43 | YES |
| 27 | HIST1H3I | HIST1H3I | HIST1H3I | 1114 | 0.33 | 0.44 | YES |
| 28 | HIST1H3B | HIST1H3B | HIST1H3B | 1144 | 0.33 | 0.44 | YES |
| 29 | LZTS1 | LZTS1 | LZTS1 | 1283 | 0.31 | 0.45 | YES |
| 30 | HIST1H3G | HIST1H3G | HIST1H3G | 1307 | 0.31 | 0.46 | YES |
| 31 | HIST1H3D | HIST1H3D | HIST1H3D | 1392 | 0.3 | 0.46 | YES |
| 32 | TAF4B | TAF4B | TAF4B | 1451 | 0.29 | 0.47 | YES |
| 33 | ERCC6 | ERCC6 | ERCC6 | 1555 | 0.28 | 0.47 | YES |
| 34 | HIST1H2BF | HIST1H2BF | HIST1H2BF | 1571 | 0.28 | 0.48 | YES |
| 35 | TAF5 | TAF5 | TAF5 | 1699 | 0.26 | 0.48 | YES |
| 36 | HIST1H4F | HIST1H4F | HIST1H4F | 1831 | 0.25 | 0.48 | YES |
| 37 | HIST1H4B | HIST1H4B | HIST1H4B | 1838 | 0.25 | 0.49 | YES |
| 38 | GTF2A1 | GTF2A1 | GTF2A1 | 1897 | 0.24 | 0.49 | YES |
| 39 | HIST1H2AD | HIST1H2AD | HIST1H2AD | 1989 | 0.23 | 0.5 | YES |
| 40 | HIST4H4 | HIST4H4 | HIST4H4 | 2055 | 0.23 | 0.5 | YES |
| 41 | HIST1H2BI | HIST1H2BI | HIST1H2BI | 2106 | 0.22 | 0.5 | YES |
| 42 | CCNT1 | CCNT1 | CCNT1 | 2115 | 0.22 | 0.51 | YES |
| 43 | TAF13 | TAF13 | TAF13 | 2130 | 0.22 | 0.52 | YES |
| 44 | HIST1H3E | HIST1H3E | HIST1H3E | 2206 | 0.21 | 0.52 | YES |
| 45 | SNAPC4 | SNAPC4 | SNAPC4 | 2264 | 0.21 | 0.52 | YES |
| 46 | MTERF | MTERF | MTERF | 2321 | 0.21 | 0.53 | YES |
| 47 | POLR3C | POLR3C | POLR3C | 2509 | 0.19 | 0.52 | YES |
| 48 | SNAPC1 | SNAPC1 | SNAPC1 | 2563 | 0.19 | 0.52 | YES |
| 49 | ELL | ELL | ELL | 2576 | 0.19 | 0.53 | YES |
| 50 | POLR2K | POLR2K | POLR2K | 2726 | 0.18 | 0.53 | YES |
| 51 | HIST1H2BH | HIST1H2BH | HIST1H2BH | 2727 | 0.18 | 0.53 | YES |
| 52 | HIST1H4A | HIST1H4A | HIST1H4A | 3146 | 0.16 | 0.52 | YES |
| 53 | GTF2A2 | GTF2A2 | GTF2A2 | 3154 | 0.16 | 0.52 | YES |
| 54 | POU2F1 | POU2F1 | POU2F1 | 3280 | 0.15 | 0.52 | YES |
| 55 | CBX3 | CBX3 | CBX3 | 3296 | 0.15 | 0.52 | YES |
| 56 | BRF2 | BRF2 | BRF2 | 3378 | 0.15 | 0.52 | YES |
| 57 | GTF2E1 | GTF2E1 | GTF2E1 | 3399 | 0.15 | 0.53 | YES |
| 58 | POLRMT | POLRMT | POLRMT | 3469 | 0.14 | 0.53 | YES |
| 59 | POLR2F | POLR2F | POLR2F | 3501 | 0.14 | 0.53 | YES |
| 60 | TCEA1 | TCEA1 | TCEA1 | 3643 | 0.14 | 0.53 | YES |
| 61 | SNRPE | SNRPE | SNRPE | 3645 | 0.14 | 0.53 | YES |
| 62 | POLR3D | POLR3D | POLR3D | 3939 | 0.12 | 0.52 | YES |
| 63 | TAF1B | TAF1B | TAF1B | 4045 | 0.12 | 0.52 | YES |
| 64 | GTF3C2 | GTF3C2 | GTF3C2 | 4090 | 0.12 | 0.52 | YES |
| 65 | POLR1C | POLR1C | POLR1C | 4150 | 0.12 | 0.52 | YES |
| 66 | KAT2B | KAT2B | KAT2B | 4156 | 0.12 | 0.52 | YES |
| 67 | POLR2I | POLR2I | POLR2I | 4235 | 0.12 | 0.52 | YES |
| 68 | SNRPD3 | SNRPD3 | SNRPD3 | 4277 | 0.11 | 0.52 | YES |
| 69 | POLR2D | POLR2D | POLR2D | 4305 | 0.11 | 0.53 | YES |
| 70 | TCEB1 | TCEB1 | TCEB1 | 4365 | 0.11 | 0.53 | YES |
| 71 | HIST2H2BE | HIST2H2BE | HIST2H2BE | 4377 | 0.11 | 0.53 | YES |
| 72 | POLR3A | POLR3A | POLR3A | 4401 | 0.11 | 0.53 | YES |
| 73 | POLR3B | POLR3B | POLR3B | 4412 | 0.11 | 0.54 | YES |
| 74 | GTF3C3 | GTF3C3 | GTF3C3 | 4430 | 0.11 | 0.54 | YES |
| 75 | TAF6 | TAF6 | TAF6 | 4445 | 0.11 | 0.54 | YES |
| 76 | GTF3C4 | GTF3C4 | GTF3C4 | 4595 | 0.1 | 0.54 | YES |
| 77 | LSM11 | LSM11 | LSM11 | 4626 | 0.1 | 0.54 | YES |
| 78 | CSTF2 | CSTF2 | CSTF2 | 4689 | 0.1 | 0.54 | YES |
| 79 | HIST1H2BN | HIST1H2BN | HIST1H2BN | 4694 | 0.1 | 0.54 | YES |
| 80 | SUPT5H | SUPT5H | SUPT5H | 4734 | 0.1 | 0.54 | YES |
| 81 | HIST1H3J | HIST1H3J | HIST1H3J | 4843 | 0.097 | 0.54 | NO |
| 82 | SNRPG | SNRPG | SNRPG | 5064 | 0.091 | 0.53 | NO |
| 83 | TFB2M | TFB2M | TFB2M | 5158 | 0.088 | 0.53 | NO |
| 84 | POLR2B | POLR2B | POLR2B | 5188 | 0.087 | 0.53 | NO |
| 85 | GTF2E2 | GTF2E2 | GTF2E2 | 5270 | 0.085 | 0.53 | NO |
| 86 | SNAPC2 | SNAPC2 | SNAPC2 | 5399 | 0.082 | 0.52 | NO |
| 87 | CCNT2 | CCNT2 | CCNT2 | 5561 | 0.077 | 0.52 | NO |
| 88 | SNRPB | SNRPB | SNRPB | 5664 | 0.074 | 0.51 | NO |
| 89 | CLP1 | CLP1 | CLP1 | 5739 | 0.073 | 0.51 | NO |
| 90 | SUPT16H | SUPT16H | SUPT16H | 5826 | 0.07 | 0.51 | NO |
| 91 | PAPOLA | PAPOLA | PAPOLA | 5909 | 0.068 | 0.51 | NO |
| 92 | POLR1B | POLR1B | POLR1B | 5978 | 0.066 | 0.51 | NO |
| 93 | NFX1 | NFX1 | NFX1 | 6009 | 0.066 | 0.51 | NO |
| 94 | GTF2H2B | GTF2H2B | GTF2H2B | 6034 | 0.065 | 0.51 | NO |
| 95 | NCBP2 | NCBP2 | NCBP2 | 6067 | 0.064 | 0.51 | NO |
| 96 | POLR1A | POLR1A | POLR1A | 6094 | 0.064 | 0.51 | NO |
| 97 | H3F3A | H3F3A | H3F3A | 6142 | 0.062 | 0.51 | NO |
| 98 | SNAPC3 | SNAPC3 | SNAPC3 | 6147 | 0.062 | 0.51 | NO |
| 99 | RNPS1 | RNPS1 | RNPS1 | 6205 | 0.061 | 0.51 | NO |
| 100 | CDK7 | CDK7 | CDK7 | 6222 | 0.06 | 0.51 | NO |
| 101 | HIST1H3F | HIST1H3F | HIST1H3F | 6360 | 0.057 | 0.5 | NO |
| 102 | TAF1 | TAF1 | TAF1 | 6369 | 0.057 | 0.51 | NO |
| 103 | TAF1C | TAF1C | TAF1C | 6597 | 0.051 | 0.5 | NO |
| 104 | ZNF143 | ZNF143 | ZNF143 | 6618 | 0.05 | 0.5 | NO |
| 105 | RBM8A | RBM8A | RBM8A | 6741 | 0.048 | 0.49 | NO |
| 106 | CTDP1 | CTDP1 | CTDP1 | 6845 | 0.045 | 0.49 | NO |
| 107 | CPSF1 | CPSF1 | CPSF1 | 6907 | 0.044 | 0.48 | NO |
| 108 | ZNF473 | ZNF473 | ZNF473 | 6987 | 0.042 | 0.48 | NO |
| 109 | TCEB3 | TCEB3 | TCEB3 | 7109 | 0.039 | 0.48 | NO |
| 110 | TBP | TBP | TBP | 7140 | 0.038 | 0.48 | NO |
| 111 | SUPT4H1 | SUPT4H1 | SUPT4H1 | 7150 | 0.038 | 0.48 | NO |
| 112 | U2AF1 | U2AF1 | U2AF1 | 7204 | 0.036 | 0.48 | NO |
| 113 | POLR2J | POLR2J | POLR2J | 7247 | 0.036 | 0.48 | NO |
| 114 | TAF11 | TAF11 | TAF11 | 7257 | 0.035 | 0.48 | NO |
| 115 | POLR3F | POLR3F | POLR3F | 7371 | 0.033 | 0.47 | NO |
| 116 | SNRPF | SNRPF | SNRPF | 7627 | 0.027 | 0.46 | NO |
| 117 | RRN3 | RRN3 | RRN3 | 7704 | 0.026 | 0.45 | NO |
| 118 | ERCC3 | ERCC3 | ERCC3 | 7748 | 0.025 | 0.45 | NO |
| 119 | GTF2B | GTF2B | GTF2B | 7821 | 0.024 | 0.45 | NO |
| 120 | TAF4 | TAF4 | TAF4 | 7963 | 0.02 | 0.44 | NO |
| 121 | U2AF2 | U2AF2 | U2AF2 | 8029 | 0.019 | 0.44 | NO |
| 122 | CPSF7 | CPSF7 | CPSF7 | 8037 | 0.019 | 0.44 | NO |
| 123 | HIST2H3D | HIST2H3D | HIST2H3D | 8215 | 0.014 | 0.43 | NO |
| 124 | NUDT21 | NUDT21 | NUDT21 | 8219 | 0.014 | 0.43 | NO |
| 125 | PCF11 | PCF11 | PCF11 | 8234 | 0.014 | 0.43 | NO |
| 126 | SNAPC5 | SNAPC5 | SNAPC5 | 8236 | 0.014 | 0.43 | NO |
| 127 | CPSF2 | CPSF2 | CPSF2 | 8246 | 0.014 | 0.43 | NO |
| 128 | MNAT1 | MNAT1 | MNAT1 | 8285 | 0.012 | 0.43 | NO |
| 129 | CDK9 | CDK9 | CDK9 | 8420 | 0.0092 | 0.42 | NO |
| 130 | WHSC2 | WHSC2 | WHSC2 | 8433 | 0.0088 | 0.42 | NO |
| 131 | POLR3E | POLR3E | POLR3E | 8484 | 0.0074 | 0.42 | NO |
| 132 | CPSF3 | CPSF3 | CPSF3 | 8556 | 0.0058 | 0.42 | NO |
| 133 | ERCC2 | ERCC2 | ERCC2 | 8570 | 0.0054 | 0.42 | NO |
| 134 | TCEB2 | TCEB2 | TCEB2 | 8734 | 0.0018 | 0.41 | NO |
| 135 | GTF3C5 | GTF3C5 | GTF3C5 | 8768 | 0.001 | 0.41 | NO |
| 136 | GTF2H4 | GTF2H4 | GTF2H4 | 8981 | -0.0036 | 0.4 | NO |
| 137 | DHX38 | DHX38 | DHX38 | 9020 | -0.0047 | 0.39 | NO |
| 138 | POLR1D | POLR1D | POLR1D | 9021 | -0.0047 | 0.39 | NO |
| 139 | NCBP1 | NCBP1 | NCBP1 | 9022 | -0.0048 | 0.39 | NO |
| 140 | CSTF1 | CSTF1 | CSTF1 | 9024 | -0.0048 | 0.39 | NO |
| 141 | GTF2H2 | GTF2H2 | GTF2H2 | 9093 | -0.0066 | 0.39 | NO |
| 142 | GTF2F1 | GTF2F1 | GTF2F1 | 9183 | -0.0086 | 0.39 | NO |
| 143 | TFAM | TFAM | TFAM | 9285 | -0.011 | 0.38 | NO |
| 144 | CDC40 | CDC40 | CDC40 | 9294 | -0.011 | 0.38 | NO |
| 145 | RNMT | RNMT | RNMT | 9315 | -0.012 | 0.38 | NO |
| 146 | THOC4 | THOC4 | THOC4 | 9577 | -0.018 | 0.37 | NO |
| 147 | TAF1A | TAF1A | TAF1A | 9663 | -0.02 | 0.36 | NO |
| 148 | POLR2H | POLR2H | POLR2H | 9671 | -0.02 | 0.36 | NO |
| 149 | BRF1 | BRF1 | BRF1 | 9706 | -0.021 | 0.36 | NO |
| 150 | CSTF3 | CSTF3 | CSTF3 | 9743 | -0.022 | 0.36 | NO |
| 151 | UBTF | UBTF | UBTF | 9767 | -0.022 | 0.36 | NO |
| 152 | TAF9 | TAF9 | TAF9 | 9791 | -0.023 | 0.36 | NO |
| 153 | SRRM1 | SRRM1 | SRRM1 | 9794 | -0.023 | 0.36 | NO |
| 154 | TAF10 | TAF10 | TAF10 | 9803 | -0.024 | 0.36 | NO |
| 155 | MBD2 | MBD2 | MBD2 | 9966 | -0.028 | 0.35 | NO |
| 156 | POLR2E | POLR2E | POLR2E | 10049 | -0.03 | 0.35 | NO |
| 157 | GTF2F2 | GTF2F2 | GTF2F2 | 10127 | -0.032 | 0.35 | NO |
| 158 | GTF2H1 | GTF2H1 | GTF2H1 | 10225 | -0.035 | 0.34 | NO |
| 159 | SLBP | SLBP | SLBP | 10280 | -0.036 | 0.34 | NO |
| 160 | COBRA1 | COBRA1 | COBRA1 | 10285 | -0.036 | 0.34 | NO |
| 161 | RDBP | RDBP | RDBP | 10478 | -0.041 | 0.33 | NO |
| 162 | TH1L | TH1L | TH1L | 10512 | -0.042 | 0.33 | NO |
| 163 | SSRP1 | SSRP1 | SSRP1 | 10568 | -0.043 | 0.33 | NO |
| 164 | POLR2L | POLR2L | POLR2L | 10762 | -0.049 | 0.32 | NO |
| 165 | HIST1H4L | HIST1H4L | HIST1H4L | 10796 | -0.05 | 0.32 | NO |
| 166 | SSB | SSB | SSB | 10798 | -0.05 | 0.32 | NO |
| 167 | PABPN1 | PABPN1 | PABPN1 | 10885 | -0.053 | 0.32 | NO |
| 168 | H2AFZ | H2AFZ | H2AFZ | 10901 | -0.053 | 0.32 | NO |
| 169 | HIST2H2AC | HIST2H2AC | HIST2H2AC | 11111 | -0.059 | 0.31 | NO |
| 170 | LSM10 | LSM10 | LSM10 | 11115 | -0.059 | 0.31 | NO |
| 171 | GTF2H3 | GTF2H3 | GTF2H3 | 11435 | -0.068 | 0.3 | NO |
| 172 | POLR2C | POLR2C | POLR2C | 11490 | -0.069 | 0.3 | NO |
| 173 | POLR3H | POLR3H | POLR3H | 11550 | -0.071 | 0.3 | NO |
| 174 | CCNH | CCNH | CCNH | 11717 | -0.076 | 0.29 | NO |
| 175 | TAF12 | TAF12 | TAF12 | 11759 | -0.077 | 0.29 | NO |
| 176 | POLR3K | POLR3K | POLR3K | 12275 | -0.094 | 0.27 | NO |
| 177 | RNGTT | RNGTT | RNGTT | 12298 | -0.095 | 0.27 | NO |
| 178 | H3F3B | H3F3B | H3F3B | 12581 | -0.1 | 0.26 | NO |
| 179 | MAPK3 | MAPK3 | MAPK3 | 12625 | -0.11 | 0.26 | NO |
| 180 | POLR2A | POLR2A | POLR2A | 12890 | -0.12 | 0.25 | NO |
| 181 | MAGOH | MAGOH | MAGOH | 12904 | -0.12 | 0.25 | NO |
| 182 | PTRF | PTRF | PTRF | 13591 | -0.15 | 0.22 | NO |
| 183 | HIST2H2AA3 | HIST2H2AA3 | HIST2H2AA3 | 13602 | -0.15 | 0.22 | NO |
| 184 | NFIB | NFIB | NFIB | 13667 | -0.15 | 0.22 | NO |
| 185 | POLR3GL | POLR3GL | POLR3GL | 14067 | -0.18 | 0.21 | NO |
| 186 | H2AFX | H2AFX | H2AFX | 14283 | -0.19 | 0.2 | NO |
| 187 | HIST2H4A | HIST2H4A | HIST2H4A | 14707 | -0.22 | 0.19 | NO |
| 188 | UPF3B | UPF3B | UPF3B | 14923 | -0.23 | 0.18 | NO |
| 189 | POLR2G | POLR2G | POLR2G | 15731 | -0.3 | 0.15 | NO |
| 190 | EHMT2 | EHMT2 | EHMT2 | 15977 | -0.33 | 0.15 | NO |
| 191 | HIST2H3C | HIST2H3C | HIST2H3C | 17361 | -0.48 | 0.09 | NO |
Figure S23. Get High-res Image This plot shows mRNAseq_cNMF expression data heatmap (on the left) a RunningEnrichmentScore(RES) plot (on the top right) and a Signal2Noise(S2N) plot (on the bottom right) of genes in the pathway: PID BARD1PATHWAY.

Figure S24. Get High-res Image For the top 5 core enriched genes in the pathway: PID BARD1PATHWAY, this volcano plot shows how much they are up/down-regulated and significant. The significance was calculated by empirical bayesian fit
Table S13. Get Full Table This table shows a Running Enrichment Score (RES) of each gene in this pathway, that is, the enrichment score at this point in the ranked list of genes. All genes are ranked by Signal-to-Noise (S2N), a measure of similarity as default and are used to obtain ES matrix of all genes. In this way, GSEA tool uses expression pattern of not only overlapped genes but also not-overlapped genes to produce ES matrix.
| Rank | GENE | SYMBOL | DESC | LIST.LOC | S2N | RES | CORE_ENRICHMENT |
|---|---|---|---|---|---|---|---|
| 1 | HIST1H2AJ | HIST1H2AJ | HIST1H2AJ | 3 | 1.1 | 0.041 | YES |
| 2 | HIST1H3C | HIST1H3C | HIST1H3C | 5 | 1.1 | 0.081 | YES |
| 3 | HIST1H2BL | HIST1H2BL | HIST1H2BL | 11 | 0.96 | 0.12 | YES |
| 4 | HIST1H2AB | HIST1H2AB | HIST1H2AB | 22 | 0.9 | 0.15 | YES |
| 5 | HIST1H3A | HIST1H3A | HIST1H3A | 67 | 0.76 | 0.17 | YES |
| 6 | HIST1H3H | HIST1H3H | HIST1H3H | 139 | 0.67 | 0.19 | YES |
| 7 | HIST1H4C | HIST1H4C | HIST1H4C | 170 | 0.65 | 0.22 | YES |
| 8 | HIST1H4D | HIST1H4D | HIST1H4D | 174 | 0.64 | 0.24 | YES |
| 9 | HIST1H4J | HIST1H4J | HIST1H4J | 190 | 0.63 | 0.26 | YES |
| 10 | HIST1H2BM | HIST1H2BM | HIST1H2BM | 217 | 0.61 | 0.28 | YES |
| 11 | HIST1H2BA | HIST1H2BA | HIST1H2BA | 268 | 0.57 | 0.3 | YES |
| 12 | HIST1H2AE | HIST1H2AE | HIST1H2AE | 273 | 0.57 | 0.32 | YES |
| 13 | HIST1H2BE | HIST1H2BE | HIST1H2BE | 353 | 0.53 | 0.34 | YES |
| 14 | HIST1H2BO | HIST1H2BO | HIST1H2BO | 374 | 0.53 | 0.35 | YES |
| 15 | DMC1 | DMC1 | DMC1 | 437 | 0.5 | 0.37 | YES |
| 16 | HIST1H2BB | HIST1H2BB | HIST1H2BB | 454 | 0.49 | 0.39 | YES |
| 17 | HIST1H2AC | HIST1H2AC | HIST1H2AC | 485 | 0.48 | 0.4 | YES |
| 18 | HIST1H4H | HIST1H4H | HIST1H4H | 487 | 0.48 | 0.42 | YES |
| 19 | HIST1H2BG | HIST1H2BG | HIST1H2BG | 558 | 0.46 | 0.43 | YES |
| 20 | HIST1H2BD | HIST1H2BD | HIST1H2BD | 569 | 0.46 | 0.45 | YES |
| 21 | HIST1H4E | HIST1H4E | HIST1H4E | 574 | 0.45 | 0.46 | YES |
| 22 | HIST1H4K | HIST1H4K | HIST1H4K | 597 | 0.45 | 0.48 | YES |
| 23 | MSH4 | MSH4 | MSH4 | 606 | 0.44 | 0.5 | YES |
| 24 | HIST1H4I | HIST1H4I | HIST1H4I | 733 | 0.41 | 0.5 | YES |
| 25 | HIST1H2BK | HIST1H2BK | HIST1H2BK | 845 | 0.38 | 0.51 | YES |
| 26 | SMC1B | SMC1B | SMC1B | 874 | 0.38 | 0.52 | YES |
| 27 | HIST3H2BB | HIST3H2BB | HIST3H2BB | 883 | 0.38 | 0.54 | YES |
| 28 | HIST1H2BC | HIST1H2BC | HIST1H2BC | 885 | 0.38 | 0.55 | YES |
| 29 | HIST1H2BJ | HIST1H2BJ | HIST1H2BJ | 1103 | 0.34 | 0.55 | YES |
| 30 | HIST1H3I | HIST1H3I | HIST1H3I | 1114 | 0.33 | 0.56 | YES |
| 31 | HIST1H3B | HIST1H3B | HIST1H3B | 1144 | 0.33 | 0.57 | YES |
| 32 | FKBP6 | FKBP6 | FKBP6 | 1297 | 0.31 | 0.58 | YES |
| 33 | HIST1H3G | HIST1H3G | HIST1H3G | 1307 | 0.31 | 0.59 | YES |
| 34 | HIST1H3D | HIST1H3D | HIST1H3D | 1392 | 0.3 | 0.59 | YES |
| 35 | RAD51 | RAD51 | RAD51 | 1474 | 0.29 | 0.6 | YES |
| 36 | HIST1H2BF | HIST1H2BF | HIST1H2BF | 1571 | 0.28 | 0.6 | YES |
| 37 | BLM | BLM | BLM | 1610 | 0.27 | 0.61 | YES |
| 38 | SYCP2 | SYCP2 | SYCP2 | 1711 | 0.26 | 0.62 | YES |
| 39 | SYCP3 | SYCP3 | SYCP3 | 1718 | 0.26 | 0.63 | YES |
| 40 | HIST1H4F | HIST1H4F | HIST1H4F | 1831 | 0.25 | 0.63 | YES |
| 41 | HIST1H4B | HIST1H4B | HIST1H4B | 1838 | 0.25 | 0.64 | YES |
| 42 | TEX12 | TEX12 | TEX12 | 1960 | 0.23 | 0.64 | YES |
| 43 | HIST1H2AD | HIST1H2AD | HIST1H2AD | 1989 | 0.23 | 0.65 | YES |
| 44 | HIST4H4 | HIST4H4 | HIST4H4 | 2055 | 0.23 | 0.65 | YES |
| 45 | HIST1H2BI | HIST1H2BI | HIST1H2BI | 2106 | 0.22 | 0.66 | YES |
| 46 | SYCP1 | SYCP1 | SYCP1 | 2171 | 0.22 | 0.66 | YES |
| 47 | HIST1H3E | HIST1H3E | HIST1H3E | 2206 | 0.21 | 0.67 | YES |
| 48 | MND1 | MND1 | MND1 | 2722 | 0.18 | 0.65 | NO |
| 49 | HIST1H2BH | HIST1H2BH | HIST1H2BH | 2727 | 0.18 | 0.65 | NO |
| 50 | HIST1H4A | HIST1H4A | HIST1H4A | 3146 | 0.16 | 0.64 | NO |
| 51 | SYNE2 | SYNE2 | SYNE2 | 3148 | 0.16 | 0.64 | NO |
| 52 | NBN | NBN | NBN | 3607 | 0.14 | 0.62 | NO |
| 53 | STAG3 | STAG3 | STAG3 | 4065 | 0.12 | 0.6 | NO |
| 54 | BRCA2 | BRCA2 | BRCA2 | 4121 | 0.12 | 0.6 | NO |
| 55 | HIST2H2BE | HIST2H2BE | HIST2H2BE | 4377 | 0.11 | 0.6 | NO |
| 56 | HIST1H2BN | HIST1H2BN | HIST1H2BN | 4694 | 0.1 | 0.58 | NO |
| 57 | HIST1H3J | HIST1H3J | HIST1H3J | 4843 | 0.097 | 0.58 | NO |
| 58 | REC8 | REC8 | REC8 | 5320 | 0.084 | 0.56 | NO |
| 59 | SMC3 | SMC3 | SMC3 | 5412 | 0.081 | 0.56 | NO |
| 60 | ATR | ATR | ATR | 5525 | 0.078 | 0.55 | NO |
| 61 | CDK2 | CDK2 | CDK2 | 5663 | 0.074 | 0.55 | NO |
| 62 | RPA1 | RPA1 | RPA1 | 5703 | 0.074 | 0.55 | NO |
| 63 | RAD51C | RAD51C | RAD51C | 5923 | 0.068 | 0.54 | NO |
| 64 | H3F3A | H3F3A | H3F3A | 6142 | 0.062 | 0.53 | NO |
| 65 | BRCA1 | BRCA1 | BRCA1 | 6310 | 0.058 | 0.52 | NO |
| 66 | HIST1H3F | HIST1H3F | HIST1H3F | 6360 | 0.057 | 0.52 | NO |
| 67 | ATM | ATM | ATM | 6421 | 0.056 | 0.52 | NO |
| 68 | RBBP8 | RBBP8 | RBBP8 | 6444 | 0.055 | 0.52 | NO |
| 69 | POT1 | POT1 | POT1 | 6678 | 0.049 | 0.51 | NO |
| 70 | DIDO1 | DIDO1 | DIDO1 | 6879 | 0.045 | 0.5 | NO |
| 71 | RPA3 | RPA3 | RPA3 | 7048 | 0.04 | 0.5 | NO |
| 72 | CDK4 | CDK4 | CDK4 | 7101 | 0.039 | 0.49 | NO |
| 73 | RAD21 | RAD21 | RAD21 | 7126 | 0.038 | 0.49 | NO |
| 74 | STAG1 | STAG1 | STAG1 | 7804 | 0.024 | 0.46 | NO |
| 75 | SMC1A | SMC1A | SMC1A | 7841 | 0.023 | 0.46 | NO |
| 76 | STAG2 | STAG2 | STAG2 | 7843 | 0.023 | 0.46 | NO |
| 77 | UBE2I | UBE2I | UBE2I | 7859 | 0.023 | 0.46 | NO |
| 78 | PRDM9 | PRDM9 | PRDM9 | 8065 | 0.018 | 0.45 | NO |
| 79 | HIST2H3D | HIST2H3D | HIST2H3D | 8215 | 0.014 | 0.44 | NO |
| 80 | TERF2IP | TERF2IP | TERF2IP | 9522 | -0.017 | 0.37 | NO |
| 81 | RPA2 | RPA2 | RPA2 | 9883 | -0.025 | 0.36 | NO |
| 82 | ACD | ACD | ACD | 9974 | -0.028 | 0.35 | NO |
| 83 | MRE11A | MRE11A | MRE11A | 10118 | -0.032 | 0.34 | NO |
| 84 | MLH1 | MLH1 | MLH1 | 10345 | -0.038 | 0.33 | NO |
| 85 | RAD50 | RAD50 | RAD50 | 10600 | -0.044 | 0.32 | NO |
| 86 | HIST1H4L | HIST1H4L | HIST1H4L | 10796 | -0.05 | 0.31 | NO |
| 87 | H2AFZ | H2AFZ | H2AFZ | 10901 | -0.053 | 0.31 | NO |
| 88 | TOP3A | TOP3A | TOP3A | 10961 | -0.055 | 0.31 | NO |
| 89 | TERF2 | TERF2 | TERF2 | 11071 | -0.058 | 0.31 | NO |
| 90 | HIST2H2AC | HIST2H2AC | HIST2H2AC | 11111 | -0.059 | 0.31 | NO |
| 91 | SUN2 | SUN2 | SUN2 | 11727 | -0.076 | 0.28 | NO |
| 92 | H3F3B | H3F3B | H3F3B | 12581 | -0.1 | 0.24 | NO |
| 93 | MLH3 | MLH3 | MLH3 | 12823 | -0.12 | 0.23 | NO |
| 94 | MSH5 | MSH5 | MSH5 | 13171 | -0.13 | 0.21 | NO |
| 95 | LMNB1 | LMNB1 | LMNB1 | 13204 | -0.13 | 0.22 | NO |
| 96 | TINF2 | TINF2 | TINF2 | 13335 | -0.14 | 0.21 | NO |
| 97 | HIST2H2AA3 | HIST2H2AA3 | HIST2H2AA3 | 13602 | -0.15 | 0.2 | NO |
| 98 | SYNE1 | SYNE1 | SYNE1 | 13610 | -0.15 | 0.21 | NO |
| 99 | H2AFX | H2AFX | H2AFX | 14283 | -0.19 | 0.18 | NO |
| 100 | TERF1 | TERF1 | TERF1 | 14294 | -0.19 | 0.19 | NO |
| 101 | HSPA2 | HSPA2 | HSPA2 | 14636 | -0.21 | 0.18 | NO |
| 102 | HIST2H4A | HIST2H4A | HIST2H4A | 14707 | -0.22 | 0.18 | NO |
| 103 | LMNA | LMNA | LMNA | 16353 | -0.36 | 0.11 | NO |
| 104 | TEX15 | TEX15 | TEX15 | 17112 | -0.45 | 0.085 | NO |
| 105 | HIST2H3C | HIST2H3C | HIST2H3C | 17361 | -0.48 | 0.089 | NO |
Figure S25. Get High-res Image This plot shows mRNAseq_cNMF expression data heatmap (on the left) a RunningEnrichmentScore(RES) plot (on the top right) and a Signal2Noise(S2N) plot (on the bottom right) of genes in the pathway: REACTOME FORMATION OF THE TERNARY COMPLEX AND SUBSEQUENTLY THE 43S COMPLEX.

Figure S26. Get High-res Image For the top 5 core enriched genes in the pathway: REACTOME FORMATION OF THE TERNARY COMPLEX AND SUBSEQUENTLY THE 43S COMPLEX, this volcano plot shows how much they are up/down-regulated and significant. The significance was calculated by empirical bayesian fit

Table S14. Get Full Table This table shows a Running Enrichment Score (RES) of each gene in this pathway, that is, the enrichment score at this point in the ranked list of genes. All genes are ranked by Signal-to-Noise (S2N), a measure of similarity as default and are used to obtain ES matrix of all genes. In this way, GSEA tool uses expression pattern of not only overlapped genes but also not-overlapped genes to produce ES matrix.
| Rank | GENE | SYMBOL | DESC | LIST.LOC | S2N | RES | CORE_ENRICHMENT |
|---|---|---|---|---|---|---|---|
| 1 | HIST1H2AJ | HIST1H2AJ | HIST1H2AJ | 3 | 1.1 | 0.058 | YES |
| 2 | HIST1H2BL | HIST1H2BL | HIST1H2BL | 11 | 0.96 | 0.11 | YES |
| 3 | HIST1H2AB | HIST1H2AB | HIST1H2AB | 22 | 0.9 | 0.15 | YES |
| 4 | HIST1H4C | HIST1H4C | HIST1H4C | 170 | 0.65 | 0.18 | YES |
| 5 | HIST1H4D | HIST1H4D | HIST1H4D | 174 | 0.64 | 0.21 | YES |
| 6 | HIST1H4J | HIST1H4J | HIST1H4J | 190 | 0.63 | 0.24 | YES |
| 7 | HIST1H2BM | HIST1H2BM | HIST1H2BM | 217 | 0.61 | 0.27 | YES |
| 8 | HIST1H2BA | HIST1H2BA | HIST1H2BA | 268 | 0.57 | 0.3 | YES |
| 9 | HIST1H2AE | HIST1H2AE | HIST1H2AE | 273 | 0.57 | 0.33 | YES |
| 10 | HIST1H2BE | HIST1H2BE | HIST1H2BE | 353 | 0.53 | 0.35 | YES |
| 11 | HIST1H2BO | HIST1H2BO | HIST1H2BO | 374 | 0.53 | 0.38 | YES |
| 12 | HIST1H2BB | HIST1H2BB | HIST1H2BB | 454 | 0.49 | 0.4 | YES |
| 13 | HIST1H2AC | HIST1H2AC | HIST1H2AC | 485 | 0.48 | 0.42 | YES |
| 14 | HIST1H4H | HIST1H4H | HIST1H4H | 487 | 0.48 | 0.45 | YES |
| 15 | HIST1H2BG | HIST1H2BG | HIST1H2BG | 558 | 0.46 | 0.47 | YES |
| 16 | HIST1H2BD | HIST1H2BD | HIST1H2BD | 569 | 0.46 | 0.49 | YES |
| 17 | HIST1H4E | HIST1H4E | HIST1H4E | 574 | 0.45 | 0.51 | YES |
| 18 | HIST1H4K | HIST1H4K | HIST1H4K | 597 | 0.45 | 0.54 | YES |
| 19 | HIST1H4I | HIST1H4I | HIST1H4I | 733 | 0.41 | 0.55 | YES |
| 20 | HIST1H2BK | HIST1H2BK | HIST1H2BK | 845 | 0.38 | 0.56 | YES |
| 21 | SMC1B | SMC1B | SMC1B | 874 | 0.38 | 0.58 | YES |
| 22 | HIST3H2BB | HIST3H2BB | HIST3H2BB | 883 | 0.38 | 0.6 | YES |
| 23 | HIST1H2BC | HIST1H2BC | HIST1H2BC | 885 | 0.38 | 0.62 | YES |
| 24 | HIST1H2BJ | HIST1H2BJ | HIST1H2BJ | 1103 | 0.34 | 0.62 | YES |
| 25 | FKBP6 | FKBP6 | FKBP6 | 1297 | 0.31 | 0.63 | YES |
| 26 | HIST1H2BF | HIST1H2BF | HIST1H2BF | 1571 | 0.28 | 0.63 | YES |
| 27 | SYCP2 | SYCP2 | SYCP2 | 1711 | 0.26 | 0.64 | YES |
| 28 | SYCP3 | SYCP3 | SYCP3 | 1718 | 0.26 | 0.65 | YES |
| 29 | HIST1H4F | HIST1H4F | HIST1H4F | 1831 | 0.25 | 0.66 | YES |
| 30 | HIST1H4B | HIST1H4B | HIST1H4B | 1838 | 0.25 | 0.67 | YES |
| 31 | TEX12 | TEX12 | TEX12 | 1960 | 0.23 | 0.68 | YES |
| 32 | HIST1H2AD | HIST1H2AD | HIST1H2AD | 1989 | 0.23 | 0.69 | YES |
| 33 | HIST4H4 | HIST4H4 | HIST4H4 | 2055 | 0.23 | 0.69 | YES |
| 34 | HIST1H2BI | HIST1H2BI | HIST1H2BI | 2106 | 0.22 | 0.7 | YES |
| 35 | SYCP1 | SYCP1 | SYCP1 | 2171 | 0.22 | 0.71 | YES |
| 36 | HIST1H2BH | HIST1H2BH | HIST1H2BH | 2727 | 0.18 | 0.69 | NO |
| 37 | HIST1H4A | HIST1H4A | HIST1H4A | 3146 | 0.16 | 0.68 | NO |
| 38 | SYNE2 | SYNE2 | SYNE2 | 3148 | 0.16 | 0.68 | NO |
| 39 | STAG3 | STAG3 | STAG3 | 4065 | 0.12 | 0.64 | NO |
| 40 | HIST2H2BE | HIST2H2BE | HIST2H2BE | 4377 | 0.11 | 0.63 | NO |
| 41 | HIST1H2BN | HIST1H2BN | HIST1H2BN | 4694 | 0.1 | 0.62 | NO |
| 42 | REC8 | REC8 | REC8 | 5320 | 0.084 | 0.59 | NO |
| 43 | SMC3 | SMC3 | SMC3 | 5412 | 0.081 | 0.59 | NO |
| 44 | ATR | ATR | ATR | 5525 | 0.078 | 0.59 | NO |
| 45 | BRCA1 | BRCA1 | BRCA1 | 6310 | 0.058 | 0.55 | NO |
| 46 | POT1 | POT1 | POT1 | 6678 | 0.049 | 0.53 | NO |
| 47 | DIDO1 | DIDO1 | DIDO1 | 6879 | 0.045 | 0.53 | NO |
| 48 | RAD21 | RAD21 | RAD21 | 7126 | 0.038 | 0.52 | NO |
| 49 | STAG1 | STAG1 | STAG1 | 7804 | 0.024 | 0.48 | NO |
| 50 | SMC1A | SMC1A | SMC1A | 7841 | 0.023 | 0.48 | NO |
| 51 | STAG2 | STAG2 | STAG2 | 7843 | 0.023 | 0.48 | NO |
| 52 | UBE2I | UBE2I | UBE2I | 7859 | 0.023 | 0.48 | NO |
| 53 | TERF2IP | TERF2IP | TERF2IP | 9522 | -0.017 | 0.4 | NO |
| 54 | ACD | ACD | ACD | 9974 | -0.028 | 0.37 | NO |
| 55 | HIST1H4L | HIST1H4L | HIST1H4L | 10796 | -0.05 | 0.33 | NO |
| 56 | H2AFZ | H2AFZ | H2AFZ | 10901 | -0.053 | 0.33 | NO |
| 57 | TERF2 | TERF2 | TERF2 | 11071 | -0.058 | 0.32 | NO |
| 58 | HIST2H2AC | HIST2H2AC | HIST2H2AC | 11111 | -0.059 | 0.32 | NO |
| 59 | SUN2 | SUN2 | SUN2 | 11727 | -0.076 | 0.3 | NO |
| 60 | LMNB1 | LMNB1 | LMNB1 | 13204 | -0.13 | 0.22 | NO |
| 61 | TINF2 | TINF2 | TINF2 | 13335 | -0.14 | 0.22 | NO |
| 62 | HIST2H2AA3 | HIST2H2AA3 | HIST2H2AA3 | 13602 | -0.15 | 0.22 | NO |
| 63 | SYNE1 | SYNE1 | SYNE1 | 13610 | -0.15 | 0.23 | NO |
| 64 | H2AFX | H2AFX | H2AFX | 14283 | -0.19 | 0.2 | NO |
| 65 | TERF1 | TERF1 | TERF1 | 14294 | -0.19 | 0.21 | NO |
| 66 | HSPA2 | HSPA2 | HSPA2 | 14636 | -0.21 | 0.2 | NO |
| 67 | HIST2H4A | HIST2H4A | HIST2H4A | 14707 | -0.22 | 0.21 | NO |
| 68 | LMNA | LMNA | LMNA | 16353 | -0.36 | 0.14 | NO |
Figure S27. Get High-res Image This plot shows mRNAseq_cNMF expression data heatmap (on the left) a RunningEnrichmentScore(RES) plot (on the top right) and a Signal2Noise(S2N) plot (on the bottom right) of genes in the pathway: REACTOME MEIOSIS.

Figure S28. Get High-res Image For the top 5 core enriched genes in the pathway: REACTOME MEIOSIS, this volcano plot shows how much they are up/down-regulated and significant. The significance was calculated by empirical bayesian fit

Table S15. Get Full Table This table shows a Running Enrichment Score (RES) of each gene in this pathway, that is, the enrichment score at this point in the ranked list of genes. All genes are ranked by Signal-to-Noise (S2N), a measure of similarity as default and are used to obtain ES matrix of all genes. In this way, GSEA tool uses expression pattern of not only overlapped genes but also not-overlapped genes to produce ES matrix.
| Rank | GENE | SYMBOL | DESC | LIST.LOC | S2N | RES | CORE_ENRICHMENT |
|---|---|---|---|---|---|---|---|
| 1 | HIST1H2AJ | HIST1H2AJ | HIST1H2AJ | 3 | 1.1 | 0.044 | YES |
| 2 | HIST1H3C | HIST1H3C | HIST1H3C | 5 | 1.1 | 0.086 | YES |
| 3 | HIST1H2BL | HIST1H2BL | HIST1H2BL | 11 | 0.96 | 0.12 | YES |
| 4 | HIST1H2AB | HIST1H2AB | HIST1H2AB | 22 | 0.9 | 0.16 | YES |
| 5 | HIST1H3A | HIST1H3A | HIST1H3A | 67 | 0.76 | 0.18 | YES |
| 6 | HIST1H3H | HIST1H3H | HIST1H3H | 139 | 0.67 | 0.2 | YES |
| 7 | HIST1H4C | HIST1H4C | HIST1H4C | 170 | 0.65 | 0.23 | YES |
| 8 | HIST1H4D | HIST1H4D | HIST1H4D | 174 | 0.64 | 0.25 | YES |
| 9 | HIST1H4J | HIST1H4J | HIST1H4J | 190 | 0.63 | 0.28 | YES |
| 10 | HIST1H2BM | HIST1H2BM | HIST1H2BM | 217 | 0.61 | 0.3 | YES |
| 11 | HIST1H2BA | HIST1H2BA | HIST1H2BA | 268 | 0.57 | 0.32 | YES |
| 12 | HIST1H2AE | HIST1H2AE | HIST1H2AE | 273 | 0.57 | 0.34 | YES |
| 13 | HIST1H2BE | HIST1H2BE | HIST1H2BE | 353 | 0.53 | 0.36 | YES |
| 14 | HIST1H2BO | HIST1H2BO | HIST1H2BO | 374 | 0.53 | 0.37 | YES |
| 15 | HIST1H2BB | HIST1H2BB | HIST1H2BB | 454 | 0.49 | 0.39 | YES |
| 16 | HIST1H2AC | HIST1H2AC | HIST1H2AC | 485 | 0.48 | 0.41 | YES |
| 17 | HIST1H4H | HIST1H4H | HIST1H4H | 487 | 0.48 | 0.42 | YES |
| 18 | HIST1H2BG | HIST1H2BG | HIST1H2BG | 558 | 0.46 | 0.44 | YES |
| 19 | HIST1H2BD | HIST1H2BD | HIST1H2BD | 569 | 0.46 | 0.46 | YES |
| 20 | HIST1H4E | HIST1H4E | HIST1H4E | 574 | 0.45 | 0.47 | YES |
| 21 | HIST1H4K | HIST1H4K | HIST1H4K | 597 | 0.45 | 0.49 | YES |
| 22 | HIST1H4I | HIST1H4I | HIST1H4I | 733 | 0.41 | 0.5 | YES |
| 23 | HIST1H2BK | HIST1H2BK | HIST1H2BK | 845 | 0.38 | 0.51 | YES |
| 24 | HIST3H2BB | HIST3H2BB | HIST3H2BB | 883 | 0.38 | 0.52 | YES |
| 25 | HIST1H2BC | HIST1H2BC | HIST1H2BC | 885 | 0.38 | 0.53 | YES |
| 26 | HIST1H2BJ | HIST1H2BJ | HIST1H2BJ | 1103 | 0.34 | 0.53 | YES |
| 27 | HIST1H3I | HIST1H3I | HIST1H3I | 1114 | 0.33 | 0.55 | YES |
| 28 | HIST1H3B | HIST1H3B | HIST1H3B | 1144 | 0.33 | 0.56 | YES |
| 29 | LZTS1 | LZTS1 | LZTS1 | 1283 | 0.31 | 0.56 | YES |
| 30 | HIST1H3G | HIST1H3G | HIST1H3G | 1307 | 0.31 | 0.57 | YES |
| 31 | HIST1H3D | HIST1H3D | HIST1H3D | 1392 | 0.3 | 0.58 | YES |
| 32 | ERCC6 | ERCC6 | ERCC6 | 1555 | 0.28 | 0.58 | YES |
| 33 | HIST1H2BF | HIST1H2BF | HIST1H2BF | 1571 | 0.28 | 0.59 | YES |
| 34 | HIST1H4F | HIST1H4F | HIST1H4F | 1831 | 0.25 | 0.59 | YES |
| 35 | HIST1H4B | HIST1H4B | HIST1H4B | 1838 | 0.25 | 0.6 | YES |
| 36 | HIST1H2AD | HIST1H2AD | HIST1H2AD | 1989 | 0.23 | 0.6 | YES |
| 37 | HIST4H4 | HIST4H4 | HIST4H4 | 2055 | 0.23 | 0.6 | YES |
| 38 | HIST1H2BI | HIST1H2BI | HIST1H2BI | 2106 | 0.22 | 0.61 | YES |
| 39 | HIST1H3E | HIST1H3E | HIST1H3E | 2206 | 0.21 | 0.61 | YES |
| 40 | SNAPC4 | SNAPC4 | SNAPC4 | 2264 | 0.21 | 0.62 | YES |
| 41 | MTERF | MTERF | MTERF | 2321 | 0.21 | 0.62 | YES |
| 42 | POLR3C | POLR3C | POLR3C | 2509 | 0.19 | 0.62 | YES |
| 43 | SNAPC1 | SNAPC1 | SNAPC1 | 2563 | 0.19 | 0.62 | YES |
| 44 | POLR2K | POLR2K | POLR2K | 2726 | 0.18 | 0.62 | YES |
| 45 | HIST1H2BH | HIST1H2BH | HIST1H2BH | 2727 | 0.18 | 0.63 | YES |
| 46 | HIST1H4A | HIST1H4A | HIST1H4A | 3146 | 0.16 | 0.61 | NO |
| 47 | POU2F1 | POU2F1 | POU2F1 | 3280 | 0.15 | 0.61 | NO |
| 48 | CBX3 | CBX3 | CBX3 | 3296 | 0.15 | 0.62 | NO |
| 49 | BRF2 | BRF2 | BRF2 | 3378 | 0.15 | 0.62 | NO |
| 50 | POLRMT | POLRMT | POLRMT | 3469 | 0.14 | 0.62 | NO |
| 51 | POLR2F | POLR2F | POLR2F | 3501 | 0.14 | 0.62 | NO |
| 52 | POLR3D | POLR3D | POLR3D | 3939 | 0.12 | 0.6 | NO |
| 53 | TAF1B | TAF1B | TAF1B | 4045 | 0.12 | 0.6 | NO |
| 54 | GTF3C2 | GTF3C2 | GTF3C2 | 4090 | 0.12 | 0.61 | NO |
| 55 | POLR1C | POLR1C | POLR1C | 4150 | 0.12 | 0.61 | NO |
| 56 | KAT2B | KAT2B | KAT2B | 4156 | 0.12 | 0.61 | NO |
| 57 | HIST2H2BE | HIST2H2BE | HIST2H2BE | 4377 | 0.11 | 0.6 | NO |
| 58 | POLR3A | POLR3A | POLR3A | 4401 | 0.11 | 0.61 | NO |
| 59 | POLR3B | POLR3B | POLR3B | 4412 | 0.11 | 0.61 | NO |
| 60 | GTF3C3 | GTF3C3 | GTF3C3 | 4430 | 0.11 | 0.62 | NO |
| 61 | GTF3C4 | GTF3C4 | GTF3C4 | 4595 | 0.1 | 0.61 | NO |
| 62 | HIST1H2BN | HIST1H2BN | HIST1H2BN | 4694 | 0.1 | 0.61 | NO |
| 63 | HIST1H3J | HIST1H3J | HIST1H3J | 4843 | 0.097 | 0.6 | NO |
| 64 | TFB2M | TFB2M | TFB2M | 5158 | 0.088 | 0.59 | NO |
| 65 | SNAPC2 | SNAPC2 | SNAPC2 | 5399 | 0.082 | 0.58 | NO |
| 66 | POLR1B | POLR1B | POLR1B | 5978 | 0.066 | 0.55 | NO |
| 67 | GTF2H2B | GTF2H2B | GTF2H2B | 6034 | 0.065 | 0.55 | NO |
| 68 | POLR1A | POLR1A | POLR1A | 6094 | 0.064 | 0.55 | NO |
| 69 | H3F3A | H3F3A | H3F3A | 6142 | 0.062 | 0.55 | NO |
| 70 | SNAPC3 | SNAPC3 | SNAPC3 | 6147 | 0.062 | 0.56 | NO |
| 71 | CDK7 | CDK7 | CDK7 | 6222 | 0.06 | 0.55 | NO |
| 72 | HIST1H3F | HIST1H3F | HIST1H3F | 6360 | 0.057 | 0.55 | NO |
| 73 | TAF1C | TAF1C | TAF1C | 6597 | 0.051 | 0.54 | NO |
| 74 | ZNF143 | ZNF143 | ZNF143 | 6618 | 0.05 | 0.54 | NO |
| 75 | TBP | TBP | TBP | 7140 | 0.038 | 0.51 | NO |
| 76 | POLR3F | POLR3F | POLR3F | 7371 | 0.033 | 0.5 | NO |
| 77 | RRN3 | RRN3 | RRN3 | 7704 | 0.026 | 0.49 | NO |
| 78 | ERCC3 | ERCC3 | ERCC3 | 7748 | 0.025 | 0.48 | NO |
| 79 | HIST2H3D | HIST2H3D | HIST2H3D | 8215 | 0.014 | 0.46 | NO |
| 80 | SNAPC5 | SNAPC5 | SNAPC5 | 8236 | 0.014 | 0.46 | NO |
| 81 | MNAT1 | MNAT1 | MNAT1 | 8285 | 0.012 | 0.46 | NO |
| 82 | POLR3E | POLR3E | POLR3E | 8484 | 0.0074 | 0.45 | NO |
| 83 | ERCC2 | ERCC2 | ERCC2 | 8570 | 0.0054 | 0.44 | NO |
| 84 | GTF3C5 | GTF3C5 | GTF3C5 | 8768 | 0.001 | 0.43 | NO |
| 85 | GTF2H4 | GTF2H4 | GTF2H4 | 8981 | -0.0036 | 0.42 | NO |
| 86 | POLR1D | POLR1D | POLR1D | 9021 | -0.0047 | 0.42 | NO |
| 87 | GTF2H2 | GTF2H2 | GTF2H2 | 9093 | -0.0066 | 0.42 | NO |
| 88 | TFAM | TFAM | TFAM | 9285 | -0.011 | 0.41 | NO |
| 89 | TAF1A | TAF1A | TAF1A | 9663 | -0.02 | 0.39 | NO |
| 90 | POLR2H | POLR2H | POLR2H | 9671 | -0.02 | 0.39 | NO |
| 91 | BRF1 | BRF1 | BRF1 | 9706 | -0.021 | 0.39 | NO |
| 92 | UBTF | UBTF | UBTF | 9767 | -0.022 | 0.38 | NO |
| 93 | MBD2 | MBD2 | MBD2 | 9966 | -0.028 | 0.38 | NO |
| 94 | POLR2E | POLR2E | POLR2E | 10049 | -0.03 | 0.37 | NO |
| 95 | GTF2H1 | GTF2H1 | GTF2H1 | 10225 | -0.035 | 0.36 | NO |
| 96 | POLR2L | POLR2L | POLR2L | 10762 | -0.049 | 0.34 | NO |
| 97 | HIST1H4L | HIST1H4L | HIST1H4L | 10796 | -0.05 | 0.34 | NO |
| 98 | SSB | SSB | SSB | 10798 | -0.05 | 0.34 | NO |
| 99 | H2AFZ | H2AFZ | H2AFZ | 10901 | -0.053 | 0.34 | NO |
| 100 | HIST2H2AC | HIST2H2AC | HIST2H2AC | 11111 | -0.059 | 0.33 | NO |
| 101 | GTF2H3 | GTF2H3 | GTF2H3 | 11435 | -0.068 | 0.31 | NO |
| 102 | POLR3H | POLR3H | POLR3H | 11550 | -0.071 | 0.31 | NO |
| 103 | CCNH | CCNH | CCNH | 11717 | -0.076 | 0.3 | NO |
| 104 | POLR3K | POLR3K | POLR3K | 12275 | -0.094 | 0.28 | NO |
| 105 | H3F3B | H3F3B | H3F3B | 12581 | -0.1 | 0.27 | NO |
| 106 | MAPK3 | MAPK3 | MAPK3 | 12625 | -0.11 | 0.27 | NO |
| 107 | PTRF | PTRF | PTRF | 13591 | -0.15 | 0.22 | NO |
| 108 | HIST2H2AA3 | HIST2H2AA3 | HIST2H2AA3 | 13602 | -0.15 | 0.23 | NO |
| 109 | NFIB | NFIB | NFIB | 13667 | -0.15 | 0.23 | NO |
| 110 | POLR3GL | POLR3GL | POLR3GL | 14067 | -0.18 | 0.22 | NO |
| 111 | H2AFX | H2AFX | H2AFX | 14283 | -0.19 | 0.21 | NO |
| 112 | HIST2H4A | HIST2H4A | HIST2H4A | 14707 | -0.22 | 0.2 | NO |
| 113 | EHMT2 | EHMT2 | EHMT2 | 15977 | -0.33 | 0.14 | NO |
| 114 | HIST2H3C | HIST2H3C | HIST2H3C | 17361 | -0.48 | 0.089 | NO |
Figure S29. Get High-res Image This plot shows mRNAseq_cNMF expression data heatmap (on the left) a RunningEnrichmentScore(RES) plot (on the top right) and a Signal2Noise(S2N) plot (on the bottom right) of genes in the pathway: REACTOME ACTIVATION OF THE MRNA UPON BINDING OF THE CAP BINDING COMPLEX AND EIFS AND SUBSEQUENT BINDING TO 43S.

Figure S30. Get High-res Image For the top 5 core enriched genes in the pathway: REACTOME ACTIVATION OF THE MRNA UPON BINDING OF THE CAP BINDING COMPLEX AND EIFS AND SUBSEQUENT BINDING TO 43S, this volcano plot shows how much they are up/down-regulated and significant. The significance was calculated by empirical bayesian fit
Table S16. Get Full Table This table shows a Running Enrichment Score (RES) of each gene in this pathway, that is, the enrichment score at this point in the ranked list of genes. All genes are ranked by Signal-to-Noise (S2N), a measure of similarity as default and are used to obtain ES matrix of all genes. In this way, GSEA tool uses expression pattern of not only overlapped genes but also not-overlapped genes to produce ES matrix.
| Rank | GENE | SYMBOL | DESC | LIST.LOC | S2N | RES | CORE_ENRICHMENT |
|---|---|---|---|---|---|---|---|
| 1 | LZTS1 | LZTS1 | LZTS1 | 1283 | 0.31 | 0.028 | YES |
| 2 | SNAPC4 | SNAPC4 | SNAPC4 | 2264 | 0.21 | 0.04 | YES |
| 3 | POLR3C | POLR3C | POLR3C | 2509 | 0.19 | 0.086 | YES |
| 4 | SNAPC1 | SNAPC1 | SNAPC1 | 2563 | 0.19 | 0.14 | YES |
| 5 | POLR2K | POLR2K | POLR2K | 2726 | 0.18 | 0.19 | YES |
| 6 | POU2F1 | POU2F1 | POU2F1 | 3280 | 0.15 | 0.21 | YES |
| 7 | BRF2 | BRF2 | BRF2 | 3378 | 0.15 | 0.25 | YES |
| 8 | POLR2F | POLR2F | POLR2F | 3501 | 0.14 | 0.28 | YES |
| 9 | POLR3D | POLR3D | POLR3D | 3939 | 0.12 | 0.3 | YES |
| 10 | GTF3C2 | GTF3C2 | GTF3C2 | 4090 | 0.12 | 0.33 | YES |
| 11 | POLR1C | POLR1C | POLR1C | 4150 | 0.12 | 0.36 | YES |
| 12 | POLR3A | POLR3A | POLR3A | 4401 | 0.11 | 0.38 | YES |
| 13 | POLR3B | POLR3B | POLR3B | 4412 | 0.11 | 0.41 | YES |
| 14 | GTF3C3 | GTF3C3 | GTF3C3 | 4430 | 0.11 | 0.44 | YES |
| 15 | GTF3C4 | GTF3C4 | GTF3C4 | 4595 | 0.1 | 0.47 | YES |
| 16 | SNAPC2 | SNAPC2 | SNAPC2 | 5399 | 0.082 | 0.45 | NO |
| 17 | SNAPC3 | SNAPC3 | SNAPC3 | 6147 | 0.062 | 0.43 | NO |
| 18 | ZNF143 | ZNF143 | ZNF143 | 6618 | 0.05 | 0.42 | NO |
| 19 | TBP | TBP | TBP | 7140 | 0.038 | 0.4 | NO |
| 20 | POLR3F | POLR3F | POLR3F | 7371 | 0.033 | 0.4 | NO |
| 21 | SNAPC5 | SNAPC5 | SNAPC5 | 8236 | 0.014 | 0.36 | NO |
| 22 | POLR3E | POLR3E | POLR3E | 8484 | 0.0074 | 0.35 | NO |
| 23 | GTF3C5 | GTF3C5 | GTF3C5 | 8768 | 0.001 | 0.34 | NO |
| 24 | POLR1D | POLR1D | POLR1D | 9021 | -0.0047 | 0.32 | NO |
| 25 | POLR2H | POLR2H | POLR2H | 9671 | -0.02 | 0.3 | NO |
| 26 | BRF1 | BRF1 | BRF1 | 9706 | -0.021 | 0.3 | NO |
| 27 | POLR2E | POLR2E | POLR2E | 10049 | -0.03 | 0.29 | NO |
| 28 | POLR2L | POLR2L | POLR2L | 10762 | -0.049 | 0.27 | NO |
| 29 | SSB | SSB | SSB | 10798 | -0.05 | 0.28 | NO |
| 30 | POLR3H | POLR3H | POLR3H | 11550 | -0.071 | 0.26 | NO |
| 31 | POLR3K | POLR3K | POLR3K | 12275 | -0.094 | 0.26 | NO |
| 32 | NFIB | NFIB | NFIB | 13667 | -0.15 | 0.23 | NO |
| 33 | POLR3GL | POLR3GL | POLR3GL | 14067 | -0.18 | 0.26 | NO |
Figure S31. Get High-res Image This plot shows mRNAseq_cNMF expression data heatmap (on the left) a RunningEnrichmentScore(RES) plot (on the top right) and a Signal2Noise(S2N) plot (on the bottom right) of genes in the pathway: REACTOME GENERIC TRANSCRIPTION PATHWAY.
Figure S32. Get High-res Image For the top 5 core enriched genes in the pathway: REACTOME GENERIC TRANSCRIPTION PATHWAY, this volcano plot shows how much they are up/down-regulated and significant. The significance was calculated by empirical bayesian fit
Table S17. Get Full Table This table shows a Running Enrichment Score (RES) of each gene in this pathway, that is, the enrichment score at this point in the ranked list of genes. All genes are ranked by Signal-to-Noise (S2N), a measure of similarity as default and are used to obtain ES matrix of all genes. In this way, GSEA tool uses expression pattern of not only overlapped genes but also not-overlapped genes to produce ES matrix.
| Rank | GENE | SYMBOL | DESC | LIST.LOC | S2N | RES | CORE_ENRICHMENT |
|---|---|---|---|---|---|---|---|
| 1 | HIST1H2AJ | HIST1H2AJ | HIST1H2AJ | 3 | 1.1 | 0.05 | YES |
| 2 | HIST1H3C | HIST1H3C | HIST1H3C | 5 | 1.1 | 0.098 | YES |
| 3 | HIST1H2BL | HIST1H2BL | HIST1H2BL | 11 | 0.96 | 0.14 | YES |
| 4 | HIST1H2AB | HIST1H2AB | HIST1H2AB | 22 | 0.9 | 0.18 | YES |
| 5 | HIST1H3A | HIST1H3A | HIST1H3A | 67 | 0.76 | 0.21 | YES |
| 6 | HIST1H3H | HIST1H3H | HIST1H3H | 139 | 0.67 | 0.24 | YES |
| 7 | HIST1H4C | HIST1H4C | HIST1H4C | 170 | 0.65 | 0.26 | YES |
| 8 | HIST1H4D | HIST1H4D | HIST1H4D | 174 | 0.64 | 0.29 | YES |
| 9 | HIST1H4J | HIST1H4J | HIST1H4J | 190 | 0.63 | 0.32 | YES |
| 10 | HIST1H2BM | HIST1H2BM | HIST1H2BM | 217 | 0.61 | 0.34 | YES |
| 11 | HIST1H2BA | HIST1H2BA | HIST1H2BA | 268 | 0.57 | 0.37 | YES |
| 12 | HIST1H2AE | HIST1H2AE | HIST1H2AE | 273 | 0.57 | 0.39 | YES |
| 13 | HIST1H2BE | HIST1H2BE | HIST1H2BE | 353 | 0.53 | 0.41 | YES |
| 14 | HIST1H2BO | HIST1H2BO | HIST1H2BO | 374 | 0.53 | 0.43 | YES |
| 15 | HIST1H2BB | HIST1H2BB | HIST1H2BB | 454 | 0.49 | 0.45 | YES |
| 16 | HIST1H2AC | HIST1H2AC | HIST1H2AC | 485 | 0.48 | 0.47 | YES |
| 17 | HIST1H4H | HIST1H4H | HIST1H4H | 487 | 0.48 | 0.49 | YES |
| 18 | HIST1H2BG | HIST1H2BG | HIST1H2BG | 558 | 0.46 | 0.51 | YES |
| 19 | HIST1H2BD | HIST1H2BD | HIST1H2BD | 569 | 0.46 | 0.53 | YES |
| 20 | HIST1H4E | HIST1H4E | HIST1H4E | 574 | 0.45 | 0.55 | YES |
| 21 | HIST1H4K | HIST1H4K | HIST1H4K | 597 | 0.45 | 0.57 | YES |
| 22 | HIST1H4I | HIST1H4I | HIST1H4I | 733 | 0.41 | 0.58 | YES |
| 23 | HIST1H2BK | HIST1H2BK | HIST1H2BK | 845 | 0.38 | 0.59 | YES |
| 24 | HIST3H2BB | HIST3H2BB | HIST3H2BB | 883 | 0.38 | 0.6 | YES |
| 25 | HIST1H2BC | HIST1H2BC | HIST1H2BC | 885 | 0.38 | 0.62 | YES |
| 26 | HIST1H2BJ | HIST1H2BJ | HIST1H2BJ | 1103 | 0.34 | 0.62 | YES |
| 27 | HIST1H3I | HIST1H3I | HIST1H3I | 1114 | 0.33 | 0.64 | YES |
| 28 | HIST1H3B | HIST1H3B | HIST1H3B | 1144 | 0.33 | 0.65 | YES |
| 29 | HIST1H3G | HIST1H3G | HIST1H3G | 1307 | 0.31 | 0.66 | YES |
| 30 | HIST1H3D | HIST1H3D | HIST1H3D | 1392 | 0.3 | 0.66 | YES |
| 31 | ERCC6 | ERCC6 | ERCC6 | 1555 | 0.28 | 0.67 | YES |
| 32 | HIST1H2BF | HIST1H2BF | HIST1H2BF | 1571 | 0.28 | 0.68 | YES |
| 33 | HIST1H4F | HIST1H4F | HIST1H4F | 1831 | 0.25 | 0.68 | YES |
| 34 | HIST1H4B | HIST1H4B | HIST1H4B | 1838 | 0.25 | 0.69 | YES |
| 35 | HIST1H2AD | HIST1H2AD | HIST1H2AD | 1989 | 0.23 | 0.69 | YES |
| 36 | HIST4H4 | HIST4H4 | HIST4H4 | 2055 | 0.23 | 0.7 | YES |
| 37 | HIST1H2BI | HIST1H2BI | HIST1H2BI | 2106 | 0.22 | 0.7 | YES |
| 38 | HIST1H3E | HIST1H3E | HIST1H3E | 2206 | 0.21 | 0.71 | YES |
| 39 | POLR2K | POLR2K | POLR2K | 2726 | 0.18 | 0.69 | NO |
| 40 | HIST1H2BH | HIST1H2BH | HIST1H2BH | 2727 | 0.18 | 0.7 | NO |
| 41 | HIST1H4A | HIST1H4A | HIST1H4A | 3146 | 0.16 | 0.68 | NO |
| 42 | CBX3 | CBX3 | CBX3 | 3296 | 0.15 | 0.68 | NO |
| 43 | TAF1B | TAF1B | TAF1B | 4045 | 0.12 | 0.65 | NO |
| 44 | POLR1C | POLR1C | POLR1C | 4150 | 0.12 | 0.65 | NO |
| 45 | KAT2B | KAT2B | KAT2B | 4156 | 0.12 | 0.65 | NO |
| 46 | HIST2H2BE | HIST2H2BE | HIST2H2BE | 4377 | 0.11 | 0.64 | NO |
| 47 | HIST1H2BN | HIST1H2BN | HIST1H2BN | 4694 | 0.1 | 0.63 | NO |
| 48 | HIST1H3J | HIST1H3J | HIST1H3J | 4843 | 0.097 | 0.63 | NO |
| 49 | POLR1B | POLR1B | POLR1B | 5978 | 0.066 | 0.57 | NO |
| 50 | GTF2H2B | GTF2H2B | GTF2H2B | 6034 | 0.065 | 0.57 | NO |
| 51 | POLR1A | POLR1A | POLR1A | 6094 | 0.064 | 0.57 | NO |
| 52 | H3F3A | H3F3A | H3F3A | 6142 | 0.062 | 0.57 | NO |
| 53 | CDK7 | CDK7 | CDK7 | 6222 | 0.06 | 0.57 | NO |
| 54 | HIST1H3F | HIST1H3F | HIST1H3F | 6360 | 0.057 | 0.57 | NO |
| 55 | TAF1C | TAF1C | TAF1C | 6597 | 0.051 | 0.56 | NO |
| 56 | RRN3 | RRN3 | RRN3 | 7704 | 0.026 | 0.5 | NO |
| 57 | ERCC3 | ERCC3 | ERCC3 | 7748 | 0.025 | 0.5 | NO |
| 58 | HIST2H3D | HIST2H3D | HIST2H3D | 8215 | 0.014 | 0.47 | NO |
| 59 | MNAT1 | MNAT1 | MNAT1 | 8285 | 0.012 | 0.47 | NO |
| 60 | ERCC2 | ERCC2 | ERCC2 | 8570 | 0.0054 | 0.46 | NO |
| 61 | GTF2H4 | GTF2H4 | GTF2H4 | 8981 | -0.0036 | 0.43 | NO |
| 62 | POLR1D | POLR1D | POLR1D | 9021 | -0.0047 | 0.43 | NO |
| 63 | GTF2H2 | GTF2H2 | GTF2H2 | 9093 | -0.0066 | 0.43 | NO |
| 64 | TAF1A | TAF1A | TAF1A | 9663 | -0.02 | 0.4 | NO |
| 65 | POLR2H | POLR2H | POLR2H | 9671 | -0.02 | 0.4 | NO |
| 66 | UBTF | UBTF | UBTF | 9767 | -0.022 | 0.4 | NO |
| 67 | MBD2 | MBD2 | MBD2 | 9966 | -0.028 | 0.39 | NO |
| 68 | GTF2H1 | GTF2H1 | GTF2H1 | 10225 | -0.035 | 0.38 | NO |
| 69 | HIST1H4L | HIST1H4L | HIST1H4L | 10796 | -0.05 | 0.35 | NO |
| 70 | H2AFZ | H2AFZ | H2AFZ | 10901 | -0.053 | 0.34 | NO |
| 71 | HIST2H2AC | HIST2H2AC | HIST2H2AC | 11111 | -0.059 | 0.34 | NO |
| 72 | GTF2H3 | GTF2H3 | GTF2H3 | 11435 | -0.068 | 0.32 | NO |
| 73 | CCNH | CCNH | CCNH | 11717 | -0.076 | 0.31 | NO |
| 74 | H3F3B | H3F3B | H3F3B | 12581 | -0.1 | 0.27 | NO |
| 75 | MAPK3 | MAPK3 | MAPK3 | 12625 | -0.11 | 0.27 | NO |
| 76 | PTRF | PTRF | PTRF | 13591 | -0.15 | 0.23 | NO |
| 77 | HIST2H2AA3 | HIST2H2AA3 | HIST2H2AA3 | 13602 | -0.15 | 0.23 | NO |
| 78 | H2AFX | H2AFX | H2AFX | 14283 | -0.19 | 0.21 | NO |
| 79 | HIST2H4A | HIST2H4A | HIST2H4A | 14707 | -0.22 | 0.19 | NO |
| 80 | EHMT2 | EHMT2 | EHMT2 | 15977 | -0.33 | 0.14 | NO |
| 81 | HIST2H3C | HIST2H3C | HIST2H3C | 17361 | -0.48 | 0.089 | NO |
Figure S33. Get High-res Image This plot shows mRNAseq_cNMF expression data heatmap (on the left) a RunningEnrichmentScore(RES) plot (on the top right) and a Signal2Noise(S2N) plot (on the bottom right) of genes in the pathway: REACTOME RNA POL I TRANSCRIPTION.
Figure S34. Get High-res Image For the top 5 core enriched genes in the pathway: REACTOME RNA POL I TRANSCRIPTION, this volcano plot shows how much they are up/down-regulated and significant. The significance was calculated by empirical bayesian fit
Table S18. Get Full Table This table shows a Running Enrichment Score (RES) of each gene in this pathway, that is, the enrichment score at this point in the ranked list of genes. All genes are ranked by Signal-to-Noise (S2N), a measure of similarity as default and are used to obtain ES matrix of all genes. In this way, GSEA tool uses expression pattern of not only overlapped genes but also not-overlapped genes to produce ES matrix.
| Rank | GENE | SYMBOL | DESC | LIST.LOC | S2N | RES | CORE_ENRICHMENT |
|---|---|---|---|---|---|---|---|
| 1 | HIST1H2AJ | HIST1H2AJ | HIST1H2AJ | 3 | 1.1 | 0.048 | YES |
| 2 | HIST1H2BL | HIST1H2BL | HIST1H2BL | 11 | 0.96 | 0.089 | YES |
| 3 | HIST1H2AB | HIST1H2AB | HIST1H2AB | 22 | 0.9 | 0.13 | YES |
| 4 | HIST1H4C | HIST1H4C | HIST1H4C | 170 | 0.65 | 0.15 | YES |
| 5 | HIST1H4D | HIST1H4D | HIST1H4D | 174 | 0.64 | 0.17 | YES |
| 6 | HIST1H4J | HIST1H4J | HIST1H4J | 190 | 0.63 | 0.2 | YES |
| 7 | HIST1H2BM | HIST1H2BM | HIST1H2BM | 217 | 0.61 | 0.22 | YES |
| 8 | HIST1H2BA | HIST1H2BA | HIST1H2BA | 268 | 0.57 | 0.24 | YES |
| 9 | HIST1H2AE | HIST1H2AE | HIST1H2AE | 273 | 0.57 | 0.27 | YES |
| 10 | HIST1H2BE | HIST1H2BE | HIST1H2BE | 353 | 0.53 | 0.29 | YES |
| 11 | HIST1H2BO | HIST1H2BO | HIST1H2BO | 374 | 0.53 | 0.31 | YES |
| 12 | HIST1H2BB | HIST1H2BB | HIST1H2BB | 454 | 0.49 | 0.33 | YES |
| 13 | HIST1H2AC | HIST1H2AC | HIST1H2AC | 485 | 0.48 | 0.34 | YES |
| 14 | HIST1H4H | HIST1H4H | HIST1H4H | 487 | 0.48 | 0.36 | YES |
| 15 | HIST1H2BG | HIST1H2BG | HIST1H2BG | 558 | 0.46 | 0.38 | YES |
| 16 | HIST1H2BD | HIST1H2BD | HIST1H2BD | 569 | 0.46 | 0.4 | YES |
| 17 | HIST1H4E | HIST1H4E | HIST1H4E | 574 | 0.45 | 0.42 | YES |
| 18 | HIST1H4K | HIST1H4K | HIST1H4K | 597 | 0.45 | 0.44 | YES |
| 19 | HIST1H4I | HIST1H4I | HIST1H4I | 733 | 0.41 | 0.45 | YES |
| 20 | HIST1H2BK | HIST1H2BK | HIST1H2BK | 845 | 0.38 | 0.46 | YES |
| 21 | SMC1B | SMC1B | SMC1B | 874 | 0.38 | 0.47 | YES |
| 22 | HIST3H2BB | HIST3H2BB | HIST3H2BB | 883 | 0.38 | 0.49 | YES |
| 23 | HIST1H2BC | HIST1H2BC | HIST1H2BC | 885 | 0.38 | 0.5 | YES |
| 24 | HIST1H2BJ | HIST1H2BJ | HIST1H2BJ | 1103 | 0.34 | 0.51 | YES |
| 25 | FKBP6 | FKBP6 | FKBP6 | 1297 | 0.31 | 0.51 | YES |
| 26 | HIST1H2BF | HIST1H2BF | HIST1H2BF | 1571 | 0.28 | 0.51 | YES |
| 27 | SYCP2 | SYCP2 | SYCP2 | 1711 | 0.26 | 0.51 | YES |
| 28 | SYCP3 | SYCP3 | SYCP3 | 1718 | 0.26 | 0.52 | YES |
| 29 | HIST1H4F | HIST1H4F | HIST1H4F | 1831 | 0.25 | 0.53 | YES |
| 30 | HIST1H4B | HIST1H4B | HIST1H4B | 1838 | 0.25 | 0.54 | YES |
| 31 | CASC5 | CASC5 | CASC5 | 1908 | 0.24 | 0.54 | YES |
| 32 | CENPA | CENPA | CENPA | 1931 | 0.24 | 0.55 | YES |
| 33 | TEX12 | TEX12 | TEX12 | 1960 | 0.23 | 0.56 | YES |
| 34 | POLE2 | POLE2 | POLE2 | 1988 | 0.23 | 0.57 | YES |
| 35 | HIST1H2AD | HIST1H2AD | HIST1H2AD | 1989 | 0.23 | 0.58 | YES |
| 36 | HIST4H4 | HIST4H4 | HIST4H4 | 2055 | 0.23 | 0.58 | YES |
| 37 | HIST1H2BI | HIST1H2BI | HIST1H2BI | 2106 | 0.22 | 0.59 | YES |
| 38 | SYCP1 | SYCP1 | SYCP1 | 2171 | 0.22 | 0.6 | YES |
| 39 | DNA2 | DNA2 | DNA2 | 2397 | 0.2 | 0.59 | YES |
| 40 | OIP5 | OIP5 | OIP5 | 2598 | 0.19 | 0.59 | YES |
| 41 | HIST1H2BH | HIST1H2BH | HIST1H2BH | 2727 | 0.18 | 0.59 | YES |
| 42 | HJURP | HJURP | HJURP | 2997 | 0.17 | 0.58 | YES |
| 43 | CENPP | CENPP | CENPP | 3125 | 0.16 | 0.58 | YES |
| 44 | HIST1H4A | HIST1H4A | HIST1H4A | 3146 | 0.16 | 0.59 | YES |
| 45 | SYNE2 | SYNE2 | SYNE2 | 3148 | 0.16 | 0.6 | YES |
| 46 | LIG1 | LIG1 | LIG1 | 3404 | 0.15 | 0.59 | NO |
| 47 | CENPK | CENPK | CENPK | 3706 | 0.13 | 0.58 | NO |
| 48 | POLE | POLE | POLE | 3724 | 0.13 | 0.58 | NO |
| 49 | STAG3 | STAG3 | STAG3 | 4065 | 0.12 | 0.57 | NO |
| 50 | PRIM2 | PRIM2 | PRIM2 | 4083 | 0.12 | 0.58 | NO |
| 51 | HIST2H2BE | HIST2H2BE | HIST2H2BE | 4377 | 0.11 | 0.56 | NO |
| 52 | SMARCA5 | SMARCA5 | SMARCA5 | 4562 | 0.1 | 0.56 | NO |
| 53 | PRIM1 | PRIM1 | PRIM1 | 4601 | 0.1 | 0.56 | NO |
| 54 | HIST1H2BN | HIST1H2BN | HIST1H2BN | 4694 | 0.1 | 0.56 | NO |
| 55 | CENPQ | CENPQ | CENPQ | 5052 | 0.091 | 0.55 | NO |
| 56 | REC8 | REC8 | REC8 | 5320 | 0.084 | 0.54 | NO |
| 57 | SMC3 | SMC3 | SMC3 | 5412 | 0.081 | 0.54 | NO |
| 58 | ATR | ATR | ATR | 5525 | 0.078 | 0.53 | NO |
| 59 | POLD1 | POLD1 | POLD1 | 5593 | 0.077 | 0.53 | NO |
| 60 | RPA1 | RPA1 | RPA1 | 5703 | 0.074 | 0.53 | NO |
| 61 | RUVBL2 | RUVBL2 | RUVBL2 | 6088 | 0.064 | 0.51 | NO |
| 62 | RUVBL1 | RUVBL1 | RUVBL1 | 6173 | 0.061 | 0.51 | NO |
| 63 | BRCA1 | BRCA1 | BRCA1 | 6310 | 0.058 | 0.5 | NO |
| 64 | CENPO | CENPO | CENPO | 6359 | 0.057 | 0.5 | NO |
| 65 | CENPI | CENPI | CENPI | 6661 | 0.05 | 0.49 | NO |
| 66 | POT1 | POT1 | POT1 | 6678 | 0.049 | 0.49 | NO |
| 67 | DIDO1 | DIDO1 | DIDO1 | 6879 | 0.045 | 0.48 | NO |
| 68 | FEN1 | FEN1 | FEN1 | 6977 | 0.042 | 0.48 | NO |
| 69 | RPA3 | RPA3 | RPA3 | 7048 | 0.04 | 0.48 | NO |
| 70 | RAD21 | RAD21 | RAD21 | 7126 | 0.038 | 0.48 | NO |
| 71 | NHP2 | NHP2 | NHP2 | 7138 | 0.038 | 0.48 | NO |
| 72 | MLF1IP | MLF1IP | MLF1IP | 7489 | 0.03 | 0.46 | NO |
| 73 | PCNA | PCNA | PCNA | 7766 | 0.024 | 0.45 | NO |
| 74 | STAG1 | STAG1 | STAG1 | 7804 | 0.024 | 0.45 | NO |
| 75 | SMC1A | SMC1A | SMC1A | 7841 | 0.023 | 0.44 | NO |
| 76 | STAG2 | STAG2 | STAG2 | 7843 | 0.023 | 0.45 | NO |
| 77 | UBE2I | UBE2I | UBE2I | 7859 | 0.023 | 0.45 | NO |
| 78 | CENPN | CENPN | CENPN | 7889 | 0.022 | 0.44 | NO |
| 79 | CENPH | CENPH | CENPH | 7893 | 0.022 | 0.45 | NO |
| 80 | RFC4 | RFC4 | RFC4 | 8066 | 0.018 | 0.44 | NO |
| 81 | NPM1 | NPM1 | NPM1 | 8540 | 0.006 | 0.41 | NO |
| 82 | TERT | TERT | TERT | 8558 | 0.0058 | 0.41 | NO |
| 83 | RFC2 | RFC2 | RFC2 | 8660 | 0.0035 | 0.41 | NO |
| 84 | RFC3 | RFC3 | RFC3 | 9044 | -0.0052 | 0.39 | NO |
| 85 | POLD2 | POLD2 | POLD2 | 9052 | -0.0054 | 0.39 | NO |
| 86 | POLA1 | POLA1 | POLA1 | 9355 | -0.013 | 0.37 | NO |
| 87 | TERF2IP | TERF2IP | TERF2IP | 9522 | -0.017 | 0.36 | NO |
| 88 | RPA2 | RPA2 | RPA2 | 9883 | -0.025 | 0.34 | NO |
| 89 | ACD | ACD | ACD | 9974 | -0.028 | 0.34 | NO |
| 90 | POLD3 | POLD3 | POLD3 | 10139 | -0.032 | 0.34 | NO |
| 91 | DKC1 | DKC1 | DKC1 | 10217 | -0.035 | 0.33 | NO |
| 92 | HIST1H4L | HIST1H4L | HIST1H4L | 10796 | -0.05 | 0.3 | NO |
| 93 | H2AFZ | H2AFZ | H2AFZ | 10901 | -0.053 | 0.3 | NO |
| 94 | TERF2 | TERF2 | TERF2 | 11071 | -0.058 | 0.29 | NO |
| 95 | HIST2H2AC | HIST2H2AC | HIST2H2AC | 11111 | -0.059 | 0.29 | NO |
| 96 | ITGB3BP | ITGB3BP | ITGB3BP | 11145 | -0.06 | 0.3 | NO |
| 97 | SUN2 | SUN2 | SUN2 | 11727 | -0.076 | 0.27 | NO |
| 98 | POLA2 | POLA2 | POLA2 | 11932 | -0.082 | 0.26 | NO |
| 99 | RSF1 | RSF1 | RSF1 | 12238 | -0.093 | 0.25 | NO |
| 100 | RFC5 | RFC5 | RFC5 | 13112 | -0.13 | 0.21 | NO |
| 101 | LMNB1 | LMNB1 | LMNB1 | 13204 | -0.13 | 0.21 | NO |
| 102 | TINF2 | TINF2 | TINF2 | 13335 | -0.14 | 0.21 | NO |
| 103 | WRAP53 | WRAP53 | WRAP53 | 13393 | -0.14 | 0.21 | NO |
| 104 | POLD4 | POLD4 | POLD4 | 13499 | -0.14 | 0.21 | NO |
| 105 | HIST2H2AA3 | HIST2H2AA3 | HIST2H2AA3 | 13602 | -0.15 | 0.21 | NO |
| 106 | SYNE1 | SYNE1 | SYNE1 | 13610 | -0.15 | 0.22 | NO |
| 107 | RBBP4 | RBBP4 | RBBP4 | 13773 | -0.16 | 0.22 | NO |
| 108 | H2AFX | H2AFX | H2AFX | 14283 | -0.19 | 0.2 | NO |
| 109 | TERF1 | TERF1 | TERF1 | 14294 | -0.19 | 0.2 | NO |
| 110 | HSPA2 | HSPA2 | HSPA2 | 14636 | -0.21 | 0.2 | NO |
| 111 | HIST2H4A | HIST2H4A | HIST2H4A | 14707 | -0.22 | 0.2 | NO |
| 112 | RBBP7 | RBBP7 | RBBP7 | 15627 | -0.29 | 0.16 | NO |
| 113 | LMNA | LMNA | LMNA | 16353 | -0.36 | 0.14 | NO |
Figure S35. Get High-res Image This plot shows mRNAseq_cNMF expression data heatmap (on the left) a RunningEnrichmentScore(RES) plot (on the top right) and a Signal2Noise(S2N) plot (on the bottom right) of genes in the pathway: REACTOME RNA POL III TRANSCRIPTION.
Figure S36. Get High-res Image For the top 5 core enriched genes in the pathway: REACTOME RNA POL III TRANSCRIPTION, this volcano plot shows how much they are up/down-regulated and significant. The significance was calculated by empirical bayesian fit

Table S19. Get Full Table This table shows a Running Enrichment Score (RES) of each gene in this pathway, that is, the enrichment score at this point in the ranked list of genes. All genes are ranked by Signal-to-Noise (S2N), a measure of similarity as default and are used to obtain ES matrix of all genes. In this way, GSEA tool uses expression pattern of not only overlapped genes but also not-overlapped genes to produce ES matrix.
| Rank | GENE | SYMBOL | DESC | LIST.LOC | S2N | RES | CORE_ENRICHMENT |
|---|---|---|---|---|---|---|---|
| 1 | BARD1 | BARD1 | BARD1 | 901 | 0.37 | 0.099 | YES |
| 2 | RAD51 | RAD51 | RAD51 | 1474 | 0.29 | 0.18 | YES |
| 3 | FANCD2 | FANCD2 | FANCD2 | 2436 | 0.2 | 0.21 | YES |
| 4 | FANCA | FANCA | FANCA | 3014 | 0.16 | 0.24 | YES |
| 5 | NBN | NBN | NBN | 3607 | 0.14 | 0.27 | YES |
| 6 | TOPBP1 | TOPBP1 | TOPBP1 | 3733 | 0.13 | 0.31 | YES |
| 7 | FANCE | FANCE | FANCE | 4077 | 0.12 | 0.34 | YES |
| 8 | UBE2L3 | UBE2L3 | UBE2L3 | 4230 | 0.12 | 0.38 | YES |
| 9 | XRCC6 | XRCC6 | XRCC6 | 5081 | 0.09 | 0.37 | YES |
| 10 | PRKDC | PRKDC | PRKDC | 5440 | 0.08 | 0.38 | YES |
| 11 | ATR | ATR | ATR | 5525 | 0.078 | 0.41 | YES |
| 12 | XRCC5 | XRCC5 | XRCC5 | 5607 | 0.076 | 0.44 | YES |
| 13 | CDK2 | CDK2 | CDK2 | 5663 | 0.074 | 0.46 | YES |
| 14 | EWSR1 | EWSR1 | EWSR1 | 5722 | 0.073 | 0.49 | YES |
| 15 | BRCA1 | BRCA1 | BRCA1 | 6310 | 0.058 | 0.48 | YES |
| 16 | ATM | ATM | ATM | 6421 | 0.056 | 0.5 | YES |
| 17 | RBBP8 | RBBP8 | RBBP8 | 6444 | 0.055 | 0.52 | YES |
| 18 | FANCC | FANCC | FANCC | 6848 | 0.045 | 0.51 | YES |
| 19 | FANCG | FANCG | FANCG | 6918 | 0.044 | 0.53 | YES |
| 20 | CCNE1 | CCNE1 | CCNE1 | 7172 | 0.037 | 0.53 | YES |
| 21 | PCNA | PCNA | PCNA | 7766 | 0.024 | 0.51 | NO |
| 22 | FANCF | FANCF | FANCF | 8181 | 0.015 | 0.49 | NO |
| 23 | NPM1 | NPM1 | NPM1 | 8540 | 0.006 | 0.47 | NO |
| 24 | FANCL | FANCL | FANCL | 8611 | 0.0048 | 0.47 | NO |
| 25 | CSTF1 | CSTF1 | CSTF1 | 9024 | -0.0048 | 0.45 | NO |
| 26 | UBE2D3 | UBE2D3 | UBE2D3 | 9987 | -0.028 | 0.41 | NO |
| 27 | MRE11A | MRE11A | MRE11A | 10118 | -0.032 | 0.42 | NO |
| 28 | RAD50 | RAD50 | RAD50 | 10600 | -0.044 | 0.41 | NO |
| 29 | TP53 | TP53 | TP53 | 12062 | -0.087 | 0.37 | NO |
Figure S37. Get High-res Image This plot shows mRNAseq_cNMF expression data heatmap (on the left) a RunningEnrichmentScore(RES) plot (on the top right) and a Signal2Noise(S2N) plot (on the bottom right) of genes in the pathway: REACTOME OLFACTORY SIGNALING PATHWAY.
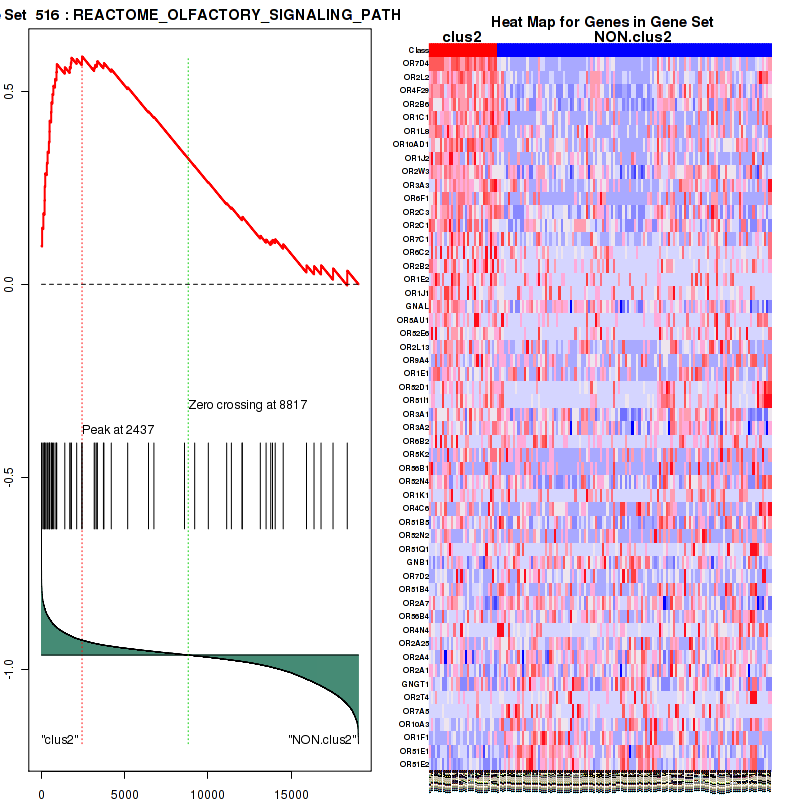
Figure S38. Get High-res Image For the top 5 core enriched genes in the pathway: REACTOME OLFACTORY SIGNALING PATHWAY, this volcano plot shows how much they are up/down-regulated and significant. The significance was calculated by empirical bayesian fit
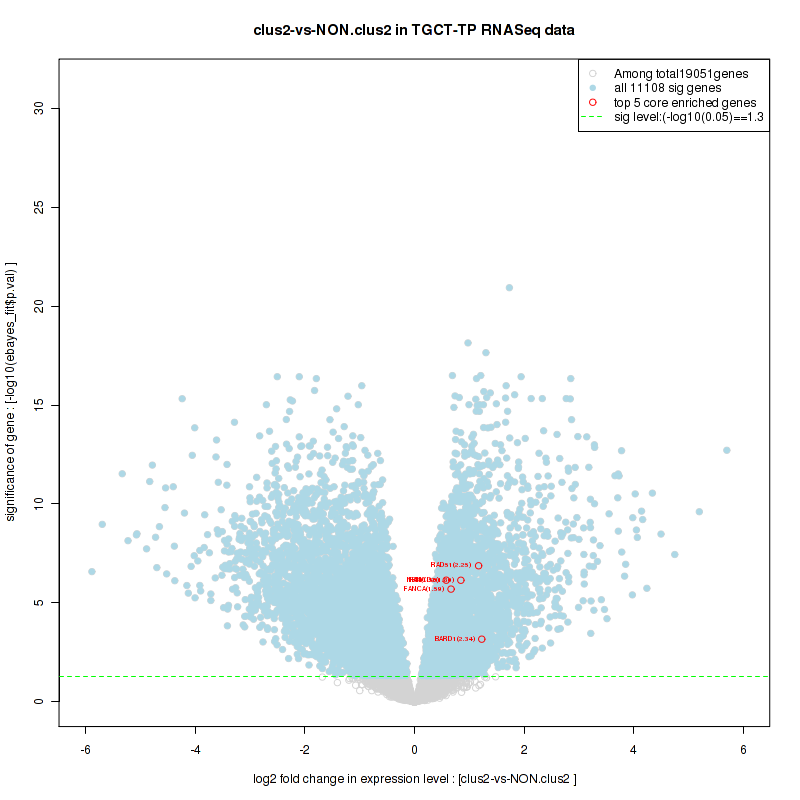
Table S20. Get Full Table This table shows a Running Enrichment Score (RES) of each gene in this pathway, that is, the enrichment score at this point in the ranked list of genes. All genes are ranked by Signal-to-Noise (S2N), a measure of similarity as default and are used to obtain ES matrix of all genes. In this way, GSEA tool uses expression pattern of not only overlapped genes but also not-overlapped genes to produce ES matrix.
| Rank | GENE | SYMBOL | DESC | LIST.LOC | S2N | RES | CORE_ENRICHMENT |
|---|---|---|---|---|---|---|---|
| 1 | HIST1H2AJ | HIST1H2AJ | HIST1H2AJ | 3 | 1.1 | 0.048 | YES |
| 2 | HIST1H3C | HIST1H3C | HIST1H3C | 5 | 1.1 | 0.094 | YES |
| 3 | HIST1H2BL | HIST1H2BL | HIST1H2BL | 11 | 0.96 | 0.13 | YES |
| 4 | HIST1H2AB | HIST1H2AB | HIST1H2AB | 22 | 0.9 | 0.17 | YES |
| 5 | HIST1H3A | HIST1H3A | HIST1H3A | 67 | 0.76 | 0.2 | YES |
| 6 | HIST1H3H | HIST1H3H | HIST1H3H | 139 | 0.67 | 0.22 | YES |
| 7 | HIST1H4C | HIST1H4C | HIST1H4C | 170 | 0.65 | 0.25 | YES |
| 8 | HIST1H4D | HIST1H4D | HIST1H4D | 174 | 0.64 | 0.28 | YES |
| 9 | HIST1H4J | HIST1H4J | HIST1H4J | 190 | 0.63 | 0.3 | YES |
| 10 | HIST1H2BM | HIST1H2BM | HIST1H2BM | 217 | 0.61 | 0.33 | YES |
| 11 | HIST1H2BA | HIST1H2BA | HIST1H2BA | 268 | 0.57 | 0.35 | YES |
| 12 | HIST1H2AE | HIST1H2AE | HIST1H2AE | 273 | 0.57 | 0.37 | YES |
| 13 | HIST1H2BE | HIST1H2BE | HIST1H2BE | 353 | 0.53 | 0.39 | YES |
| 14 | HIST1H2BO | HIST1H2BO | HIST1H2BO | 374 | 0.53 | 0.41 | YES |
| 15 | DMC1 | DMC1 | DMC1 | 437 | 0.5 | 0.43 | YES |
| 16 | HIST1H2BB | HIST1H2BB | HIST1H2BB | 454 | 0.49 | 0.45 | YES |
| 17 | HIST1H2AC | HIST1H2AC | HIST1H2AC | 485 | 0.48 | 0.47 | YES |
| 18 | HIST1H4H | HIST1H4H | HIST1H4H | 487 | 0.48 | 0.49 | YES |
| 19 | HIST1H2BG | HIST1H2BG | HIST1H2BG | 558 | 0.46 | 0.5 | YES |
| 20 | HIST1H2BD | HIST1H2BD | HIST1H2BD | 569 | 0.46 | 0.52 | YES |
| 21 | HIST1H4E | HIST1H4E | HIST1H4E | 574 | 0.45 | 0.54 | YES |
| 22 | HIST1H4K | HIST1H4K | HIST1H4K | 597 | 0.45 | 0.56 | YES |
| 23 | MSH4 | MSH4 | MSH4 | 606 | 0.44 | 0.58 | YES |
| 24 | HIST1H4I | HIST1H4I | HIST1H4I | 733 | 0.41 | 0.59 | YES |
| 25 | HIST1H2BK | HIST1H2BK | HIST1H2BK | 845 | 0.38 | 0.6 | YES |
| 26 | HIST3H2BB | HIST3H2BB | HIST3H2BB | 883 | 0.38 | 0.61 | YES |
| 27 | HIST1H2BC | HIST1H2BC | HIST1H2BC | 885 | 0.38 | 0.63 | YES |
| 28 | HIST1H2BJ | HIST1H2BJ | HIST1H2BJ | 1103 | 0.34 | 0.63 | YES |
| 29 | HIST1H3I | HIST1H3I | HIST1H3I | 1114 | 0.33 | 0.65 | YES |
| 30 | HIST1H3B | HIST1H3B | HIST1H3B | 1144 | 0.33 | 0.66 | YES |
| 31 | HIST1H3G | HIST1H3G | HIST1H3G | 1307 | 0.31 | 0.66 | YES |
| 32 | HIST1H3D | HIST1H3D | HIST1H3D | 1392 | 0.3 | 0.67 | YES |
| 33 | RAD51 | RAD51 | RAD51 | 1474 | 0.29 | 0.68 | YES |
| 34 | HIST1H2BF | HIST1H2BF | HIST1H2BF | 1571 | 0.28 | 0.68 | YES |
| 35 | BLM | BLM | BLM | 1610 | 0.27 | 0.69 | YES |
| 36 | HIST1H4F | HIST1H4F | HIST1H4F | 1831 | 0.25 | 0.69 | YES |
| 37 | HIST1H4B | HIST1H4B | HIST1H4B | 1838 | 0.25 | 0.7 | YES |
| 38 | HIST1H2AD | HIST1H2AD | HIST1H2AD | 1989 | 0.23 | 0.7 | YES |
| 39 | HIST4H4 | HIST4H4 | HIST4H4 | 2055 | 0.23 | 0.71 | YES |
| 40 | HIST1H2BI | HIST1H2BI | HIST1H2BI | 2106 | 0.22 | 0.72 | YES |
| 41 | HIST1H3E | HIST1H3E | HIST1H3E | 2206 | 0.21 | 0.72 | YES |
| 42 | MND1 | MND1 | MND1 | 2722 | 0.18 | 0.7 | NO |
| 43 | HIST1H2BH | HIST1H2BH | HIST1H2BH | 2727 | 0.18 | 0.71 | NO |
| 44 | HIST1H4A | HIST1H4A | HIST1H4A | 3146 | 0.16 | 0.69 | NO |
| 45 | NBN | NBN | NBN | 3607 | 0.14 | 0.68 | NO |
| 46 | BRCA2 | BRCA2 | BRCA2 | 4121 | 0.12 | 0.65 | NO |
| 47 | HIST2H2BE | HIST2H2BE | HIST2H2BE | 4377 | 0.11 | 0.64 | NO |
| 48 | HIST1H2BN | HIST1H2BN | HIST1H2BN | 4694 | 0.1 | 0.63 | NO |
| 49 | HIST1H3J | HIST1H3J | HIST1H3J | 4843 | 0.097 | 0.63 | NO |
| 50 | CDK2 | CDK2 | CDK2 | 5663 | 0.074 | 0.59 | NO |
| 51 | RPA1 | RPA1 | RPA1 | 5703 | 0.074 | 0.59 | NO |
| 52 | RAD51C | RAD51C | RAD51C | 5923 | 0.068 | 0.58 | NO |
| 53 | H3F3A | H3F3A | H3F3A | 6142 | 0.062 | 0.57 | NO |
| 54 | BRCA1 | BRCA1 | BRCA1 | 6310 | 0.058 | 0.57 | NO |
| 55 | HIST1H3F | HIST1H3F | HIST1H3F | 6360 | 0.057 | 0.57 | NO |
| 56 | ATM | ATM | ATM | 6421 | 0.056 | 0.56 | NO |
| 57 | RBBP8 | RBBP8 | RBBP8 | 6444 | 0.055 | 0.57 | NO |
| 58 | RPA3 | RPA3 | RPA3 | 7048 | 0.04 | 0.54 | NO |
| 59 | CDK4 | CDK4 | CDK4 | 7101 | 0.039 | 0.54 | NO |
| 60 | PRDM9 | PRDM9 | PRDM9 | 8065 | 0.018 | 0.48 | NO |
| 61 | HIST2H3D | HIST2H3D | HIST2H3D | 8215 | 0.014 | 0.48 | NO |
| 62 | RPA2 | RPA2 | RPA2 | 9883 | -0.025 | 0.39 | NO |
| 63 | MRE11A | MRE11A | MRE11A | 10118 | -0.032 | 0.38 | NO |
| 64 | MLH1 | MLH1 | MLH1 | 10345 | -0.038 | 0.37 | NO |
| 65 | RAD50 | RAD50 | RAD50 | 10600 | -0.044 | 0.36 | NO |
| 66 | HIST1H4L | HIST1H4L | HIST1H4L | 10796 | -0.05 | 0.35 | NO |
| 67 | H2AFZ | H2AFZ | H2AFZ | 10901 | -0.053 | 0.35 | NO |
| 68 | TOP3A | TOP3A | TOP3A | 10961 | -0.055 | 0.35 | NO |
| 69 | HIST2H2AC | HIST2H2AC | HIST2H2AC | 11111 | -0.059 | 0.34 | NO |
| 70 | H3F3B | H3F3B | H3F3B | 12581 | -0.1 | 0.27 | NO |
| 71 | MLH3 | MLH3 | MLH3 | 12823 | -0.12 | 0.26 | NO |
| 72 | MSH5 | MSH5 | MSH5 | 13171 | -0.13 | 0.25 | NO |
| 73 | HIST2H2AA3 | HIST2H2AA3 | HIST2H2AA3 | 13602 | -0.15 | 0.23 | NO |
| 74 | H2AFX | H2AFX | H2AFX | 14283 | -0.19 | 0.2 | NO |
| 75 | HIST2H4A | HIST2H4A | HIST2H4A | 14707 | -0.22 | 0.19 | NO |
| 76 | TEX15 | TEX15 | TEX15 | 17112 | -0.45 | 0.082 | NO |
| 77 | HIST2H3C | HIST2H3C | HIST2H3C | 17361 | -0.48 | 0.089 | NO |
Figure S39. Get High-res Image This plot shows mRNAseq_cNMF expression data heatmap (on the left) a RunningEnrichmentScore(RES) plot (on the top right) and a Signal2Noise(S2N) plot (on the bottom right) of genes in the pathway: REACTOME 3 UTR MEDIATED TRANSLATIONAL REGULATION.
Figure S40. Get High-res Image For the top 5 core enriched genes in the pathway: REACTOME 3 UTR MEDIATED TRANSLATIONAL REGULATION, this volcano plot shows how much they are up/down-regulated and significant. The significance was calculated by empirical bayesian fit
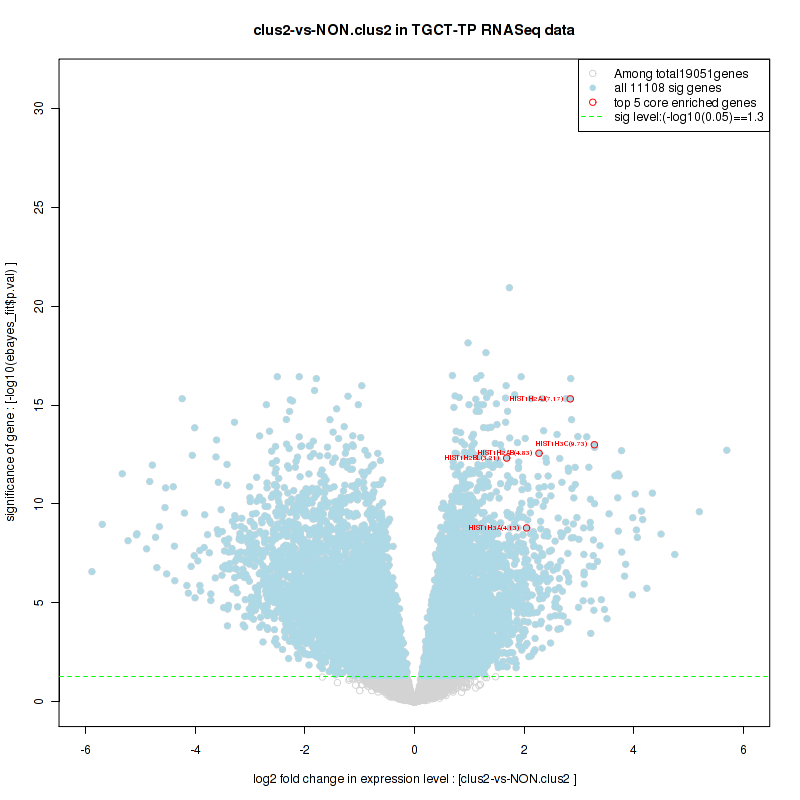
For the top enriched genes, if you want to check whether they are
-
up-regulated, please check the list of up-regulated genes
-
down-regulated, please check the list of down-regulated genes
For the top enriched genes, if you want to check whether they are
-
highly expressed genes, please check the list of high (top 30%) expressed genes
-
low expressed genes, please check the list of low (bottom 30%) expressed genes
An expression pattern of top(30%)/middle(30%)/low(30%) in this subtype against other subtypes is available in a heatmap
For the top enriched genes, if you want to check whether they are
-
significantly differently expressed genes by eBayes lm fit, please check the list of significant genes
Table 5. Get Full Table This table shows top 10 pathways which are significantly enriched in cluster clus3. It displays only significant gene sets satisfying nom.p.val.threshold (-1), fwer.p.val.threshold (-1) , fdr.q.val.threshold (0.25) and the default table is sorted by Normalized Enrichment Score (NES). Further details on NES statistics, please visit The Broad GSEA website.
| GeneSet(GS) | Size(#genes) | genes.ES.table | ES | NES | NOM.p.val | FDR.q.val | FWER.p.val | Tag.. | Gene.. | Signal | FDR..median. | glob.p.val |
|---|---|---|---|---|---|---|---|---|---|---|---|---|
| KEGG CITRATE CYCLE TCA CYCLE | 30 | genes.ES.table | 0.49 | 1.6 | 0.067 | 0.22 | 0.86 | 0.5 | 0.2 | 0.4 | 0.095 | 0.042 |
| KEGG SELENOAMINO ACID METABOLISM | 26 | genes.ES.table | 0.52 | 1.7 | 0.023 | 0.22 | 0.79 | 0.62 | 0.28 | 0.44 | 0.081 | 0.053 |
| KEGG RNA DEGRADATION | 57 | genes.ES.table | 0.48 | 1.7 | 0.071 | 0.22 | 0.76 | 0.68 | 0.37 | 0.43 | 0.077 | 0.056 |
| KEGG RNA POLYMERASE | 29 | genes.ES.table | 0.51 | 1.6 | 0.074 | 0.23 | 0.87 | 0.69 | 0.37 | 0.43 | 0.097 | 0.044 |
| KEGG SPLICEOSOME | 114 | genes.ES.table | 0.57 | 1.8 | 0.012 | 0.35 | 0.34 | 0.78 | 0.36 | 0.5 | 0 | 0.081 |
| KEGG HUNTINGTONS DISEASE | 172 | genes.ES.table | 0.39 | 1.7 | 0.033 | 0.24 | 0.64 | 0.58 | 0.33 | 0.4 | 0.069 | 0.063 |
| BIOCARTA MPR PATHWAY | 34 | genes.ES.table | 0.5 | 1.7 | 0.014 | 0.23 | 0.67 | 0.32 | 0.16 | 0.27 | 0.069 | 0.059 |
| PID HIF2PATHWAY | 34 | genes.ES.table | 0.55 | 1.6 | 0.033 | 0.23 | 0.88 | 0.29 | 0.12 | 0.26 | 0.11 | 0.044 |
| PID MYC ACTIVPATHWAY | 79 | genes.ES.table | 0.5 | 1.8 | 0.018 | 0.28 | 0.4 | 0.46 | 0.22 | 0.35 | 0 | 0.064 |
| REACTOME TRANSLATION | 147 | genes.ES.table | 0.49 | 1.6 | 0.097 | 0.23 | 0.89 | 0.73 | 0.4 | 0.44 | 0.1 | 0.041 |
Table S21. Get Full Table This table shows a Running Enrichment Score (RES) of each gene in this pathway, that is, the enrichment score at this point in the ranked list of genes. All genes are ranked by Signal-to-Noise (S2N), a measure of similarity as default and are used to obtain ES matrix of all genes. In this way, GSEA tool uses expression pattern of not only overlapped genes but also not-overlapped genes to produce ES matrix.
| Rank | GENE | SYMBOL | DESC | LIST.LOC | S2N | RES | CORE_ENRICHMENT |
|---|---|---|---|---|---|---|---|
| 1 | ATF3 | ATF3 | ATF3 | 1141 | 0.38 | 0.048 | YES |
| 2 | DDIT3 | DDIT3 | DDIT3 | 1177 | 0.38 | 0.15 | YES |
| 3 | IL8 | IL8 | IL8 | 1625 | 0.3 | 0.21 | YES |
| 4 | ASNS | ASNS | ASNS | 1629 | 0.3 | 0.3 | YES |
| 5 | EXOSC3 | EXOSC3 | EXOSC3 | 2522 | 0.21 | 0.31 | YES |
| 6 | EXOSC2 | EXOSC2 | EXOSC2 | 3036 | 0.18 | 0.33 | YES |
| 7 | CCL2 | CCL2 | CCL2 | 3094 | 0.18 | 0.38 | YES |
| 8 | EXOSC4 | EXOSC4 | EXOSC4 | 3150 | 0.17 | 0.42 | YES |
| 9 | EXOSC8 | EXOSC8 | EXOSC8 | 3434 | 0.16 | 0.45 | YES |
| 10 | EXOSC7 | EXOSC7 | EXOSC7 | 3446 | 0.16 | 0.5 | YES |
| 11 | EXOSC9 | EXOSC9 | EXOSC9 | 3533 | 0.16 | 0.54 | YES |
| 12 | HSPA5 | HSPA5 | HSPA5 | 3684 | 0.15 | 0.57 | YES |
| 13 | KHSRP | KHSRP | KHSRP | 4269 | 0.12 | 0.58 | YES |
| 14 | EXOSC1 | EXOSC1 | EXOSC1 | 4366 | 0.12 | 0.6 | YES |
| 15 | PARN | PARN | PARN | 4463 | 0.12 | 0.63 | YES |
| 16 | ATF4 | ATF4 | ATF4 | 4464 | 0.12 | 0.67 | YES |
| 17 | EIF2AK3 | EIF2AK3 | EIF2AK3 | 5510 | 0.081 | 0.63 | NO |
| 18 | EIF2S1 | EIF2S1 | EIF2S1 | 6311 | 0.059 | 0.61 | NO |
| 19 | IGFBP1 | IGFBP1 | IGFBP1 | 7070 | 0.038 | 0.58 | NO |
| 20 | DIS3 | DIS3 | DIS3 | 7904 | 0.017 | 0.54 | NO |
| 21 | EXOSC5 | EXOSC5 | EXOSC5 | 8174 | 0.01 | 0.53 | NO |
| 22 | NFYB | NFYB | NFYB | 8335 | 0.0066 | 0.52 | NO |
| 23 | EXOSC6 | EXOSC6 | EXOSC6 | 8540 | 0.00097 | 0.51 | NO |
| 24 | ATF6 | ATF6 | ATF6 | 8857 | -0.007 | 0.5 | NO |
| 25 | HERPUD1 | HERPUD1 | HERPUD1 | 9319 | -0.019 | 0.48 | NO |
| 26 | DCP2 | DCP2 | DCP2 | 9993 | -0.037 | 0.45 | NO |
| 27 | NFYA | NFYA | NFYA | 11521 | -0.083 | 0.4 | NO |
Figure S41. Get High-res Image This plot shows mRNAseq_cNMF expression data heatmap (on the left) a RunningEnrichmentScore(RES) plot (on the top right) and a Signal2Noise(S2N) plot (on the bottom right) of genes in the pathway: KEGG CITRATE CYCLE TCA CYCLE.

Figure S42. Get High-res Image For the top 5 core enriched genes in the pathway: KEGG CITRATE CYCLE TCA CYCLE, this volcano plot shows how much they are up/down-regulated and significant. The significance was calculated by empirical bayesian fit
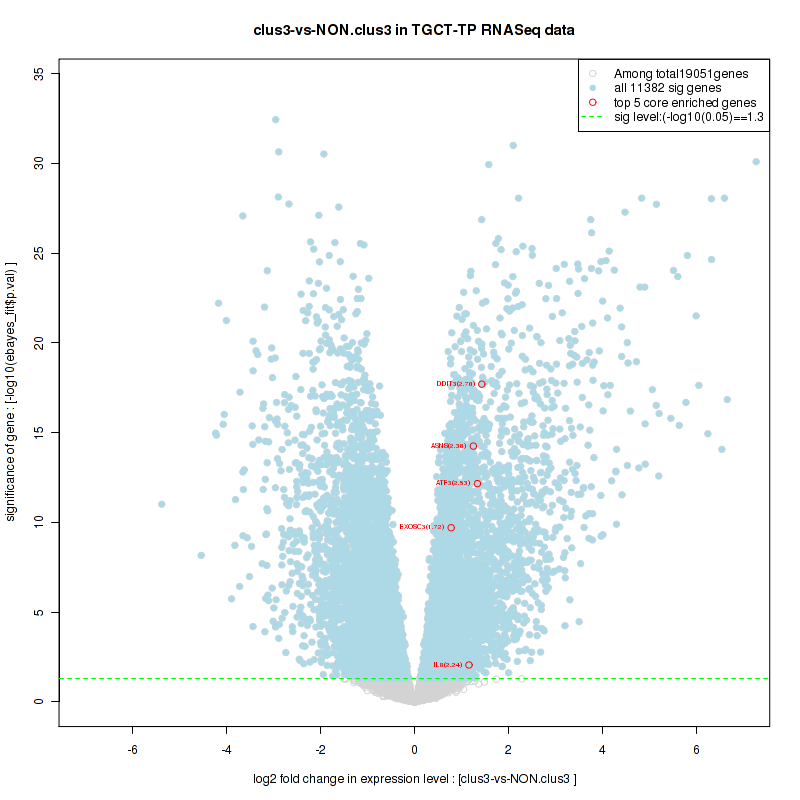
Table S22. Get Full Table This table shows a Running Enrichment Score (RES) of each gene in this pathway, that is, the enrichment score at this point in the ranked list of genes. All genes are ranked by Signal-to-Noise (S2N), a measure of similarity as default and are used to obtain ES matrix of all genes. In this way, GSEA tool uses expression pattern of not only overlapped genes but also not-overlapped genes to produce ES matrix.
| Rank | GENE | SYMBOL | DESC | LIST.LOC | S2N | RES | CORE_ENRICHMENT |
|---|---|---|---|---|---|---|---|
| 1 | GTF2H2 | GTF2H2 | GTF2H2 | 1068 | 0.4 | -0.027 | YES |
| 2 | GTF2H2B | GTF2H2B | GTF2H2B | 1178 | 0.37 | -0.0056 | YES |
| 3 | MAGOH | MAGOH | MAGOH | 1272 | 0.35 | 0.015 | YES |
| 4 | NUP54 | NUP54 | NUP54 | 1877 | 0.27 | 0.0029 | YES |
| 5 | SNRPA1 | SNRPA1 | SNRPA1 | 2033 | 0.25 | 0.013 | YES |
| 6 | NUP205 | NUP205 | NUP205 | 2411 | 0.22 | 0.0091 | YES |
| 7 | SNRPF | SNRPF | SNRPF | 2450 | 0.22 | 0.023 | YES |
| 8 | CDK7 | CDK7 | CDK7 | 2480 | 0.21 | 0.037 | YES |
| 9 | SEH1L | SEH1L | SEH1L | 2546 | 0.21 | 0.049 | YES |
| 10 | UPF3B | UPF3B | UPF3B | 2631 | 0.2 | 0.059 | YES |
| 11 | NUP37 | NUP37 | NUP37 | 2656 | 0.2 | 0.073 | YES |
| 12 | POLR2H | POLR2H | POLR2H | 2721 | 0.2 | 0.084 | YES |
| 13 | MNAT1 | MNAT1 | MNAT1 | 2775 | 0.19 | 0.095 | YES |
| 14 | POLR2G | POLR2G | POLR2G | 2841 | 0.19 | 0.11 | YES |
| 15 | SF3A3 | SF3A3 | SF3A3 | 2845 | 0.19 | 0.12 | YES |
| 16 | TXNL4A | TXNL4A | TXNL4A | 2879 | 0.19 | 0.13 | YES |
| 17 | THOC4 | THOC4 | THOC4 | 2880 | 0.19 | 0.14 | YES |
| 18 | NUP43 | NUP43 | NUP43 | 2967 | 0.18 | 0.15 | YES |
| 19 | NUP88 | NUP88 | NUP88 | 3053 | 0.18 | 0.16 | YES |
| 20 | SNRNP40 | SNRNP40 | SNRNP40 | 3120 | 0.17 | 0.17 | YES |
| 21 | GTF2H3 | GTF2H3 | GTF2H3 | 3160 | 0.17 | 0.18 | YES |
| 22 | NUP85 | NUP85 | NUP85 | 3210 | 0.17 | 0.19 | YES |
| 23 | EIF4E | EIF4E | EIF4E | 3279 | 0.17 | 0.2 | YES |
| 24 | SNRPD1 | SNRPD1 | SNRPD1 | 3356 | 0.16 | 0.21 | YES |
| 25 | YBX1 | YBX1 | YBX1 | 3540 | 0.16 | 0.21 | YES |
| 26 | FUS | FUS | FUS | 3560 | 0.15 | 0.22 | YES |
| 27 | SNRPG | SNRPG | SNRPG | 3699 | 0.15 | 0.22 | YES |
| 28 | PCBP1 | PCBP1 | PCBP1 | 3754 | 0.14 | 0.23 | YES |
| 29 | RBM8A | RBM8A | RBM8A | 3851 | 0.14 | 0.24 | YES |
| 30 | NUP155 | NUP155 | NUP155 | 3886 | 0.14 | 0.24 | YES |
| 31 | PCBP2 | PCBP2 | PCBP2 | 3945 | 0.14 | 0.25 | YES |
| 32 | POM121 | POM121 | POM121 | 3971 | 0.14 | 0.26 | YES |
| 33 | CSTF3 | CSTF3 | CSTF3 | 4060 | 0.13 | 0.26 | YES |
| 34 | HNRNPD | HNRNPD | HNRNPD | 4070 | 0.13 | 0.28 | YES |
| 35 | PRPF4 | PRPF4 | PRPF4 | 4130 | 0.13 | 0.28 | YES |
| 36 | EFTUD2 | EFTUD2 | EFTUD2 | 4155 | 0.13 | 0.29 | YES |
| 37 | PABPN1 | PABPN1 | PABPN1 | 4177 | 0.13 | 0.3 | YES |
| 38 | RBMX | RBMX | RBMX | 4323 | 0.12 | 0.3 | YES |
| 39 | DNAJC8 | DNAJC8 | DNAJC8 | 4341 | 0.12 | 0.31 | YES |
| 40 | HNRNPA0 | HNRNPA0 | HNRNPA0 | 4349 | 0.12 | 0.32 | YES |
| 41 | CSTF2 | CSTF2 | CSTF2 | 4356 | 0.12 | 0.32 | YES |
| 42 | SNRPD3 | SNRPD3 | SNRPD3 | 4387 | 0.12 | 0.33 | YES |
| 43 | LSM10 | LSM10 | LSM10 | 4475 | 0.12 | 0.34 | YES |
| 44 | SNRPA | SNRPA | SNRPA | 4544 | 0.11 | 0.34 | YES |
| 45 | NCBP2 | NCBP2 | NCBP2 | 4564 | 0.11 | 0.35 | YES |
| 46 | HNRNPH1 | HNRNPH1 | HNRNPH1 | 4651 | 0.11 | 0.35 | YES |
| 47 | SNRPB2 | SNRPB2 | SNRPB2 | 4770 | 0.11 | 0.35 | YES |
| 48 | PRPF8 | PRPF8 | PRPF8 | 4805 | 0.1 | 0.36 | YES |
| 49 | SRRM1 | SRRM1 | SRRM1 | 4816 | 0.1 | 0.36 | YES |
| 50 | HNRNPA3 | HNRNPA3 | HNRNPA3 | 4870 | 0.1 | 0.37 | YES |
| 51 | POLR2A | POLR2A | POLR2A | 4945 | 0.099 | 0.37 | YES |
| 52 | HNRNPM | HNRNPM | HNRNPM | 4949 | 0.099 | 0.38 | YES |
| 53 | NUP35 | NUP35 | NUP35 | 4968 | 0.098 | 0.39 | YES |
| 54 | NUP153 | NUP153 | NUP153 | 5027 | 0.096 | 0.39 | YES |
| 55 | SNRPB | SNRPB | SNRPB | 5034 | 0.096 | 0.4 | YES |
| 56 | POLR2E | POLR2E | POLR2E | 5070 | 0.095 | 0.4 | YES |
| 57 | HNRNPC | HNRNPC | HNRNPC | 5257 | 0.088 | 0.4 | YES |
| 58 | CPSF3 | CPSF3 | CPSF3 | 5297 | 0.087 | 0.4 | YES |
| 59 | NHP2L1 | NHP2L1 | NHP2L1 | 5328 | 0.086 | 0.41 | YES |
| 60 | POLR2F | POLR2F | POLR2F | 5349 | 0.086 | 0.41 | YES |
| 61 | SF3B14 | SF3B14 | SF3B14 | 5379 | 0.085 | 0.42 | YES |
| 62 | CDC40 | CDC40 | CDC40 | 5480 | 0.082 | 0.42 | YES |
| 63 | PTBP1 | PTBP1 | PTBP1 | 5553 | 0.08 | 0.42 | YES |
| 64 | U2AF1 | U2AF1 | U2AF1 | 5558 | 0.08 | 0.43 | YES |
| 65 | GTF2F2 | GTF2F2 | GTF2F2 | 5570 | 0.079 | 0.43 | YES |
| 66 | HNRNPL | HNRNPL | HNRNPL | 5661 | 0.076 | 0.43 | YES |
| 67 | LSM2 | LSM2 | LSM2 | 5663 | 0.076 | 0.44 | YES |
| 68 | HNRNPK | HNRNPK | HNRNPK | 5719 | 0.075 | 0.44 | YES |
| 69 | RNMT | RNMT | RNMT | 5757 | 0.074 | 0.44 | YES |
| 70 | CCNH | CCNH | CCNH | 5816 | 0.072 | 0.45 | YES |
| 71 | POLR2C | POLR2C | POLR2C | 5834 | 0.072 | 0.45 | YES |
| 72 | RNGTT | RNGTT | RNGTT | 5837 | 0.072 | 0.46 | YES |
| 73 | NUP50 | NUP50 | NUP50 | 5871 | 0.071 | 0.46 | YES |
| 74 | NUP107 | NUP107 | NUP107 | 5927 | 0.07 | 0.46 | YES |
| 75 | CSTF1 | CSTF1 | CSTF1 | 5956 | 0.068 | 0.46 | YES |
| 76 | CPSF1 | CPSF1 | CPSF1 | 5969 | 0.068 | 0.47 | YES |
| 77 | SF3B2 | SF3B2 | SF3B2 | 6057 | 0.066 | 0.47 | YES |
| 78 | U2AF2 | U2AF2 | U2AF2 | 6116 | 0.064 | 0.47 | YES |
| 79 | NCBP1 | NCBP1 | NCBP1 | 6118 | 0.064 | 0.48 | YES |
| 80 | SLBP | SLBP | SLBP | 6153 | 0.063 | 0.48 | YES |
| 81 | NUP93 | NUP93 | NUP93 | 6160 | 0.063 | 0.48 | YES |
| 82 | DHX9 | DHX9 | DHX9 | 6233 | 0.061 | 0.48 | YES |
| 83 | NFX1 | NFX1 | NFX1 | 6262 | 0.06 | 0.49 | YES |
| 84 | PHF5A | PHF5A | PHF5A | 6292 | 0.059 | 0.49 | YES |
| 85 | HNRNPA1 | HNRNPA1 | HNRNPA1 | 6315 | 0.059 | 0.49 | YES |
| 86 | GTF2F1 | GTF2F1 | GTF2F1 | 6330 | 0.058 | 0.5 | YES |
| 87 | HNRNPU | HNRNPU | HNRNPU | 6452 | 0.055 | 0.49 | YES |
| 88 | SNRPE | SNRPE | SNRPE | 6487 | 0.054 | 0.5 | YES |
| 89 | RAE1 | RAE1 | RAE1 | 6489 | 0.054 | 0.5 | YES |
| 90 | RNPS1 | RNPS1 | RNPS1 | 6512 | 0.053 | 0.5 | YES |
| 91 | HNRNPA2B1 | HNRNPA2B1 | HNRNPA2B1 | 6520 | 0.053 | 0.5 | YES |
| 92 | SF3B3 | SF3B3 | SF3B3 | 6528 | 0.052 | 0.51 | YES |
| 93 | SF3A2 | SF3A2 | SF3A2 | 6576 | 0.051 | 0.51 | YES |
| 94 | SF3A1 | SF3A1 | SF3A1 | 6577 | 0.051 | 0.51 | YES |
| 95 | SNRPD2 | SNRPD2 | SNRPD2 | 6695 | 0.048 | 0.51 | YES |
| 96 | SMC1A | SMC1A | SMC1A | 6769 | 0.046 | 0.51 | YES |
| 97 | POLR2J | POLR2J | POLR2J | 6803 | 0.045 | 0.51 | YES |
| 98 | ADARB1 | ADARB1 | ADARB1 | 6806 | 0.045 | 0.52 | YES |
| 99 | GTF2H1 | GTF2H1 | GTF2H1 | 6876 | 0.043 | 0.51 | YES |
| 100 | SF3B4 | SF3B4 | SF3B4 | 6911 | 0.042 | 0.52 | YES |
| 101 | POLR2L | POLR2L | POLR2L | 6976 | 0.04 | 0.52 | NO |
| 102 | POLR2I | POLR2I | POLR2I | 7113 | 0.037 | 0.51 | NO |
| 103 | AAAS | AAAS | AAAS | 7179 | 0.036 | 0.51 | NO |
| 104 | NUPL2 | NUPL2 | NUPL2 | 7219 | 0.034 | 0.51 | NO |
| 105 | PRPF6 | PRPF6 | PRPF6 | 7315 | 0.032 | 0.51 | NO |
| 106 | CCAR1 | CCAR1 | CCAR1 | 7364 | 0.031 | 0.51 | NO |
| 107 | DDX23 | DDX23 | DDX23 | 7370 | 0.03 | 0.51 | NO |
| 108 | CPSF2 | CPSF2 | CPSF2 | 7395 | 0.03 | 0.51 | NO |
| 109 | GTF2H4 | GTF2H4 | GTF2H4 | 7399 | 0.03 | 0.51 | NO |
| 110 | NUP210 | NUP210 | NUP210 | 7456 | 0.028 | 0.51 | NO |
| 111 | NUP133 | NUP133 | NUP133 | 7555 | 0.025 | 0.51 | NO |
| 112 | ERCC2 | ERCC2 | ERCC2 | 7607 | 0.024 | 0.51 | NO |
| 113 | HNRNPR | HNRNPR | HNRNPR | 7648 | 0.023 | 0.51 | NO |
| 114 | CD2BP2 | CD2BP2 | CD2BP2 | 7653 | 0.023 | 0.51 | NO |
| 115 | CLP1 | CLP1 | CLP1 | 7658 | 0.023 | 0.51 | NO |
| 116 | NUDT21 | NUDT21 | NUDT21 | 7752 | 0.021 | 0.51 | NO |
| 117 | SNRNP70 | SNRNP70 | SNRNP70 | 7842 | 0.019 | 0.5 | NO |
| 118 | NUPL1 | NUPL1 | NUPL1 | 7990 | 0.015 | 0.5 | NO |
| 119 | RANBP2 | RANBP2 | RANBP2 | 8139 | 0.011 | 0.49 | NO |
| 120 | POLR2B | POLR2B | POLR2B | 8266 | 0.008 | 0.48 | NO |
| 121 | SF3B5 | SF3B5 | SF3B5 | 8286 | 0.0076 | 0.48 | NO |
| 122 | POLR2K | POLR2K | POLR2K | 8316 | 0.0069 | 0.48 | NO |
| 123 | POLR2D | POLR2D | POLR2D | 8363 | 0.0056 | 0.48 | NO |
| 124 | DHX38 | DHX38 | DHX38 | 8373 | 0.0054 | 0.48 | NO |
| 125 | ERCC3 | ERCC3 | ERCC3 | 8413 | 0.0044 | 0.48 | NO |
| 126 | NUP188 | NUP188 | NUP188 | 8595 | -0.00044 | 0.47 | NO |
| 127 | PAPOLA | PAPOLA | PAPOLA | 8662 | -0.0021 | 0.46 | NO |
| 128 | CPSF7 | CPSF7 | CPSF7 | 8717 | -0.0035 | 0.46 | NO |
| 129 | SNRNP200 | SNRNP200 | SNRNP200 | 8861 | -0.0071 | 0.46 | NO |
| 130 | PCF11 | PCF11 | PCF11 | 8866 | -0.0072 | 0.46 | NO |
| 131 | HNRNPF | HNRNPF | HNRNPF | 9109 | -0.013 | 0.44 | NO |
| 132 | SF3B1 | SF3B1 | SF3B1 | 9329 | -0.019 | 0.43 | NO |
| 133 | NUP62 | NUP62 | NUP62 | 9419 | -0.022 | 0.43 | NO |
| 134 | NXF1 | NXF1 | NXF1 | 9981 | -0.036 | 0.4 | NO |
| 135 | METTL3 | METTL3 | METTL3 | 10133 | -0.04 | 0.4 | NO |
| 136 | NUP214 | NUP214 | NUP214 | 10148 | -0.041 | 0.4 | NO |
| 137 | ADAR | ADAR | ADAR | 10266 | -0.044 | 0.4 | NO |
| 138 | HNRNPH2 | HNRNPH2 | HNRNPH2 | 10468 | -0.05 | 0.39 | NO |
| 139 | TPR | TPR | TPR | 10900 | -0.063 | 0.37 | NO |
| 140 | APOBEC1 | APOBEC1 | APOBEC1 | 10947 | -0.065 | 0.38 | NO |
| 141 | SUPT5H | SUPT5H | SUPT5H | 11003 | -0.066 | 0.38 | NO |
| 142 | ZNF473 | ZNF473 | ZNF473 | 11154 | -0.071 | 0.37 | NO |
| 143 | HNRNPUL1 | HNRNPUL1 | HNRNPUL1 | 11515 | -0.082 | 0.36 | NO |
| 144 | RBM5 | RBM5 | RBM5 | 13059 | -0.13 | 0.29 | NO |
| 145 | LSM11 | LSM11 | LSM11 | 13268 | -0.14 | 0.29 | NO |
| 146 | A1CF | A1CF | A1CF | 15357 | -0.24 | 0.2 | NO |
Figure S43. Get High-res Image This plot shows mRNAseq_cNMF expression data heatmap (on the left) a RunningEnrichmentScore(RES) plot (on the top right) and a Signal2Noise(S2N) plot (on the bottom right) of genes in the pathway: KEGG SELENOAMINO ACID METABOLISM.

Figure S44. Get High-res Image For the top 5 core enriched genes in the pathway: KEGG SELENOAMINO ACID METABOLISM, this volcano plot shows how much they are up/down-regulated and significant. The significance was calculated by empirical bayesian fit

Table S23. Get Full Table This table shows a Running Enrichment Score (RES) of each gene in this pathway, that is, the enrichment score at this point in the ranked list of genes. All genes are ranked by Signal-to-Noise (S2N), a measure of similarity as default and are used to obtain ES matrix of all genes. In this way, GSEA tool uses expression pattern of not only overlapped genes but also not-overlapped genes to produce ES matrix.
| Rank | GENE | SYMBOL | DESC | LIST.LOC | S2N | RES | CORE_ENRICHMENT |
|---|---|---|---|---|---|---|---|
| 1 | ATF3 | ATF3 | ATF3 | 1141 | 0.38 | -0.014 | YES |
| 2 | DDIT3 | DDIT3 | DDIT3 | 1177 | 0.38 | 0.03 | YES |
| 3 | IL8 | IL8 | IL8 | 1625 | 0.3 | 0.043 | YES |
| 4 | ASNS | ASNS | ASNS | 1629 | 0.3 | 0.079 | YES |
| 5 | PDIA6 | PDIA6 | PDIA6 | 2206 | 0.24 | 0.078 | YES |
| 6 | DNAJB11 | DNAJB11 | DNAJB11 | 2461 | 0.22 | 0.09 | YES |
| 7 | EXOSC3 | EXOSC3 | EXOSC3 | 2522 | 0.21 | 0.11 | YES |
| 8 | HYOU1 | HYOU1 | HYOU1 | 2612 | 0.2 | 0.13 | YES |
| 9 | LMNA | LMNA | LMNA | 2671 | 0.2 | 0.15 | YES |
| 10 | EXOSC2 | EXOSC2 | EXOSC2 | 3036 | 0.18 | 0.16 | YES |
| 11 | CCL2 | CCL2 | CCL2 | 3094 | 0.18 | 0.18 | YES |
| 12 | EXOSC4 | EXOSC4 | EXOSC4 | 3150 | 0.17 | 0.19 | YES |
| 13 | HSP90B1 | HSP90B1 | HSP90B1 | 3375 | 0.16 | 0.2 | YES |
| 14 | EXOSC8 | EXOSC8 | EXOSC8 | 3434 | 0.16 | 0.22 | YES |
| 15 | EXOSC7 | EXOSC7 | EXOSC7 | 3446 | 0.16 | 0.24 | YES |
| 16 | EXOSC9 | EXOSC9 | EXOSC9 | 3533 | 0.16 | 0.25 | YES |
| 17 | HSPA5 | HSPA5 | HSPA5 | 3684 | 0.15 | 0.26 | YES |
| 18 | SHC1 | SHC1 | SHC1 | 3710 | 0.15 | 0.28 | YES |
| 19 | SULT1A3 | SULT1A3 | SULT1A3 | 3874 | 0.14 | 0.28 | YES |
| 20 | KHSRP | KHSRP | KHSRP | 4269 | 0.12 | 0.28 | YES |
| 21 | EXOSC1 | EXOSC1 | EXOSC1 | 4366 | 0.12 | 0.29 | YES |
| 22 | PARN | PARN | PARN | 4463 | 0.12 | 0.3 | YES |
| 23 | ATF4 | ATF4 | ATF4 | 4464 | 0.12 | 0.31 | YES |
| 24 | C19orf10 | C19orf10 | C19orf10 | 4746 | 0.11 | 0.31 | YES |
| 25 | PDIA5 | PDIA5 | PDIA5 | 4757 | 0.11 | 0.32 | YES |
| 26 | YIF1A | YIF1A | YIF1A | 4777 | 0.11 | 0.34 | YES |
| 27 | CALR | CALR | CALR | 4848 | 0.1 | 0.34 | YES |
| 28 | DDX11 | DDX11 | DDX11 | 5037 | 0.096 | 0.35 | YES |
| 29 | TSPYL2 | TSPYL2 | TSPYL2 | 5225 | 0.09 | 0.35 | YES |
| 30 | MBTPS2 | MBTPS2 | MBTPS2 | 5463 | 0.082 | 0.34 | YES |
| 31 | EIF2AK3 | EIF2AK3 | EIF2AK3 | 5510 | 0.081 | 0.35 | YES |
| 32 | EXTL3 | EXTL3 | EXTL3 | 5563 | 0.08 | 0.36 | YES |
| 33 | DNAJC3 | DNAJC3 | DNAJC3 | 5618 | 0.078 | 0.36 | YES |
| 34 | KDELR3 | KDELR3 | KDELR3 | 5693 | 0.076 | 0.37 | YES |
| 35 | KLHDC3 | KLHDC3 | KLHDC3 | 5936 | 0.069 | 0.37 | NO |
| 36 | EIF2S1 | EIF2S1 | EIF2S1 | 6311 | 0.059 | 0.35 | NO |
| 37 | IGFBP1 | IGFBP1 | IGFBP1 | 7070 | 0.038 | 0.32 | NO |
| 38 | XBP1 | XBP1 | XBP1 | 7072 | 0.038 | 0.32 | NO |
| 39 | FKBP14 | FKBP14 | FKBP14 | 7118 | 0.037 | 0.32 | NO |
| 40 | ACADVL | ACADVL | ACADVL | 7147 | 0.036 | 0.33 | NO |
| 41 | SRPRB | SRPRB | SRPRB | 7522 | 0.026 | 0.31 | NO |
| 42 | ATP6V0D1 | ATP6V0D1 | ATP6V0D1 | 7716 | 0.022 | 0.3 | NO |
| 43 | DIS3 | DIS3 | DIS3 | 7904 | 0.017 | 0.3 | NO |
| 44 | SERP1 | SERP1 | SERP1 | 8117 | 0.012 | 0.29 | NO |
| 45 | GOSR2 | GOSR2 | GOSR2 | 8121 | 0.012 | 0.29 | NO |
| 46 | EXOSC5 | EXOSC5 | EXOSC5 | 8174 | 0.01 | 0.29 | NO |
| 47 | ARFGAP1 | ARFGAP1 | ARFGAP1 | 8236 | 0.0088 | 0.28 | NO |
| 48 | NFYB | NFYB | NFYB | 8335 | 0.0066 | 0.28 | NO |
| 49 | EXOSC6 | EXOSC6 | EXOSC6 | 8540 | 0.00097 | 0.27 | NO |
| 50 | PREB | PREB | PREB | 8631 | -0.0012 | 0.26 | NO |
| 51 | ATF6 | ATF6 | ATF6 | 8857 | -0.007 | 0.25 | NO |
| 52 | SSR1 | SSR1 | SSR1 | 9274 | -0.018 | 0.23 | NO |
| 53 | HERPUD1 | HERPUD1 | HERPUD1 | 9319 | -0.019 | 0.23 | NO |
| 54 | SRPR | SRPR | SRPR | 9653 | -0.028 | 0.22 | NO |
| 55 | WIPI1 | WIPI1 | WIPI1 | 9654 | -0.028 | 0.22 | NO |
| 56 | DCTN1 | DCTN1 | DCTN1 | 9824 | -0.033 | 0.22 | NO |
| 57 | ZBTB17 | ZBTB17 | ZBTB17 | 9873 | -0.034 | 0.22 | NO |
| 58 | DCP2 | DCP2 | DCP2 | 9993 | -0.037 | 0.22 | NO |
| 59 | ADD1 | ADD1 | ADD1 | 10084 | -0.039 | 0.22 | NO |
| 60 | HDGF | HDGF | HDGF | 10505 | -0.05 | 0.2 | NO |
| 61 | SYVN1 | SYVN1 | SYVN1 | 10696 | -0.057 | 0.2 | NO |
| 62 | SEC31A | SEC31A | SEC31A | 10717 | -0.058 | 0.2 | NO |
| 63 | DNAJB9 | DNAJB9 | DNAJB9 | 10802 | -0.06 | 0.21 | NO |
| 64 | CXXC1 | CXXC1 | CXXC1 | 10873 | -0.063 | 0.21 | NO |
| 65 | CTDSP2 | CTDSP2 | CTDSP2 | 11032 | -0.067 | 0.21 | NO |
| 66 | TATDN2 | TATDN2 | TATDN2 | 11041 | -0.067 | 0.22 | NO |
| 67 | GSK3A | GSK3A | GSK3A | 11238 | -0.073 | 0.22 | NO |
| 68 | NFYA | NFYA | NFYA | 11521 | -0.083 | 0.21 | NO |
| 69 | EDEM1 | EDEM1 | EDEM1 | 12142 | -0.1 | 0.19 | NO |
| 70 | TLN1 | TLN1 | TLN1 | 12234 | -0.1 | 0.2 | NO |
| 71 | TPP1 | TPP1 | TPP1 | 13033 | -0.13 | 0.17 | NO |
| 72 | WFS1 | WFS1 | WFS1 | 13153 | -0.14 | 0.18 | NO |
| 73 | MBTPS1 | MBTPS1 | MBTPS1 | 13682 | -0.16 | 0.18 | NO |
| 74 | CUL7 | CUL7 | CUL7 | 13788 | -0.16 | 0.19 | NO |
| 75 | PPP2R5B | PPP2R5B | PPP2R5B | 16312 | -0.3 | 0.093 | NO |
| 76 | ERN1 | ERN1 | ERN1 | 17612 | -0.42 | 0.076 | NO |
Figure S45. Get High-res Image This plot shows mRNAseq_cNMF expression data heatmap (on the left) a RunningEnrichmentScore(RES) plot (on the top right) and a Signal2Noise(S2N) plot (on the bottom right) of genes in the pathway: KEGG RNA DEGRADATION.

Figure S46. Get High-res Image For the top 5 core enriched genes in the pathway: KEGG RNA DEGRADATION, this volcano plot shows how much they are up/down-regulated and significant. The significance was calculated by empirical bayesian fit
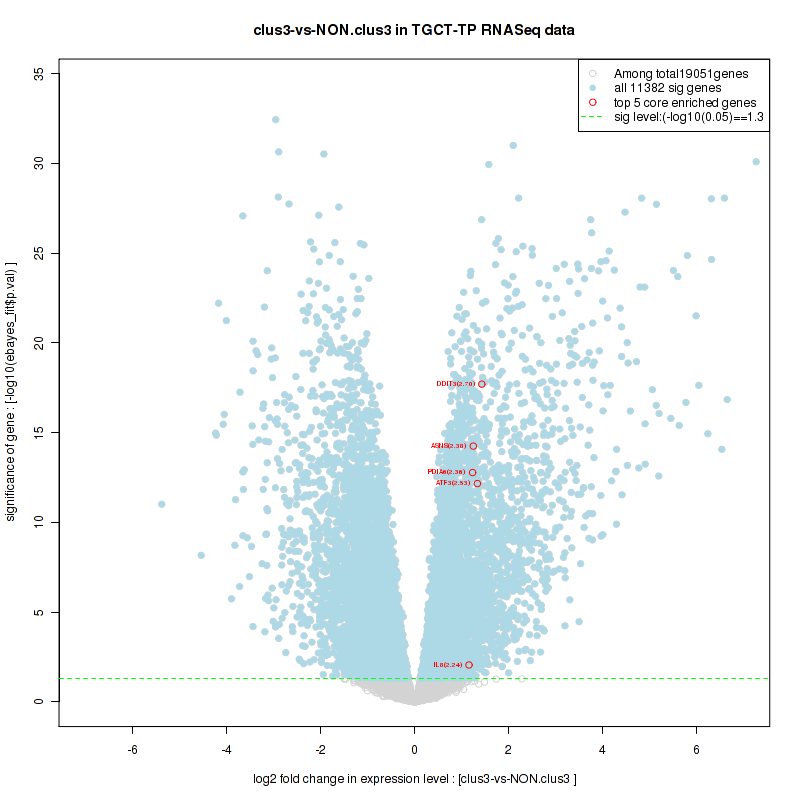
Table S24. Get Full Table This table shows a Running Enrichment Score (RES) of each gene in this pathway, that is, the enrichment score at this point in the ranked list of genes. All genes are ranked by Signal-to-Noise (S2N), a measure of similarity as default and are used to obtain ES matrix of all genes. In this way, GSEA tool uses expression pattern of not only overlapped genes but also not-overlapped genes to produce ES matrix.
| Rank | GENE | SYMBOL | DESC | LIST.LOC | S2N | RES | CORE_ENRICHMENT |
|---|---|---|---|---|---|---|---|
| 1 | PSMB2 | PSMB2 | PSMB2 | 1782 | 0.28 | -0.065 | YES |
| 2 | PSMD11 | PSMD11 | PSMD11 | 1865 | 0.27 | -0.042 | YES |
| 3 | PSMB6 | PSMB6 | PSMB6 | 1976 | 0.26 | -0.021 | YES |
| 4 | PSMD10 | PSMD10 | PSMD10 | 2184 | 0.24 | -0.0069 | YES |
| 5 | PSMA5 | PSMA5 | PSMA5 | 2209 | 0.24 | 0.016 | YES |
| 6 | EXOSC3 | EXOSC3 | EXOSC3 | 2522 | 0.21 | 0.022 | YES |
| 7 | PSMB3 | PSMB3 | PSMB3 | 2556 | 0.21 | 0.042 | YES |
| 8 | PSMC4 | PSMC4 | PSMC4 | 2609 | 0.2 | 0.06 | YES |
| 9 | PSMD12 | PSMD12 | PSMD12 | 2627 | 0.2 | 0.08 | YES |
| 10 | HSPB1 | HSPB1 | HSPB1 | 2748 | 0.2 | 0.094 | YES |
| 11 | PSMA7 | PSMA7 | PSMA7 | 2758 | 0.2 | 0.11 | YES |
| 12 | PSMA2 | PSMA2 | PSMA2 | 3005 | 0.18 | 0.12 | YES |
| 13 | EXOSC2 | EXOSC2 | EXOSC2 | 3036 | 0.18 | 0.14 | YES |
| 14 | PSMD3 | PSMD3 | PSMD3 | 3098 | 0.18 | 0.15 | YES |
| 15 | EXOSC4 | EXOSC4 | EXOSC4 | 3150 | 0.17 | 0.17 | YES |
| 16 | PSMA1 | PSMA1 | PSMA1 | 3170 | 0.17 | 0.18 | YES |
| 17 | PSMD7 | PSMD7 | PSMD7 | 3368 | 0.16 | 0.19 | YES |
| 18 | EXOSC8 | EXOSC8 | EXOSC8 | 3434 | 0.16 | 0.2 | YES |
| 19 | EXOSC7 | EXOSC7 | EXOSC7 | 3446 | 0.16 | 0.22 | YES |
| 20 | EXOSC9 | EXOSC9 | EXOSC9 | 3533 | 0.16 | 0.23 | YES |
| 21 | PSMB5 | PSMB5 | PSMB5 | 3705 | 0.15 | 0.24 | YES |
| 22 | PSMC2 | PSMC2 | PSMC2 | 3716 | 0.15 | 0.25 | YES |
| 23 | PSME4 | PSME4 | PSME4 | 3749 | 0.14 | 0.26 | YES |
| 24 | PSMC1 | PSMC1 | PSMC1 | 4002 | 0.14 | 0.27 | YES |
| 25 | MAPKAPK2 | MAPKAPK2 | MAPKAPK2 | 4018 | 0.13 | 0.28 | YES |
| 26 | HNRNPD | HNRNPD | HNRNPD | 4070 | 0.13 | 0.29 | YES |
| 27 | PSMB7 | PSMB7 | PSMB7 | 4212 | 0.13 | 0.3 | YES |
| 28 | PSMA6 | PSMA6 | PSMA6 | 4218 | 0.13 | 0.31 | YES |
| 29 | KHSRP | KHSRP | KHSRP | 4269 | 0.12 | 0.32 | YES |
| 30 | EIF4G1 | EIF4G1 | EIF4G1 | 4295 | 0.12 | 0.33 | YES |
| 31 | PSMD6 | PSMD6 | PSMD6 | 4328 | 0.12 | 0.34 | YES |
| 32 | EXOSC1 | EXOSC1 | EXOSC1 | 4366 | 0.12 | 0.35 | YES |
| 33 | HSPA8 | HSPA8 | HSPA8 | 4395 | 0.12 | 0.36 | YES |
| 34 | PSMA3 | PSMA3 | PSMA3 | 4434 | 0.12 | 0.37 | YES |
| 35 | PARN | PARN | PARN | 4463 | 0.12 | 0.38 | YES |
| 36 | HSPA1B | HSPA1B | HSPA1B | 4531 | 0.12 | 0.39 | YES |
| 37 | PSMC5 | PSMC5 | PSMC5 | 4546 | 0.11 | 0.4 | YES |
| 38 | PSMC3 | PSMC3 | PSMC3 | 4554 | 0.11 | 0.42 | YES |
| 39 | PSMD5 | PSMD5 | PSMD5 | 4600 | 0.11 | 0.42 | YES |
| 40 | PSMB1 | PSMB1 | PSMB1 | 4612 | 0.11 | 0.44 | YES |
| 41 | PSMB4 | PSMB4 | PSMB4 | 4675 | 0.11 | 0.44 | YES |
| 42 | RPS27A | RPS27A | RPS27A | 4686 | 0.11 | 0.45 | YES |
| 43 | PSMD2 | PSMD2 | PSMD2 | 4743 | 0.11 | 0.46 | YES |
| 44 | PSMD14 | PSMD14 | PSMD14 | 4935 | 0.1 | 0.46 | YES |
| 45 | PSMA4 | PSMA4 | PSMA4 | 4995 | 0.098 | 0.47 | YES |
| 46 | YWHAZ | YWHAZ | YWHAZ | 5472 | 0.082 | 0.45 | YES |
| 47 | DCP1A | DCP1A | DCP1A | 5526 | 0.081 | 0.46 | YES |
| 48 | PSMD13 | PSMD13 | PSMD13 | 5549 | 0.08 | 0.47 | YES |
| 49 | TNPO1 | TNPO1 | TNPO1 | 5566 | 0.079 | 0.47 | YES |
| 50 | ZFP36L1 | ZFP36L1 | ZFP36L1 | 5578 | 0.079 | 0.48 | YES |
| 51 | PSMD4 | PSMD4 | PSMD4 | 5666 | 0.076 | 0.48 | YES |
| 52 | PSMD1 | PSMD1 | PSMD1 | 5970 | 0.068 | 0.48 | NO |
| 53 | PSMC6 | PSMC6 | PSMC6 | 6175 | 0.062 | 0.47 | NO |
| 54 | XPO1 | XPO1 | XPO1 | 6692 | 0.048 | 0.45 | NO |
| 55 | UBA52 | UBA52 | UBA52 | 6757 | 0.047 | 0.45 | NO |
| 56 | PABPC1 | PABPC1 | PABPC1 | 6776 | 0.046 | 0.45 | NO |
| 57 | PSMD8 | PSMD8 | PSMD8 | 7181 | 0.035 | 0.44 | NO |
| 58 | PRKCA | PRKCA | PRKCA | 7253 | 0.033 | 0.44 | NO |
| 59 | DIS3 | DIS3 | DIS3 | 7904 | 0.017 | 0.4 | NO |
| 60 | PSMD9 | PSMD9 | PSMD9 | 8104 | 0.012 | 0.4 | NO |
| 61 | EXOSC5 | EXOSC5 | EXOSC5 | 8174 | 0.01 | 0.39 | NO |
| 62 | EXOSC6 | EXOSC6 | EXOSC6 | 8540 | 0.00097 | 0.37 | NO |
| 63 | ELAVL1 | ELAVL1 | ELAVL1 | 8610 | -0.00083 | 0.37 | NO |
| 64 | PRKCD | PRKCD | PRKCD | 8793 | -0.0054 | 0.36 | NO |
| 65 | YWHAB | YWHAB | YWHAB | 8973 | -0.0096 | 0.35 | NO |
| 66 | PSME2 | PSME2 | PSME2 | 9219 | -0.016 | 0.34 | NO |
| 67 | MAPK14 | MAPK14 | MAPK14 | 9605 | -0.027 | 0.32 | NO |
| 68 | DCP2 | DCP2 | DCP2 | 9993 | -0.037 | 0.31 | NO |
| 69 | NUP214 | NUP214 | NUP214 | 10148 | -0.041 | 0.3 | NO |
| 70 | AKT1 | AKT1 | AKT1 | 10949 | -0.065 | 0.27 | NO |
| 71 | PSME1 | PSME1 | PSME1 | 11030 | -0.067 | 0.27 | NO |
| 72 | ANP32A | ANP32A | ANP32A | 11134 | -0.07 | 0.27 | NO |
| 73 | PSMF1 | PSMF1 | PSMF1 | 11150 | -0.071 | 0.28 | NO |
| 74 | PSMB10 | PSMB10 | PSMB10 | 12004 | -0.098 | 0.24 | NO |
| 75 | PSMB8 | PSMB8 | PSMB8 | 12633 | -0.12 | 0.22 | NO |
| 76 | ZFP36 | ZFP36 | ZFP36 | 12811 | -0.12 | 0.23 | NO |
| 77 | TNFSF13 | TNFSF13 | TNFSF13 | 12967 | -0.13 | 0.23 | NO |
| 78 | PSMB9 | PSMB9 | PSMB9 | 13665 | -0.16 | 0.21 | NO |
| 79 | PSMA8 | PSMA8 | PSMA8 | 15143 | -0.22 | 0.16 | NO |
| 80 | MAPK11 | MAPK11 | MAPK11 | 15258 | -0.23 | 0.18 | NO |
| 81 | XRN1 | XRN1 | XRN1 | 15464 | -0.24 | 0.19 | NO |
Figure S47. Get High-res Image This plot shows mRNAseq_cNMF expression data heatmap (on the left) a RunningEnrichmentScore(RES) plot (on the top right) and a Signal2Noise(S2N) plot (on the bottom right) of genes in the pathway: KEGG RNA POLYMERASE.
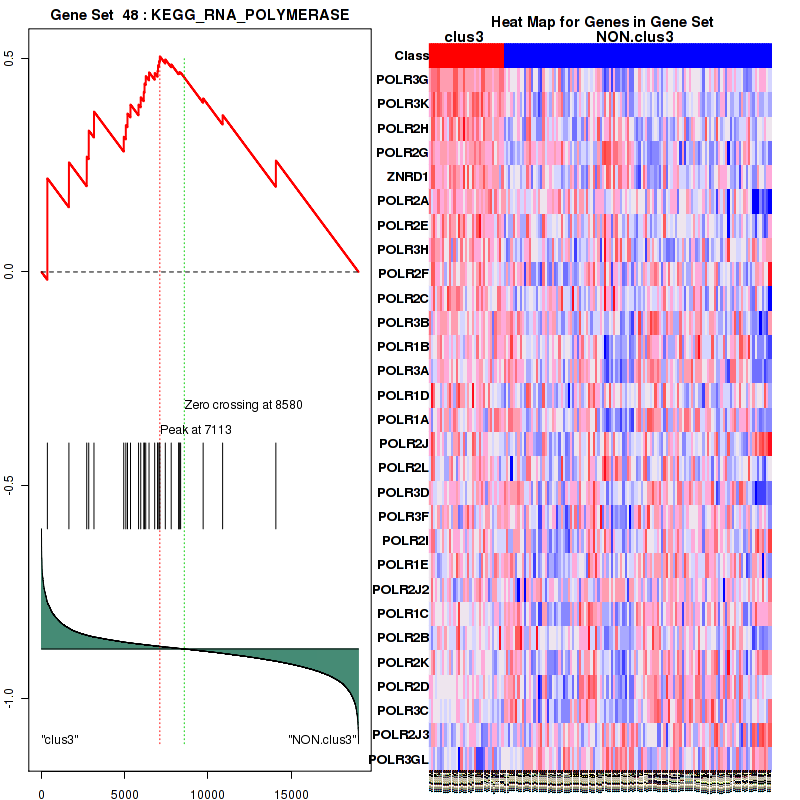
Figure S48. Get High-res Image For the top 5 core enriched genes in the pathway: KEGG RNA POLYMERASE, this volcano plot shows how much they are up/down-regulated and significant. The significance was calculated by empirical bayesian fit
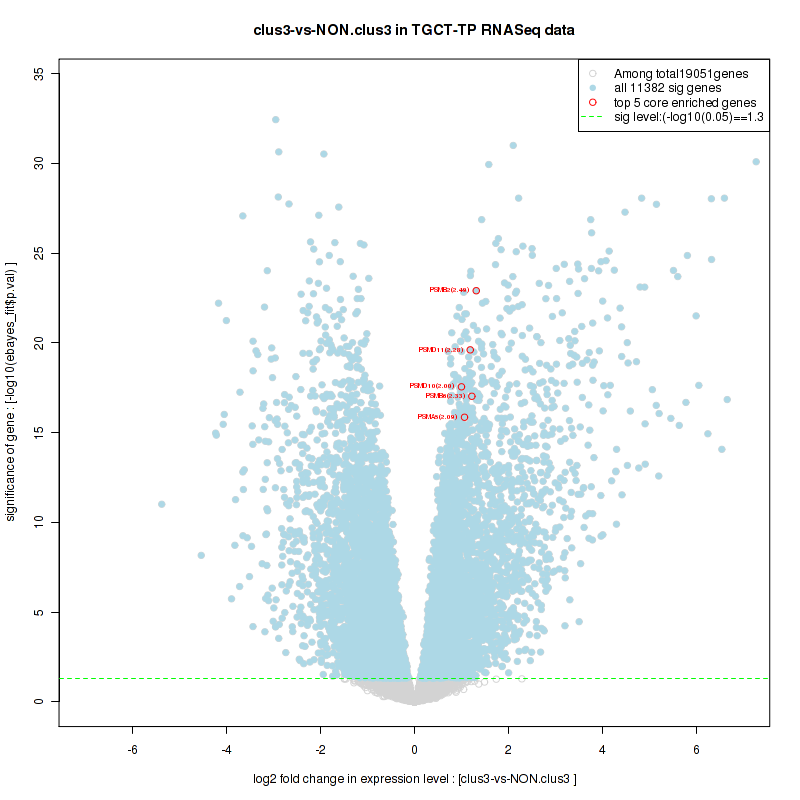
Table S25. Get Full Table This table shows a Running Enrichment Score (RES) of each gene in this pathway, that is, the enrichment score at this point in the ranked list of genes. All genes are ranked by Signal-to-Noise (S2N), a measure of similarity as default and are used to obtain ES matrix of all genes. In this way, GSEA tool uses expression pattern of not only overlapped genes but also not-overlapped genes to produce ES matrix.
| Rank | GENE | SYMBOL | DESC | LIST.LOC | S2N | RES | CORE_ENRICHMENT |
|---|---|---|---|---|---|---|---|
| 1 | HSPA6 | HSPA6 | HSPA6 | 922 | 0.44 | -0.012 | YES |
| 2 | HSPA2 | HSPA2 | HSPA2 | 1122 | 0.39 | 0.011 | YES |
| 3 | MAGOH | MAGOH | MAGOH | 1272 | 0.35 | 0.033 | YES |
| 4 | PPIH | PPIH | PPIH | 1654 | 0.3 | 0.038 | YES |
| 5 | MAGOHB | MAGOHB | MAGOHB | 1882 | 0.27 | 0.048 | YES |
| 6 | SNRPA1 | SNRPA1 | SNRPA1 | 2033 | 0.25 | 0.061 | YES |
| 7 | THOC3 | THOC3 | THOC3 | 2218 | 0.24 | 0.072 | YES |
| 8 | SNRPF | SNRPF | SNRPF | 2450 | 0.22 | 0.078 | YES |
| 9 | SNRPC | SNRPC | SNRPC | 2716 | 0.2 | 0.08 | YES |
| 10 | WBP11 | WBP11 | WBP11 | 2826 | 0.19 | 0.091 | YES |
| 11 | SF3A3 | SF3A3 | SF3A3 | 2845 | 0.19 | 0.11 | YES |
| 12 | BCAS2 | BCAS2 | BCAS2 | 2863 | 0.19 | 0.12 | YES |
| 13 | PPIL1 | PPIL1 | PPIL1 | 2878 | 0.19 | 0.14 | YES |
| 14 | TXNL4A | TXNL4A | TXNL4A | 2879 | 0.19 | 0.15 | YES |
| 15 | THOC4 | THOC4 | THOC4 | 2880 | 0.19 | 0.17 | YES |
| 16 | PRPF38A | PRPF38A | PRPF38A | 2929 | 0.18 | 0.18 | YES |
| 17 | RBM22 | RBM22 | RBM22 | 3002 | 0.18 | 0.19 | YES |
| 18 | SNRNP40 | SNRNP40 | SNRNP40 | 3120 | 0.17 | 0.2 | YES |
| 19 | ZMAT2 | ZMAT2 | ZMAT2 | 3269 | 0.17 | 0.21 | YES |
| 20 | LSM3 | LSM3 | LSM3 | 3324 | 0.16 | 0.22 | YES |
| 21 | SNRPD1 | SNRPD1 | SNRPD1 | 3356 | 0.16 | 0.23 | YES |
| 22 | SNRNP27 | SNRNP27 | SNRNP27 | 3449 | 0.16 | 0.24 | YES |
| 23 | SNRPG | SNRPG | SNRPG | 3699 | 0.15 | 0.24 | YES |
| 24 | PCBP1 | PCBP1 | PCBP1 | 3754 | 0.14 | 0.25 | YES |
| 25 | BUD31 | BUD31 | BUD31 | 3755 | 0.14 | 0.26 | YES |
| 26 | DHX15 | DHX15 | DHX15 | 3809 | 0.14 | 0.27 | YES |
| 27 | EIF4A3 | EIF4A3 | EIF4A3 | 3812 | 0.14 | 0.28 | YES |
| 28 | RBM8A | RBM8A | RBM8A | 3851 | 0.14 | 0.29 | YES |
| 29 | LSM7 | LSM7 | LSM7 | 3946 | 0.14 | 0.3 | YES |
| 30 | LSM6 | LSM6 | LSM6 | 4014 | 0.14 | 0.3 | YES |
| 31 | HSPA1A | HSPA1A | HSPA1A | 4022 | 0.13 | 0.32 | YES |
| 32 | PRPF4 | PRPF4 | PRPF4 | 4130 | 0.13 | 0.32 | YES |
| 33 | EFTUD2 | EFTUD2 | EFTUD2 | 4155 | 0.13 | 0.33 | YES |
| 34 | DHX8 | DHX8 | DHX8 | 4157 | 0.13 | 0.34 | YES |
| 35 | RBMX | RBMX | RBMX | 4323 | 0.12 | 0.34 | YES |
| 36 | SNRPD3 | SNRPD3 | SNRPD3 | 4387 | 0.12 | 0.35 | YES |
| 37 | HSPA8 | HSPA8 | HSPA8 | 4395 | 0.12 | 0.36 | YES |
| 38 | PRPF40A | PRPF40A | PRPF40A | 4462 | 0.12 | 0.37 | YES |
| 39 | SMNDC1 | SMNDC1 | SMNDC1 | 4468 | 0.12 | 0.38 | YES |
| 40 | HSPA1B | HSPA1B | HSPA1B | 4531 | 0.12 | 0.38 | YES |
| 41 | SNRPA | SNRPA | SNRPA | 4544 | 0.11 | 0.39 | YES |
| 42 | NCBP2 | NCBP2 | NCBP2 | 4564 | 0.11 | 0.4 | YES |
| 43 | DDX46 | DDX46 | DDX46 | 4575 | 0.11 | 0.41 | YES |
| 44 | PPIE | PPIE | PPIE | 4607 | 0.11 | 0.42 | YES |
| 45 | THOC2 | THOC2 | THOC2 | 4690 | 0.11 | 0.42 | YES |
| 46 | CWC15 | CWC15 | CWC15 | 4714 | 0.11 | 0.43 | YES |
| 47 | SNRPB2 | SNRPB2 | SNRPB2 | 4770 | 0.11 | 0.44 | YES |
| 48 | PRPF8 | PRPF8 | PRPF8 | 4805 | 0.1 | 0.44 | YES |
| 49 | PUF60 | PUF60 | PUF60 | 4849 | 0.1 | 0.45 | YES |
| 50 | HNRNPA3 | HNRNPA3 | HNRNPA3 | 4870 | 0.1 | 0.46 | YES |
| 51 | HNRNPM | HNRNPM | HNRNPM | 4949 | 0.099 | 0.46 | YES |
| 52 | SNRPB | SNRPB | SNRPB | 5034 | 0.096 | 0.46 | YES |
| 53 | NAA38 | NAA38 | NAA38 | 5236 | 0.09 | 0.46 | YES |
| 54 | PRPF3 | PRPF3 | PRPF3 | 5253 | 0.089 | 0.47 | YES |
| 55 | HNRNPC | HNRNPC | HNRNPC | 5257 | 0.088 | 0.48 | YES |
| 56 | NHP2L1 | NHP2L1 | NHP2L1 | 5328 | 0.086 | 0.48 | YES |
| 57 | SF3B14 | SF3B14 | SF3B14 | 5379 | 0.085 | 0.48 | YES |
| 58 | PRPF18 | PRPF18 | PRPF18 | 5458 | 0.082 | 0.49 | YES |
| 59 | CDC40 | CDC40 | CDC40 | 5480 | 0.082 | 0.49 | YES |
| 60 | U2AF1 | U2AF1 | U2AF1 | 5558 | 0.08 | 0.5 | YES |
| 61 | SYF2 | SYF2 | SYF2 | 5576 | 0.079 | 0.5 | YES |
| 62 | TCERG1 | TCERG1 | TCERG1 | 5635 | 0.077 | 0.5 | YES |
| 63 | LSM2 | LSM2 | LSM2 | 5663 | 0.076 | 0.51 | YES |
| 64 | HNRNPK | HNRNPK | HNRNPK | 5719 | 0.075 | 0.51 | YES |
| 65 | USP39 | USP39 | USP39 | 5747 | 0.074 | 0.52 | YES |
| 66 | HNRNPA1L2 | HNRNPA1L2 | HNRNPA1L2 | 5781 | 0.073 | 0.52 | YES |
| 67 | PQBP1 | PQBP1 | PQBP1 | 5907 | 0.07 | 0.52 | YES |
| 68 | SF3B2 | SF3B2 | SF3B2 | 6057 | 0.066 | 0.52 | YES |
| 69 | U2AF2 | U2AF2 | U2AF2 | 6116 | 0.064 | 0.52 | YES |
| 70 | NCBP1 | NCBP1 | NCBP1 | 6118 | 0.064 | 0.53 | YES |
| 71 | SART1 | SART1 | SART1 | 6169 | 0.062 | 0.53 | YES |
| 72 | TRA2B | TRA2B | TRA2B | 6211 | 0.061 | 0.53 | YES |
| 73 | LSM5 | LSM5 | LSM5 | 6267 | 0.06 | 0.53 | YES |
| 74 | PHF5A | PHF5A | PHF5A | 6292 | 0.059 | 0.54 | YES |
| 75 | HNRNPA1 | HNRNPA1 | HNRNPA1 | 6315 | 0.059 | 0.54 | YES |
| 76 | HNRNPU | HNRNPU | HNRNPU | 6452 | 0.055 | 0.54 | YES |
| 77 | CDC5L | CDC5L | CDC5L | 6470 | 0.054 | 0.54 | YES |
| 78 | SNRPE | SNRPE | SNRPE | 6487 | 0.054 | 0.55 | YES |
| 79 | SF3B3 | SF3B3 | SF3B3 | 6528 | 0.052 | 0.55 | YES |
| 80 | PRPF19 | PRPF19 | PRPF19 | 6539 | 0.052 | 0.55 | YES |
| 81 | SF3A2 | SF3A2 | SF3A2 | 6576 | 0.051 | 0.56 | YES |
| 82 | SF3A1 | SF3A1 | SF3A1 | 6577 | 0.051 | 0.56 | YES |
| 83 | LSM4 | LSM4 | LSM4 | 6597 | 0.051 | 0.56 | YES |
| 84 | RBM17 | RBM17 | RBM17 | 6688 | 0.048 | 0.56 | YES |
| 85 | SNRPD2 | SNRPD2 | SNRPD2 | 6695 | 0.048 | 0.57 | YES |
| 86 | SLU7 | SLU7 | SLU7 | 6765 | 0.046 | 0.57 | YES |
| 87 | CTNNBL1 | CTNNBL1 | CTNNBL1 | 6832 | 0.044 | 0.57 | YES |
| 88 | DDX42 | DDX42 | DDX42 | 6906 | 0.042 | 0.57 | YES |
| 89 | SF3B4 | SF3B4 | SF3B4 | 6911 | 0.042 | 0.57 | YES |
| 90 | PRPF31 | PRPF31 | PRPF31 | 7217 | 0.034 | 0.56 | NO |
| 91 | PRPF6 | PRPF6 | PRPF6 | 7315 | 0.032 | 0.55 | NO |
| 92 | DDX23 | DDX23 | DDX23 | 7370 | 0.03 | 0.55 | NO |
| 93 | SNW1 | SNW1 | SNW1 | 7408 | 0.029 | 0.55 | NO |
| 94 | AQR | AQR | AQR | 7423 | 0.029 | 0.56 | NO |
| 95 | ISY1 | ISY1 | ISY1 | 7524 | 0.026 | 0.55 | NO |
| 96 | SNRNP70 | SNRNP70 | SNRNP70 | 7842 | 0.019 | 0.54 | NO |
| 97 | DHX16 | DHX16 | DHX16 | 8013 | 0.014 | 0.53 | NO |
| 98 | SF3B5 | SF3B5 | SF3B5 | 8286 | 0.0076 | 0.52 | NO |
| 99 | DHX38 | DHX38 | DHX38 | 8373 | 0.0054 | 0.51 | NO |
| 100 | CRNKL1 | CRNKL1 | CRNKL1 | 8480 | 0.0027 | 0.51 | NO |
| 101 | CCDC12 | CCDC12 | CCDC12 | 8647 | -0.0015 | 0.5 | NO |
| 102 | DDX5 | DDX5 | DDX5 | 8710 | -0.0032 | 0.5 | NO |
| 103 | SNRNP200 | SNRNP200 | SNRNP200 | 8861 | -0.0071 | 0.49 | NO |
| 104 | ACIN1 | ACIN1 | ACIN1 | 8895 | -0.0079 | 0.49 | NO |
| 105 | CHERP | CHERP | CHERP | 8898 | -0.008 | 0.49 | NO |
| 106 | PLRG1 | PLRG1 | PLRG1 | 9116 | -0.014 | 0.48 | NO |
| 107 | SF3B1 | SF3B1 | SF3B1 | 9329 | -0.019 | 0.47 | NO |
| 108 | TRA2A | TRA2A | TRA2A | 9389 | -0.021 | 0.47 | NO |
| 109 | PRPF38B | PRPF38B | PRPF38B | 9453 | -0.023 | 0.46 | NO |
| 110 | RBM25 | RBM25 | RBM25 | 9474 | -0.023 | 0.46 | NO |
| 111 | THOC1 | THOC1 | THOC1 | 9518 | -0.025 | 0.46 | NO |
| 112 | XAB2 | XAB2 | XAB2 | 9895 | -0.034 | 0.45 | NO |
| 113 | PRPF40B | PRPF40B | PRPF40B | 13182 | -0.14 | 0.29 | NO |
| 114 | HSPA1L | HSPA1L | HSPA1L | 16001 | -0.28 | 0.16 | NO |
Figure S49. Get High-res Image This plot shows mRNAseq_cNMF expression data heatmap (on the left) a RunningEnrichmentScore(RES) plot (on the top right) and a Signal2Noise(S2N) plot (on the bottom right) of genes in the pathway: KEGG SPLICEOSOME.

Figure S50. Get High-res Image For the top 5 core enriched genes in the pathway: KEGG SPLICEOSOME, this volcano plot shows how much they are up/down-regulated and significant. The significance was calculated by empirical bayesian fit
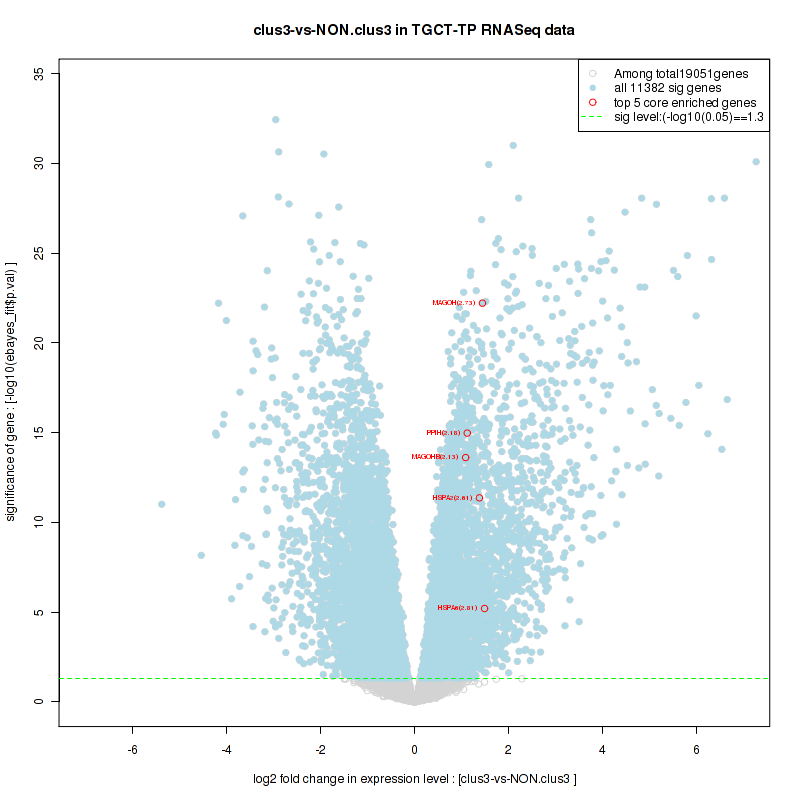
Table S26. Get Full Table This table shows a Running Enrichment Score (RES) of each gene in this pathway, that is, the enrichment score at this point in the ranked list of genes. All genes are ranked by Signal-to-Noise (S2N), a measure of similarity as default and are used to obtain ES matrix of all genes. In this way, GSEA tool uses expression pattern of not only overlapped genes but also not-overlapped genes to produce ES matrix.
| Rank | GENE | SYMBOL | DESC | LIST.LOC | S2N | RES | CORE_ENRICHMENT |
|---|---|---|---|---|---|---|---|
| 1 | RPL36A | RPL36A | RPL36A | 1164 | 0.38 | -0.046 | YES |
| 2 | MAGOH | MAGOH | MAGOH | 1272 | 0.35 | -0.038 | YES |
| 3 | RPL3L | RPL3L | RPL3L | 1613 | 0.3 | -0.044 | YES |
| 4 | TGS1 | TGS1 | TGS1 | 1780 | 0.28 | -0.041 | YES |
| 5 | PSMB2 | PSMB2 | PSMB2 | 1782 | 0.28 | -0.03 | YES |
| 6 | PSMD11 | PSMD11 | PSMD11 | 1865 | 0.27 | -0.023 | YES |
| 7 | NUP54 | NUP54 | NUP54 | 1877 | 0.27 | -0.013 | YES |
| 8 | PSMB6 | PSMB6 | PSMB6 | 1976 | 0.26 | -0.0075 | YES |
| 9 | RPL21 | RPL21 | RPL21 | 2102 | 0.24 | -0.0042 | YES |
| 10 | PSMD10 | PSMD10 | PSMD10 | 2184 | 0.24 | 0.0012 | YES |
| 11 | PSMA5 | PSMA5 | PSMA5 | 2209 | 0.24 | 0.0095 | YES |
| 12 | RPL26L1 | RPL26L1 | RPL26L1 | 2249 | 0.23 | 0.017 | YES |
| 13 | NUP205 | NUP205 | NUP205 | 2411 | 0.22 | 0.017 | YES |
| 14 | SNRPF | SNRPF | SNRPF | 2450 | 0.22 | 0.024 | YES |
| 15 | RPL39 | RPL39 | RPL39 | 2483 | 0.21 | 0.031 | YES |
| 16 | EXOSC3 | EXOSC3 | EXOSC3 | 2522 | 0.21 | 0.038 | YES |
| 17 | SEH1L | SEH1L | SEH1L | 2546 | 0.21 | 0.045 | YES |
| 18 | PSMB3 | PSMB3 | PSMB3 | 2556 | 0.21 | 0.053 | YES |
| 19 | GEMIN7 | GEMIN7 | GEMIN7 | 2608 | 0.2 | 0.059 | YES |
| 20 | PSMC4 | PSMC4 | PSMC4 | 2609 | 0.2 | 0.067 | YES |
| 21 | PSMD12 | PSMD12 | PSMD12 | 2627 | 0.2 | 0.074 | YES |
| 22 | UPF3B | UPF3B | UPF3B | 2631 | 0.2 | 0.083 | YES |
| 23 | NUP37 | NUP37 | NUP37 | 2656 | 0.2 | 0.09 | YES |
| 24 | PHAX | PHAX | PHAX | 2679 | 0.2 | 0.096 | YES |
| 25 | HSPB1 | HSPB1 | HSPB1 | 2748 | 0.2 | 0.1 | YES |
| 26 | PSMA7 | PSMA7 | PSMA7 | 2758 | 0.2 | 0.11 | YES |
| 27 | C2orf29 | C2orf29 | C2orf29 | 2849 | 0.19 | 0.11 | YES |
| 28 | WDR77 | WDR77 | WDR77 | 2931 | 0.18 | 0.11 | YES |
| 29 | SMN2 | SMN2 | SMN2 | 2959 | 0.18 | 0.12 | YES |
| 30 | NUP43 | NUP43 | NUP43 | 2967 | 0.18 | 0.13 | YES |
| 31 | PSMA2 | PSMA2 | PSMA2 | 3005 | 0.18 | 0.13 | YES |
| 32 | EXOSC2 | EXOSC2 | EXOSC2 | 3036 | 0.18 | 0.14 | YES |
| 33 | RPL24 | RPL24 | RPL24 | 3051 | 0.18 | 0.14 | YES |
| 34 | NUP88 | NUP88 | NUP88 | 3053 | 0.18 | 0.15 | YES |
| 35 | PSMD3 | PSMD3 | PSMD3 | 3098 | 0.18 | 0.16 | YES |
| 36 | EXOSC4 | EXOSC4 | EXOSC4 | 3150 | 0.17 | 0.16 | YES |
| 37 | PSMA1 | PSMA1 | PSMA1 | 3170 | 0.17 | 0.17 | YES |
| 38 | GSPT2 | GSPT2 | GSPT2 | 3184 | 0.17 | 0.17 | YES |
| 39 | NUP85 | NUP85 | NUP85 | 3210 | 0.17 | 0.18 | YES |
| 40 | EIF4E | EIF4E | EIF4E | 3279 | 0.17 | 0.18 | YES |
| 41 | LSM3 | LSM3 | LSM3 | 3324 | 0.16 | 0.19 | YES |
| 42 | SNRPD1 | SNRPD1 | SNRPD1 | 3356 | 0.16 | 0.19 | YES |
| 43 | PSMD7 | PSMD7 | PSMD7 | 3368 | 0.16 | 0.2 | YES |
| 44 | ETF1 | ETF1 | ETF1 | 3413 | 0.16 | 0.2 | YES |
| 45 | EXOSC8 | EXOSC8 | EXOSC8 | 3434 | 0.16 | 0.21 | YES |
| 46 | EXOSC7 | EXOSC7 | EXOSC7 | 3446 | 0.16 | 0.21 | YES |
| 47 | GEMIN4 | GEMIN4 | GEMIN4 | 3463 | 0.16 | 0.22 | YES |
| 48 | EXOSC9 | EXOSC9 | EXOSC9 | 3533 | 0.16 | 0.22 | YES |
| 49 | CLNS1A | CLNS1A | CLNS1A | 3543 | 0.16 | 0.23 | YES |
| 50 | GEMIN6 | GEMIN6 | GEMIN6 | 3581 | 0.15 | 0.23 | YES |
| 51 | SNRPG | SNRPG | SNRPG | 3699 | 0.15 | 0.23 | YES |
| 52 | PSMB5 | PSMB5 | PSMB5 | 3705 | 0.15 | 0.24 | YES |
| 53 | PSMC2 | PSMC2 | PSMC2 | 3716 | 0.15 | 0.24 | YES |
| 54 | PSME4 | PSME4 | PSME4 | 3749 | 0.14 | 0.25 | YES |
| 55 | PATL1 | PATL1 | PATL1 | 3802 | 0.14 | 0.25 | YES |
| 56 | EIF4A3 | EIF4A3 | EIF4A3 | 3812 | 0.14 | 0.26 | YES |
| 57 | RBM8A | RBM8A | RBM8A | 3851 | 0.14 | 0.26 | YES |
| 58 | EIF4A1 | EIF4A1 | EIF4A1 | 3864 | 0.14 | 0.26 | YES |
| 59 | NUP155 | NUP155 | NUP155 | 3886 | 0.14 | 0.27 | YES |
| 60 | POM121 | POM121 | POM121 | 3971 | 0.14 | 0.27 | YES |
| 61 | GEMIN5 | GEMIN5 | GEMIN5 | 3995 | 0.14 | 0.27 | YES |
| 62 | PSMC1 | PSMC1 | PSMC1 | 4002 | 0.14 | 0.28 | YES |
| 63 | LSM6 | LSM6 | LSM6 | 4014 | 0.14 | 0.28 | YES |
| 64 | MAPKAPK2 | MAPKAPK2 | MAPKAPK2 | 4018 | 0.13 | 0.29 | YES |
| 65 | RPS26 | RPS26 | RPS26 | 4024 | 0.13 | 0.3 | YES |
| 66 | HNRNPD | HNRNPD | HNRNPD | 4070 | 0.13 | 0.3 | YES |
| 67 | RPL8 | RPL8 | RPL8 | 4151 | 0.13 | 0.3 | YES |
| 68 | PSMB7 | PSMB7 | PSMB7 | 4212 | 0.13 | 0.3 | YES |
| 69 | PSMA6 | PSMA6 | PSMA6 | 4218 | 0.13 | 0.31 | YES |
| 70 | KHSRP | KHSRP | KHSRP | 4269 | 0.12 | 0.31 | YES |
| 71 | EIF4G1 | EIF4G1 | EIF4G1 | 4295 | 0.12 | 0.31 | YES |
| 72 | RPL23A | RPL23A | RPL23A | 4322 | 0.12 | 0.32 | YES |
| 73 | PSMD6 | PSMD6 | PSMD6 | 4328 | 0.12 | 0.32 | YES |
| 74 | EDC4 | EDC4 | EDC4 | 4360 | 0.12 | 0.32 | YES |
| 75 | EXOSC1 | EXOSC1 | EXOSC1 | 4366 | 0.12 | 0.33 | YES |
| 76 | SNRPD3 | SNRPD3 | SNRPD3 | 4387 | 0.12 | 0.33 | YES |
| 77 | HSPA8 | HSPA8 | HSPA8 | 4395 | 0.12 | 0.34 | YES |
| 78 | PSMA3 | PSMA3 | PSMA3 | 4434 | 0.12 | 0.34 | YES |
| 79 | PARN | PARN | PARN | 4463 | 0.12 | 0.34 | YES |
| 80 | HSPA1B | HSPA1B | HSPA1B | 4531 | 0.12 | 0.34 | YES |
| 81 | PSMC5 | PSMC5 | PSMC5 | 4546 | 0.11 | 0.35 | YES |
| 82 | PSMC3 | PSMC3 | PSMC3 | 4554 | 0.11 | 0.35 | YES |
| 83 | NCBP2 | NCBP2 | NCBP2 | 4564 | 0.11 | 0.36 | YES |
| 84 | PSMD5 | PSMD5 | PSMD5 | 4600 | 0.11 | 0.36 | YES |
| 85 | PSMB1 | PSMB1 | PSMB1 | 4612 | 0.11 | 0.36 | YES |
| 86 | PSMB4 | PSMB4 | PSMB4 | 4675 | 0.11 | 0.36 | YES |
| 87 | RPS27A | RPS27A | RPS27A | 4686 | 0.11 | 0.37 | YES |
| 88 | PSMD2 | PSMD2 | PSMD2 | 4743 | 0.11 | 0.37 | YES |
| 89 | RPL10 | RPL10 | RPL10 | 4758 | 0.11 | 0.37 | YES |
| 90 | SMG5 | SMG5 | SMG5 | 4763 | 0.11 | 0.38 | YES |
| 91 | RPL23 | RPL23 | RPL23 | 4867 | 0.1 | 0.38 | YES |
| 92 | RPL12 | RPL12 | RPL12 | 4909 | 0.1 | 0.38 | YES |
| 93 | CNOT8 | CNOT8 | CNOT8 | 4920 | 0.1 | 0.38 | YES |
| 94 | PSMD14 | PSMD14 | PSMD14 | 4935 | 0.1 | 0.38 | YES |
| 95 | DCPS | DCPS | DCPS | 4940 | 0.099 | 0.39 | YES |
| 96 | NUP35 | NUP35 | NUP35 | 4968 | 0.098 | 0.39 | YES |
| 97 | PSMA4 | PSMA4 | PSMA4 | 4995 | 0.098 | 0.39 | YES |
| 98 | NUP153 | NUP153 | NUP153 | 5027 | 0.096 | 0.4 | YES |
| 99 | SNRPB | SNRPB | SNRPB | 5034 | 0.096 | 0.4 | YES |
| 100 | DDX20 | DDX20 | DDX20 | 5095 | 0.094 | 0.4 | YES |
| 101 | RPL26 | RPL26 | RPL26 | 5114 | 0.094 | 0.4 | YES |
| 102 | PPP2R2A | PPP2R2A | PPP2R2A | 5145 | 0.092 | 0.4 | YES |
| 103 | SMN1 | SMN1 | SMN1 | 5179 | 0.091 | 0.41 | YES |
| 104 | PPP2CA | PPP2CA | PPP2CA | 5184 | 0.091 | 0.41 | YES |
| 105 | PRMT5 | PRMT5 | PRMT5 | 5196 | 0.091 | 0.41 | YES |
| 106 | RPL27 | RPL27 | RPL27 | 5296 | 0.087 | 0.41 | YES |
| 107 | RPL19 | RPL19 | RPL19 | 5466 | 0.082 | 0.41 | YES |
| 108 | YWHAZ | YWHAZ | YWHAZ | 5472 | 0.082 | 0.41 | YES |
| 109 | DCP1A | DCP1A | DCP1A | 5526 | 0.081 | 0.41 | YES |
| 110 | FAU | FAU | FAU | 5548 | 0.08 | 0.41 | YES |
| 111 | PSMD13 | PSMD13 | PSMD13 | 5549 | 0.08 | 0.42 | YES |
| 112 | CNOT6 | CNOT6 | CNOT6 | 5550 | 0.08 | 0.42 | YES |
| 113 | TNPO1 | TNPO1 | TNPO1 | 5566 | 0.079 | 0.42 | YES |
| 114 | RPL18A | RPL18A | RPL18A | 5571 | 0.079 | 0.42 | YES |
| 115 | ZFP36L1 | ZFP36L1 | ZFP36L1 | 5578 | 0.079 | 0.43 | YES |
| 116 | RPS8 | RPS8 | RPS8 | 5595 | 0.078 | 0.43 | YES |
| 117 | RPL17 | RPL17 | RPL17 | 5610 | 0.078 | 0.43 | YES |
| 118 | LSM2 | LSM2 | LSM2 | 5663 | 0.076 | 0.43 | YES |
| 119 | PSMD4 | PSMD4 | PSMD4 | 5666 | 0.076 | 0.44 | YES |
| 120 | RPL14 | RPL14 | RPL14 | 5694 | 0.076 | 0.44 | YES |
| 121 | RPS3 | RPS3 | RPS3 | 5695 | 0.075 | 0.44 | YES |
| 122 | RPL11 | RPL11 | RPL11 | 5726 | 0.074 | 0.44 | YES |
| 123 | RQCD1 | RQCD1 | RQCD1 | 5740 | 0.074 | 0.44 | YES |
| 124 | RPLP2 | RPLP2 | RPLP2 | 5746 | 0.074 | 0.45 | YES |
| 125 | RPS2 | RPS2 | RPS2 | 5831 | 0.072 | 0.44 | YES |
| 126 | NUP50 | NUP50 | NUP50 | 5871 | 0.071 | 0.45 | YES |
| 127 | RPS13 | RPS13 | RPS13 | 5919 | 0.07 | 0.45 | YES |
| 128 | NUP107 | NUP107 | NUP107 | 5927 | 0.07 | 0.45 | YES |
| 129 | PSMD1 | PSMD1 | PSMD1 | 5970 | 0.068 | 0.45 | YES |
| 130 | RPL27A | RPL27A | RPL27A | 5971 | 0.068 | 0.45 | YES |
| 131 | RPL7 | RPL7 | RPL7 | 5973 | 0.068 | 0.45 | YES |
| 132 | RPS4Y1 | RPS4Y1 | RPS4Y1 | 6081 | 0.065 | 0.45 | YES |
| 133 | RPS25 | RPS25 | RPS25 | 6109 | 0.064 | 0.45 | YES |
| 134 | NCBP1 | NCBP1 | NCBP1 | 6118 | 0.064 | 0.46 | YES |
| 135 | RPS14 | RPS14 | RPS14 | 6145 | 0.063 | 0.46 | YES |
| 136 | RPS21 | RPS21 | RPS21 | 6147 | 0.063 | 0.46 | YES |
| 137 | NUP93 | NUP93 | NUP93 | 6160 | 0.063 | 0.46 | YES |
| 138 | PSMC6 | PSMC6 | PSMC6 | 6175 | 0.062 | 0.46 | YES |
| 139 | RPL38 | RPL38 | RPL38 | 6222 | 0.061 | 0.46 | YES |
| 140 | RPS24 | RPS24 | RPS24 | 6265 | 0.06 | 0.46 | YES |
| 141 | LSM5 | LSM5 | LSM5 | 6267 | 0.06 | 0.46 | YES |
| 142 | RPL35A | RPL35A | RPL35A | 6478 | 0.054 | 0.46 | YES |
| 143 | SNRPE | SNRPE | SNRPE | 6487 | 0.054 | 0.46 | YES |
| 144 | RAE1 | RAE1 | RAE1 | 6489 | 0.054 | 0.46 | YES |
| 145 | RNPS1 | RNPS1 | RNPS1 | 6512 | 0.053 | 0.46 | YES |
| 146 | RPL10A | RPL10A | RPL10A | 6534 | 0.052 | 0.46 | YES |
| 147 | RPS9 | RPS9 | RPS9 | 6562 | 0.052 | 0.46 | YES |
| 148 | RPS10 | RPS10 | RPS10 | 6564 | 0.052 | 0.46 | YES |
| 149 | LSM4 | LSM4 | LSM4 | 6597 | 0.051 | 0.46 | YES |
| 150 | XPO1 | XPO1 | XPO1 | 6692 | 0.048 | 0.46 | YES |
| 151 | SNRPD2 | SNRPD2 | SNRPD2 | 6695 | 0.048 | 0.46 | YES |
| 152 | RPL41 | RPL41 | RPL41 | 6730 | 0.047 | 0.46 | YES |
| 153 | UBA52 | UBA52 | UBA52 | 6757 | 0.047 | 0.46 | YES |
| 154 | RPS12 | RPS12 | RPS12 | 6761 | 0.046 | 0.47 | YES |
| 155 | PABPC1 | PABPC1 | PABPC1 | 6776 | 0.046 | 0.47 | YES |
| 156 | RPL30 | RPL30 | RPL30 | 6873 | 0.043 | 0.46 | YES |
| 157 | RPS18 | RPS18 | RPS18 | 6917 | 0.042 | 0.46 | YES |
| 158 | EIF4B | EIF4B | EIF4B | 6921 | 0.042 | 0.46 | YES |
| 159 | RPS27 | RPS27 | RPS27 | 6924 | 0.042 | 0.47 | YES |
| 160 | RPL13 | RPL13 | RPL13 | 6937 | 0.041 | 0.47 | YES |
| 161 | RPL37 | RPL37 | RPL37 | 6958 | 0.041 | 0.47 | YES |
| 162 | RPL31 | RPL31 | RPL31 | 6960 | 0.041 | 0.47 | YES |
| 163 | CNOT3 | CNOT3 | CNOT3 | 6969 | 0.041 | 0.47 | YES |
| 164 | LSM1 | LSM1 | LSM1 | 6984 | 0.04 | 0.47 | YES |
| 165 | RPLP0 | RPLP0 | RPLP0 | 7175 | 0.036 | 0.46 | NO |
| 166 | AAAS | AAAS | AAAS | 7179 | 0.036 | 0.46 | NO |
| 167 | PSMD8 | PSMD8 | PSMD8 | 7181 | 0.035 | 0.47 | NO |
| 168 | NUPL2 | NUPL2 | NUPL2 | 7219 | 0.034 | 0.46 | NO |
| 169 | PRKCA | PRKCA | PRKCA | 7253 | 0.033 | 0.46 | NO |
| 170 | RPL22 | RPL22 | RPL22 | 7255 | 0.033 | 0.47 | NO |
| 171 | RPSA | RPSA | RPSA | 7270 | 0.033 | 0.47 | NO |
| 172 | RPL3 | RPL3 | RPL3 | 7289 | 0.032 | 0.47 | NO |
| 173 | PPP2R1A | PPP2R1A | PPP2R1A | 7361 | 0.031 | 0.46 | NO |
| 174 | RPS17 | RPS17 | RPS17 | 7371 | 0.03 | 0.46 | NO |
| 175 | RPS23 | RPS23 | RPS23 | 7392 | 0.03 | 0.46 | NO |
| 176 | RPS7 | RPS7 | RPS7 | 7454 | 0.028 | 0.46 | NO |
| 177 | NUP210 | NUP210 | NUP210 | 7456 | 0.028 | 0.46 | NO |
| 178 | RPL6 | RPL6 | RPL6 | 7458 | 0.028 | 0.46 | NO |
| 179 | DCP1B | DCP1B | DCP1B | 7508 | 0.027 | 0.46 | NO |
| 180 | RPS15A | RPS15A | RPS15A | 7519 | 0.026 | 0.46 | NO |
| 181 | NUP133 | NUP133 | NUP133 | 7555 | 0.025 | 0.46 | NO |
| 182 | RPSAP9 | RPSAP9 | RPSAP9 | 7587 | 0.025 | 0.46 | NO |
| 183 | TNKS1BP1 | TNKS1BP1 | TNKS1BP1 | 7628 | 0.024 | 0.46 | NO |
| 184 | RPL9 | RPL9 | RPL9 | 7674 | 0.023 | 0.46 | NO |
| 185 | RPS15 | RPS15 | RPS15 | 7680 | 0.022 | 0.46 | NO |
| 186 | CNOT10 | CNOT10 | CNOT10 | 7779 | 0.02 | 0.46 | NO |
| 187 | RPL5 | RPL5 | RPL5 | 7814 | 0.019 | 0.46 | NO |
| 188 | RPL35 | RPL35 | RPL35 | 7877 | 0.018 | 0.45 | NO |
| 189 | DIS3 | DIS3 | DIS3 | 7904 | 0.017 | 0.45 | NO |
| 190 | RPS20 | RPS20 | RPS20 | 7971 | 0.015 | 0.45 | NO |
| 191 | NUPL1 | NUPL1 | NUPL1 | 7990 | 0.015 | 0.45 | NO |
| 192 | RPS16 | RPS16 | RPS16 | 8091 | 0.012 | 0.44 | NO |
| 193 | PSMD9 | PSMD9 | PSMD9 | 8104 | 0.012 | 0.44 | NO |
| 194 | RANBP2 | RANBP2 | RANBP2 | 8139 | 0.011 | 0.44 | NO |
| 195 | EXOSC5 | EXOSC5 | EXOSC5 | 8174 | 0.01 | 0.44 | NO |
| 196 | RPS6 | RPS6 | RPS6 | 8189 | 0.0098 | 0.44 | NO |
| 197 | RPL36 | RPL36 | RPL36 | 8289 | 0.0075 | 0.44 | NO |
| 198 | RPS11 | RPS11 | RPS11 | 8302 | 0.0072 | 0.44 | NO |
| 199 | RPL37A | RPL37A | RPL37A | 8324 | 0.0067 | 0.44 | NO |
| 200 | RPS29 | RPS29 | RPS29 | 8353 | 0.0059 | 0.43 | NO |
| 201 | RPS3A | RPS3A | RPS3A | 8355 | 0.0059 | 0.43 | NO |
| 202 | RPL32 | RPL32 | RPL32 | 8474 | 0.0028 | 0.43 | NO |
| 203 | SNUPN | SNUPN | SNUPN | 8483 | 0.0026 | 0.43 | NO |
| 204 | EXOSC6 | EXOSC6 | EXOSC6 | 8540 | 0.00097 | 0.42 | NO |
| 205 | NUP188 | NUP188 | NUP188 | 8595 | -0.00044 | 0.42 | NO |
| 206 | ELAVL1 | ELAVL1 | ELAVL1 | 8610 | -0.00083 | 0.42 | NO |
| 207 | RPS5 | RPS5 | RPS5 | 8614 | -0.00091 | 0.42 | NO |
| 208 | PRKCD | PRKCD | PRKCD | 8793 | -0.0054 | 0.41 | NO |
| 209 | RPS19 | RPS19 | RPS19 | 8799 | -0.0055 | 0.41 | NO |
| 210 | RPLP1 | RPLP1 | RPLP1 | 8913 | -0.0084 | 0.41 | NO |
| 211 | YWHAB | YWHAB | YWHAB | 8973 | -0.0096 | 0.4 | NO |
| 212 | RPL13A | RPL13A | RPL13A | 8974 | -0.0097 | 0.4 | NO |
| 213 | RPL4 | RPL4 | RPL4 | 8994 | -0.01 | 0.4 | NO |
| 214 | RPL7A | RPL7A | RPL7A | 9015 | -0.011 | 0.4 | NO |
| 215 | PAIP1 | PAIP1 | PAIP1 | 9138 | -0.014 | 0.4 | NO |
| 216 | PSME2 | PSME2 | PSME2 | 9219 | -0.016 | 0.39 | NO |
| 217 | RPL15 | RPL15 | RPL15 | 9230 | -0.017 | 0.39 | NO |
| 218 | RPL29 | RPL29 | RPL29 | 9251 | -0.017 | 0.39 | NO |
| 219 | NUP62 | NUP62 | NUP62 | 9419 | -0.022 | 0.38 | NO |
| 220 | CASC3 | CASC3 | CASC3 | 9455 | -0.023 | 0.38 | NO |
| 221 | RPL18 | RPL18 | RPL18 | 9497 | -0.024 | 0.38 | NO |
| 222 | RPS4X | RPS4X | RPS4X | 9501 | -0.024 | 0.38 | NO |
| 223 | MAPK14 | MAPK14 | MAPK14 | 9605 | -0.027 | 0.38 | NO |
| 224 | CNOT7 | CNOT7 | CNOT7 | 9751 | -0.031 | 0.37 | NO |
| 225 | EDC3 | EDC3 | EDC3 | 9881 | -0.034 | 0.37 | NO |
| 226 | RPL34 | RPL34 | RPL34 | 9986 | -0.037 | 0.36 | NO |
| 227 | DCP2 | DCP2 | DCP2 | 9993 | -0.037 | 0.36 | NO |
| 228 | SMG1 | SMG1 | SMG1 | 10109 | -0.04 | 0.36 | NO |
| 229 | NUP214 | NUP214 | NUP214 | 10148 | -0.041 | 0.36 | NO |
| 230 | CNOT2 | CNOT2 | CNOT2 | 10258 | -0.044 | 0.36 | NO |
| 231 | UPF2 | UPF2 | UPF2 | 10759 | -0.058 | 0.33 | NO |
| 232 | TPR | TPR | TPR | 10900 | -0.063 | 0.33 | NO |
| 233 | AKT1 | AKT1 | AKT1 | 10949 | -0.065 | 0.33 | NO |
| 234 | PSME1 | PSME1 | PSME1 | 11030 | -0.067 | 0.32 | NO |
| 235 | RPL28 | RPL28 | RPL28 | 11113 | -0.07 | 0.32 | NO |
| 236 | ANP32A | ANP32A | ANP32A | 11134 | -0.07 | 0.32 | NO |
| 237 | PSMF1 | PSMF1 | PSMF1 | 11150 | -0.071 | 0.33 | NO |
| 238 | SMG7 | SMG7 | SMG7 | 11188 | -0.072 | 0.33 | NO |
| 239 | SMG6 | SMG6 | SMG6 | 11245 | -0.073 | 0.33 | NO |
| 240 | CNOT4 | CNOT4 | CNOT4 | 11545 | -0.083 | 0.32 | NO |
| 241 | RPS28 | RPS28 | RPS28 | 11553 | -0.084 | 0.32 | NO |
| 242 | EIF4A2 | EIF4A2 | EIF4A2 | 11657 | -0.087 | 0.32 | NO |
| 243 | UPF3A | UPF3A | UPF3A | 11915 | -0.095 | 0.31 | NO |
| 244 | PSMB10 | PSMB10 | PSMB10 | 12004 | -0.098 | 0.31 | NO |
| 245 | PSMB8 | PSMB8 | PSMB8 | 12633 | -0.12 | 0.28 | NO |
| 246 | ZFP36 | ZFP36 | ZFP36 | 12811 | -0.12 | 0.27 | NO |
| 247 | TNFSF13 | TNFSF13 | TNFSF13 | 12967 | -0.13 | 0.27 | NO |
| 248 | DDX6 | DDX6 | DDX6 | 13041 | -0.13 | 0.27 | NO |
| 249 | PSMB9 | PSMB9 | PSMB9 | 13665 | -0.16 | 0.24 | NO |
| 250 | PSMA8 | PSMA8 | PSMA8 | 15143 | -0.22 | 0.18 | NO |
| 251 | MAPK11 | MAPK11 | MAPK11 | 15258 | -0.23 | 0.18 | NO |
| 252 | XRN1 | XRN1 | XRN1 | 15464 | -0.24 | 0.18 | NO |
| 253 | FAM153A | FAM153A | FAM153A | 16535 | -0.31 | 0.13 | NO |
Figure S51. Get High-res Image This plot shows mRNAseq_cNMF expression data heatmap (on the left) a RunningEnrichmentScore(RES) plot (on the top right) and a Signal2Noise(S2N) plot (on the bottom right) of genes in the pathway: KEGG HUNTINGTONS DISEASE.

Figure S52. Get High-res Image For the top 5 core enriched genes in the pathway: KEGG HUNTINGTONS DISEASE, this volcano plot shows how much they are up/down-regulated and significant. The significance was calculated by empirical bayesian fit
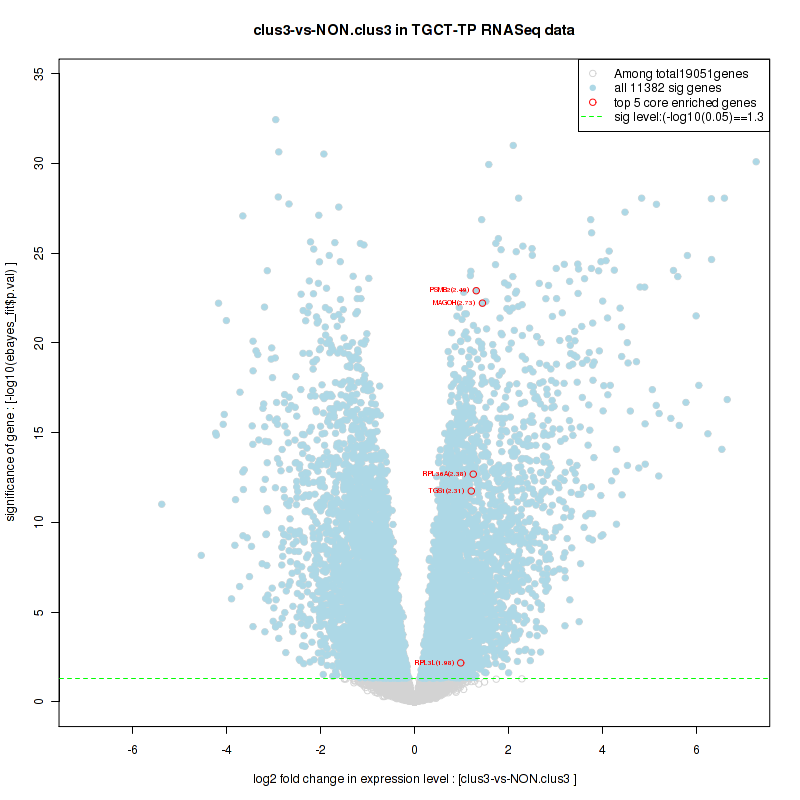
Table S27. Get Full Table This table shows a Running Enrichment Score (RES) of each gene in this pathway, that is, the enrichment score at this point in the ranked list of genes. All genes are ranked by Signal-to-Noise (S2N), a measure of similarity as default and are used to obtain ES matrix of all genes. In this way, GSEA tool uses expression pattern of not only overlapped genes but also not-overlapped genes to produce ES matrix.
| Rank | GENE | SYMBOL | DESC | LIST.LOC | S2N | RES | CORE_ENRICHMENT |
|---|---|---|---|---|---|---|---|
| 1 | LDHD | LDHD | LDHD | 387 | 0.65 | 0.071 | YES |
| 2 | SLC25A4 | SLC25A4 | SLC25A4 | 1529 | 0.31 | 0.056 | YES |
| 3 | TIMM8A | TIMM8A | TIMM8A | 1725 | 0.29 | 0.086 | YES |
| 4 | VDAC1 | VDAC1 | VDAC1 | 1917 | 0.26 | 0.11 | YES |
| 5 | GRPEL1 | GRPEL1 | GRPEL1 | 1952 | 0.26 | 0.15 | YES |
| 6 | TIMM10 | TIMM10 | TIMM10 | 1974 | 0.26 | 0.18 | YES |
| 7 | DNAJC19 | DNAJC19 | DNAJC19 | 2125 | 0.24 | 0.21 | YES |
| 8 | ATP5G1 | ATP5G1 | ATP5G1 | 2164 | 0.24 | 0.24 | YES |
| 9 | FXN | FXN | FXN | 2224 | 0.23 | 0.27 | YES |
| 10 | TOMM40 | TOMM40 | TOMM40 | 2665 | 0.2 | 0.28 | YES |
| 11 | TIMM22 | TIMM22 | TIMM22 | 2674 | 0.2 | 0.3 | YES |
| 12 | HSPA9 | HSPA9 | HSPA9 | 2752 | 0.2 | 0.33 | YES |
| 13 | TIMM50 | TIMM50 | TIMM50 | 2835 | 0.19 | 0.35 | YES |
| 14 | TIMM8B | TIMM8B | TIMM8B | 2884 | 0.19 | 0.38 | YES |
| 15 | CHCHD4 | CHCHD4 | CHCHD4 | 2996 | 0.18 | 0.39 | YES |
| 16 | IDH3G | IDH3G | IDH3G | 3038 | 0.18 | 0.42 | YES |
| 17 | TOMM7 | TOMM7 | TOMM7 | 3209 | 0.17 | 0.43 | YES |
| 18 | TIMM44 | TIMM44 | TIMM44 | 3252 | 0.17 | 0.45 | YES |
| 19 | CYC1 | CYC1 | CYC1 | 3266 | 0.17 | 0.48 | YES |
| 20 | ATP5B | ATP5B | ATP5B | 3337 | 0.16 | 0.5 | YES |
| 21 | TOMM20 | TOMM20 | TOMM20 | 3571 | 0.15 | 0.51 | YES |
| 22 | C18orf55 | C18orf55 | C18orf55 | 3841 | 0.14 | 0.51 | YES |
| 23 | SAMM50 | SAMM50 | SAMM50 | 3850 | 0.14 | 0.53 | YES |
| 24 | TIMM13 | TIMM13 | TIMM13 | 3972 | 0.14 | 0.54 | YES |
| 25 | TIMM17A | TIMM17A | TIMM17A | 4309 | 0.12 | 0.54 | YES |
| 26 | HSPD1 | HSPD1 | HSPD1 | 4506 | 0.12 | 0.55 | YES |
| 27 | TAZ | TAZ | TAZ | 4594 | 0.11 | 0.56 | YES |
| 28 | HSCB | HSCB | HSCB | 4896 | 0.1 | 0.56 | YES |
| 29 | SLC25A6 | SLC25A6 | SLC25A6 | 5099 | 0.094 | 0.56 | YES |
| 30 | PMPCB | PMPCB | PMPCB | 5124 | 0.093 | 0.57 | YES |
| 31 | COQ2 | COQ2 | COQ2 | 5174 | 0.091 | 0.58 | YES |
| 32 | TIMM9 | TIMM9 | TIMM9 | 5226 | 0.09 | 0.6 | YES |
| 33 | COX17 | COX17 | COX17 | 5228 | 0.09 | 0.61 | YES |
| 34 | MTX1 | MTX1 | MTX1 | 5299 | 0.087 | 0.62 | YES |
| 35 | CS | CS | CS | 5585 | 0.078 | 0.61 | YES |
| 36 | GRPEL2 | GRPEL2 | GRPEL2 | 5682 | 0.076 | 0.62 | YES |
| 37 | GFER | GFER | GFER | 5778 | 0.073 | 0.62 | YES |
| 38 | TOMM22 | TOMM22 | TOMM22 | 5999 | 0.067 | 0.62 | NO |
| 39 | TIMM17B | TIMM17B | TIMM17B | 7004 | 0.04 | 0.57 | NO |
| 40 | SLC25A13 | SLC25A13 | SLC25A13 | 7333 | 0.031 | 0.56 | NO |
| 41 | ATP5A1 | ATP5A1 | ATP5A1 | 7466 | 0.028 | 0.56 | NO |
| 42 | PMPCA | PMPCA | PMPCA | 7727 | 0.022 | 0.55 | NO |
| 43 | TOMM5 | TOMM5 | TOMM5 | 8929 | -0.0087 | 0.48 | NO |
| 44 | ACO2 | ACO2 | ACO2 | 9266 | -0.017 | 0.47 | NO |
| 45 | TOMM70A | TOMM70A | TOMM70A | 9340 | -0.02 | 0.47 | NO |
| 46 | BCS1L | BCS1L | BCS1L | 9782 | -0.031 | 0.45 | NO |
| 47 | MTX2 | MTX2 | MTX2 | 9850 | -0.033 | 0.45 | NO |
| 48 | FXC1 | FXC1 | FXC1 | 10963 | -0.065 | 0.4 | NO |
| 49 | SLC25A12 | SLC25A12 | SLC25A12 | 13887 | -0.17 | 0.27 | NO |
Figure S53. Get High-res Image This plot shows mRNAseq_cNMF expression data heatmap (on the left) a RunningEnrichmentScore(RES) plot (on the top right) and a Signal2Noise(S2N) plot (on the bottom right) of genes in the pathway: BIOCARTA MPR PATHWAY.

Figure S54. Get High-res Image For the top 5 core enriched genes in the pathway: BIOCARTA MPR PATHWAY, this volcano plot shows how much they are up/down-regulated and significant. The significance was calculated by empirical bayesian fit

Table S28. Get Full Table This table shows a Running Enrichment Score (RES) of each gene in this pathway, that is, the enrichment score at this point in the ranked list of genes. All genes are ranked by Signal-to-Noise (S2N), a measure of similarity as default and are used to obtain ES matrix of all genes. In this way, GSEA tool uses expression pattern of not only overlapped genes but also not-overlapped genes to produce ES matrix.
| Rank | GENE | SYMBOL | DESC | LIST.LOC | S2N | RES | CORE_ENRICHMENT |
|---|---|---|---|---|---|---|---|
| 1 | FOSL1 | FOSL1 | FOSL1 | 71 | 1 | 0.066 | YES |
| 2 | BCAT1 | BCAT1 | BCAT1 | 140 | 0.9 | 0.12 | YES |
| 3 | TERT | TERT | TERT | 143 | 0.89 | 0.18 | YES |
| 4 | MYCT1 | MYCT1 | MYCT1 | 276 | 0.75 | 0.23 | YES |
| 5 | LIN28B | LIN28B | LIN28B | 520 | 0.58 | 0.25 | YES |
| 6 | SLC2A1 | SLC2A1 | SLC2A1 | 648 | 0.52 | 0.28 | YES |
| 7 | PMAIP1 | PMAIP1 | PMAIP1 | 1364 | 0.34 | 0.27 | YES |
| 8 | RCC1 | RCC1 | RCC1 | 1417 | 0.33 | 0.29 | YES |
| 9 | HMGA1 | HMGA1 | HMGA1 | 1432 | 0.33 | 0.31 | YES |
| 10 | MYC | MYC | MYC | 1727 | 0.29 | 0.31 | YES |
| 11 | ENO1 | ENO1 | ENO1 | 1742 | 0.28 | 0.33 | YES |
| 12 | LDHA | LDHA | LDHA | 1839 | 0.27 | 0.34 | YES |
| 13 | TK1 | TK1 | TK1 | 2107 | 0.24 | 0.35 | YES |
| 14 | NDUFAF2 | NDUFAF2 | NDUFAF2 | 2158 | 0.24 | 0.36 | YES |
| 15 | CCNB1 | CCNB1 | CCNB1 | 2324 | 0.22 | 0.37 | YES |
| 16 | DDX18 | DDX18 | DDX18 | 2415 | 0.22 | 0.38 | YES |
| 17 | CDC25A | CDC25A | CDC25A | 2423 | 0.22 | 0.39 | YES |
| 18 | NME1 | NME1 | NME1 | 2593 | 0.21 | 0.4 | YES |
| 19 | SHMT1 | SHMT1 | SHMT1 | 2760 | 0.2 | 0.4 | YES |
| 20 | ODC1 | ODC1 | ODC1 | 2838 | 0.19 | 0.41 | YES |
| 21 | GAPDH | GAPDH | GAPDH | 2904 | 0.19 | 0.42 | YES |
| 22 | BAX | BAX | BAX | 3020 | 0.18 | 0.42 | YES |
| 23 | NPM1 | NPM1 | NPM1 | 3042 | 0.18 | 0.43 | YES |
| 24 | HSPA4 | HSPA4 | HSPA4 | 3154 | 0.17 | 0.44 | YES |
| 25 | BIRC5 | BIRC5 | BIRC5 | 3208 | 0.17 | 0.45 | YES |
| 26 | EIF4E | EIF4E | EIF4E | 3279 | 0.17 | 0.46 | YES |
| 27 | PTMA | PTMA | PTMA | 3361 | 0.16 | 0.46 | YES |
| 28 | TAF12 | TAF12 | TAF12 | 3499 | 0.16 | 0.47 | YES |
| 29 | NME2 | NME2 | NME2 | 3858 | 0.14 | 0.46 | YES |
| 30 | EIF4A1 | EIF4A1 | EIF4A1 | 3864 | 0.14 | 0.47 | YES |
| 31 | PIM1 | PIM1 | PIM1 | 3979 | 0.14 | 0.47 | YES |
| 32 | TAF4B | TAF4B | TAF4B | 4033 | 0.13 | 0.48 | YES |
| 33 | PRDX3 | PRDX3 | PRDX3 | 4169 | 0.13 | 0.48 | YES |
| 34 | E2F3 | E2F3 | E2F3 | 4211 | 0.13 | 0.48 | YES |
| 35 | CAD | CAD | CAD | 4281 | 0.12 | 0.49 | YES |
| 36 | EIF4G1 | EIF4G1 | EIF4G1 | 4295 | 0.12 | 0.5 | YES |
| 37 | HSPD1 | HSPD1 | HSPD1 | 4506 | 0.12 | 0.49 | NO |
| 38 | RUVBL1 | RUVBL1 | RUVBL1 | 4939 | 0.099 | 0.48 | NO |
| 39 | SMAD4 | SMAD4 | SMAD4 | 5053 | 0.095 | 0.48 | NO |
| 40 | NCL | NCL | NCL | 5064 | 0.095 | 0.48 | NO |
| 41 | TP53 | TP53 | TP53 | 5517 | 0.081 | 0.46 | NO |
| 42 | TAF10 | TAF10 | TAF10 | 5671 | 0.076 | 0.46 | NO |
| 43 | RPL11 | RPL11 | RPL11 | 5726 | 0.074 | 0.46 | NO |
| 44 | TAF9 | TAF9 | TAF9 | 5767 | 0.073 | 0.47 | NO |
| 45 | KIR3DL1 | KIR3DL1 | KIR3DL1 | 5949 | 0.068 | 0.46 | NO |
| 46 | EIF2S1 | EIF2S1 | EIF2S1 | 6311 | 0.059 | 0.45 | NO |
| 47 | HSP90AA1 | HSP90AA1 | HSP90AA1 | 6353 | 0.058 | 0.45 | NO |
| 48 | RUVBL2 | RUVBL2 | RUVBL2 | 6490 | 0.054 | 0.44 | NO |
| 49 | SNAI1 | SNAI1 | SNAI1 | 6527 | 0.053 | 0.45 | NO |
| 50 | IREB2 | IREB2 | IREB2 | 6736 | 0.047 | 0.44 | NO |
| 51 | TFRC | TFRC | TFRC | 6756 | 0.047 | 0.44 | NO |
| 52 | UBTF | UBTF | UBTF | 6922 | 0.042 | 0.44 | NO |
| 53 | POLR3D | POLR3D | POLR3D | 7002 | 0.04 | 0.43 | NO |
| 54 | MTDH | MTDH | MTDH | 7046 | 0.039 | 0.43 | NO |
| 55 | CDK4 | CDK4 | CDK4 | 7149 | 0.036 | 0.43 | NO |
| 56 | TRRAP | TRRAP | TRRAP | 7635 | 0.024 | 0.41 | NO |
| 57 | KAT5 | KAT5 | KAT5 | 7926 | 0.017 | 0.39 | NO |
| 58 | SUPT7L | SUPT7L | SUPT7L | 7929 | 0.016 | 0.39 | NO |
| 59 | SUPT3H | SUPT3H | SUPT3H | 8136 | 0.011 | 0.38 | NO |
| 60 | PDCD10 | PDCD10 | PDCD10 | 8270 | 0.0078 | 0.38 | NO |
| 61 | HUWE1 | HUWE1 | HUWE1 | 8276 | 0.0078 | 0.38 | NO |
| 62 | ACTL6A | ACTL6A | ACTL6A | 8442 | 0.0037 | 0.37 | NO |
| 63 | EP300 | EP300 | EP300 | 8971 | -0.0096 | 0.34 | NO |
| 64 | KAT2A | KAT2A | KAT2A | 9146 | -0.014 | 0.33 | NO |
| 65 | MAX | MAX | MAX | 9408 | -0.022 | 0.32 | NO |
| 66 | MTA1 | MTA1 | MTA1 | 9785 | -0.032 | 0.3 | NO |
| 67 | MINA | MINA | MINA | 10003 | -0.037 | 0.3 | NO |
| 68 | NBN | NBN | NBN | 10086 | -0.039 | 0.29 | NO |
| 69 | CREBBP | CREBBP | CREBBP | 11277 | -0.074 | 0.24 | NO |
| 70 | GPAM | GPAM | GPAM | 12829 | -0.12 | 0.16 | NO |
| 71 | PEG10 | PEG10 | PEG10 | 13019 | -0.13 | 0.16 | NO |
| 72 | CDCA7 | CDCA7 | CDCA7 | 13643 | -0.16 | 0.14 | NO |
| 73 | CCND2 | CCND2 | CCND2 | 14152 | -0.18 | 0.12 | NO |
| 74 | MMP9 | MMP9 | MMP9 | 14615 | -0.2 | 0.11 | NO |
| 75 | PFKM | PFKM | PFKM | 15185 | -0.23 | 0.099 | NO |
| 76 | SMAD3 | SMAD3 | SMAD3 | 15214 | -0.23 | 0.11 | NO |
| 77 | ID2 | ID2 | ID2 | 16278 | -0.29 | 0.077 | NO |
| 78 | BMI1 | BMI1 | BMI1 | 17764 | -0.44 | 0.028 | NO |
| 79 | SERPINI1 | SERPINI1 | SERPINI1 | 18417 | -0.58 | 0.033 | NO |
Figure S55. Get High-res Image This plot shows mRNAseq_cNMF expression data heatmap (on the left) a RunningEnrichmentScore(RES) plot (on the top right) and a Signal2Noise(S2N) plot (on the bottom right) of genes in the pathway: PID HIF2PATHWAY.

Figure S56. Get High-res Image For the top 5 core enriched genes in the pathway: PID HIF2PATHWAY, this volcano plot shows how much they are up/down-regulated and significant. The significance was calculated by empirical bayesian fit

Table S29. Get Full Table This table shows a Running Enrichment Score (RES) of each gene in this pathway, that is, the enrichment score at this point in the ranked list of genes. All genes are ranked by Signal-to-Noise (S2N), a measure of similarity as default and are used to obtain ES matrix of all genes. In this way, GSEA tool uses expression pattern of not only overlapped genes but also not-overlapped genes to produce ES matrix.
| Rank | GENE | SYMBOL | DESC | LIST.LOC | S2N | RES | CORE_ENRICHMENT |
|---|---|---|---|---|---|---|---|
| 1 | UCP1 | UCP1 | UCP1 | 1091 | 0.39 | -0.034 | YES |
| 2 | UQCRHL | UQCRHL | UQCRHL | 1095 | 0.39 | -0.01 | YES |
| 3 | PDHA1 | PDHA1 | PDHA1 | 1260 | 0.36 | 0.0023 | YES |
| 4 | SLC16A3 | SLC16A3 | SLC16A3 | 1373 | 0.34 | 0.017 | YES |
| 5 | PDK3 | PDK3 | PDK3 | 1484 | 0.32 | 0.03 | YES |
| 6 | DLAT | DLAT | DLAT | 1486 | 0.32 | 0.049 | YES |
| 7 | L2HGDH | L2HGDH | L2HGDH | 1556 | 0.31 | 0.064 | YES |
| 8 | UQCRH | UQCRH | UQCRH | 1598 | 0.3 | 0.08 | YES |
| 9 | NDUFS5 | NDUFS5 | NDUFS5 | 1670 | 0.29 | 0.094 | YES |
| 10 | COX7B | COX7B | COX7B | 1785 | 0.28 | 0.1 | YES |
| 11 | LDHA | LDHA | LDHA | 1839 | 0.27 | 0.12 | YES |
| 12 | SLC16A1 | SLC16A1 | SLC16A1 | 1878 | 0.27 | 0.13 | YES |
| 13 | ATP5H | ATP5H | ATP5H | 2159 | 0.24 | 0.13 | YES |
| 14 | ATP5G1 | ATP5G1 | ATP5G1 | 2164 | 0.24 | 0.15 | YES |
| 15 | MDH2 | MDH2 | MDH2 | 2193 | 0.24 | 0.16 | YES |
| 16 | NDUFS6 | NDUFS6 | NDUFS6 | 2349 | 0.22 | 0.16 | YES |
| 17 | NDUFC2 | NDUFC2 | NDUFC2 | 2457 | 0.22 | 0.17 | YES |
| 18 | PDHX | PDHX | PDHX | 2479 | 0.21 | 0.18 | YES |
| 19 | NDUFA9 | NDUFA9 | NDUFA9 | 2579 | 0.21 | 0.19 | YES |
| 20 | IDH1 | IDH1 | IDH1 | 2675 | 0.2 | 0.2 | YES |
| 21 | SUCLA2 | SUCLA2 | SUCLA2 | 2676 | 0.2 | 0.21 | YES |
| 22 | COX5A | COX5A | COX5A | 2787 | 0.19 | 0.22 | YES |
| 23 | NDUFA4 | NDUFA4 | NDUFA4 | 2807 | 0.19 | 0.22 | YES |
| 24 | NDUFA8 | NDUFA8 | NDUFA8 | 2855 | 0.19 | 0.23 | YES |
| 25 | PDHB | PDHB | PDHB | 2886 | 0.19 | 0.24 | YES |
| 26 | NDUFAB1 | NDUFAB1 | NDUFAB1 | 2945 | 0.18 | 0.25 | YES |
| 27 | IDH3G | IDH3G | IDH3G | 3038 | 0.18 | 0.26 | YES |
| 28 | NDUFA13 | NDUFA13 | NDUFA13 | 3041 | 0.18 | 0.27 | YES |
| 29 | LDHB | LDHB | LDHB | 3128 | 0.17 | 0.27 | YES |
| 30 | CYC1 | CYC1 | CYC1 | 3266 | 0.17 | 0.28 | YES |
| 31 | NDUFB10 | NDUFB10 | NDUFB10 | 3285 | 0.17 | 0.29 | YES |
| 32 | ATP5B | ATP5B | ATP5B | 3337 | 0.16 | 0.29 | YES |
| 33 | IDH3B | IDH3B | IDH3B | 3353 | 0.16 | 0.3 | YES |
| 34 | ATP5J2 | ATP5J2 | ATP5J2 | 3374 | 0.16 | 0.31 | YES |
| 35 | NDUFA6 | NDUFA6 | NDUFA6 | 3419 | 0.16 | 0.32 | YES |
| 36 | IDH3A | IDH3A | IDH3A | 3553 | 0.16 | 0.32 | YES |
| 37 | ATP5I | ATP5I | ATP5I | 3562 | 0.15 | 0.33 | YES |
| 38 | SUCLG1 | SUCLG1 | SUCLG1 | 3583 | 0.15 | 0.34 | YES |
| 39 | SDHD | SDHD | SDHD | 3639 | 0.15 | 0.34 | YES |
| 40 | COX5B | COX5B | COX5B | 3666 | 0.15 | 0.35 | YES |
| 41 | NDUFB9 | NDUFB9 | NDUFB9 | 3833 | 0.14 | 0.35 | YES |
| 42 | DLD | DLD | DLD | 3871 | 0.14 | 0.36 | YES |
| 43 | ATP5C1 | ATP5C1 | ATP5C1 | 3881 | 0.14 | 0.36 | YES |
| 44 | SDHB | SDHB | SDHB | 3911 | 0.14 | 0.37 | YES |
| 45 | ATP5F1 | ATP5F1 | ATP5F1 | 3939 | 0.14 | 0.38 | YES |
| 46 | COX7C | COX7C | COX7C | 3978 | 0.14 | 0.38 | YES |
| 47 | COX8A | COX8A | COX8A | 4046 | 0.13 | 0.39 | YES |
| 48 | ATP5J | ATP5J | ATP5J | 4083 | 0.13 | 0.4 | YES |
| 49 | NDUFA3 | NDUFA3 | NDUFA3 | 4114 | 0.13 | 0.4 | YES |
| 50 | NDUFA1 | NDUFA1 | NDUFA1 | 4121 | 0.13 | 0.41 | YES |
| 51 | NDUFS8 | NDUFS8 | NDUFS8 | 4199 | 0.13 | 0.41 | YES |
| 52 | COX6A1 | COX6A1 | COX6A1 | 4240 | 0.13 | 0.42 | YES |
| 53 | CYCS | CYCS | CYCS | 4247 | 0.13 | 0.42 | YES |
| 54 | ATP5O | ATP5O | ATP5O | 4257 | 0.13 | 0.43 | YES |
| 55 | NDUFS7 | NDUFS7 | NDUFS7 | 4272 | 0.12 | 0.44 | YES |
| 56 | COX4I1 | COX4I1 | COX4I1 | 4399 | 0.12 | 0.44 | YES |
| 57 | PDP2 | PDP2 | PDP2 | 4403 | 0.12 | 0.45 | YES |
| 58 | FH | FH | FH | 4518 | 0.12 | 0.45 | YES |
| 59 | UQCRFS1 | UQCRFS1 | UQCRFS1 | 4599 | 0.11 | 0.45 | YES |
| 60 | NDUFB8 | NDUFB8 | NDUFB8 | 4729 | 0.11 | 0.45 | YES |
| 61 | UQCRC2 | UQCRC2 | UQCRC2 | 4778 | 0.11 | 0.45 | YES |
| 62 | ATP5L | ATP5L | ATP5L | 4780 | 0.1 | 0.46 | YES |
| 63 | NDUFA12 | NDUFA12 | NDUFA12 | 4859 | 0.1 | 0.46 | YES |
| 64 | ATP5D | ATP5D | ATP5D | 4903 | 0.1 | 0.46 | YES |
| 65 | NDUFS4 | NDUFS4 | NDUFS4 | 5009 | 0.097 | 0.47 | YES |
| 66 | NDUFV2 | NDUFV2 | NDUFV2 | 5074 | 0.095 | 0.47 | YES |
| 67 | COX6C | COX6C | COX6C | 5133 | 0.093 | 0.47 | YES |
| 68 | NDUFS2 | NDUFS2 | NDUFS2 | 5213 | 0.09 | 0.47 | YES |
| 69 | NDUFV1 | NDUFV1 | NDUFV1 | 5287 | 0.088 | 0.47 | YES |
| 70 | NDUFB2 | NDUFB2 | NDUFB2 | 5359 | 0.086 | 0.47 | YES |
| 71 | UQCR11 | UQCR11 | UQCR11 | 5406 | 0.084 | 0.48 | YES |
| 72 | CS | CS | CS | 5585 | 0.078 | 0.47 | YES |
| 73 | COX6B1 | COX6B1 | COX6B1 | 5602 | 0.078 | 0.48 | YES |
| 74 | NDUFB6 | NDUFB6 | NDUFB6 | 5611 | 0.078 | 0.48 | YES |
| 75 | NDUFS1 | NDUFS1 | NDUFS1 | 5721 | 0.075 | 0.48 | YES |
| 76 | UQCRQ | UQCRQ | UQCRQ | 5779 | 0.073 | 0.48 | YES |
| 77 | NDUFA11 | NDUFA11 | NDUFA11 | 5937 | 0.069 | 0.48 | YES |
| 78 | UQCRB | UQCRB | UQCRB | 6047 | 0.066 | 0.48 | YES |
| 79 | DLST | DLST | DLST | 6068 | 0.065 | 0.48 | YES |
| 80 | NDUFB1 | NDUFB1 | NDUFB1 | 6156 | 0.063 | 0.48 | YES |
| 81 | SDHC | SDHC | SDHC | 6167 | 0.062 | 0.48 | YES |
| 82 | NDUFA7 | NDUFA7 | NDUFA7 | 6206 | 0.061 | 0.48 | YES |
| 83 | NDUFV3 | NDUFV3 | NDUFV3 | 6394 | 0.056 | 0.48 | NO |
| 84 | NDUFA2 | NDUFA2 | NDUFA2 | 6404 | 0.056 | 0.48 | NO |
| 85 | BSG | BSG | BSG | 6517 | 0.053 | 0.48 | NO |
| 86 | NDUFB7 | NDUFB7 | NDUFB7 | 6616 | 0.05 | 0.47 | NO |
| 87 | NDUFB3 | NDUFB3 | NDUFB3 | 6704 | 0.048 | 0.47 | NO |
| 88 | NDUFA5 | NDUFA5 | NDUFA5 | 6831 | 0.044 | 0.47 | NO |
| 89 | UQCRC1 | UQCRC1 | UQCRC1 | 6905 | 0.042 | 0.47 | NO |
| 90 | ETFA | ETFA | ETFA | 6992 | 0.04 | 0.46 | NO |
| 91 | PDK1 | PDK1 | PDK1 | 6995 | 0.04 | 0.47 | NO |
| 92 | NDUFA10 | NDUFA10 | NDUFA10 | 7131 | 0.037 | 0.46 | NO |
| 93 | ATP5A1 | ATP5A1 | ATP5A1 | 7466 | 0.028 | 0.44 | NO |
| 94 | NDUFB5 | NDUFB5 | NDUFB5 | 7533 | 0.026 | 0.44 | NO |
| 95 | ETFB | ETFB | ETFB | 7630 | 0.024 | 0.44 | NO |
| 96 | NDUFB4 | NDUFB4 | NDUFB4 | 7875 | 0.018 | 0.43 | NO |
| 97 | NDUFS3 | NDUFS3 | NDUFS3 | 7911 | 0.017 | 0.43 | NO |
| 98 | NDUFC1 | NDUFC1 | NDUFC1 | 8244 | 0.0086 | 0.41 | NO |
| 99 | SDHA | SDHA | SDHA | 9048 | -0.012 | 0.37 | NO |
| 100 | ACO2 | ACO2 | ACO2 | 9266 | -0.017 | 0.36 | NO |
| 101 | SLC16A8 | SLC16A8 | SLC16A8 | 9353 | -0.02 | 0.35 | NO |
| 102 | ATP5E | ATP5E | ATP5E | 9500 | -0.024 | 0.35 | NO |
| 103 | NNT | NNT | NNT | 10096 | -0.04 | 0.32 | NO |
| 104 | COX7A2L | COX7A2L | COX7A2L | 10144 | -0.041 | 0.32 | NO |
| 105 | OGDH | OGDH | OGDH | 11196 | -0.072 | 0.27 | NO |
| 106 | ETFDH | ETFDH | ETFDH | 11464 | -0.081 | 0.26 | NO |
| 107 | IDH2 | IDH2 | IDH2 | 11525 | -0.083 | 0.26 | NO |
| 108 | PDPR | PDPR | PDPR | 11790 | -0.091 | 0.25 | NO |
| 109 | UCP2 | UCP2 | UCP2 | 12437 | -0.11 | 0.22 | NO |
| 110 | PDP1 | PDP1 | PDP1 | 13160 | -0.14 | 0.2 | NO |
| 111 | D2HGDH | D2HGDH | D2HGDH | 13769 | -0.16 | 0.17 | NO |
| 112 | PDK2 | PDK2 | PDK2 | 14936 | -0.22 | 0.12 | NO |
| 113 | SUCLG2 | SUCLG2 | SUCLG2 | 15607 | -0.25 | 0.1 | NO |
| 114 | PDK4 | PDK4 | PDK4 | 16857 | -0.34 | 0.058 | NO |
| 115 | UCP3 | UCP3 | UCP3 | 17705 | -0.44 | 0.039 | NO |
| 116 | ADHFE1 | ADHFE1 | ADHFE1 | 18236 | -0.53 | 0.043 | NO |
Figure S57. Get High-res Image This plot shows mRNAseq_cNMF expression data heatmap (on the left) a RunningEnrichmentScore(RES) plot (on the top right) and a Signal2Noise(S2N) plot (on the bottom right) of genes in the pathway: PID MYC ACTIVPATHWAY.
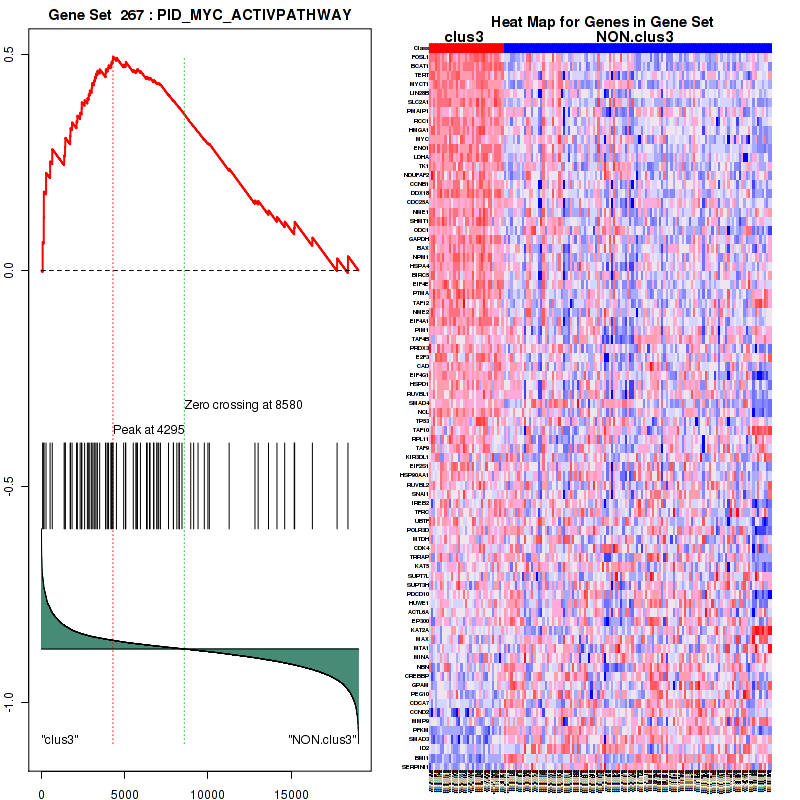
Figure S58. Get High-res Image For the top 5 core enriched genes in the pathway: PID MYC ACTIVPATHWAY, this volcano plot shows how much they are up/down-regulated and significant. The significance was calculated by empirical bayesian fit
Table S30. Get Full Table This table shows a Running Enrichment Score (RES) of each gene in this pathway, that is, the enrichment score at this point in the ranked list of genes. All genes are ranked by Signal-to-Noise (S2N), a measure of similarity as default and are used to obtain ES matrix of all genes. In this way, GSEA tool uses expression pattern of not only overlapped genes but also not-overlapped genes to produce ES matrix.
| Rank | GENE | SYMBOL | DESC | LIST.LOC | S2N | RES | CORE_ENRICHMENT |
|---|---|---|---|---|---|---|---|
| 1 | GTF2H2 | GTF2H2 | GTF2H2 | 1068 | 0.4 | 0.08 | YES |
| 2 | GTF2H2B | GTF2H2B | GTF2H2B | 1178 | 0.37 | 0.2 | YES |
| 3 | CDK7 | CDK7 | CDK7 | 2480 | 0.21 | 0.21 | YES |
| 4 | POLR2H | POLR2H | POLR2H | 2721 | 0.2 | 0.26 | YES |
| 5 | MNAT1 | MNAT1 | MNAT1 | 2775 | 0.19 | 0.32 | YES |
| 6 | POLR2G | POLR2G | POLR2G | 2841 | 0.19 | 0.39 | YES |
| 7 | GTF2H3 | GTF2H3 | GTF2H3 | 3160 | 0.17 | 0.43 | YES |
| 8 | NCBP2 | NCBP2 | NCBP2 | 4564 | 0.11 | 0.39 | YES |
| 9 | POLR2A | POLR2A | POLR2A | 4945 | 0.099 | 0.41 | YES |
| 10 | POLR2E | POLR2E | POLR2E | 5070 | 0.095 | 0.43 | YES |
| 11 | POLR2F | POLR2F | POLR2F | 5349 | 0.086 | 0.45 | YES |
| 12 | GTF2F2 | GTF2F2 | GTF2F2 | 5570 | 0.079 | 0.46 | YES |
| 13 | RNMT | RNMT | RNMT | 5757 | 0.074 | 0.48 | YES |
| 14 | CCNH | CCNH | CCNH | 5816 | 0.072 | 0.5 | YES |
| 15 | POLR2C | POLR2C | POLR2C | 5834 | 0.072 | 0.52 | YES |
| 16 | RNGTT | RNGTT | RNGTT | 5837 | 0.072 | 0.55 | YES |
| 17 | NCBP1 | NCBP1 | NCBP1 | 6118 | 0.064 | 0.55 | YES |
| 18 | GTF2F1 | GTF2F1 | GTF2F1 | 6330 | 0.058 | 0.56 | YES |
| 19 | POLR2J | POLR2J | POLR2J | 6803 | 0.045 | 0.55 | YES |
| 20 | GTF2H1 | GTF2H1 | GTF2H1 | 6876 | 0.043 | 0.56 | YES |
| 21 | POLR2L | POLR2L | POLR2L | 6976 | 0.04 | 0.57 | YES |
| 22 | POLR2I | POLR2I | POLR2I | 7113 | 0.037 | 0.58 | YES |
| 23 | GTF2H4 | GTF2H4 | GTF2H4 | 7399 | 0.03 | 0.57 | NO |
| 24 | ERCC2 | ERCC2 | ERCC2 | 7607 | 0.024 | 0.57 | NO |
| 25 | POLR2B | POLR2B | POLR2B | 8266 | 0.008 | 0.54 | NO |
| 26 | POLR2K | POLR2K | POLR2K | 8316 | 0.0069 | 0.54 | NO |
| 27 | POLR2D | POLR2D | POLR2D | 8363 | 0.0056 | 0.54 | NO |
| 28 | ERCC3 | ERCC3 | ERCC3 | 8413 | 0.0044 | 0.54 | NO |
| 29 | SUPT5H | SUPT5H | SUPT5H | 11003 | -0.066 | 0.42 | NO |
Figure S59. Get High-res Image This plot shows mRNAseq_cNMF expression data heatmap (on the left) a RunningEnrichmentScore(RES) plot (on the top right) and a Signal2Noise(S2N) plot (on the bottom right) of genes in the pathway: REACTOME TRANSLATION.
Figure S60. Get High-res Image For the top 5 core enriched genes in the pathway: REACTOME TRANSLATION, this volcano plot shows how much they are up/down-regulated and significant. The significance was calculated by empirical bayesian fit

For the top enriched genes, if you want to check whether they are
-
up-regulated, please check the list of up-regulated genes
-
down-regulated, please check the list of down-regulated genes
For the top enriched genes, if you want to check whether they are
-
highly expressed genes, please check the list of high (top 30%) expressed genes
-
low expressed genes, please check the list of low (bottom 30%) expressed genes
An expression pattern of top(30%)/middle(30%)/low(30%) in this subtype against other subtypes is available in a heatmap
For the top enriched genes, if you want to check whether they are
-
significantly differently expressed genes by eBayes lm fit, please check the list of significant genes
Table 6. Get Full Table This table shows top 10 pathways which are significantly enriched in cluster clus4. It displays only significant gene sets satisfying nom.p.val.threshold (-1), fwer.p.val.threshold (-1) , fdr.q.val.threshold (0.25) and the default table is sorted by Normalized Enrichment Score (NES). Further details on NES statistics, please visit The Broad GSEA website.
| GeneSet(GS) | Size(#genes) | genes.ES.table | ES | NES | NOM.p.val | FDR.q.val | FWER.p.val | Tag.. | Gene.. | Signal | FDR..median. | glob.p.val |
|---|---|---|---|---|---|---|---|---|---|---|---|---|
| KEGG LONG TERM POTENTIATION | 70 | genes.ES.table | 0.49 | 1.6 | 0.012 | 0.68 | 0.86 | 0.33 | 0.21 | 0.26 | 0.26 | 0.19 |
| KEGG NEUROTROPHIN SIGNALING PATHWAY | 126 | genes.ES.table | 0.41 | 1.7 | 0.0078 | 1 | 0.8 | 0.24 | 0.22 | 0.19 | 0.41 | 0.28 |
| BIOCARTA AGR PATHWAY | 36 | genes.ES.table | 0.57 | 1.6 | 0.014 | 0.94 | 0.82 | 0.33 | 0.19 | 0.27 | 0.35 | 0.24 |
| BIOCARTA AT1R PATHWAY | 32 | genes.ES.table | 0.53 | 1.7 | 0.0097 | 1 | 0.59 | 0.19 | 0.15 | 0.16 | 1 | 0.54 |
| SIG REGULATION OF THE ACTIN CYTOSKELETON BY RHO GTPASES | 35 | genes.ES.table | 0.56 | 1.6 | 0.014 | 1 | 0.82 | 0.34 | 0.22 | 0.27 | 0.38 | 0.26 |
| PID ENDOTHELINPATHWAY | 63 | genes.ES.table | 0.58 | 1.6 | 0.002 | 0.75 | 0.86 | 0.35 | 0.18 | 0.29 | 0.29 | 0.2 |
| PID NOTCH PATHWAY | 59 | genes.ES.table | 0.51 | 1.7 | 0.004 | 1 | 0.76 | 0.34 | 0.2 | 0.27 | 0.36 | 0.26 |
| PID EPHBFWDPATHWAY | 40 | genes.ES.table | 0.54 | 1.6 | 0.006 | 0.81 | 0.82 | 0.28 | 0.17 | 0.23 | 0.3 | 0.21 |
| PID PS1PATHWAY | 46 | genes.ES.table | 0.55 | 1.7 | 0.004 | 1 | 0.72 | 0.26 | 0.18 | 0.22 | 0.41 | 0.27 |
| PID P75NTRPATHWAY | 69 | genes.ES.table | 0.46 | 1.6 | 0.0081 | 0.79 | 0.84 | 0.29 | 0.26 | 0.22 | 0.3 | 0.21 |
Table S31. Get Full Table This table shows a Running Enrichment Score (RES) of each gene in this pathway, that is, the enrichment score at this point in the ranked list of genes. All genes are ranked by Signal-to-Noise (S2N), a measure of similarity as default and are used to obtain ES matrix of all genes. In this way, GSEA tool uses expression pattern of not only overlapped genes but also not-overlapped genes to produce ES matrix.
| Rank | GENE | SYMBOL | DESC | LIST.LOC | S2N | RES | CORE_ENRICHMENT |
|---|---|---|---|---|---|---|---|
| 1 | AGT | AGT | AGT | 544 | 0.9 | 0.13 | YES |
| 2 | EGFR | EGFR | EGFR | 997 | 0.76 | 0.23 | YES |
| 3 | AGTR1 | AGTR1 | AGTR1 | 1040 | 0.75 | 0.36 | YES |
| 4 | JUN | JUN | JUN | 1877 | 0.59 | 0.42 | YES |
| 5 | MEF2C | MEF2C | MEF2C | 2562 | 0.48 | 0.46 | YES |
| 6 | PRKCA | PRKCA | PRKCA | 2777 | 0.46 | 0.53 | YES |
| 7 | SRC | SRC | SRC | 5789 | 0.18 | 0.4 | NO |
| 8 | MEF2A | MEF2A | MEF2A | 6049 | 0.16 | 0.42 | NO |
| 9 | SHC1 | SHC1 | SHC1 | 6206 | 0.16 | 0.44 | NO |
| 10 | MAPK8 | MAPK8 | MAPK8 | 6435 | 0.14 | 0.45 | NO |
| 11 | ATF2 | ATF2 | ATF2 | 6875 | 0.12 | 0.45 | NO |
| 12 | SOS1 | SOS1 | SOS1 | 7134 | 0.11 | 0.45 | NO |
| 13 | MAPK3 | MAPK3 | MAPK3 | 7678 | 0.087 | 0.44 | NO |
| 14 | MAP2K4 | MAP2K4 | MAP2K4 | 8106 | 0.071 | 0.43 | NO |
| 15 | MEF2D | MEF2D | MEF2D | 8540 | 0.056 | 0.41 | NO |
| 16 | CALM3 | CALM3 | CALM3 | 8952 | 0.041 | 0.4 | NO |
| 17 | CALM1 | CALM1 | CALM1 | 9661 | 0.018 | 0.36 | NO |
| 18 | GNAQ | GNAQ | GNAQ | 9799 | 0.013 | 0.36 | NO |
| 19 | ELK1 | ELK1 | ELK1 | 10046 | 0.0048 | 0.35 | NO |
| 20 | PTK2 | PTK2 | PTK2 | 10121 | 0.0023 | 0.34 | NO |
| 21 | RAC1 | RAC1 | RAC1 | 10632 | -0.013 | 0.32 | NO |
| 22 | PTK2B | PTK2B | PTK2B | 10784 | -0.017 | 0.32 | NO |
| 23 | HRAS | HRAS | HRAS | 11044 | -0.025 | 0.31 | NO |
| 24 | MAP3K1 | MAP3K1 | MAP3K1 | 11421 | -0.036 | 0.29 | NO |
| 25 | PAK1 | PAK1 | PAK1 | 11432 | -0.036 | 0.3 | NO |
| 26 | RAF1 | RAF1 | RAF1 | 11649 | -0.043 | 0.29 | NO |
| 27 | MAP2K1 | MAP2K1 | MAP2K1 | 11675 | -0.044 | 0.3 | NO |
| 28 | GRB2 | GRB2 | GRB2 | 11951 | -0.051 | 0.29 | NO |
| 29 | CALM2 | CALM2 | CALM2 | 12235 | -0.059 | 0.29 | NO |
| 30 | MAP2K2 | MAP2K2 | MAP2K2 | 12254 | -0.06 | 0.3 | NO |
| 31 | MAPK1 | MAPK1 | MAPK1 | 13847 | -0.11 | 0.23 | NO |
| 32 | PRKCB | PRKCB | PRKCB | 16299 | -0.23 | 0.14 | NO |
Figure S61. Get High-res Image This plot shows mRNAseq_cNMF expression data heatmap (on the left) a RunningEnrichmentScore(RES) plot (on the top right) and a Signal2Noise(S2N) plot (on the bottom right) of genes in the pathway: KEGG LONG TERM POTENTIATION.
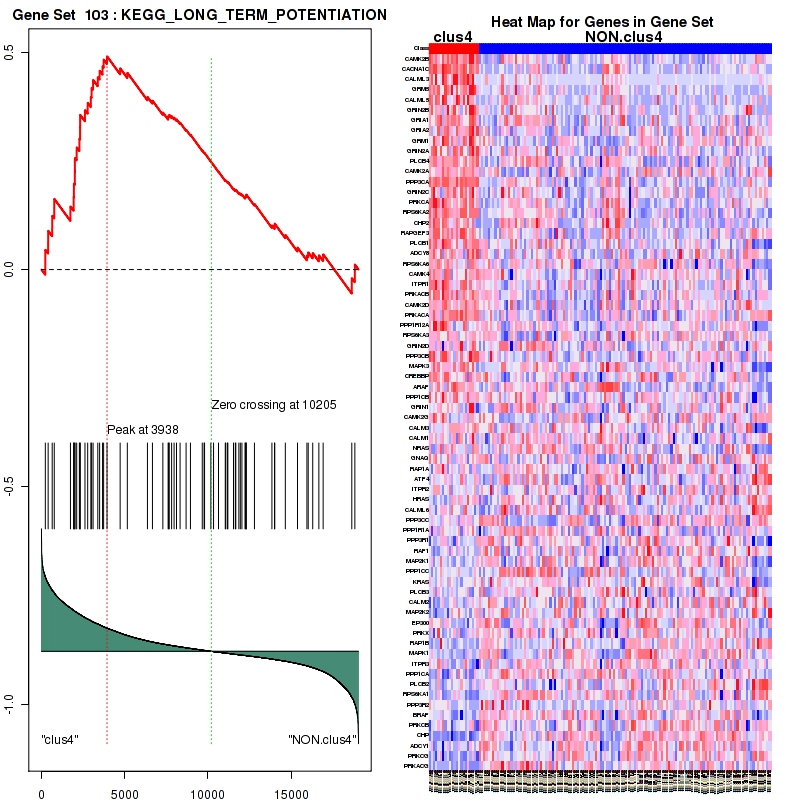
Figure S62. Get High-res Image For the top 5 core enriched genes in the pathway: KEGG LONG TERM POTENTIATION, this volcano plot shows how much they are up/down-regulated and significant. The significance was calculated by empirical bayesian fit

Table S32. Get Full Table This table shows a Running Enrichment Score (RES) of each gene in this pathway, that is, the enrichment score at this point in the ranked list of genes. All genes are ranked by Signal-to-Noise (S2N), a measure of similarity as default and are used to obtain ES matrix of all genes. In this way, GSEA tool uses expression pattern of not only overlapped genes but also not-overlapped genes to produce ES matrix.
| Rank | GENE | SYMBOL | DESC | LIST.LOC | S2N | RES | CORE_ENRICHMENT |
|---|---|---|---|---|---|---|---|
| 1 | MAMLD1 | MAMLD1 | MAMLD1 | 986 | 0.76 | 0.036 | YES |
| 2 | MAML2 | MAML2 | MAML2 | 1170 | 0.72 | 0.11 | YES |
| 3 | MAML3 | MAML3 | MAML3 | 1220 | 0.71 | 0.19 | YES |
| 4 | CCND1 | CCND1 | CCND1 | 1321 | 0.69 | 0.26 | YES |
| 5 | NOTCH4 | NOTCH4 | NOTCH4 | 1868 | 0.59 | 0.3 | YES |
| 6 | JUN | JUN | JUN | 1877 | 0.59 | 0.37 | YES |
| 7 | NOTCH3 | NOTCH3 | NOTCH3 | 2753 | 0.46 | 0.38 | YES |
| 8 | ST3GAL6 | ST3GAL6 | ST3GAL6 | 3125 | 0.41 | 0.41 | YES |
| 9 | NOTCH2 | NOTCH2 | NOTCH2 | 3367 | 0.39 | 0.44 | YES |
| 10 | EIF2C4 | EIF2C4 | EIF2C4 | 3406 | 0.38 | 0.48 | YES |
| 11 | ST3GAL3 | ST3GAL3 | ST3GAL3 | 3472 | 0.38 | 0.52 | YES |
| 12 | KAT2B | KAT2B | KAT2B | 5989 | 0.17 | 0.41 | NO |
| 13 | SEL1L | SEL1L | SEL1L | 6429 | 0.14 | 0.4 | NO |
| 14 | EIF2C3 | EIF2C3 | EIF2C3 | 6539 | 0.14 | 0.41 | NO |
| 15 | CREBBP | CREBBP | CREBBP | 7820 | 0.082 | 0.36 | NO |
| 16 | POFUT1 | POFUT1 | POFUT1 | 7895 | 0.079 | 0.36 | NO |
| 17 | RFNG | RFNG | RFNG | 8072 | 0.073 | 0.36 | NO |
| 18 | B4GALT1 | B4GALT1 | B4GALT1 | 8458 | 0.058 | 0.35 | NO |
| 19 | TP53 | TP53 | TP53 | 8496 | 0.057 | 0.35 | NO |
| 20 | TFDP1 | TFDP1 | TFDP1 | 8942 | 0.041 | 0.33 | NO |
| 21 | MAML1 | MAML1 | MAML1 | 9007 | 0.039 | 0.33 | NO |
| 22 | TMED2 | TMED2 | TMED2 | 9576 | 0.02 | 0.31 | NO |
| 23 | TNRC6A | TNRC6A | TNRC6A | 9630 | 0.018 | 0.31 | NO |
| 24 | EIF2C1 | EIF2C1 | EIF2C1 | 9956 | 0.0082 | 0.29 | NO |
| 25 | EIF2C2 | EIF2C2 | EIF2C2 | 10767 | -0.016 | 0.25 | NO |
| 26 | TNRC6B | TNRC6B | TNRC6B | 11099 | -0.026 | 0.23 | NO |
| 27 | ATP2A2 | ATP2A2 | ATP2A2 | 11136 | -0.027 | 0.24 | NO |
| 28 | MFNG | MFNG | MFNG | 11741 | -0.045 | 0.21 | NO |
| 29 | FURIN | FURIN | FURIN | 11802 | -0.047 | 0.21 | NO |
| 30 | LFNG | LFNG | LFNG | 12077 | -0.055 | 0.2 | NO |
| 31 | EP300 | EP300 | EP300 | 12302 | -0.061 | 0.2 | NO |
| 32 | RAB6A | RAB6A | RAB6A | 12923 | -0.079 | 0.18 | NO |
| 33 | MOV10 | MOV10 | MOV10 | 13003 | -0.082 | 0.18 | NO |
| 34 | ATP2A1 | ATP2A1 | ATP2A1 | 13172 | -0.088 | 0.18 | NO |
| 35 | KAT2A | KAT2A | KAT2A | 13749 | -0.11 | 0.16 | NO |
| 36 | TNRC6C | TNRC6C | TNRC6C | 13929 | -0.11 | 0.17 | NO |
| 37 | SNW1 | SNW1 | SNW1 | 14104 | -0.12 | 0.17 | NO |
| 38 | E2F3 | E2F3 | E2F3 | 14253 | -0.12 | 0.18 | NO |
| 39 | E2F1 | E2F1 | E2F1 | 14934 | -0.15 | 0.16 | NO |
| 40 | RBPJ | RBPJ | RBPJ | 15050 | -0.16 | 0.17 | NO |
| 41 | ATP2A3 | ATP2A3 | ATP2A3 | 17217 | -0.32 | 0.096 | NO |
Figure S63. Get High-res Image This plot shows mRNAseq_cNMF expression data heatmap (on the left) a RunningEnrichmentScore(RES) plot (on the top right) and a Signal2Noise(S2N) plot (on the bottom right) of genes in the pathway: KEGG NEUROTROPHIN SIGNALING PATHWAY.

Figure S64. Get High-res Image For the top 5 core enriched genes in the pathway: KEGG NEUROTROPHIN SIGNALING PATHWAY, this volcano plot shows how much they are up/down-regulated and significant. The significance was calculated by empirical bayesian fit

Table S33. Get Full Table This table shows a Running Enrichment Score (RES) of each gene in this pathway, that is, the enrichment score at this point in the ranked list of genes. All genes are ranked by Signal-to-Noise (S2N), a measure of similarity as default and are used to obtain ES matrix of all genes. In this way, GSEA tool uses expression pattern of not only overlapped genes but also not-overlapped genes to produce ES matrix.
| Rank | GENE | SYMBOL | DESC | LIST.LOC | S2N | RES | CORE_ENRICHMENT |
|---|---|---|---|---|---|---|---|
| 1 | SLIT2 | SLIT2 | SLIT2 | 127 | 1.1 | 0.14 | YES |
| 2 | SRGAP3 | SRGAP3 | SRGAP3 | 308 | 1 | 0.27 | YES |
| 3 | CAP2 | CAP2 | CAP2 | 1297 | 0.69 | 0.31 | YES |
| 4 | ROBO2 | ROBO2 | ROBO2 | 1379 | 0.68 | 0.39 | YES |
| 5 | ROBO3 | ROBO3 | ROBO3 | 2140 | 0.54 | 0.42 | YES |
| 6 | ROBO1 | ROBO1 | ROBO1 | 2231 | 0.53 | 0.49 | YES |
| 7 | PAK7 | PAK7 | PAK7 | 3033 | 0.42 | 0.5 | YES |
| 8 | SOS2 | SOS2 | SOS2 | 3715 | 0.35 | 0.52 | YES |
| 9 | GPC1 | GPC1 | GPC1 | 3841 | 0.34 | 0.55 | YES |
| 10 | PFN2 | PFN2 | PFN2 | 4218 | 0.3 | 0.57 | YES |
| 11 | PAK6 | PAK6 | PAK6 | 6274 | 0.15 | 0.49 | NO |
| 12 | ABL1 | ABL1 | ABL1 | 6622 | 0.13 | 0.48 | NO |
| 13 | EVL | EVL | EVL | 6693 | 0.13 | 0.5 | NO |
| 14 | SOS1 | SOS1 | SOS1 | 7134 | 0.11 | 0.49 | NO |
| 15 | ENAH | ENAH | ENAH | 7530 | 0.094 | 0.48 | NO |
| 16 | SRGAP2 | SRGAP2 | SRGAP2 | 7802 | 0.083 | 0.48 | NO |
| 17 | CLASP1 | CLASP1 | CLASP1 | 7996 | 0.076 | 0.48 | NO |
| 18 | NCK2 | NCK2 | NCK2 | 9921 | 0.0094 | 0.38 | NO |
| 19 | NCK1 | NCK1 | NCK1 | 9970 | 0.0077 | 0.38 | NO |
| 20 | PAK2 | PAK2 | PAK2 | 10040 | 0.005 | 0.37 | NO |
| 21 | CDC42 | CDC42 | CDC42 | 10156 | 0.0015 | 0.37 | NO |
| 22 | PAK4 | PAK4 | PAK4 | 10612 | -0.013 | 0.35 | NO |
| 23 | RAC1 | RAC1 | RAC1 | 10632 | -0.013 | 0.35 | NO |
| 24 | PAK1 | PAK1 | PAK1 | 11432 | -0.036 | 0.31 | NO |
| 25 | CAP1 | CAP1 | CAP1 | 13875 | -0.11 | 0.2 | NO |
| 26 | ABL2 | ABL2 | ABL2 | 14560 | -0.14 | 0.18 | NO |
| 27 | PFN1 | PFN1 | PFN1 | 14648 | -0.14 | 0.19 | NO |
| 28 | VASP | VASP | VASP | 14746 | -0.14 | 0.21 | NO |
| 29 | SRGAP1 | SRGAP1 | SRGAP1 | 14922 | -0.15 | 0.22 | NO |
Figure S65. Get High-res Image This plot shows mRNAseq_cNMF expression data heatmap (on the left) a RunningEnrichmentScore(RES) plot (on the top right) and a Signal2Noise(S2N) plot (on the bottom right) of genes in the pathway: BIOCARTA AGR PATHWAY.
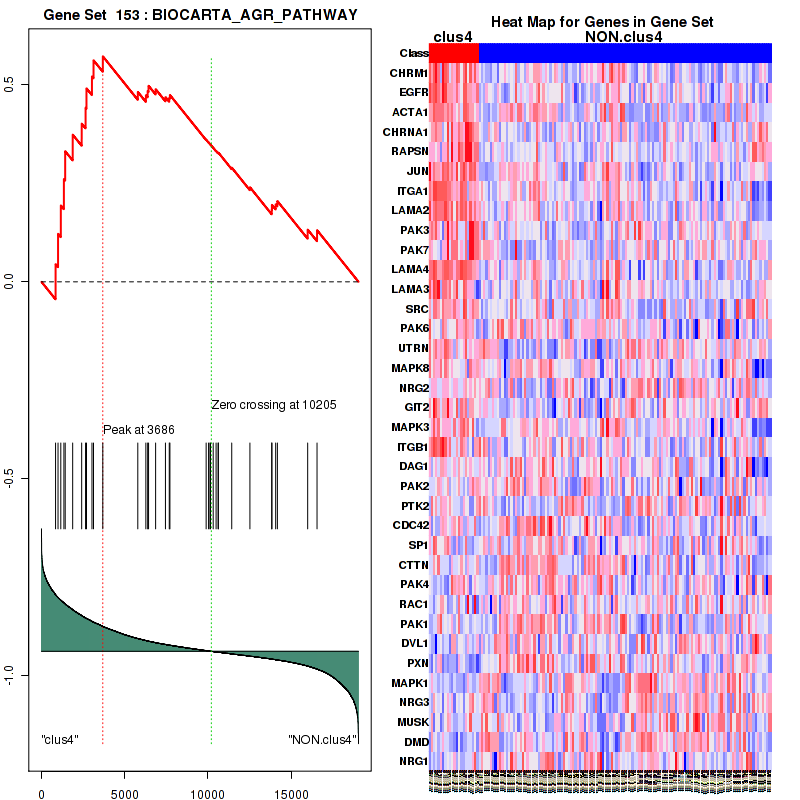
Figure S66. Get High-res Image For the top 5 core enriched genes in the pathway: BIOCARTA AGR PATHWAY, this volcano plot shows how much they are up/down-regulated and significant. The significance was calculated by empirical bayesian fit
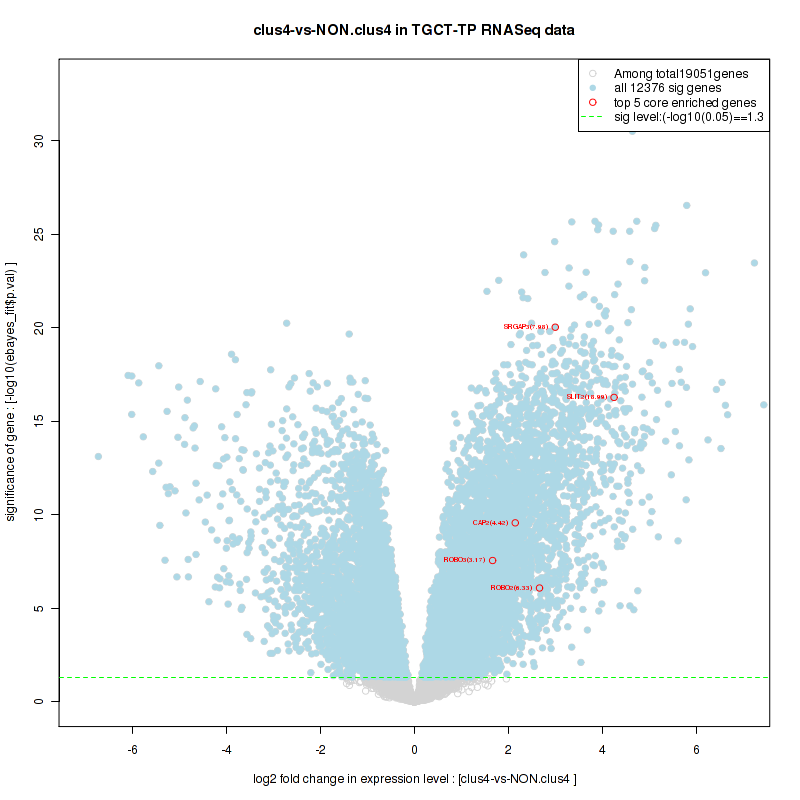
Table S34. Get Full Table This table shows a Running Enrichment Score (RES) of each gene in this pathway, that is, the enrichment score at this point in the ranked list of genes. All genes are ranked by Signal-to-Noise (S2N), a measure of similarity as default and are used to obtain ES matrix of all genes. In this way, GSEA tool uses expression pattern of not only overlapped genes but also not-overlapped genes to produce ES matrix.
| Rank | GENE | SYMBOL | DESC | LIST.LOC | S2N | RES | CORE_ENRICHMENT |
|---|---|---|---|---|---|---|---|
| 1 | CNTN1 | CNTN1 | CNTN1 | 158 | 1.1 | 0.045 | YES |
| 2 | DNER | DNER | DNER | 649 | 0.86 | 0.061 | YES |
| 3 | HEY1 | HEY1 | HEY1 | 754 | 0.83 | 0.096 | YES |
| 4 | HES1 | HES1 | HES1 | 874 | 0.79 | 0.13 | YES |
| 5 | MAMLD1 | MAMLD1 | MAMLD1 | 986 | 0.76 | 0.16 | YES |
| 6 | MAML2 | MAML2 | MAML2 | 1170 | 0.72 | 0.18 | YES |
| 7 | MAML3 | MAML3 | MAML3 | 1220 | 0.71 | 0.22 | YES |
| 8 | CCND1 | CCND1 | CCND1 | 1321 | 0.69 | 0.24 | YES |
| 9 | HES5 | HES5 | HES5 | 1401 | 0.67 | 0.27 | YES |
| 10 | NOTCH4 | NOTCH4 | NOTCH4 | 1868 | 0.59 | 0.28 | YES |
| 11 | JUN | JUN | JUN | 1877 | 0.59 | 0.3 | YES |
| 12 | DLL1 | DLL1 | DLL1 | 1901 | 0.58 | 0.33 | YES |
| 13 | DLL4 | DLL4 | DLL4 | 2024 | 0.56 | 0.35 | YES |
| 14 | TLE2 | TLE2 | TLE2 | 2248 | 0.53 | 0.37 | YES |
| 15 | NOTCH3 | NOTCH3 | NOTCH3 | 2753 | 0.46 | 0.36 | YES |
| 16 | JAG1 | JAG1 | JAG1 | 3107 | 0.41 | 0.36 | YES |
| 17 | ST3GAL6 | ST3GAL6 | ST3GAL6 | 3125 | 0.41 | 0.38 | YES |
| 18 | HDAC11 | HDAC11 | HDAC11 | 3148 | 0.41 | 0.4 | YES |
| 19 | NOTCH2 | NOTCH2 | NOTCH2 | 3367 | 0.39 | 0.41 | YES |
| 20 | DLK1 | DLK1 | DLK1 | 3380 | 0.38 | 0.43 | YES |
| 21 | EIF2C4 | EIF2C4 | EIF2C4 | 3406 | 0.38 | 0.44 | YES |
| 22 | ST3GAL3 | ST3GAL3 | ST3GAL3 | 3472 | 0.38 | 0.46 | YES |
| 23 | HDAC4 | HDAC4 | HDAC4 | 3925 | 0.33 | 0.45 | NO |
| 24 | HEYL | HEYL | HEYL | 5011 | 0.23 | 0.4 | NO |
| 25 | NCOR2 | NCOR2 | NCOR2 | 5268 | 0.22 | 0.4 | NO |
| 26 | MYC | MYC | MYC | 5411 | 0.2 | 0.4 | NO |
| 27 | TLE4 | TLE4 | TLE4 | 5604 | 0.19 | 0.4 | NO |
| 28 | HDAC8 | HDAC8 | HDAC8 | 5795 | 0.18 | 0.4 | NO |
| 29 | DTX4 | DTX4 | DTX4 | 5821 | 0.18 | 0.41 | NO |
| 30 | MIB1 | MIB1 | MIB1 | 5932 | 0.17 | 0.41 | NO |
| 31 | KAT2B | KAT2B | KAT2B | 5989 | 0.17 | 0.42 | NO |
| 32 | HEY2 | HEY2 | HEY2 | 6326 | 0.15 | 0.41 | NO |
| 33 | SEL1L | SEL1L | SEL1L | 6429 | 0.14 | 0.41 | NO |
| 34 | EIF2C3 | EIF2C3 | EIF2C3 | 6539 | 0.14 | 0.41 | NO |
| 35 | APH1A | APH1A | APH1A | 7094 | 0.11 | 0.38 | NO |
| 36 | TBL1X | TBL1X | TBL1X | 7204 | 0.11 | 0.38 | NO |
| 37 | CDK8 | CDK8 | CDK8 | 7501 | 0.095 | 0.37 | NO |
| 38 | CREBBP | CREBBP | CREBBP | 7820 | 0.082 | 0.36 | NO |
| 39 | POFUT1 | POFUT1 | POFUT1 | 7895 | 0.079 | 0.36 | NO |
| 40 | RFNG | RFNG | RFNG | 8072 | 0.073 | 0.36 | NO |
| 41 | TBL1XR1 | TBL1XR1 | TBL1XR1 | 8110 | 0.071 | 0.36 | NO |
| 42 | DTX1 | DTX1 | DTX1 | 8164 | 0.069 | 0.36 | NO |
| 43 | TLE1 | TLE1 | TLE1 | 8370 | 0.062 | 0.35 | NO |
| 44 | B4GALT1 | B4GALT1 | B4GALT1 | 8458 | 0.058 | 0.35 | NO |
| 45 | TP53 | TP53 | TP53 | 8496 | 0.057 | 0.35 | NO |
| 46 | NCOR1 | NCOR1 | NCOR1 | 8553 | 0.055 | 0.35 | NO |
| 47 | ADAM17 | ADAM17 | ADAM17 | 8662 | 0.051 | 0.34 | NO |
| 48 | MIB2 | MIB2 | MIB2 | 8739 | 0.048 | 0.34 | NO |
| 49 | NUMB | NUMB | NUMB | 8753 | 0.048 | 0.34 | NO |
| 50 | TFDP1 | TFDP1 | TFDP1 | 8942 | 0.041 | 0.34 | NO |
| 51 | HIF1A | HIF1A | HIF1A | 9005 | 0.039 | 0.34 | NO |
| 52 | MAML1 | MAML1 | MAML1 | 9007 | 0.039 | 0.34 | NO |
| 53 | HDAC10 | HDAC10 | HDAC10 | 9458 | 0.024 | 0.32 | NO |
| 54 | TMED2 | TMED2 | TMED2 | 9576 | 0.02 | 0.31 | NO |
| 55 | TNRC6A | TNRC6A | TNRC6A | 9630 | 0.018 | 0.31 | NO |
| 56 | HDAC6 | HDAC6 | HDAC6 | 9682 | 0.016 | 0.31 | NO |
| 57 | EIF2C1 | EIF2C1 | EIF2C1 | 9956 | 0.0082 | 0.29 | NO |
| 58 | APH1B | APH1B | APH1B | 9992 | 0.0068 | 0.29 | NO |
| 59 | ADAM10 | ADAM10 | ADAM10 | 10038 | 0.005 | 0.29 | NO |
| 60 | NCSTN | NCSTN | NCSTN | 10066 | 0.0043 | 0.29 | NO |
| 61 | HDAC7 | HDAC7 | HDAC7 | 10139 | 0.0019 | 0.28 | NO |
| 62 | HDAC2 | HDAC2 | HDAC2 | 10360 | -0.0051 | 0.27 | NO |
| 63 | HDAC3 | HDAC3 | HDAC3 | 10558 | -0.011 | 0.26 | NO |
| 64 | SKP1 | SKP1 | SKP1 | 10667 | -0.014 | 0.26 | NO |
| 65 | EIF2C2 | EIF2C2 | EIF2C2 | 10767 | -0.016 | 0.25 | NO |
| 66 | HDAC9 | HDAC9 | HDAC9 | 11046 | -0.025 | 0.24 | NO |
| 67 | TNRC6B | TNRC6B | TNRC6B | 11099 | -0.026 | 0.24 | NO |
| 68 | ATP2A2 | ATP2A2 | ATP2A2 | 11136 | -0.027 | 0.24 | NO |
| 69 | HDAC5 | HDAC5 | HDAC5 | 11418 | -0.036 | 0.22 | NO |
| 70 | HDAC1 | HDAC1 | HDAC1 | 11553 | -0.04 | 0.22 | NO |
| 71 | FBXW7 | FBXW7 | FBXW7 | 11718 | -0.045 | 0.21 | NO |
| 72 | MFNG | MFNG | MFNG | 11741 | -0.045 | 0.21 | NO |
| 73 | FURIN | FURIN | FURIN | 11802 | -0.047 | 0.21 | NO |
| 74 | LFNG | LFNG | LFNG | 12077 | -0.055 | 0.2 | NO |
| 75 | PSEN1 | PSEN1 | PSEN1 | 12155 | -0.057 | 0.2 | NO |
| 76 | EP300 | EP300 | EP300 | 12302 | -0.061 | 0.2 | NO |
| 77 | TLE3 | TLE3 | TLE3 | 12511 | -0.068 | 0.19 | NO |
| 78 | PSENEN | PSENEN | PSENEN | 12560 | -0.069 | 0.19 | NO |
| 79 | CCNC | CCNC | CCNC | 12642 | -0.072 | 0.19 | NO |
| 80 | RPS27A | RPS27A | RPS27A | 12698 | -0.073 | 0.19 | NO |
| 81 | ARRB1 | ARRB1 | ARRB1 | 12860 | -0.078 | 0.18 | NO |
| 82 | RAB6A | RAB6A | RAB6A | 12923 | -0.079 | 0.18 | NO |
| 83 | MOV10 | MOV10 | MOV10 | 13003 | -0.082 | 0.18 | NO |
| 84 | ATP2A1 | ATP2A1 | ATP2A1 | 13172 | -0.088 | 0.18 | NO |
| 85 | KAT2A | KAT2A | KAT2A | 13749 | -0.11 | 0.15 | NO |
| 86 | TNRC6C | TNRC6C | TNRC6C | 13929 | -0.11 | 0.15 | NO |
| 87 | SNW1 | SNW1 | SNW1 | 14104 | -0.12 | 0.15 | NO |
| 88 | E2F3 | E2F3 | E2F3 | 14253 | -0.12 | 0.14 | NO |
| 89 | CUL1 | CUL1 | CUL1 | 14474 | -0.13 | 0.14 | NO |
| 90 | RBX1 | RBX1 | RBX1 | 14608 | -0.14 | 0.14 | NO |
| 91 | JAG2 | JAG2 | JAG2 | 14639 | -0.14 | 0.14 | NO |
| 92 | ARRB2 | ARRB2 | ARRB2 | 14722 | -0.14 | 0.15 | NO |
| 93 | E2F1 | E2F1 | E2F1 | 14934 | -0.15 | 0.14 | NO |
| 94 | UBA52 | UBA52 | UBA52 | 14980 | -0.15 | 0.15 | NO |
| 95 | RBPJ | RBPJ | RBPJ | 15050 | -0.16 | 0.15 | NO |
| 96 | DTX2 | DTX2 | DTX2 | 15749 | -0.19 | 0.12 | NO |
| 97 | PSEN2 | PSEN2 | PSEN2 | 15825 | -0.2 | 0.13 | NO |
| 98 | ATP2A3 | ATP2A3 | ATP2A3 | 17217 | -0.32 | 0.072 | NO |
| 99 | NEURL | NEURL | NEURL | 18172 | -0.5 | 0.046 | NO |
Figure S67. Get High-res Image This plot shows mRNAseq_cNMF expression data heatmap (on the left) a RunningEnrichmentScore(RES) plot (on the top right) and a Signal2Noise(S2N) plot (on the bottom right) of genes in the pathway: BIOCARTA AT1R PATHWAY.

Figure S68. Get High-res Image For the top 5 core enriched genes in the pathway: BIOCARTA AT1R PATHWAY, this volcano plot shows how much they are up/down-regulated and significant. The significance was calculated by empirical bayesian fit

Table S35. Get Full Table This table shows a Running Enrichment Score (RES) of each gene in this pathway, that is, the enrichment score at this point in the ranked list of genes. All genes are ranked by Signal-to-Noise (S2N), a measure of similarity as default and are used to obtain ES matrix of all genes. In this way, GSEA tool uses expression pattern of not only overlapped genes but also not-overlapped genes to produce ES matrix.
| Rank | GENE | SYMBOL | DESC | LIST.LOC | S2N | RES | CORE_ENRICHMENT |
|---|---|---|---|---|---|---|---|
| 1 | DCX | DCX | DCX | 37 | 1.3 | 0.016 | YES |
| 2 | SCN2B | SCN2B | SCN2B | 76 | 1.2 | 0.03 | YES |
| 3 | UNC5C | UNC5C | UNC5C | 118 | 1.1 | 0.043 | YES |
| 4 | SLIT2 | SLIT2 | SLIT2 | 127 | 1.1 | 0.057 | YES |
| 5 | CNTN1 | CNTN1 | CNTN1 | 158 | 1.1 | 0.071 | YES |
| 6 | COL9A1 | COL9A1 | COL9A1 | 166 | 1.1 | 0.085 | YES |
| 7 | CNTN2 | CNTN2 | CNTN2 | 205 | 1.1 | 0.097 | YES |
| 8 | TRPC4 | TRPC4 | TRPC4 | 264 | 1 | 0.11 | YES |
| 9 | NCAM1 | NCAM1 | NCAM1 | 274 | 1 | 0.12 | YES |
| 10 | SRGAP3 | SRGAP3 | SRGAP3 | 308 | 1 | 0.13 | YES |
| 11 | CNTN6 | CNTN6 | CNTN6 | 428 | 0.95 | 0.14 | YES |
| 12 | PLXNB3 | PLXNB3 | PLXNB3 | 495 | 0.92 | 0.15 | YES |
| 13 | COL9A2 | COL9A2 | COL9A2 | 536 | 0.9 | 0.16 | YES |
| 14 | TRPC3 | TRPC3 | TRPC3 | 539 | 0.9 | 0.17 | YES |
| 15 | COL2A1 | COL2A1 | COL2A1 | 553 | 0.9 | 0.18 | YES |
| 16 | SCN7A | SCN7A | SCN7A | 613 | 0.87 | 0.19 | YES |
| 17 | SEMA3E | SEMA3E | SEMA3E | 658 | 0.86 | 0.2 | YES |
| 18 | GDNF | GDNF | GDNF | 663 | 0.86 | 0.21 | YES |
| 19 | ST8SIA2 | ST8SIA2 | ST8SIA2 | 698 | 0.84 | 0.22 | YES |
| 20 | GFRA1 | GFRA1 | GFRA1 | 706 | 0.84 | 0.23 | YES |
| 21 | SEMA5A | SEMA5A | SEMA5A | 779 | 0.82 | 0.24 | YES |
| 22 | CACNB4 | CACNB4 | CACNB4 | 857 | 0.8 | 0.24 | YES |
| 23 | SLIT3 | SLIT3 | SLIT3 | 886 | 0.79 | 0.25 | YES |
| 24 | CACNA1G | CACNA1G | CACNA1G | 908 | 0.78 | 0.26 | YES |
| 25 | NTN1 | NTN1 | NTN1 | 970 | 0.76 | 0.27 | YES |
| 26 | EGFR | EGFR | EGFR | 997 | 0.76 | 0.28 | YES |
| 27 | ALCAM | ALCAM | ALCAM | 1025 | 0.75 | 0.29 | YES |
| 28 | GFRA2 | GFRA2 | GFRA2 | 1215 | 0.71 | 0.29 | YES |
| 29 | COL3A1 | COL3A1 | COL3A1 | 1242 | 0.7 | 0.3 | YES |
| 30 | TRPC6 | TRPC6 | TRPC6 | 1276 | 0.7 | 0.3 | YES |
| 31 | CAP2 | CAP2 | CAP2 | 1297 | 0.69 | 0.31 | YES |
| 32 | COL5A2 | COL5A2 | COL5A2 | 1298 | 0.69 | 0.32 | YES |
| 33 | COL1A1 | COL1A1 | COL1A1 | 1330 | 0.69 | 0.33 | YES |
| 34 | SEMA6D | SEMA6D | SEMA6D | 1344 | 0.69 | 0.34 | YES |
| 35 | ROBO2 | ROBO2 | ROBO2 | 1379 | 0.68 | 0.34 | YES |
| 36 | CNTNAP1 | CNTNAP1 | CNTNAP1 | 1422 | 0.67 | 0.35 | YES |
| 37 | DPYSL4 | DPYSL4 | DPYSL4 | 1457 | 0.66 | 0.36 | YES |
| 38 | CACNA1S | CACNA1S | CACNA1S | 1469 | 0.66 | 0.37 | YES |
| 39 | COL4A5 | COL4A5 | COL4A5 | 1603 | 0.63 | 0.37 | YES |
| 40 | COL5A1 | COL5A1 | COL5A1 | 1739 | 0.61 | 0.37 | YES |
| 41 | NRP2 | NRP2 | NRP2 | 1784 | 0.6 | 0.37 | YES |
| 42 | ITGA2 | ITGA2 | ITGA2 | 1882 | 0.59 | 0.38 | YES |
| 43 | UNC5A | UNC5A | UNC5A | 1894 | 0.58 | 0.38 | YES |
| 44 | DCC | DCC | DCC | 2109 | 0.55 | 0.38 | YES |
| 45 | ROBO3 | ROBO3 | ROBO3 | 2140 | 0.54 | 0.39 | YES |
| 46 | COL1A2 | COL1A2 | COL1A2 | 2180 | 0.54 | 0.39 | YES |
| 47 | ROBO1 | ROBO1 | ROBO1 | 2231 | 0.53 | 0.4 | YES |
| 48 | COL6A3 | COL6A3 | COL6A3 | 2243 | 0.53 | 0.4 | YES |
| 49 | RHOB | RHOB | RHOB | 2245 | 0.53 | 0.41 | YES |
| 50 | MYH11 | MYH11 | MYH11 | 2258 | 0.53 | 0.42 | YES |
| 51 | CACNB2 | CACNB2 | CACNB2 | 2269 | 0.52 | 0.42 | YES |
| 52 | DNM1 | DNM1 | DNM1 | 2296 | 0.52 | 0.43 | YES |
| 53 | SLIT1 | SLIT1 | SLIT1 | 2337 | 0.52 | 0.43 | YES |
| 54 | ITGA1 | ITGA1 | ITGA1 | 2417 | 0.5 | 0.44 | YES |
| 55 | SCN2A | SCN2A | SCN2A | 2567 | 0.48 | 0.43 | YES |
| 56 | CD24 | CD24 | CD24 | 2637 | 0.47 | 0.44 | YES |
| 57 | UNC5B | UNC5B | UNC5B | 2771 | 0.46 | 0.44 | YES |
| 58 | SPTA1 | SPTA1 | SPTA1 | 2852 | 0.45 | 0.44 | YES |
| 59 | NRTN | NRTN | NRTN | 2888 | 0.44 | 0.44 | YES |
| 60 | AGRN | AGRN | AGRN | 2911 | 0.44 | 0.45 | YES |
| 61 | COL6A2 | COL6A2 | COL6A2 | 2952 | 0.43 | 0.45 | YES |
| 62 | RPS6KA2 | RPS6KA2 | RPS6KA2 | 2967 | 0.43 | 0.45 | YES |
| 63 | COL6A1 | COL6A1 | COL6A1 | 3002 | 0.43 | 0.46 | YES |
| 64 | PAK7 | PAK7 | PAK7 | 3033 | 0.42 | 0.46 | YES |
| 65 | PLXNA3 | PLXNA3 | PLXNA3 | 3173 | 0.41 | 0.46 | YES |
| 66 | MET | MET | MET | 3334 | 0.39 | 0.46 | YES |
| 67 | UNC5D | UNC5D | UNC5D | 3345 | 0.39 | 0.46 | YES |
| 68 | PSPN | PSPN | PSPN | 3385 | 0.38 | 0.46 | YES |
| 69 | NRP1 | NRP1 | NRP1 | 3439 | 0.38 | 0.47 | YES |
| 70 | MYL9 | MYL9 | MYL9 | 3528 | 0.37 | 0.47 | YES |
| 71 | SPTBN5 | SPTBN5 | SPTBN5 | 3533 | 0.37 | 0.47 | YES |
| 72 | ARTN | ARTN | ARTN | 3535 | 0.37 | 0.48 | YES |
| 73 | TRIO | TRIO | TRIO | 3626 | 0.36 | 0.48 | YES |
| 74 | NTN4 | NTN4 | NTN4 | 3630 | 0.36 | 0.48 | YES |
| 75 | SEMA3A | SEMA3A | SEMA3A | 3649 | 0.36 | 0.49 | YES |
| 76 | ITGB3 | ITGB3 | ITGB3 | 3650 | 0.36 | 0.49 | YES |
| 77 | RPS6KA6 | RPS6KA6 | RPS6KA6 | 3671 | 0.35 | 0.49 | YES |
| 78 | ABLIM1 | ABLIM1 | ABLIM1 | 3673 | 0.35 | 0.5 | YES |
| 79 | DPYSL3 | DPYSL3 | DPYSL3 | 3699 | 0.35 | 0.5 | YES |
| 80 | SOS2 | SOS2 | SOS2 | 3715 | 0.35 | 0.51 | YES |
| 81 | CACNB1 | CACNB1 | CACNB1 | 3774 | 0.34 | 0.51 | YES |
| 82 | COL4A3 | COL4A3 | COL4A3 | 3814 | 0.34 | 0.51 | YES |
| 83 | GPC1 | GPC1 | GPC1 | 3841 | 0.34 | 0.51 | YES |
| 84 | ITGAV | ITGAV | ITGAV | 3876 | 0.33 | 0.52 | YES |
| 85 | LAMB1 | LAMB1 | LAMB1 | 3940 | 0.33 | 0.52 | YES |
| 86 | CACNA1H | CACNA1H | CACNA1H | 3993 | 0.32 | 0.52 | YES |
| 87 | ERBB2 | ERBB2 | ERBB2 | 3999 | 0.32 | 0.52 | YES |
| 88 | PLXNB1 | PLXNB1 | PLXNB1 | 4004 | 0.32 | 0.53 | YES |
| 89 | MYH14 | MYH14 | MYH14 | 4099 | 0.31 | 0.53 | YES |
| 90 | SCN3B | SCN3B | SCN3B | 4194 | 0.3 | 0.52 | YES |
| 91 | SCN5A | SCN5A | SCN5A | 4199 | 0.3 | 0.53 | YES |
| 92 | PFN2 | PFN2 | PFN2 | 4218 | 0.3 | 0.53 | YES |
| 93 | NEO1 | NEO1 | NEO1 | 4282 | 0.3 | 0.53 | YES |
| 94 | ITGA5 | ITGA5 | ITGA5 | 4328 | 0.29 | 0.53 | YES |
| 95 | RRAS | RRAS | RRAS | 4408 | 0.28 | 0.53 | YES |
| 96 | SIAH2 | SIAH2 | SIAH2 | 4594 | 0.27 | 0.53 | YES |
| 97 | DOCK1 | DOCK1 | DOCK1 | 4607 | 0.27 | 0.53 | YES |
| 98 | FARP2 | FARP2 | FARP2 | 4669 | 0.26 | 0.53 | YES |
| 99 | ANK3 | ANK3 | ANK3 | 4679 | 0.26 | 0.53 | YES |
| 100 | COL4A2 | COL4A2 | COL4A2 | 4682 | 0.26 | 0.54 | YES |
| 101 | KCNQ2 | KCNQ2 | KCNQ2 | 4693 | 0.26 | 0.54 | YES |
| 102 | COL4A1 | COL4A1 | COL4A1 | 4705 | 0.26 | 0.54 | YES |
| 103 | COL9A3 | COL9A3 | COL9A3 | 4833 | 0.25 | 0.54 | YES |
| 104 | ABLIM3 | ABLIM3 | ABLIM3 | 4844 | 0.25 | 0.54 | YES |
| 105 | ARHGEF12 | ARHGEF12 | ARHGEF12 | 4852 | 0.25 | 0.55 | YES |
| 106 | RGMB | RGMB | RGMB | 4866 | 0.25 | 0.55 | YES |
| 107 | MYH10 | MYH10 | MYH10 | 4947 | 0.24 | 0.55 | NO |
| 108 | SPTBN2 | SPTBN2 | SPTBN2 | 5233 | 0.22 | 0.53 | NO |
| 109 | PLXNA2 | PLXNA2 | PLXNA2 | 5276 | 0.22 | 0.54 | NO |
| 110 | ROCK2 | ROCK2 | ROCK2 | 5462 | 0.2 | 0.53 | NO |
| 111 | PLXNC1 | PLXNC1 | PLXNC1 | 5528 | 0.2 | 0.53 | NO |
| 112 | COL4A4 | COL4A4 | COL4A4 | 5670 | 0.19 | 0.52 | NO |
| 113 | SRC | SRC | SRC | 5789 | 0.18 | 0.52 | NO |
| 114 | TRPC7 | TRPC7 | TRPC7 | 5955 | 0.17 | 0.51 | NO |
| 115 | PLXNA1 | PLXNA1 | PLXNA1 | 6078 | 0.16 | 0.51 | NO |
| 116 | FGFR1 | FGFR1 | FGFR1 | 6142 | 0.16 | 0.51 | NO |
| 117 | KCNQ3 | KCNQ3 | KCNQ3 | 6216 | 0.16 | 0.5 | NO |
| 118 | PAK6 | PAK6 | PAK6 | 6274 | 0.15 | 0.5 | NO |
| 119 | ABL1 | ABL1 | ABL1 | 6622 | 0.13 | 0.49 | NO |
| 120 | EVL | EVL | EVL | 6693 | 0.13 | 0.48 | NO |
| 121 | PIP5K1C | PIP5K1C | PIP5K1C | 7061 | 0.11 | 0.47 | NO |
| 122 | ITGA9 | ITGA9 | ITGA9 | 7073 | 0.11 | 0.47 | NO |
| 123 | TLN1 | TLN1 | TLN1 | 7078 | 0.11 | 0.47 | NO |
| 124 | MYL6 | MYL6 | MYL6 | 7127 | 0.11 | 0.47 | NO |
| 125 | SOS1 | SOS1 | SOS1 | 7134 | 0.11 | 0.47 | NO |
| 126 | RGMA | RGMA | RGMA | 7217 | 0.11 | 0.47 | NO |
| 127 | PLXND1 | PLXND1 | PLXND1 | 7279 | 0.1 | 0.46 | NO |
| 128 | RPS6KA3 | RPS6KA3 | RPS6KA3 | 7294 | 0.1 | 0.46 | NO |
| 129 | ST8SIA4 | ST8SIA4 | ST8SIA4 | 7328 | 0.1 | 0.46 | NO |
| 130 | DLG1 | DLG1 | DLG1 | 7337 | 0.1 | 0.47 | NO |
| 131 | DPYSL2 | DPYSL2 | DPYSL2 | 7395 | 0.099 | 0.46 | NO |
| 132 | ENAH | ENAH | ENAH | 7530 | 0.094 | 0.46 | NO |
| 133 | PITPNA | PITPNA | PITPNA | 7573 | 0.092 | 0.46 | NO |
| 134 | MYH9 | MYH9 | MYH9 | 7619 | 0.09 | 0.46 | NO |
| 135 | SCN1B | SCN1B | SCN1B | 7671 | 0.088 | 0.45 | NO |
| 136 | MAPK3 | MAPK3 | MAPK3 | 7678 | 0.087 | 0.46 | NO |
| 137 | ITGB1 | ITGB1 | ITGB1 | 7717 | 0.086 | 0.45 | NO |
| 138 | SRGAP2 | SRGAP2 | SRGAP2 | 7802 | 0.083 | 0.45 | NO |
| 139 | PRNP | PRNP | PRNP | 7860 | 0.08 | 0.45 | NO |
| 140 | AP2A2 | AP2A2 | AP2A2 | 7935 | 0.078 | 0.45 | NO |
| 141 | CLASP1 | CLASP1 | CLASP1 | 7996 | 0.076 | 0.44 | NO |
| 142 | FYN | FYN | FYN | 8057 | 0.074 | 0.44 | NO |
| 143 | MYO10 | MYO10 | MYO10 | 8235 | 0.066 | 0.43 | NO |
| 144 | RDX | RDX | RDX | 8402 | 0.06 | 0.42 | NO |
| 145 | SPTAN1 | SPTAN1 | SPTAN1 | 8423 | 0.06 | 0.42 | NO |
| 146 | LAMC1 | LAMC1 | LAMC1 | 8550 | 0.055 | 0.42 | NO |
| 147 | CREB1 | CREB1 | CREB1 | 8562 | 0.054 | 0.42 | NO |
| 148 | MYL12B | MYL12B | MYL12B | 8730 | 0.049 | 0.41 | NO |
| 149 | NUMB | NUMB | NUMB | 8753 | 0.048 | 0.41 | NO |
| 150 | RPS6KA4 | RPS6KA4 | RPS6KA4 | 8788 | 0.047 | 0.41 | NO |
| 151 | PLCG1 | PLCG1 | PLCG1 | 8857 | 0.045 | 0.41 | NO |
| 152 | SEMA7A | SEMA7A | SEMA7A | 8983 | 0.04 | 0.4 | NO |
| 153 | KIAA1598 | KIAA1598 | KIAA1598 | 9070 | 0.037 | 0.4 | NO |
| 154 | MSN | MSN | MSN | 9144 | 0.034 | 0.39 | NO |
| 155 | ROCK1 | ROCK1 | ROCK1 | 9170 | 0.034 | 0.39 | NO |
| 156 | AP2A1 | AP2A1 | AP2A1 | 9199 | 0.033 | 0.39 | NO |
| 157 | SPTBN1 | SPTBN1 | SPTBN1 | 9520 | 0.022 | 0.37 | NO |
| 158 | CDK5R1 | CDK5R1 | CDK5R1 | 9547 | 0.021 | 0.37 | NO |
| 159 | RHOC | RHOC | RHOC | 9550 | 0.021 | 0.37 | NO |
| 160 | RPS6KA5 | RPS6KA5 | RPS6KA5 | 9626 | 0.018 | 0.37 | NO |
| 161 | NRAS | NRAS | NRAS | 9770 | 0.014 | 0.36 | NO |
| 162 | AP2B1 | AP2B1 | AP2B1 | 9890 | 0.01 | 0.36 | NO |
| 163 | NCK2 | NCK2 | NCK2 | 9921 | 0.0094 | 0.35 | NO |
| 164 | NCK1 | NCK1 | NCK1 | 9970 | 0.0077 | 0.35 | NO |
| 165 | PAK2 | PAK2 | PAK2 | 10040 | 0.005 | 0.35 | NO |
| 166 | PTK2 | PTK2 | PTK2 | 10121 | 0.0023 | 0.34 | NO |
| 167 | CDC42 | CDC42 | CDC42 | 10156 | 0.0015 | 0.34 | NO |
| 168 | KIF4A | KIF4A | KIF4A | 10228 | -0.00062 | 0.34 | NO |
| 169 | EZR | EZR | EZR | 10330 | -0.0042 | 0.33 | NO |
| 170 | CFL1 | CFL1 | CFL1 | 10338 | -0.0044 | 0.33 | NO |
| 171 | CDK1 | CDK1 | CDK1 | 10347 | -0.0047 | 0.33 | NO |
| 172 | RHOA | RHOA | RHOA | 10396 | -0.0062 | 0.33 | NO |
| 173 | PAK4 | PAK4 | PAK4 | 10612 | -0.013 | 0.32 | NO |
| 174 | RAC1 | RAC1 | RAC1 | 10632 | -0.013 | 0.32 | NO |
| 175 | ARHGEF11 | ARHGEF11 | ARHGEF11 | 10939 | -0.022 | 0.3 | NO |
| 176 | L1CAM | L1CAM | L1CAM | 11043 | -0.025 | 0.3 | NO |
| 177 | HRAS | HRAS | HRAS | 11044 | -0.025 | 0.3 | NO |
| 178 | CRMP1 | CRMP1 | CRMP1 | 11061 | -0.026 | 0.3 | NO |
| 179 | CLTC | CLTC | CLTC | 11202 | -0.029 | 0.29 | NO |
| 180 | PAK1 | PAK1 | PAK1 | 11432 | -0.036 | 0.28 | NO |
| 181 | LAMA1 | LAMA1 | LAMA1 | 11537 | -0.04 | 0.27 | NO |
| 182 | RAF1 | RAF1 | RAF1 | 11649 | -0.043 | 0.27 | NO |
| 183 | MAP2K1 | MAP2K1 | MAP2K1 | 11675 | -0.044 | 0.27 | NO |
| 184 | CSNK2A1 | CSNK2A1 | CSNK2A1 | 11893 | -0.049 | 0.26 | NO |
| 185 | KRAS | KRAS | KRAS | 11950 | -0.051 | 0.25 | NO |
| 186 | GRB2 | GRB2 | GRB2 | 11951 | -0.051 | 0.25 | NO |
| 187 | AP2S1 | AP2S1 | AP2S1 | 12033 | -0.053 | 0.25 | NO |
| 188 | DNM2 | DNM2 | DNM2 | 12162 | -0.057 | 0.24 | NO |
| 189 | MAP2K2 | MAP2K2 | MAP2K2 | 12254 | -0.06 | 0.24 | NO |
| 190 | STIP1 | STIP1 | STIP1 | 12315 | -0.062 | 0.24 | NO |
| 191 | KIF4B | KIF4B | KIF4B | 12316 | -0.062 | 0.24 | NO |
| 192 | CSNK2B | CSNK2B | CSNK2B | 12442 | -0.065 | 0.23 | NO |
| 193 | AP2M1 | AP2M1 | AP2M1 | 12456 | -0.066 | 0.23 | NO |
| 194 | FES | FES | FES | 12588 | -0.07 | 0.23 | NO |
| 195 | CLTA | CLTA | CLTA | 12638 | -0.071 | 0.23 | NO |
| 196 | RANBP9 | RANBP9 | RANBP9 | 12701 | -0.073 | 0.22 | NO |
| 197 | TREM2 | TREM2 | TREM2 | 12730 | -0.074 | 0.22 | NO |
| 198 | CSNK2A2 | CSNK2A2 | CSNK2A2 | 12745 | -0.074 | 0.22 | NO |
| 199 | DPYSL5 | DPYSL5 | DPYSL5 | 12905 | -0.079 | 0.22 | NO |
| 200 | YWHAB | YWHAB | YWHAB | 13020 | -0.082 | 0.21 | NO |
| 201 | LIMK1 | LIMK1 | LIMK1 | 13096 | -0.085 | 0.21 | NO |
| 202 | ANK1 | ANK1 | ANK1 | 13641 | -0.1 | 0.18 | NO |
| 203 | HFE2 | HFE2 | HFE2 | 13709 | -0.1 | 0.18 | NO |
| 204 | HSP90AB1 | HSP90AB1 | HSP90AB1 | 13792 | -0.11 | 0.18 | NO |
| 205 | MAPK1 | MAPK1 | MAPK1 | 13847 | -0.11 | 0.17 | NO |
| 206 | SEMA6A | SEMA6A | SEMA6A | 13852 | -0.11 | 0.18 | NO |
| 207 | CAP1 | CAP1 | CAP1 | 13875 | -0.11 | 0.18 | NO |
| 208 | CACNB3 | CACNB3 | CACNB3 | 14050 | -0.12 | 0.17 | NO |
| 209 | SPTB | SPTB | SPTB | 14066 | -0.12 | 0.17 | NO |
| 210 | RHOG | RHOG | RHOG | 14178 | -0.12 | 0.16 | NO |
| 211 | NCAN | NCAN | NCAN | 14216 | -0.12 | 0.16 | NO |
| 212 | SDCBP | SDCBP | SDCBP | 14435 | -0.13 | 0.15 | NO |
| 213 | ABL2 | ABL2 | ABL2 | 14560 | -0.14 | 0.15 | NO |
| 214 | SH3GL2 | SH3GL2 | SH3GL2 | 14646 | -0.14 | 0.15 | NO |
| 215 | PFN1 | PFN1 | PFN1 | 14648 | -0.14 | 0.15 | NO |
| 216 | LIMK2 | LIMK2 | LIMK2 | 14721 | -0.14 | 0.15 | NO |
| 217 | VASP | VASP | VASP | 14746 | -0.14 | 0.15 | NO |
| 218 | NRCAM | NRCAM | NRCAM | 14899 | -0.15 | 0.14 | NO |
| 219 | RND1 | RND1 | RND1 | 14917 | -0.15 | 0.14 | NO |
| 220 | SRGAP1 | SRGAP1 | SRGAP1 | 14922 | -0.15 | 0.14 | NO |
| 221 | HSP90AA1 | HSP90AA1 | HSP90AA1 | 14993 | -0.16 | 0.14 | NO |
| 222 | WASL | WASL | WASL | 15196 | -0.16 | 0.13 | NO |
| 223 | RPS6KA1 | RPS6KA1 | RPS6KA1 | 15383 | -0.17 | 0.13 | NO |
| 224 | SEMA4A | SEMA4A | SEMA4A | 15689 | -0.19 | 0.11 | NO |
| 225 | TYROBP | TYROBP | TYROBP | 16095 | -0.22 | 0.094 | NO |
| 226 | CDK5 | CDK5 | CDK5 | 16129 | -0.22 | 0.095 | NO |
| 227 | SIAH1 | SIAH1 | SIAH1 | 16294 | -0.23 | 0.09 | NO |
| 228 | SPTBN4 | SPTBN4 | SPTBN4 | 16573 | -0.25 | 0.078 | NO |
| 229 | SEMA4D | SEMA4D | SEMA4D | 16719 | -0.27 | 0.074 | NO |
| 230 | DLG3 | DLG3 | DLG3 | 16790 | -0.27 | 0.074 | NO |
| 231 | PRKCQ | PRKCQ | PRKCQ | 17023 | -0.3 | 0.066 | NO |
| 232 | CACNA1I | CACNA1I | CACNA1I | 17156 | -0.31 | 0.063 | NO |
| 233 | ITGA2B | ITGA2B | ITGA2B | 17267 | -0.33 | 0.062 | NO |
| 234 | PTPRC | PTPRC | PTPRC | 17313 | -0.33 | 0.064 | NO |
| 235 | RAC2 | RAC2 | RAC2 | 17450 | -0.35 | 0.061 | NO |
| 236 | CD72 | CD72 | CD72 | 17599 | -0.38 | 0.058 | NO |
| 237 | SCN8A | SCN8A | SCN8A | 17703 | -0.4 | 0.058 | NO |
| 238 | SCN4A | SCN4A | SCN4A | 17826 | -0.42 | 0.057 | NO |
| 239 | TRPC5 | TRPC5 | TRPC5 | 18456 | -0.57 | 0.032 | NO |
Figure S69. Get High-res Image This plot shows mRNAseq_cNMF expression data heatmap (on the left) a RunningEnrichmentScore(RES) plot (on the top right) and a Signal2Noise(S2N) plot (on the bottom right) of genes in the pathway: SIG REGULATION OF THE ACTIN CYTOSKELETON BY RHO GTPASES.

Figure S70. Get High-res Image For the top 5 core enriched genes in the pathway: SIG REGULATION OF THE ACTIN CYTOSKELETON BY RHO GTPASES, this volcano plot shows how much they are up/down-regulated and significant. The significance was calculated by empirical bayesian fit
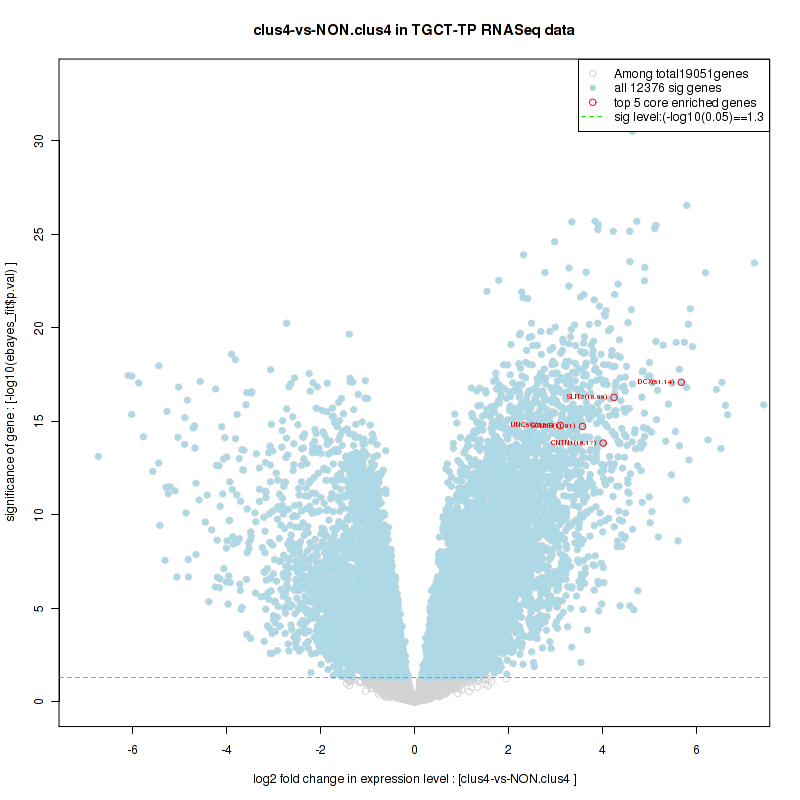
Table S36. Get Full Table This table shows a Running Enrichment Score (RES) of each gene in this pathway, that is, the enrichment score at this point in the ranked list of genes. All genes are ranked by Signal-to-Noise (S2N), a measure of similarity as default and are used to obtain ES matrix of all genes. In this way, GSEA tool uses expression pattern of not only overlapped genes but also not-overlapped genes to produce ES matrix.
| Rank | GENE | SYMBOL | DESC | LIST.LOC | S2N | RES | CORE_ENRICHMENT |
|---|---|---|---|---|---|---|---|
| 1 | WIF1 | WIF1 | WIF1 | 12 | 1.4 | 0.11 | YES |
| 2 | DKK2 | DKK2 | DKK2 | 24 | 1.3 | 0.22 | YES |
| 3 | SSPO | SSPO | SSPO | 203 | 1.1 | 0.3 | YES |
| 4 | DKK1 | DKK1 | DKK1 | 935 | 0.77 | 0.32 | YES |
| 5 | FZD1 | FZD1 | FZD1 | 1081 | 0.74 | 0.37 | YES |
| 6 | CCND1 | CCND1 | CCND1 | 1321 | 0.69 | 0.41 | YES |
| 7 | JUN | JUN | JUN | 1877 | 0.59 | 0.43 | YES |
| 8 | DLL1 | DLL1 | DLL1 | 1901 | 0.58 | 0.48 | YES |
| 9 | NKD1 | NKD1 | NKD1 | 2160 | 0.54 | 0.51 | YES |
| 10 | HNF1A | HNF1A | HNF1A | 2250 | 0.53 | 0.55 | YES |
| 11 | FOS | FOS | FOS | 2800 | 0.45 | 0.55 | YES |
| 12 | NOTCH1 | NOTCH1 | NOTCH1 | 3359 | 0.39 | 0.55 | YES |
| 13 | KREMEN2 | KREMEN2 | KREMEN2 | 4310 | 0.29 | 0.53 | NO |
| 14 | CTNNB1 | CTNNB1 | CTNNB1 | 5299 | 0.21 | 0.49 | NO |
| 15 | MYC | MYC | MYC | 5411 | 0.2 | 0.5 | NO |
| 16 | WNT1 | WNT1 | WNT1 | 5770 | 0.18 | 0.5 | NO |
| 17 | AES | AES | AES | 6069 | 0.16 | 0.5 | NO |
| 18 | LRP6 | LRP6 | LRP6 | 6881 | 0.12 | 0.46 | NO |
| 19 | CTBP1 | CTBP1 | CTBP1 | 6928 | 0.12 | 0.47 | NO |
| 20 | APC | APC | APC | 7074 | 0.11 | 0.47 | NO |
| 21 | APH1A | APH1A | APH1A | 7094 | 0.11 | 0.48 | NO |
| 22 | TAB1 | TAB1 | TAB1 | 7581 | 0.091 | 0.46 | NO |
| 23 | MAPK3 | MAPK3 | MAPK3 | 7678 | 0.087 | 0.46 | NO |
| 24 | CREBBP | CREBBP | CREBBP | 7820 | 0.082 | 0.46 | NO |
| 25 | DTX1 | DTX1 | DTX1 | 8164 | 0.069 | 0.45 | NO |
| 26 | TLE1 | TLE1 | TLE1 | 8370 | 0.062 | 0.44 | NO |
| 27 | FBXW11 | FBXW11 | FBXW11 | 8379 | 0.061 | 0.45 | NO |
| 28 | GSK3B | GSK3B | GSK3B | 9279 | 0.03 | 0.4 | NO |
| 29 | PPP2R5D | PPP2R5D | PPP2R5D | 9347 | 0.028 | 0.4 | NO |
| 30 | APH1B | APH1B | APH1B | 9992 | 0.0068 | 0.37 | NO |
| 31 | ADAM10 | ADAM10 | ADAM10 | 10038 | 0.005 | 0.37 | NO |
| 32 | NCSTN | NCSTN | NCSTN | 10066 | 0.0043 | 0.37 | NO |
| 33 | CSNK1A1 | CSNK1A1 | CSNK1A1 | 10194 | 0.00041 | 0.36 | NO |
| 34 | AXIN1 | AXIN1 | AXIN1 | 10995 | -0.023 | 0.32 | NO |
| 35 | NEDD4 | NEDD4 | NEDD4 | 11336 | -0.033 | 0.3 | NO |
| 36 | HDAC1 | HDAC1 | HDAC1 | 11553 | -0.04 | 0.3 | NO |
| 37 | PPARD | PPARD | PPARD | 11597 | -0.042 | 0.3 | NO |
| 38 | NLK | NLK | NLK | 11860 | -0.048 | 0.29 | NO |
| 39 | CSNK2A1 | CSNK2A1 | CSNK2A1 | 11893 | -0.049 | 0.29 | NO |
| 40 | PSEN1 | PSEN1 | PSEN1 | 12155 | -0.057 | 0.28 | NO |
| 41 | MAP3K7 | MAP3K7 | MAP3K7 | 12292 | -0.061 | 0.28 | NO |
| 42 | DVL1 | DVL1 | DVL1 | 12526 | -0.068 | 0.27 | NO |
| 43 | PSENEN | PSENEN | PSENEN | 12560 | -0.069 | 0.28 | NO |
| 44 | MAPK1 | MAPK1 | MAPK1 | 13847 | -0.11 | 0.22 | NO |
| 45 | RBPJ | RBPJ | RBPJ | 15050 | -0.16 | 0.17 | NO |
| 46 | FRAT1 | FRAT1 | FRAT1 | 18407 | -0.56 | 0.034 | NO |
Figure S71. Get High-res Image This plot shows mRNAseq_cNMF expression data heatmap (on the left) a RunningEnrichmentScore(RES) plot (on the top right) and a Signal2Noise(S2N) plot (on the bottom right) of genes in the pathway: PID ENDOTHELINPATHWAY.

Figure S72. Get High-res Image For the top 5 core enriched genes in the pathway: PID ENDOTHELINPATHWAY, this volcano plot shows how much they are up/down-regulated and significant. The significance was calculated by empirical bayesian fit
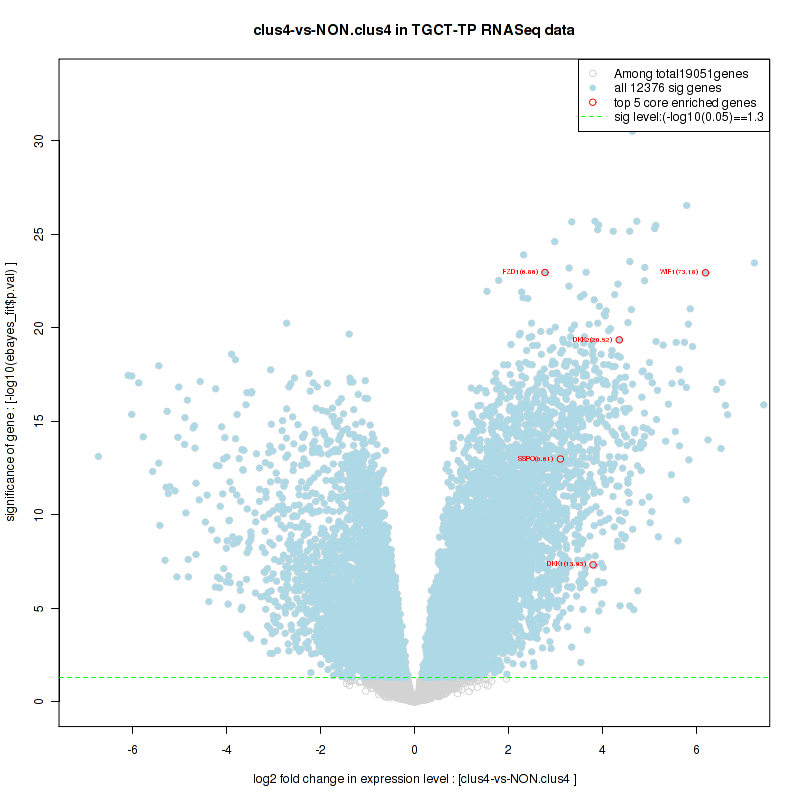
Table S37. Get Full Table This table shows a Running Enrichment Score (RES) of each gene in this pathway, that is, the enrichment score at this point in the ranked list of genes. All genes are ranked by Signal-to-Noise (S2N), a measure of similarity as default and are used to obtain ES matrix of all genes. In this way, GSEA tool uses expression pattern of not only overlapped genes but also not-overlapped genes to produce ES matrix.
| Rank | GENE | SYMBOL | DESC | LIST.LOC | S2N | RES | CORE_ENRICHMENT |
|---|---|---|---|---|---|---|---|
| 1 | COL9A1 | COL9A1 | COL9A1 | 166 | 1.1 | 0.039 | YES |
| 2 | CNTN2 | CNTN2 | CNTN2 | 205 | 1.1 | 0.083 | YES |
| 3 | NCAM1 | NCAM1 | NCAM1 | 274 | 1 | 0.12 | YES |
| 4 | COL9A2 | COL9A2 | COL9A2 | 536 | 0.9 | 0.15 | YES |
| 5 | COL2A1 | COL2A1 | COL2A1 | 553 | 0.9 | 0.19 | YES |
| 6 | GDNF | GDNF | GDNF | 663 | 0.86 | 0.22 | YES |
| 7 | ST8SIA2 | ST8SIA2 | ST8SIA2 | 698 | 0.84 | 0.25 | YES |
| 8 | GFRA1 | GFRA1 | GFRA1 | 706 | 0.84 | 0.29 | YES |
| 9 | CACNB4 | CACNB4 | CACNB4 | 857 | 0.8 | 0.31 | YES |
| 10 | CACNA1G | CACNA1G | CACNA1G | 908 | 0.78 | 0.34 | YES |
| 11 | GFRA2 | GFRA2 | GFRA2 | 1215 | 0.71 | 0.36 | YES |
| 12 | COL3A1 | COL3A1 | COL3A1 | 1242 | 0.7 | 0.39 | YES |
| 13 | COL5A2 | COL5A2 | COL5A2 | 1298 | 0.69 | 0.42 | YES |
| 14 | COL1A1 | COL1A1 | COL1A1 | 1330 | 0.69 | 0.44 | YES |
| 15 | CACNA1S | CACNA1S | CACNA1S | 1469 | 0.66 | 0.46 | YES |
| 16 | COL4A5 | COL4A5 | COL4A5 | 1603 | 0.63 | 0.48 | YES |
| 17 | COL5A1 | COL5A1 | COL5A1 | 1739 | 0.61 | 0.5 | YES |
| 18 | COL1A2 | COL1A2 | COL1A2 | 2180 | 0.54 | 0.5 | YES |
| 19 | COL6A3 | COL6A3 | COL6A3 | 2243 | 0.53 | 0.52 | YES |
| 20 | CACNB2 | CACNB2 | CACNB2 | 2269 | 0.52 | 0.54 | YES |
| 21 | SPTA1 | SPTA1 | SPTA1 | 2852 | 0.45 | 0.53 | YES |
| 22 | NRTN | NRTN | NRTN | 2888 | 0.44 | 0.55 | YES |
| 23 | AGRN | AGRN | AGRN | 2911 | 0.44 | 0.57 | YES |
| 24 | COL6A2 | COL6A2 | COL6A2 | 2952 | 0.43 | 0.58 | YES |
| 25 | COL6A1 | COL6A1 | COL6A1 | 3002 | 0.43 | 0.6 | YES |
| 26 | PSPN | PSPN | PSPN | 3385 | 0.38 | 0.6 | YES |
| 27 | SPTBN5 | SPTBN5 | SPTBN5 | 3533 | 0.37 | 0.6 | YES |
| 28 | ARTN | ARTN | ARTN | 3535 | 0.37 | 0.62 | YES |
| 29 | CACNB1 | CACNB1 | CACNB1 | 3774 | 0.34 | 0.62 | YES |
| 30 | COL4A3 | COL4A3 | COL4A3 | 3814 | 0.34 | 0.64 | YES |
| 31 | CACNA1H | CACNA1H | CACNA1H | 3993 | 0.32 | 0.64 | YES |
| 32 | COL4A2 | COL4A2 | COL4A2 | 4682 | 0.26 | 0.62 | NO |
| 33 | COL4A1 | COL4A1 | COL4A1 | 4705 | 0.26 | 0.62 | NO |
| 34 | COL9A3 | COL9A3 | COL9A3 | 4833 | 0.25 | 0.63 | NO |
| 35 | SPTBN2 | SPTBN2 | SPTBN2 | 5233 | 0.22 | 0.62 | NO |
| 36 | COL4A4 | COL4A4 | COL4A4 | 5670 | 0.19 | 0.6 | NO |
| 37 | SRC | SRC | SRC | 5789 | 0.18 | 0.6 | NO |
| 38 | FGFR1 | FGFR1 | FGFR1 | 6142 | 0.16 | 0.59 | NO |
| 39 | SOS1 | SOS1 | SOS1 | 7134 | 0.11 | 0.54 | NO |
| 40 | ST8SIA4 | ST8SIA4 | ST8SIA4 | 7328 | 0.1 | 0.54 | NO |
| 41 | MAPK3 | MAPK3 | MAPK3 | 7678 | 0.087 | 0.52 | NO |
| 42 | PRNP | PRNP | PRNP | 7860 | 0.08 | 0.52 | NO |
| 43 | FYN | FYN | FYN | 8057 | 0.074 | 0.51 | NO |
| 44 | SPTAN1 | SPTAN1 | SPTAN1 | 8423 | 0.06 | 0.49 | NO |
| 45 | CREB1 | CREB1 | CREB1 | 8562 | 0.054 | 0.49 | NO |
| 46 | SPTBN1 | SPTBN1 | SPTBN1 | 9520 | 0.022 | 0.44 | NO |
| 47 | RPS6KA5 | RPS6KA5 | RPS6KA5 | 9626 | 0.018 | 0.44 | NO |
| 48 | NRAS | NRAS | NRAS | 9770 | 0.014 | 0.43 | NO |
| 49 | PTK2 | PTK2 | PTK2 | 10121 | 0.0023 | 0.41 | NO |
| 50 | CDK1 | CDK1 | CDK1 | 10347 | -0.0047 | 0.4 | NO |
| 51 | HRAS | HRAS | HRAS | 11044 | -0.025 | 0.36 | NO |
| 52 | RAF1 | RAF1 | RAF1 | 11649 | -0.043 | 0.33 | NO |
| 53 | MAP2K1 | MAP2K1 | MAP2K1 | 11675 | -0.044 | 0.33 | NO |
| 54 | KRAS | KRAS | KRAS | 11950 | -0.051 | 0.32 | NO |
| 55 | GRB2 | GRB2 | GRB2 | 11951 | -0.051 | 0.32 | NO |
| 56 | MAP2K2 | MAP2K2 | MAP2K2 | 12254 | -0.06 | 0.31 | NO |
| 57 | YWHAB | YWHAB | YWHAB | 13020 | -0.082 | 0.27 | NO |
| 58 | MAPK1 | MAPK1 | MAPK1 | 13847 | -0.11 | 0.23 | NO |
| 59 | CACNB3 | CACNB3 | CACNB3 | 14050 | -0.12 | 0.23 | NO |
| 60 | SPTB | SPTB | SPTB | 14066 | -0.12 | 0.23 | NO |
| 61 | NCAN | NCAN | NCAN | 14216 | -0.12 | 0.23 | NO |
| 62 | SPTBN4 | SPTBN4 | SPTBN4 | 16573 | -0.25 | 0.12 | NO |
| 63 | CACNA1I | CACNA1I | CACNA1I | 17156 | -0.31 | 0.1 | NO |
Figure S73. Get High-res Image This plot shows mRNAseq_cNMF expression data heatmap (on the left) a RunningEnrichmentScore(RES) plot (on the top right) and a Signal2Noise(S2N) plot (on the bottom right) of genes in the pathway: PID NOTCH PATHWAY.

Figure S74. Get High-res Image For the top 5 core enriched genes in the pathway: PID NOTCH PATHWAY, this volcano plot shows how much they are up/down-regulated and significant. The significance was calculated by empirical bayesian fit
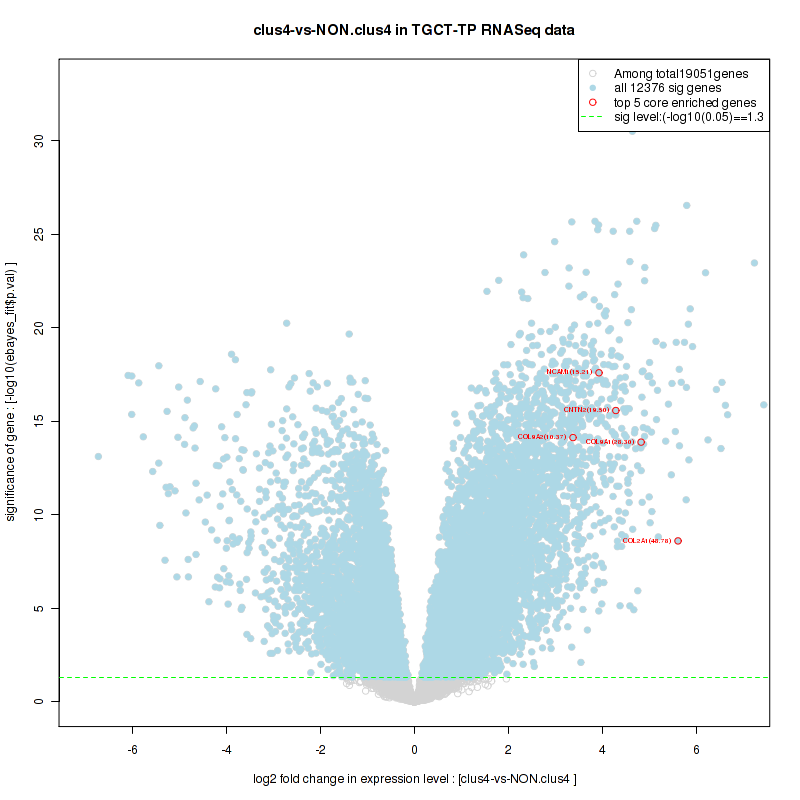
Table S38. Get Full Table This table shows a Running Enrichment Score (RES) of each gene in this pathway, that is, the enrichment score at this point in the ranked list of genes. All genes are ranked by Signal-to-Noise (S2N), a measure of similarity as default and are used to obtain ES matrix of all genes. In this way, GSEA tool uses expression pattern of not only overlapped genes but also not-overlapped genes to produce ES matrix.
| Rank | GENE | SYMBOL | DESC | LIST.LOC | S2N | RES | CORE_ENRICHMENT |
|---|---|---|---|---|---|---|---|
| 1 | CNTN1 | CNTN1 | CNTN1 | 158 | 1.1 | 0.057 | YES |
| 2 | SSPO | SSPO | SSPO | 203 | 1.1 | 0.12 | YES |
| 3 | CNTN6 | CNTN6 | CNTN6 | 428 | 0.95 | 0.16 | YES |
| 4 | DNER | DNER | DNER | 649 | 0.86 | 0.2 | YES |
| 5 | MAML2 | MAML2 | MAML2 | 1170 | 0.72 | 0.22 | YES |
| 6 | CCND1 | CCND1 | CCND1 | 1321 | 0.69 | 0.25 | YES |
| 7 | MFAP2 | MFAP2 | MFAP2 | 1651 | 0.62 | 0.27 | YES |
| 8 | NOTCH4 | NOTCH4 | NOTCH4 | 1868 | 0.59 | 0.29 | YES |
| 9 | DLL1 | DLL1 | DLL1 | 1901 | 0.58 | 0.33 | YES |
| 10 | DLL4 | DLL4 | DLL4 | 2024 | 0.56 | 0.35 | YES |
| 11 | ADAM12 | ADAM12 | ADAM12 | 2103 | 0.55 | 0.38 | YES |
| 12 | DNM1 | DNM1 | DNM1 | 2296 | 0.52 | 0.4 | YES |
| 13 | MFAP5 | MFAP5 | MFAP5 | 2533 | 0.49 | 0.42 | YES |
| 14 | NOTCH3 | NOTCH3 | NOTCH3 | 2753 | 0.46 | 0.44 | YES |
| 15 | JAG1 | JAG1 | JAG1 | 3107 | 0.41 | 0.44 | YES |
| 16 | NOTCH1 | NOTCH1 | NOTCH1 | 3359 | 0.39 | 0.45 | YES |
| 17 | NOTCH2 | NOTCH2 | NOTCH2 | 3367 | 0.39 | 0.47 | YES |
| 18 | DLK1 | DLK1 | DLK1 | 3380 | 0.38 | 0.5 | YES |
| 19 | GATA3 | GATA3 | GATA3 | 3821 | 0.34 | 0.49 | YES |
| 20 | CDKN1A | CDKN1A | CDKN1A | 3885 | 0.33 | 0.51 | YES |
| 21 | NCOR2 | NCOR2 | NCOR2 | 5268 | 0.22 | 0.45 | NO |
| 22 | MYC | MYC | MYC | 5411 | 0.2 | 0.45 | NO |
| 23 | MIB1 | MIB1 | MIB1 | 5932 | 0.17 | 0.44 | NO |
| 24 | CTBP1 | CTBP1 | CTBP1 | 6928 | 0.12 | 0.39 | NO |
| 25 | APH1A | APH1A | APH1A | 7094 | 0.11 | 0.39 | NO |
| 26 | DTX1 | DTX1 | DTX1 | 8164 | 0.069 | 0.34 | NO |
| 27 | NCOR1 | NCOR1 | NCOR1 | 8553 | 0.055 | 0.32 | NO |
| 28 | NUMB | NUMB | NUMB | 8753 | 0.048 | 0.31 | NO |
| 29 | MAML1 | MAML1 | MAML1 | 9007 | 0.039 | 0.3 | NO |
| 30 | RAB11A | RAB11A | RAB11A | 9473 | 0.024 | 0.28 | NO |
| 31 | APH1B | APH1B | APH1B | 9992 | 0.0068 | 0.25 | NO |
| 32 | ADAM10 | ADAM10 | ADAM10 | 10038 | 0.005 | 0.25 | NO |
| 33 | NCSTN | NCSTN | NCSTN | 10066 | 0.0043 | 0.25 | NO |
| 34 | MARK2 | MARK2 | MARK2 | 10664 | -0.014 | 0.22 | NO |
| 35 | SKP1 | SKP1 | SKP1 | 10667 | -0.014 | 0.22 | NO |
| 36 | SKP2 | SKP2 | SKP2 | 10859 | -0.019 | 0.21 | NO |
| 37 | HDAC1 | HDAC1 | HDAC1 | 11553 | -0.04 | 0.17 | NO |
| 38 | FBXW7 | FBXW7 | FBXW7 | 11718 | -0.045 | 0.17 | NO |
| 39 | FURIN | FURIN | FURIN | 11802 | -0.047 | 0.17 | NO |
| 40 | ITCH | ITCH | ITCH | 11958 | -0.051 | 0.16 | NO |
| 41 | PSEN1 | PSEN1 | PSEN1 | 12155 | -0.057 | 0.15 | NO |
| 42 | EP300 | EP300 | EP300 | 12302 | -0.061 | 0.15 | NO |
| 43 | PSENEN | PSENEN | PSENEN | 12560 | -0.069 | 0.14 | NO |
| 44 | EPS15 | EPS15 | EPS15 | 12774 | -0.075 | 0.13 | NO |
| 45 | RBBP8 | RBBP8 | RBBP8 | 12963 | -0.08 | 0.13 | NO |
| 46 | KDM1A | KDM1A | KDM1A | 13073 | -0.084 | 0.13 | NO |
| 47 | YY1 | YY1 | YY1 | 13562 | -0.1 | 0.11 | NO |
| 48 | IL4 | IL4 | IL4 | 13569 | -0.1 | 0.11 | NO |
| 49 | SPEN | SPEN | SPEN | 14130 | -0.12 | 0.092 | NO |
| 50 | LNX1 | LNX1 | LNX1 | 14329 | -0.13 | 0.089 | NO |
| 51 | ENO1 | ENO1 | ENO1 | 14426 | -0.13 | 0.091 | NO |
| 52 | CUL1 | CUL1 | CUL1 | 14474 | -0.13 | 0.097 | NO |
| 53 | JAG2 | JAG2 | JAG2 | 14639 | -0.14 | 0.096 | NO |
| 54 | CBL | CBL | CBL | 14816 | -0.15 | 0.096 | NO |
| 55 | RBPJ | RBPJ | RBPJ | 15050 | -0.16 | 0.093 | NO |
| 56 | MYCBP | MYCBP | MYCBP | 16716 | -0.27 | 0.021 | NO |
| 57 | DLL3 | DLL3 | DLL3 | 18086 | -0.48 | -0.023 | NO |
| 58 | NEURL | NEURL | NEURL | 18172 | -0.5 | 0.0026 | NO |
| 59 | PTCRA | PTCRA | PTCRA | 18819 | -0.74 | 0.012 | NO |
Figure S75. Get High-res Image This plot shows mRNAseq_cNMF expression data heatmap (on the left) a RunningEnrichmentScore(RES) plot (on the top right) and a Signal2Noise(S2N) plot (on the bottom right) of genes in the pathway: PID EPHBFWDPATHWAY.
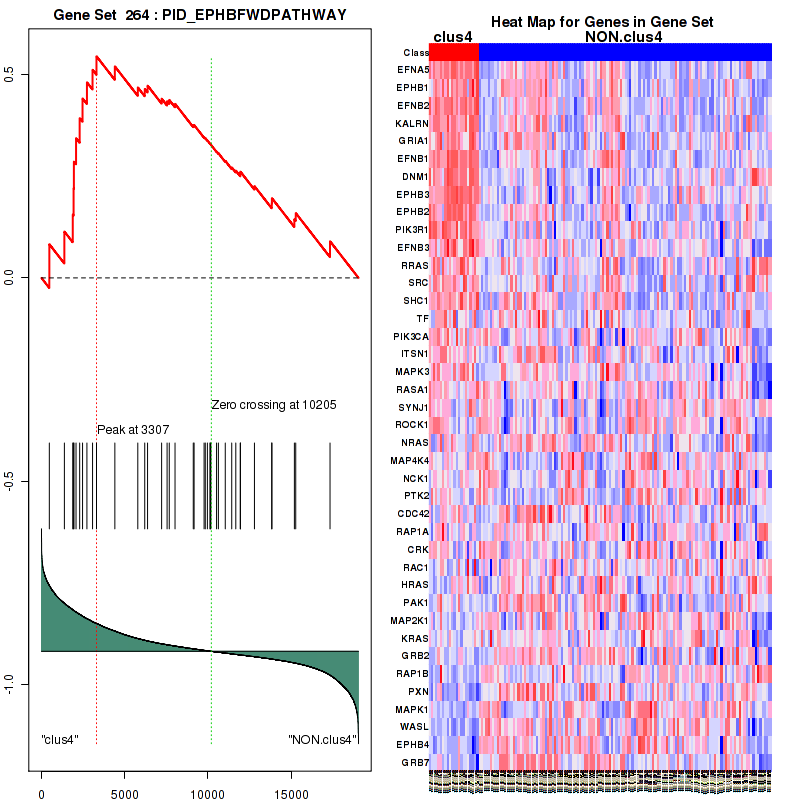
Figure S76. Get High-res Image For the top 5 core enriched genes in the pathway: PID EPHBFWDPATHWAY, this volcano plot shows how much they are up/down-regulated and significant. The significance was calculated by empirical bayesian fit

Table S39. Get Full Table This table shows a Running Enrichment Score (RES) of each gene in this pathway, that is, the enrichment score at this point in the ranked list of genes. All genes are ranked by Signal-to-Noise (S2N), a measure of similarity as default and are used to obtain ES matrix of all genes. In this way, GSEA tool uses expression pattern of not only overlapped genes but also not-overlapped genes to produce ES matrix.
| Rank | GENE | SYMBOL | DESC | LIST.LOC | S2N | RES | CORE_ENRICHMENT |
|---|---|---|---|---|---|---|---|
| 1 | CAMK2B | CAMK2B | CAMK2B | 232 | 1 | 0.028 | YES |
| 2 | NTF3 | NTF3 | NTF3 | 344 | 0.98 | 0.059 | YES |
| 3 | NTRK2 | NTRK2 | NTRK2 | 380 | 0.97 | 0.094 | YES |
| 4 | NGF | NGF | NGF | 468 | 0.93 | 0.12 | YES |
| 5 | MAPK10 | MAPK10 | MAPK10 | 581 | 0.88 | 0.15 | YES |
| 6 | CALML3 | CALML3 | CALML3 | 646 | 0.86 | 0.18 | YES |
| 7 | NTF4 | NTF4 | NTF4 | 1350 | 0.68 | 0.17 | YES |
| 8 | SHC4 | SHC4 | SHC4 | 1609 | 0.63 | 0.18 | YES |
| 9 | CALML5 | CALML5 | CALML5 | 1740 | 0.61 | 0.2 | YES |
| 10 | IRS1 | IRS1 | IRS1 | 1771 | 0.61 | 0.22 | YES |
| 11 | JUN | JUN | JUN | 1877 | 0.59 | 0.24 | YES |
| 12 | BCL2 | BCL2 | BCL2 | 2185 | 0.54 | 0.24 | YES |
| 13 | NTRK1 | NTRK1 | NTRK1 | 2205 | 0.54 | 0.26 | YES |
| 14 | CAMK2A | CAMK2A | CAMK2A | 2321 | 0.52 | 0.27 | YES |
| 15 | TP73 | TP73 | TP73 | 2512 | 0.49 | 0.28 | YES |
| 16 | RPS6KA2 | RPS6KA2 | RPS6KA2 | 2967 | 0.43 | 0.27 | YES |
| 17 | NGFR | NGFR | NGFR | 3062 | 0.42 | 0.28 | YES |
| 18 | SHC2 | SHC2 | SHC2 | 3068 | 0.42 | 0.3 | YES |
| 19 | PIK3R1 | PIK3R1 | PIK3R1 | 3070 | 0.42 | 0.32 | YES |
| 20 | IRAK3 | IRAK3 | IRAK3 | 3201 | 0.4 | 0.32 | YES |
| 21 | NGFRAP1 | NGFRAP1 | NGFRAP1 | 3486 | 0.38 | 0.32 | YES |
| 22 | RPS6KA6 | RPS6KA6 | RPS6KA6 | 3671 | 0.35 | 0.33 | YES |
| 23 | SOS2 | SOS2 | SOS2 | 3715 | 0.35 | 0.34 | YES |
| 24 | CAMK4 | CAMK4 | CAMK4 | 3736 | 0.35 | 0.35 | YES |
| 25 | IRS4 | IRS4 | IRS4 | 3741 | 0.34 | 0.36 | YES |
| 26 | AKT3 | AKT3 | AKT3 | 3822 | 0.34 | 0.37 | YES |
| 27 | MAGED1 | MAGED1 | MAGED1 | 3849 | 0.34 | 0.38 | YES |
| 28 | KIDINS220 | KIDINS220 | KIDINS220 | 3958 | 0.32 | 0.39 | YES |
| 29 | IRS2 | IRS2 | IRS2 | 3965 | 0.32 | 0.4 | YES |
| 30 | BDNF | BDNF | BDNF | 4090 | 0.31 | 0.41 | YES |
| 31 | BAD | BAD | BAD | 4447 | 0.28 | 0.4 | NO |
| 32 | MAPK13 | MAPK13 | MAPK13 | 4903 | 0.24 | 0.38 | NO |
| 33 | SHC3 | SHC3 | SHC3 | 5074 | 0.23 | 0.38 | NO |
| 34 | CAMK2D | CAMK2D | CAMK2D | 5160 | 0.22 | 0.39 | NO |
| 35 | GAB1 | GAB1 | GAB1 | 5237 | 0.22 | 0.39 | NO |
| 36 | FOXO3 | FOXO3 | FOXO3 | 5668 | 0.19 | 0.38 | NO |
| 37 | NFKB1 | NFKB1 | NFKB1 | 5784 | 0.18 | 0.38 | NO |
| 38 | SHC1 | SHC1 | SHC1 | 6206 | 0.16 | 0.36 | NO |
| 39 | MAPK14 | MAPK14 | MAPK14 | 6350 | 0.15 | 0.36 | NO |
| 40 | AKT1 | AKT1 | AKT1 | 6362 | 0.15 | 0.36 | NO |
| 41 | MAPK8 | MAPK8 | MAPK8 | 6435 | 0.14 | 0.36 | NO |
| 42 | MAPKAPK2 | MAPKAPK2 | MAPKAPK2 | 6596 | 0.13 | 0.36 | NO |
| 43 | ABL1 | ABL1 | ABL1 | 6622 | 0.13 | 0.36 | NO |
| 44 | RELA | RELA | RELA | 6847 | 0.12 | 0.36 | NO |
| 45 | MAP3K3 | MAP3K3 | MAP3K3 | 6970 | 0.12 | 0.36 | NO |
| 46 | SOS1 | SOS1 | SOS1 | 7134 | 0.11 | 0.35 | NO |
| 47 | PIK3CA | PIK3CA | PIK3CA | 7220 | 0.11 | 0.35 | NO |
| 48 | FRS2 | FRS2 | FRS2 | 7255 | 0.1 | 0.35 | NO |
| 49 | RPS6KA3 | RPS6KA3 | RPS6KA3 | 7294 | 0.1 | 0.36 | NO |
| 50 | MAPK7 | MAPK7 | MAPK7 | 7380 | 0.099 | 0.35 | NO |
| 51 | MAPK3 | MAPK3 | MAPK3 | 7678 | 0.087 | 0.34 | NO |
| 52 | SH2B1 | SH2B1 | SH2B1 | 7846 | 0.081 | 0.34 | NO |
| 53 | IKBKB | IKBKB | IKBKB | 7940 | 0.078 | 0.33 | NO |
| 54 | AKT2 | AKT2 | AKT2 | 8051 | 0.074 | 0.33 | NO |
| 55 | MAPK11 | MAPK11 | MAPK11 | 8090 | 0.072 | 0.33 | NO |
| 56 | IRAK4 | IRAK4 | IRAK4 | 8153 | 0.07 | 0.33 | NO |
| 57 | TP53 | TP53 | TP53 | 8496 | 0.057 | 0.32 | NO |
| 58 | ARHGDIA | ARHGDIA | ARHGDIA | 8617 | 0.052 | 0.31 | NO |
| 59 | CAMK2G | CAMK2G | CAMK2G | 8691 | 0.05 | 0.31 | NO |
| 60 | IRAK2 | IRAK2 | IRAK2 | 8733 | 0.048 | 0.31 | NO |
| 61 | RPS6KA4 | RPS6KA4 | RPS6KA4 | 8788 | 0.047 | 0.31 | NO |
| 62 | MAPK9 | MAPK9 | MAPK9 | 8804 | 0.046 | 0.31 | NO |
| 63 | PLCG1 | PLCG1 | PLCG1 | 8857 | 0.045 | 0.31 | NO |
| 64 | CALM3 | CALM3 | CALM3 | 8952 | 0.041 | 0.3 | NO |
| 65 | PRDM4 | PRDM4 | PRDM4 | 8965 | 0.041 | 0.3 | NO |
| 66 | YWHAQ | YWHAQ | YWHAQ | 9250 | 0.032 | 0.29 | NO |
| 67 | GSK3B | GSK3B | GSK3B | 9279 | 0.03 | 0.29 | NO |
| 68 | PIK3R2 | PIK3R2 | PIK3R2 | 9302 | 0.03 | 0.29 | NO |
| 69 | IRAK1 | IRAK1 | IRAK1 | 9385 | 0.027 | 0.29 | NO |
| 70 | RPS6KA5 | RPS6KA5 | RPS6KA5 | 9626 | 0.018 | 0.28 | NO |
| 71 | CALM1 | CALM1 | CALM1 | 9661 | 0.018 | 0.27 | NO |
| 72 | SORT1 | SORT1 | SORT1 | 9756 | 0.014 | 0.27 | NO |
| 73 | NRAS | NRAS | NRAS | 9770 | 0.014 | 0.27 | NO |
| 74 | PTPN11 | PTPN11 | PTPN11 | 9913 | 0.0095 | 0.26 | NO |
| 75 | YWHAZ | YWHAZ | YWHAZ | 10131 | 0.0021 | 0.25 | NO |
| 76 | PIK3R3 | PIK3R3 | PIK3R3 | 10153 | 0.0015 | 0.25 | NO |
| 77 | CDC42 | CDC42 | CDC42 | 10156 | 0.0015 | 0.25 | NO |
| 78 | MAP2K5 | MAP2K5 | MAP2K5 | 10157 | 0.0014 | 0.25 | NO |
| 79 | RAP1A | RAP1A | RAP1A | 10179 | 0.00072 | 0.25 | NO |
| 80 | MAP3K5 | MAP3K5 | MAP3K5 | 10316 | -0.0036 | 0.24 | NO |
| 81 | NTRK3 | NTRK3 | NTRK3 | 10319 | -0.0037 | 0.24 | NO |
| 82 | ATF4 | ATF4 | ATF4 | 10342 | -0.0045 | 0.24 | NO |
| 83 | ARHGDIB | ARHGDIB | ARHGDIB | 10389 | -0.0059 | 0.24 | NO |
| 84 | RHOA | RHOA | RHOA | 10396 | -0.0062 | 0.24 | NO |
| 85 | CRK | CRK | CRK | 10521 | -0.0099 | 0.23 | NO |
| 86 | RAC1 | RAC1 | RAC1 | 10632 | -0.013 | 0.23 | NO |
| 87 | ZNF274 | ZNF274 | ZNF274 | 11004 | -0.024 | 0.21 | NO |
| 88 | HRAS | HRAS | HRAS | 11044 | -0.025 | 0.21 | NO |
| 89 | CALML6 | CALML6 | CALML6 | 11071 | -0.026 | 0.21 | NO |
| 90 | PRKCD | PRKCD | PRKCD | 11112 | -0.027 | 0.21 | NO |
| 91 | SH2B3 | SH2B3 | SH2B3 | 11210 | -0.03 | 0.2 | NO |
| 92 | MAP3K1 | MAP3K1 | MAP3K1 | 11421 | -0.036 | 0.19 | NO |
| 93 | TRAF6 | TRAF6 | TRAF6 | 11508 | -0.038 | 0.19 | NO |
| 94 | YWHAH | YWHAH | YWHAH | 11617 | -0.042 | 0.18 | NO |
| 95 | RAF1 | RAF1 | RAF1 | 11649 | -0.043 | 0.18 | NO |
| 96 | MAP2K1 | MAP2K1 | MAP2K1 | 11675 | -0.044 | 0.18 | NO |
| 97 | NFKBIA | NFKBIA | NFKBIA | 11732 | -0.045 | 0.18 | NO |
| 98 | CRKL | CRKL | CRKL | 11881 | -0.049 | 0.18 | NO |
| 99 | KRAS | KRAS | KRAS | 11950 | -0.051 | 0.18 | NO |
| 100 | GRB2 | GRB2 | GRB2 | 11951 | -0.051 | 0.18 | NO |
| 101 | MAP2K7 | MAP2K7 | MAP2K7 | 12132 | -0.056 | 0.17 | NO |
| 102 | PSEN1 | PSEN1 | PSEN1 | 12155 | -0.057 | 0.17 | NO |
| 103 | CALM2 | CALM2 | CALM2 | 12235 | -0.059 | 0.17 | NO |
| 104 | MAP2K2 | MAP2K2 | MAP2K2 | 12254 | -0.06 | 0.17 | NO |
| 105 | RIPK2 | RIPK2 | RIPK2 | 12376 | -0.064 | 0.17 | NO |
| 106 | YWHAE | YWHAE | YWHAE | 12635 | -0.071 | 0.16 | NO |
| 107 | RAP1B | RAP1B | RAP1B | 12797 | -0.076 | 0.15 | NO |
| 108 | YWHAB | YWHAB | YWHAB | 13020 | -0.082 | 0.14 | NO |
| 109 | PDK1 | PDK1 | PDK1 | 13731 | -0.11 | 0.11 | NO |
| 110 | MAPK1 | MAPK1 | MAPK1 | 13847 | -0.11 | 0.11 | NO |
| 111 | PLCG2 | PLCG2 | PLCG2 | 14456 | -0.13 | 0.079 | NO |
| 112 | YWHAG | YWHAG | YWHAG | 14597 | -0.14 | 0.077 | NO |
| 113 | CSK | CSK | CSK | 14599 | -0.14 | 0.082 | NO |
| 114 | RAPGEF1 | RAPGEF1 | RAPGEF1 | 14953 | -0.15 | 0.07 | NO |
| 115 | NFKBIE | NFKBIE | NFKBIE | 15051 | -0.16 | 0.07 | NO |
| 116 | RPS6KA1 | RPS6KA1 | RPS6KA1 | 15383 | -0.17 | 0.06 | NO |
| 117 | BAX | BAX | BAX | 15903 | -0.2 | 0.04 | NO |
| 118 | PIK3CB | PIK3CB | PIK3CB | 15904 | -0.2 | 0.047 | NO |
| 119 | BRAF | BRAF | BRAF | 16029 | -0.21 | 0.049 | NO |
| 120 | MAPK12 | MAPK12 | MAPK12 | 16788 | -0.27 | 0.019 | NO |
| 121 | PIK3CG | PIK3CG | PIK3CG | 16995 | -0.29 | 0.019 | NO |
| 122 | NFKBIB | NFKBIB | NFKBIB | 17123 | -0.31 | 0.024 | NO |
| 123 | PIK3R5 | PIK3R5 | PIK3R5 | 17810 | -0.42 | 0.0039 | NO |
| 124 | PIK3CD | PIK3CD | PIK3CD | 17828 | -0.42 | 0.019 | NO |
| 125 | FASLG | FASLG | FASLG | 18328 | -0.54 | 0.013 | NO |
| 126 | SH2B2 | SH2B2 | SH2B2 | 18674 | -0.66 | 0.02 | NO |
Figure S77. Get High-res Image This plot shows mRNAseq_cNMF expression data heatmap (on the left) a RunningEnrichmentScore(RES) plot (on the top right) and a Signal2Noise(S2N) plot (on the bottom right) of genes in the pathway: PID PS1PATHWAY.

Figure S78. Get High-res Image For the top 5 core enriched genes in the pathway: PID PS1PATHWAY, this volcano plot shows how much they are up/down-regulated and significant. The significance was calculated by empirical bayesian fit

Table S40. Get Full Table This table shows a Running Enrichment Score (RES) of each gene in this pathway, that is, the enrichment score at this point in the ranked list of genes. All genes are ranked by Signal-to-Noise (S2N), a measure of similarity as default and are used to obtain ES matrix of all genes. In this way, GSEA tool uses expression pattern of not only overlapped genes but also not-overlapped genes to produce ES matrix.
| Rank | GENE | SYMBOL | DESC | LIST.LOC | S2N | RES | CORE_ENRICHMENT |
|---|---|---|---|---|---|---|---|
| 1 | SSPO | SSPO | SSPO | 203 | 1.1 | 0.12 | YES |
| 2 | GLI3 | GLI3 | GLI3 | 328 | 0.99 | 0.24 | YES |
| 3 | SHH | SHH | SHH | 2214 | 0.53 | 0.21 | YES |
| 4 | GNAI1 | GNAI1 | GNAI1 | 3066 | 0.42 | 0.22 | YES |
| 5 | SPOP | SPOP | SPOP | 3510 | 0.37 | 0.24 | YES |
| 6 | RAB23 | RAB23 | RAB23 | 3744 | 0.34 | 0.27 | YES |
| 7 | FOXA2 | FOXA2 | FOXA2 | 3854 | 0.34 | 0.31 | YES |
| 8 | GLI2 | GLI2 | GLI2 | 4492 | 0.28 | 0.31 | YES |
| 9 | SMO | SMO | SMO | 4615 | 0.27 | 0.33 | YES |
| 10 | GNAZ | GNAZ | GNAZ | 4689 | 0.26 | 0.36 | YES |
| 11 | GNG2 | GNG2 | GNG2 | 4829 | 0.25 | 0.39 | YES |
| 12 | SUFU | SUFU | SUFU | 4920 | 0.24 | 0.41 | YES |
| 13 | IFT88 | IFT88 | IFT88 | 5534 | 0.2 | 0.4 | YES |
| 14 | RBBP7 | RBBP7 | RBBP7 | 5825 | 0.18 | 0.41 | YES |
| 15 | AKT1 | AKT1 | AKT1 | 6362 | 0.15 | 0.4 | YES |
| 16 | PRKACA | PRKACA | PRKACA | 6368 | 0.15 | 0.42 | YES |
| 17 | GNAO1 | GNAO1 | GNAO1 | 6708 | 0.13 | 0.42 | YES |
| 18 | SAP30 | SAP30 | SAP30 | 6725 | 0.13 | 0.43 | YES |
| 19 | LGALS3 | LGALS3 | LGALS3 | 6862 | 0.12 | 0.44 | YES |
| 20 | CREBBP | CREBBP | CREBBP | 7820 | 0.082 | 0.4 | NO |
| 21 | PTCH1 | PTCH1 | PTCH1 | 8076 | 0.073 | 0.4 | NO |
| 22 | FBXW11 | FBXW11 | FBXW11 | 8379 | 0.061 | 0.39 | NO |
| 23 | GNAI2 | GNAI2 | GNAI2 | 8616 | 0.052 | 0.38 | NO |
| 24 | CSNK1G2 | CSNK1G2 | CSNK1G2 | 8624 | 0.052 | 0.39 | NO |
| 25 | GLI1 | GLI1 | GLI1 | 8757 | 0.048 | 0.39 | NO |
| 26 | CSNK1G1 | CSNK1G1 | CSNK1G1 | 8822 | 0.046 | 0.39 | NO |
| 27 | MTSS1 | MTSS1 | MTSS1 | 9015 | 0.039 | 0.38 | NO |
| 28 | GSK3B | GSK3B | GSK3B | 9279 | 0.03 | 0.38 | NO |
| 29 | SIN3B | SIN3B | SIN3B | 9285 | 0.03 | 0.38 | NO |
| 30 | CSNK1G3 | CSNK1G3 | CSNK1G3 | 9340 | 0.028 | 0.38 | NO |
| 31 | GNB1 | GNB1 | GNB1 | 9357 | 0.028 | 0.38 | NO |
| 32 | GNAI3 | GNAI3 | GNAI3 | 9709 | 0.016 | 0.36 | NO |
| 33 | CSNK1A1 | CSNK1A1 | CSNK1A1 | 10194 | 0.00041 | 0.34 | NO |
| 34 | HDAC2 | HDAC2 | HDAC2 | 10360 | -0.0051 | 0.33 | NO |
| 35 | RBBP4 | RBBP4 | RBBP4 | 10465 | -0.0083 | 0.33 | NO |
| 36 | CSNK1D | CSNK1D | CSNK1D | 10477 | -0.0084 | 0.33 | NO |
| 37 | STK36 | STK36 | STK36 | 10487 | -0.0087 | 0.33 | NO |
| 38 | PRKCD | PRKCD | PRKCD | 11112 | -0.027 | 0.3 | NO |
| 39 | HDAC1 | HDAC1 | HDAC1 | 11553 | -0.04 | 0.28 | NO |
| 40 | MAP2K1 | MAP2K1 | MAP2K1 | 11675 | -0.044 | 0.28 | NO |
| 41 | CSNK1E | CSNK1E | CSNK1E | 12146 | -0.056 | 0.26 | NO |
| 42 | PIAS1 | PIAS1 | PIAS1 | 12385 | -0.064 | 0.26 | NO |
| 43 | SIN3A | SIN3A | SIN3A | 12413 | -0.064 | 0.26 | NO |
| 44 | KIF3A | KIF3A | KIF3A | 13433 | -0.096 | 0.22 | NO |
| 45 | XPO1 | XPO1 | XPO1 | 14211 | -0.12 | 0.2 | NO |
| 46 | SAP18 | SAP18 | SAP18 | 14707 | -0.14 | 0.19 | NO |
| 47 | ARRB2 | ARRB2 | ARRB2 | 14722 | -0.14 | 0.21 | NO |
| 48 | IFT172 | IFT172 | IFT172 | 15476 | -0.18 | 0.19 | NO |
Figure S79. Get High-res Image This plot shows mRNAseq_cNMF expression data heatmap (on the left) a RunningEnrichmentScore(RES) plot (on the top right) and a Signal2Noise(S2N) plot (on the bottom right) of genes in the pathway: PID P75NTRPATHWAY.

Figure S80. Get High-res Image For the top 5 core enriched genes in the pathway: PID P75NTRPATHWAY, this volcano plot shows how much they are up/down-regulated and significant. The significance was calculated by empirical bayesian fit

For the top enriched genes, if you want to check whether they are
-
up-regulated, please check the list of up-regulated genes
-
down-regulated, please check the list of down-regulated genes
For the top enriched genes, if you want to check whether they are
-
highly expressed genes, please check the list of high (top 30%) expressed genes
-
low expressed genes, please check the list of low (bottom 30%) expressed genes
An expression pattern of top(30%)/middle(30%)/low(30%) in this subtype against other subtypes is available in a heatmap
For the top enriched genes, if you want to check whether they are
-
significantly differently expressed genes by eBayes lm fit, please check the list of significant genes
Table 7. Get Full Table This table shows top 10 pathways which are significantly enriched in cluster clus5. It displays only significant gene sets satisfying nom.p.val.threshold (-1), fwer.p.val.threshold (-1) , fdr.q.val.threshold (0.25) and the default table is sorted by Normalized Enrichment Score (NES). Further details on NES statistics, please visit The Broad GSEA website.
| GeneSet(GS) | Size(#genes) | genes.ES.table | ES | NES | NOM.p.val | FDR.q.val | FWER.p.val | Tag.. | Gene.. | Signal | FDR..median. | glob.p.val |
|---|---|---|---|---|---|---|---|---|---|---|---|---|
| KEGG GLYCOLYSIS GLUCONEOGENESIS | 61 | genes.ES.table | 0.49 | 1.5 | 0.04 | 1 | 0.96 | 0.18 | 0.089 | 0.16 | 0.83 | 0.44 |
| KEGG OXIDATIVE PHOSPHORYLATION | 115 | genes.ES.table | 0.49 | 1.7 | 0.072 | 1 | 0.78 | 0.82 | 0.44 | 0.46 | 0.67 | 0.39 |
| KEGG GLUTATHIONE METABOLISM | 49 | genes.ES.table | 0.53 | 1.6 | 0.015 | 1 | 0.86 | 0.47 | 0.31 | 0.33 | 0.59 | 0.37 |
| KEGG ETHER LIPID METABOLISM | 30 | genes.ES.table | 0.59 | 1.6 | 0.021 | 1 | 0.85 | 0.23 | 0.11 | 0.21 | 0.66 | 0.4 |
| KEGG PYRUVATE METABOLISM | 40 | genes.ES.table | 0.51 | 1.6 | 0.023 | 1 | 0.88 | 0.32 | 0.23 | 0.25 | 0.63 | 0.38 |
| KEGG PROPANOATE METABOLISM | 32 | genes.ES.table | 0.46 | 1.6 | 0.03 | 1 | 0.85 | 0.12 | 0.051 | 0.12 | 0.76 | 0.42 |
| KEGG VASOPRESSIN REGULATED WATER REABSORPTION | 44 | genes.ES.table | 0.47 | 1.7 | 0.01 | 1 | 0.72 | 0.11 | 0.081 | 0.1 | 0.64 | 0.38 |
| KEGG PARKINSONS DISEASE | 113 | genes.ES.table | 0.47 | 1.7 | 0.04 | 1 | 0.59 | 0.66 | 0.38 | 0.41 | 1 | 0.53 |
| KEGG PRION DISEASES | 35 | genes.ES.table | 0.51 | 1.5 | 0.046 | 1 | 0.95 | 0.2 | 0.1 | 0.18 | 0.97 | 0.49 |
| KEGG PATHOGENIC ESCHERICHIA COLI INFECTION | 53 | genes.ES.table | 0.47 | 1.7 | 0.0043 | 1 | 0.6 | 0.23 | 0.17 | 0.19 | 0.61 | 0.36 |
Table S41. Get Full Table This table shows a Running Enrichment Score (RES) of each gene in this pathway, that is, the enrichment score at this point in the ranked list of genes. All genes are ranked by Signal-to-Noise (S2N), a measure of similarity as default and are used to obtain ES matrix of all genes. In this way, GSEA tool uses expression pattern of not only overlapped genes but also not-overlapped genes to produce ES matrix.
| Rank | GENE | SYMBOL | DESC | LIST.LOC | S2N | RES | CORE_ENRICHMENT |
|---|---|---|---|---|---|---|---|
| 1 | COX7A1 | COX7A1 | COX7A1 | 601 | 0.46 | 0.0084 | YES |
| 2 | PARK2 | PARK2 | PARK2 | 661 | 0.44 | 0.044 | YES |
| 3 | COX7B2 | COX7B2 | COX7B2 | 892 | 0.4 | 0.066 | YES |
| 4 | TH | TH | TH | 1029 | 0.37 | 0.092 | YES |
| 5 | COX6B2 | COX6B2 | COX6B2 | 1138 | 0.36 | 0.12 | YES |
| 6 | SLC25A31 | SLC25A31 | SLC25A31 | 1196 | 0.35 | 0.14 | YES |
| 7 | COX8C | COX8C | COX8C | 1200 | 0.35 | 0.18 | YES |
| 8 | COX4I2 | COX4I2 | COX4I2 | 1728 | 0.29 | 0.17 | YES |
| 9 | COX6A2 | COX6A2 | COX6A2 | 3192 | 0.18 | 0.11 | YES |
| 10 | SLC25A4 | SLC25A4 | SLC25A4 | 3224 | 0.18 | 0.12 | YES |
| 11 | NDUFS4 | NDUFS4 | NDUFS4 | 3586 | 0.16 | 0.12 | YES |
| 12 | UBE2L6 | UBE2L6 | UBE2L6 | 3598 | 0.16 | 0.13 | YES |
| 13 | NDUFA3 | NDUFA3 | NDUFA3 | 3882 | 0.14 | 0.13 | YES |
| 14 | NDUFB2 | NDUFB2 | NDUFB2 | 3938 | 0.14 | 0.14 | YES |
| 15 | NDUFC1 | NDUFC1 | NDUFC1 | 3990 | 0.14 | 0.15 | YES |
| 16 | NDUFB1 | NDUFB1 | NDUFB1 | 3998 | 0.14 | 0.16 | YES |
| 17 | NDUFA2 | NDUFA2 | NDUFA2 | 4158 | 0.13 | 0.16 | YES |
| 18 | NDUFV2 | NDUFV2 | NDUFV2 | 4309 | 0.13 | 0.17 | YES |
| 19 | NDUFB9 | NDUFB9 | NDUFB9 | 4343 | 0.13 | 0.18 | YES |
| 20 | NDUFS7 | NDUFS7 | NDUFS7 | 4365 | 0.12 | 0.18 | YES |
| 21 | ATP5H | ATP5H | ATP5H | 4372 | 0.12 | 0.2 | YES |
| 22 | NDUFAB1 | NDUFAB1 | NDUFAB1 | 4390 | 0.12 | 0.2 | YES |
| 23 | UQCRQ | UQCRQ | UQCRQ | 4485 | 0.12 | 0.21 | YES |
| 24 | NDUFS6 | NDUFS6 | NDUFS6 | 4493 | 0.12 | 0.22 | YES |
| 25 | COX6C | COX6C | COX6C | 4516 | 0.12 | 0.23 | YES |
| 26 | PINK1 | PINK1 | PINK1 | 4519 | 0.12 | 0.24 | YES |
| 27 | UQCR11 | UQCR11 | UQCR11 | 4541 | 0.12 | 0.25 | YES |
| 28 | ATP5D | ATP5D | ATP5D | 4625 | 0.12 | 0.26 | YES |
| 29 | NDUFA8 | NDUFA8 | NDUFA8 | 4711 | 0.12 | 0.26 | YES |
| 30 | COX7A2 | COX7A2 | COX7A2 | 4736 | 0.11 | 0.27 | YES |
| 31 | NDUFC2 | NDUFC2 | NDUFC2 | 4744 | 0.11 | 0.28 | YES |
| 32 | NDUFB7 | NDUFB7 | NDUFB7 | 4789 | 0.11 | 0.29 | YES |
| 33 | NDUFB6 | NDUFB6 | NDUFB6 | 4827 | 0.11 | 0.3 | YES |
| 34 | COX5B | COX5B | COX5B | 4842 | 0.11 | 0.3 | YES |
| 35 | NDUFS8 | NDUFS8 | NDUFS8 | 4860 | 0.11 | 0.31 | YES |
| 36 | GPR37 | GPR37 | GPR37 | 4868 | 0.11 | 0.32 | YES |
| 37 | COX7C | COX7C | COX7C | 4872 | 0.11 | 0.33 | YES |
| 38 | UQCRHL | UQCRHL | UQCRHL | 4878 | 0.11 | 0.34 | YES |
| 39 | CYCS | CYCS | CYCS | 4916 | 0.11 | 0.35 | YES |
| 40 | COX5A | COX5A | COX5A | 4955 | 0.11 | 0.36 | YES |
| 41 | NDUFS3 | NDUFS3 | NDUFS3 | 5105 | 0.1 | 0.36 | YES |
| 42 | SDHB | SDHB | SDHB | 5167 | 0.1 | 0.36 | YES |
| 43 | NDUFA5 | NDUFA5 | NDUFA5 | 5339 | 0.098 | 0.36 | YES |
| 44 | UCHL1 | UCHL1 | UCHL1 | 5399 | 0.097 | 0.37 | YES |
| 45 | NDUFB10 | NDUFB10 | NDUFB10 | 5437 | 0.096 | 0.37 | YES |
| 46 | UQCRH | UQCRH | UQCRH | 5513 | 0.094 | 0.38 | YES |
| 47 | SDHA | SDHA | SDHA | 5728 | 0.089 | 0.37 | YES |
| 48 | NDUFB3 | NDUFB3 | NDUFB3 | 5851 | 0.086 | 0.38 | YES |
| 49 | ATP5E | ATP5E | ATP5E | 5870 | 0.086 | 0.38 | YES |
| 50 | NDUFA1 | NDUFA1 | NDUFA1 | 5957 | 0.084 | 0.38 | YES |
| 51 | COX8A | COX8A | COX8A | 6022 | 0.083 | 0.39 | YES |
| 52 | COX6A1 | COX6A1 | COX6A1 | 6067 | 0.082 | 0.39 | YES |
| 53 | PARK7 | PARK7 | PARK7 | 6087 | 0.082 | 0.4 | YES |
| 54 | NDUFA4 | NDUFA4 | NDUFA4 | 6093 | 0.082 | 0.41 | YES |
| 55 | COX4I1 | COX4I1 | COX4I1 | 6163 | 0.08 | 0.41 | YES |
| 56 | NDUFA7 | NDUFA7 | NDUFA7 | 6185 | 0.08 | 0.42 | YES |
| 57 | NDUFS5 | NDUFS5 | NDUFS5 | 6192 | 0.079 | 0.42 | YES |
| 58 | UQCRFS1 | UQCRFS1 | UQCRFS1 | 6273 | 0.078 | 0.42 | YES |
| 59 | HTRA2 | HTRA2 | HTRA2 | 6324 | 0.077 | 0.43 | YES |
| 60 | UBB | UBB | UBB | 6348 | 0.076 | 0.43 | YES |
| 61 | NDUFB8 | NDUFB8 | NDUFB8 | 6353 | 0.076 | 0.44 | YES |
| 62 | UBA7 | UBA7 | UBA7 | 6371 | 0.076 | 0.45 | YES |
| 63 | SLC25A6 | SLC25A6 | SLC25A6 | 6480 | 0.074 | 0.45 | YES |
| 64 | ATP5O | ATP5O | ATP5O | 6512 | 0.073 | 0.45 | YES |
| 65 | COX6B1 | COX6B1 | COX6B1 | 6544 | 0.072 | 0.46 | YES |
| 66 | SDHD | SDHD | SDHD | 6643 | 0.07 | 0.46 | YES |
| 67 | UQCRB | UQCRB | UQCRB | 6848 | 0.067 | 0.45 | YES |
| 68 | NDUFV1 | NDUFV1 | NDUFV1 | 6880 | 0.066 | 0.46 | YES |
| 69 | ATP5G3 | ATP5G3 | ATP5G3 | 6952 | 0.065 | 0.46 | YES |
| 70 | SLC25A5 | SLC25A5 | SLC25A5 | 6966 | 0.064 | 0.46 | YES |
| 71 | UBE2J2 | UBE2J2 | UBE2J2 | 7113 | 0.062 | 0.46 | YES |
| 72 | ATP5F1 | ATP5F1 | ATP5F1 | 7148 | 0.061 | 0.46 | YES |
| 73 | NDUFB5 | NDUFB5 | NDUFB5 | 7200 | 0.06 | 0.47 | YES |
| 74 | NDUFB4 | NDUFB4 | NDUFB4 | 7229 | 0.06 | 0.47 | YES |
| 75 | ATP5C1 | ATP5C1 | ATP5C1 | 7263 | 0.059 | 0.47 | YES |
| 76 | COX7B | COX7B | COX7B | 7454 | 0.056 | 0.47 | NO |
| 77 | NDUFA9 | NDUFA9 | NDUFA9 | 7627 | 0.053 | 0.46 | NO |
| 78 | UBE2J1 | UBE2J1 | UBE2J1 | 7631 | 0.053 | 0.47 | NO |
| 79 | UQCR10 | UQCR10 | UQCR10 | 7866 | 0.049 | 0.46 | NO |
| 80 | ATP5G1 | ATP5G1 | ATP5G1 | 7930 | 0.048 | 0.46 | NO |
| 81 | NDUFA10 | NDUFA10 | NDUFA10 | 7945 | 0.047 | 0.46 | NO |
| 82 | COX7A2L | COX7A2L | COX7A2L | 8032 | 0.046 | 0.46 | NO |
| 83 | ATP5A1 | ATP5A1 | ATP5A1 | 8177 | 0.043 | 0.46 | NO |
| 84 | ATP5J | ATP5J | ATP5J | 8212 | 0.043 | 0.46 | NO |
| 85 | NDUFA6 | NDUFA6 | NDUFA6 | 8281 | 0.041 | 0.46 | NO |
| 86 | VDAC3 | VDAC3 | VDAC3 | 8395 | 0.04 | 0.46 | NO |
| 87 | VDAC2 | VDAC2 | VDAC2 | 8479 | 0.038 | 0.46 | NO |
| 88 | CYC1 | CYC1 | CYC1 | 8510 | 0.038 | 0.46 | NO |
| 89 | NDUFV3 | NDUFV3 | NDUFV3 | 8615 | 0.036 | 0.46 | NO |
| 90 | ATP5B | ATP5B | ATP5B | 9326 | 0.025 | 0.42 | NO |
| 91 | UQCRC1 | UQCRC1 | UQCRC1 | 9606 | 0.021 | 0.41 | NO |
| 92 | NDUFS2 | NDUFS2 | NDUFS2 | 9617 | 0.021 | 0.41 | NO |
| 93 | ATP5G2 | ATP5G2 | ATP5G2 | 9669 | 0.02 | 0.41 | NO |
| 94 | UBE2L3 | UBE2L3 | UBE2L3 | 9968 | 0.015 | 0.4 | NO |
| 95 | PPID | PPID | PPID | 10008 | 0.015 | 0.4 | NO |
| 96 | UQCRC2 | UQCRC2 | UQCRC2 | 10011 | 0.015 | 0.4 | NO |
| 97 | SDHC | SDHC | SDHC | 10038 | 0.014 | 0.4 | NO |
| 98 | UBE2G1 | UBE2G1 | UBE2G1 | 10178 | 0.012 | 0.39 | NO |
| 99 | SLC6A3 | SLC6A3 | SLC6A3 | 10699 | 0.0034 | 0.36 | NO |
| 100 | VDAC1 | VDAC1 | VDAC1 | 11012 | -0.0014 | 0.35 | NO |
| 101 | CASP9 | CASP9 | CASP9 | 11443 | -0.008 | 0.32 | NO |
| 102 | LRRK2 | LRRK2 | LRRK2 | 11521 | -0.0091 | 0.32 | NO |
| 103 | CASP3 | CASP3 | CASP3 | 11790 | -0.014 | 0.31 | NO |
| 104 | NDUFS1 | NDUFS1 | NDUFS1 | 12252 | -0.021 | 0.28 | NO |
| 105 | UBA1 | UBA1 | UBA1 | 12872 | -0.033 | 0.26 | NO |
| 106 | UBE2G2 | UBE2G2 | UBE2G2 | 13515 | -0.044 | 0.22 | NO |
| 107 | NDUFA4L2 | NDUFA4L2 | NDUFA4L2 | 14313 | -0.06 | 0.19 | NO |
| 108 | SNCAIP | SNCAIP | SNCAIP | 14759 | -0.071 | 0.17 | NO |
| 109 | SEPT5 | SEPT5 | SEPT5 | 14889 | -0.075 | 0.17 | NO |
| 110 | SLC18A2 | SLC18A2 | SLC18A2 | 15265 | -0.085 | 0.16 | NO |
| 111 | SLC18A1 | SLC18A1 | SLC18A1 | 15387 | -0.089 | 0.16 | NO |
| 112 | APAF1 | APAF1 | APAF1 | 16007 | -0.11 | 0.14 | NO |
| 113 | SNCA | SNCA | SNCA | 18052 | -0.27 | 0.053 | NO |
Figure S81. Get High-res Image This plot shows mRNAseq_cNMF expression data heatmap (on the left) a RunningEnrichmentScore(RES) plot (on the top right) and a Signal2Noise(S2N) plot (on the bottom right) of genes in the pathway: KEGG GLYCOLYSIS GLUCONEOGENESIS.

Figure S82. Get High-res Image For the top 5 core enriched genes in the pathway: KEGG GLYCOLYSIS GLUCONEOGENESIS, this volcano plot shows how much they are up/down-regulated and significant. The significance was calculated by empirical bayesian fit

Table S42. Get Full Table This table shows a Running Enrichment Score (RES) of each gene in this pathway, that is, the enrichment score at this point in the ranked list of genes. All genes are ranked by Signal-to-Noise (S2N), a measure of similarity as default and are used to obtain ES matrix of all genes. In this way, GSEA tool uses expression pattern of not only overlapped genes but also not-overlapped genes to produce ES matrix.
| Rank | GENE | SYMBOL | DESC | LIST.LOC | S2N | RES | CORE_ENRICHMENT |
|---|---|---|---|---|---|---|---|
| 1 | TUBA3E | TUBA3E | TUBA3E | 231 | 0.62 | 0.085 | YES |
| 2 | TUBA3C | TUBA3C | TUBA3C | 349 | 0.55 | 0.16 | YES |
| 3 | TUBAL3 | TUBAL3 | TUBAL3 | 354 | 0.55 | 0.25 | YES |
| 4 | TUBA3D | TUBA3D | TUBA3D | 500 | 0.49 | 0.32 | YES |
| 5 | LY96 | LY96 | LY96 | 1333 | 0.33 | 0.33 | YES |
| 6 | TUBA8 | TUBA8 | TUBA8 | 1803 | 0.28 | 0.35 | YES |
| 7 | WAS | WAS | WAS | 1995 | 0.26 | 0.38 | YES |
| 8 | TLR5 | TLR5 | TLR5 | 2505 | 0.22 | 0.38 | YES |
| 9 | TUBB8 | TUBB8 | TUBB8 | 2570 | 0.22 | 0.42 | YES |
| 10 | TUBA4A | TUBA4A | TUBA4A | 2717 | 0.2 | 0.44 | YES |
| 11 | HCLS1 | HCLS1 | HCLS1 | 2793 | 0.2 | 0.47 | YES |
| 12 | CD14 | CD14 | CD14 | 3246 | 0.17 | 0.47 | YES |
| 13 | ARPC1B | ARPC1B | ARPC1B | 4697 | 0.12 | 0.41 | NO |
| 14 | PRKCA | PRKCA | PRKCA | 5555 | 0.093 | 0.38 | NO |
| 15 | TUBA1C | TUBA1C | TUBA1C | 5725 | 0.089 | 0.39 | NO |
| 16 | CLDN1 | CLDN1 | CLDN1 | 6014 | 0.083 | 0.39 | NO |
| 17 | ARPC5L | ARPC5L | ARPC5L | 6016 | 0.083 | 0.4 | NO |
| 18 | TLR4 | TLR4 | TLR4 | 6102 | 0.081 | 0.41 | NO |
| 19 | TUBB3 | TUBB3 | TUBB3 | 6146 | 0.08 | 0.42 | NO |
| 20 | ARPC3 | ARPC3 | ARPC3 | 6154 | 0.08 | 0.43 | NO |
| 21 | FYN | FYN | FYN | 6276 | 0.078 | 0.44 | NO |
| 22 | CTTN | CTTN | CTTN | 6985 | 0.064 | 0.41 | NO |
| 23 | ARPC2 | ARPC2 | ARPC2 | 7724 | 0.051 | 0.38 | NO |
| 24 | ARPC5 | ARPC5 | ARPC5 | 8060 | 0.045 | 0.37 | NO |
| 25 | TUBA1A | TUBA1A | TUBA1A | 8771 | 0.034 | 0.33 | NO |
| 26 | ARPC1A | ARPC1A | ARPC1A | 8800 | 0.033 | 0.34 | NO |
| 27 | ARPC4 | ARPC4 | ARPC4 | 9407 | 0.024 | 0.31 | NO |
| 28 | EZR | EZR | EZR | 9551 | 0.022 | 0.31 | NO |
| 29 | TUBA1B | TUBA1B | TUBA1B | 9603 | 0.021 | 0.31 | NO |
| 30 | ACTG1 | ACTG1 | ACTG1 | 9725 | 0.019 | 0.3 | NO |
| 31 | ACTB | ACTB | ACTB | 10174 | 0.012 | 0.28 | NO |
| 32 | CDC42 | CDC42 | CDC42 | 10278 | 0.01 | 0.28 | NO |
| 33 | WASL | WASL | WASL | 10283 | 0.01 | 0.28 | NO |
| 34 | NCK1 | NCK1 | NCK1 | 10671 | 0.0039 | 0.26 | NO |
| 35 | NCL | NCL | NCL | 10753 | 0.0026 | 0.26 | NO |
| 36 | NCK2 | NCK2 | NCK2 | 10761 | 0.0025 | 0.26 | NO |
| 37 | TUBB6 | TUBB6 | TUBB6 | 10839 | 0.0014 | 0.25 | NO |
| 38 | YWHAQ | YWHAQ | YWHAQ | 11073 | -0.0023 | 0.24 | NO |
| 39 | TUBB | TUBB | TUBB | 11286 | -0.0054 | 0.23 | NO |
| 40 | RHOA | RHOA | RHOA | 11294 | -0.0056 | 0.23 | NO |
| 41 | TUBB2B | TUBB2B | TUBB2B | 11477 | -0.0086 | 0.22 | NO |
| 42 | KRT18 | KRT18 | KRT18 | 11734 | -0.013 | 0.21 | NO |
| 43 | TUBB2A | TUBB2A | TUBB2A | 11943 | -0.016 | 0.2 | NO |
| 44 | ARHGEF2 | ARHGEF2 | ARHGEF2 | 12624 | -0.028 | 0.17 | NO |
| 45 | ITGB1 | ITGB1 | ITGB1 | 12709 | -0.03 | 0.17 | NO |
| 46 | TUBB1 | TUBB1 | TUBB1 | 13485 | -0.044 | 0.14 | NO |
| 47 | YWHAZ | YWHAZ | YWHAZ | 14141 | -0.057 | 0.11 | NO |
| 48 | ABL1 | ABL1 | ABL1 | 14851 | -0.074 | 0.085 | NO |
| 49 | ROCK1 | ROCK1 | ROCK1 | 15294 | -0.086 | 0.076 | NO |
| 50 | CTNNB1 | CTNNB1 | CTNNB1 | 15831 | -0.1 | 0.064 | NO |
| 51 | OCLN | OCLN | OCLN | 17181 | -0.18 | 0.02 | NO |
| 52 | ROCK2 | ROCK2 | ROCK2 | 17650 | -0.22 | 0.03 | NO |
| 53 | CDH1 | CDH1 | CDH1 | 18067 | -0.28 | 0.052 | NO |
Figure S83. Get High-res Image This plot shows mRNAseq_cNMF expression data heatmap (on the left) a RunningEnrichmentScore(RES) plot (on the top right) and a Signal2Noise(S2N) plot (on the bottom right) of genes in the pathway: KEGG OXIDATIVE PHOSPHORYLATION.

Figure S84. Get High-res Image For the top 5 core enriched genes in the pathway: KEGG OXIDATIVE PHOSPHORYLATION, this volcano plot shows how much they are up/down-regulated and significant. The significance was calculated by empirical bayesian fit
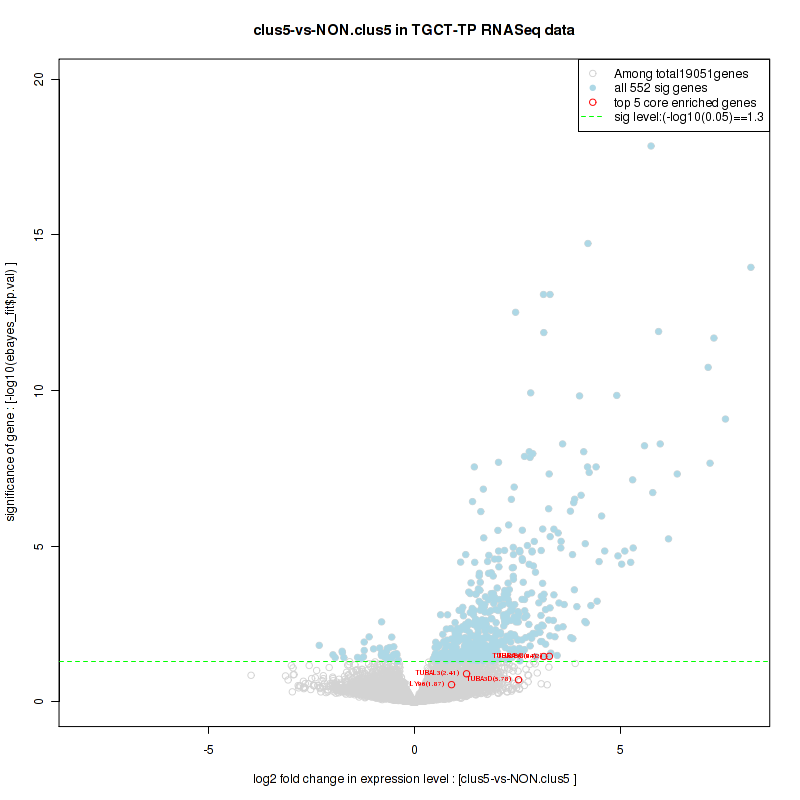
Table S43. Get Full Table This table shows a Running Enrichment Score (RES) of each gene in this pathway, that is, the enrichment score at this point in the ranked list of genes. All genes are ranked by Signal-to-Noise (S2N), a measure of similarity as default and are used to obtain ES matrix of all genes. In this way, GSEA tool uses expression pattern of not only overlapped genes but also not-overlapped genes to produce ES matrix.
| Rank | GENE | SYMBOL | DESC | LIST.LOC | S2N | RES | CORE_ENRICHMENT |
|---|---|---|---|---|---|---|---|
| 1 | PLA2G2A | PLA2G2A | PLA2G2A | 36 | 1.1 | 0.23 | YES |
| 2 | PLA2G5 | PLA2G5 | PLA2G5 | 103 | 0.82 | 0.39 | YES |
| 3 | PLA2G1B | PLA2G1B | PLA2G1B | 684 | 0.44 | 0.45 | YES |
| 4 | GPAT2 | GPAT2 | GPAT2 | 1114 | 0.36 | 0.5 | YES |
| 5 | PLA2G2D | PLA2G2D | PLA2G2D | 1179 | 0.35 | 0.56 | YES |
| 6 | PLA2G4A | PLA2G4A | PLA2G4A | 1492 | 0.31 | 0.61 | YES |
| 7 | AGPAT9 | AGPAT9 | AGPAT9 | 2710 | 0.21 | 0.59 | NO |
| 8 | PLA2G2F | PLA2G2F | PLA2G2F | 4201 | 0.13 | 0.54 | NO |
| 9 | AGPAT2 | AGPAT2 | AGPAT2 | 7265 | 0.059 | 0.39 | NO |
| 10 | PLA2G12A | PLA2G12A | PLA2G12A | 8001 | 0.046 | 0.36 | NO |
| 11 | LPCAT4 | LPCAT4 | LPCAT4 | 8447 | 0.039 | 0.34 | NO |
| 12 | AGPAT6 | AGPAT6 | AGPAT6 | 9168 | 0.028 | 0.31 | NO |
| 13 | GPD1L | GPD1L | GPD1L | 10057 | 0.014 | 0.26 | NO |
| 14 | PLD1 | PLD1 | PLD1 | 11020 | -0.0015 | 0.22 | NO |
| 15 | LPCAT1 | LPCAT1 | LPCAT1 | 11413 | -0.0075 | 0.2 | NO |
| 16 | AGPAT1 | AGPAT1 | AGPAT1 | 12154 | -0.02 | 0.16 | NO |
| 17 | GNPAT | GNPAT | GNPAT | 12253 | -0.021 | 0.16 | NO |
| 18 | LCLAT1 | LCLAT1 | LCLAT1 | 12403 | -0.024 | 0.16 | NO |
| 19 | AGPAT3 | AGPAT3 | AGPAT3 | 13258 | -0.04 | 0.12 | NO |
| 20 | AGPAT5 | AGPAT5 | AGPAT5 | 13486 | -0.044 | 0.12 | NO |
| 21 | PLD2 | PLD2 | PLD2 | 13620 | -0.046 | 0.12 | NO |
| 22 | PLA2G10 | PLA2G10 | PLA2G10 | 14542 | -0.066 | 0.084 | NO |
| 23 | GPAM | GPAM | GPAM | 16169 | -0.12 | 0.022 | NO |
| 24 | PLA2G4D | PLA2G4D | PLA2G4D | 16789 | -0.15 | 0.019 | NO |
| 25 | AGPAT4 | AGPAT4 | AGPAT4 | 17445 | -0.2 | 0.026 | NO |
| 26 | GPD1 | GPD1 | GPD1 | 18171 | -0.29 | 0.046 | NO |
Figure S85. Get High-res Image This plot shows mRNAseq_cNMF expression data heatmap (on the left) a RunningEnrichmentScore(RES) plot (on the top right) and a Signal2Noise(S2N) plot (on the bottom right) of genes in the pathway: KEGG GLUTATHIONE METABOLISM.
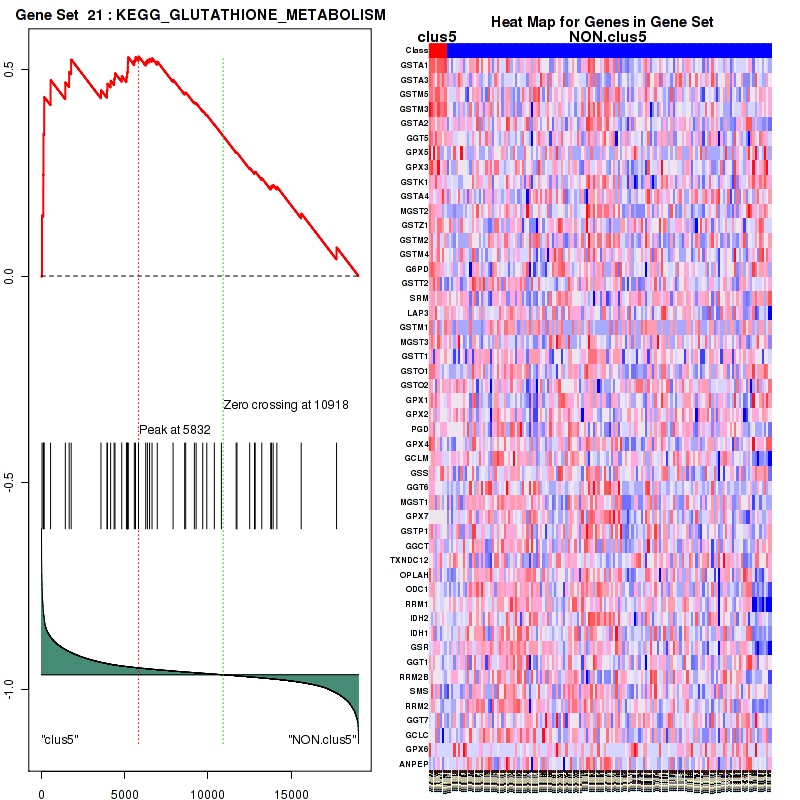
Figure S86. Get High-res Image For the top 5 core enriched genes in the pathway: KEGG GLUTATHIONE METABOLISM, this volcano plot shows how much they are up/down-regulated and significant. The significance was calculated by empirical bayesian fit

Table S44. Get Full Table This table shows a Running Enrichment Score (RES) of each gene in this pathway, that is, the enrichment score at this point in the ranked list of genes. All genes are ranked by Signal-to-Noise (S2N), a measure of similarity as default and are used to obtain ES matrix of all genes. In this way, GSEA tool uses expression pattern of not only overlapped genes but also not-overlapped genes to produce ES matrix.
| Rank | GENE | SYMBOL | DESC | LIST.LOC | S2N | RES | CORE_ENRICHMENT |
|---|---|---|---|---|---|---|---|
| 1 | AQP2 | AQP2 | AQP2 | 25 | 1.2 | 0.22 | YES |
| 2 | AQP4 | AQP4 | AQP4 | 203 | 0.65 | 0.32 | YES |
| 3 | AVPR2 | AVPR2 | AVPR2 | 362 | 0.54 | 0.41 | YES |
| 4 | AVP | AVP | AVP | 974 | 0.38 | 0.45 | YES |
| 5 | PRKACG | PRKACG | PRKACG | 1549 | 0.31 | 0.47 | YES |
| 6 | CREB3L1 | CREB3L1 | CREB3L1 | 2337 | 0.23 | 0.47 | NO |
| 7 | VAMP2 | VAMP2 | VAMP2 | 3322 | 0.17 | 0.45 | NO |
| 8 | AQP3 | AQP3 | AQP3 | 4079 | 0.14 | 0.43 | NO |
| 9 | ARHGDIB | ARHGDIB | ARHGDIB | 4839 | 0.11 | 0.41 | NO |
| 10 | STX4 | STX4 | STX4 | 5776 | 0.088 | 0.38 | NO |
| 11 | PRKACA | PRKACA | PRKACA | 6532 | 0.073 | 0.35 | NO |
| 12 | CREB3 | CREB3 | CREB3 | 6542 | 0.072 | 0.37 | NO |
| 13 | ADCY3 | ADCY3 | ADCY3 | 6761 | 0.068 | 0.37 | NO |
| 14 | DYNC2LI1 | DYNC2LI1 | DYNC2LI1 | 6805 | 0.067 | 0.38 | NO |
| 15 | CREB3L4 | CREB3L4 | CREB3L4 | 7514 | 0.055 | 0.35 | NO |
| 16 | DYNC1LI1 | DYNC1LI1 | DYNC1LI1 | 7637 | 0.053 | 0.35 | NO |
| 17 | ARHGDIA | ARHGDIA | ARHGDIA | 7860 | 0.049 | 0.35 | NO |
| 18 | DCTN5 | DCTN5 | DCTN5 | 8289 | 0.041 | 0.33 | NO |
| 19 | DCTN2 | DCTN2 | DCTN2 | 8524 | 0.038 | 0.33 | NO |
| 20 | DYNLL1 | DYNLL1 | DYNLL1 | 9048 | 0.029 | 0.31 | NO |
| 21 | DCTN6 | DCTN6 | DCTN6 | 9434 | 0.024 | 0.29 | NO |
| 22 | DYNC1I1 | DYNC1I1 | DYNC1I1 | 9822 | 0.018 | 0.27 | NO |
| 23 | DCTN1 | DCTN1 | DCTN1 | 9836 | 0.017 | 0.28 | NO |
| 24 | DYNLL2 | DYNLL2 | DYNLL2 | 9960 | 0.015 | 0.27 | NO |
| 25 | RAB5C | RAB5C | RAB5C | 10179 | 0.012 | 0.26 | NO |
| 26 | RAB11B | RAB11B | RAB11B | 10365 | 0.0087 | 0.25 | NO |
| 27 | PRKACB | PRKACB | PRKACB | 10454 | 0.0074 | 0.25 | NO |
| 28 | RAB11A | RAB11A | RAB11A | 10883 | 0.0006 | 0.23 | NO |
| 29 | NSF | NSF | NSF | 10915 | 0.000055 | 0.23 | NO |
| 30 | PRKX | PRKX | PRKX | 11110 | -0.003 | 0.22 | NO |
| 31 | DCTN4 | DCTN4 | DCTN4 | 11199 | -0.0044 | 0.21 | NO |
| 32 | GNAS | GNAS | GNAS | 11761 | -0.013 | 0.19 | NO |
| 33 | RAB5B | RAB5B | RAB5B | 11890 | -0.015 | 0.18 | NO |
| 34 | ADCY9 | ADCY9 | ADCY9 | 12931 | -0.034 | 0.13 | NO |
| 35 | RAB5A | RAB5A | RAB5A | 13377 | -0.042 | 0.12 | NO |
| 36 | DYNC1H1 | DYNC1H1 | DYNC1H1 | 13393 | -0.042 | 0.12 | NO |
| 37 | DYNC1I2 | DYNC1I2 | DYNC1I2 | 13824 | -0.05 | 0.11 | NO |
| 38 | DYNC2H1 | DYNC2H1 | DYNC2H1 | 14003 | -0.054 | 0.11 | NO |
| 39 | CREB3L2 | CREB3L2 | CREB3L2 | 14062 | -0.055 | 0.12 | NO |
| 40 | CREB1 | CREB1 | CREB1 | 14824 | -0.073 | 0.09 | NO |
| 41 | ADCY6 | ADCY6 | ADCY6 | 16129 | -0.12 | 0.042 | NO |
| 42 | DYNC1LI2 | DYNC1LI2 | DYNC1LI2 | 16198 | -0.12 | 0.06 | NO |
| 43 | CREB5 | CREB5 | CREB5 | 16512 | -0.13 | 0.067 | NO |
| 44 | CREB3L3 | CREB3L3 | CREB3L3 | 18559 | -0.37 | 0.026 | NO |
Figure S87. Get High-res Image This plot shows mRNAseq_cNMF expression data heatmap (on the left) a RunningEnrichmentScore(RES) plot (on the top right) and a Signal2Noise(S2N) plot (on the bottom right) of genes in the pathway: KEGG ETHER LIPID METABOLISM.

Figure S88. Get High-res Image For the top 5 core enriched genes in the pathway: KEGG ETHER LIPID METABOLISM, this volcano plot shows how much they are up/down-regulated and significant. The significance was calculated by empirical bayesian fit
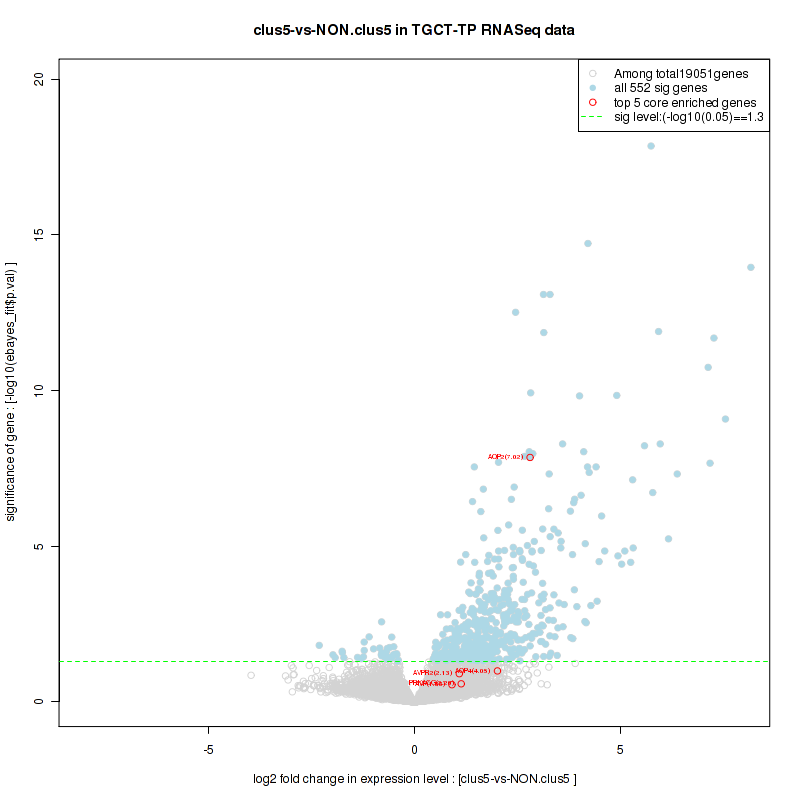
Table S45. Get Full Table This table shows a Running Enrichment Score (RES) of each gene in this pathway, that is, the enrichment score at this point in the ranked list of genes. All genes are ranked by Signal-to-Noise (S2N), a measure of similarity as default and are used to obtain ES matrix of all genes. In this way, GSEA tool uses expression pattern of not only overlapped genes but also not-overlapped genes to produce ES matrix.
| Rank | GENE | SYMBOL | DESC | LIST.LOC | S2N | RES | CORE_ENRICHMENT |
|---|---|---|---|---|---|---|---|
| 1 | COX7A1 | COX7A1 | COX7A1 | 601 | 0.46 | 0.0087 | YES |
| 2 | COX7B2 | COX7B2 | COX7B2 | 892 | 0.4 | 0.028 | YES |
| 3 | COX6B2 | COX6B2 | COX6B2 | 1138 | 0.36 | 0.047 | YES |
| 4 | COX8C | COX8C | COX8C | 1200 | 0.35 | 0.074 | YES |
| 5 | COX4I2 | COX4I2 | COX4I2 | 1728 | 0.29 | 0.071 | YES |
| 6 | ATP6V0A4 | ATP6V0A4 | ATP6V0A4 | 1820 | 0.28 | 0.091 | YES |
| 7 | ATP12A | ATP12A | ATP12A | 2208 | 0.24 | 0.092 | YES |
| 8 | ATP6V1E2 | ATP6V1E2 | ATP6V1E2 | 2830 | 0.2 | 0.076 | YES |
| 9 | ATP4A | ATP4A | ATP4A | 2950 | 0.19 | 0.087 | YES |
| 10 | COX6A2 | COX6A2 | COX6A2 | 3192 | 0.18 | 0.09 | YES |
| 11 | LHPP | LHPP | LHPP | 3369 | 0.17 | 0.095 | YES |
| 12 | NDUFS4 | NDUFS4 | NDUFS4 | 3586 | 0.16 | 0.098 | YES |
| 13 | NDUFA3 | NDUFA3 | NDUFA3 | 3882 | 0.14 | 0.095 | YES |
| 14 | NDUFB2 | NDUFB2 | NDUFB2 | 3938 | 0.14 | 0.1 | YES |
| 15 | NDUFC1 | NDUFC1 | NDUFC1 | 3990 | 0.14 | 0.11 | YES |
| 16 | NDUFB1 | NDUFB1 | NDUFB1 | 3998 | 0.14 | 0.13 | YES |
| 17 | NDUFA2 | NDUFA2 | NDUFA2 | 4158 | 0.13 | 0.13 | YES |
| 18 | PPA1 | PPA1 | PPA1 | 4248 | 0.13 | 0.14 | YES |
| 19 | NDUFV2 | NDUFV2 | NDUFV2 | 4309 | 0.13 | 0.14 | YES |
| 20 | NDUFB9 | NDUFB9 | NDUFB9 | 4343 | 0.13 | 0.15 | YES |
| 21 | NDUFS7 | NDUFS7 | NDUFS7 | 4365 | 0.12 | 0.16 | YES |
| 22 | ATP5H | ATP5H | ATP5H | 4372 | 0.12 | 0.17 | YES |
| 23 | NDUFAB1 | NDUFAB1 | NDUFAB1 | 4390 | 0.12 | 0.18 | YES |
| 24 | UQCRQ | UQCRQ | UQCRQ | 4485 | 0.12 | 0.19 | YES |
| 25 | NDUFS6 | NDUFS6 | NDUFS6 | 4493 | 0.12 | 0.2 | YES |
| 26 | COX6C | COX6C | COX6C | 4516 | 0.12 | 0.21 | YES |
| 27 | UQCR11 | UQCR11 | UQCR11 | 4541 | 0.12 | 0.22 | YES |
| 28 | ATP5D | ATP5D | ATP5D | 4625 | 0.12 | 0.22 | YES |
| 29 | COX11 | COX11 | COX11 | 4663 | 0.12 | 0.23 | YES |
| 30 | NDUFA8 | NDUFA8 | NDUFA8 | 4711 | 0.12 | 0.24 | YES |
| 31 | COX7A2 | COX7A2 | COX7A2 | 4736 | 0.11 | 0.25 | YES |
| 32 | NDUFC2 | NDUFC2 | NDUFC2 | 4744 | 0.11 | 0.26 | YES |
| 33 | NDUFB7 | NDUFB7 | NDUFB7 | 4789 | 0.11 | 0.27 | YES |
| 34 | NDUFB6 | NDUFB6 | NDUFB6 | 4827 | 0.11 | 0.27 | YES |
| 35 | COX5B | COX5B | COX5B | 4842 | 0.11 | 0.28 | YES |
| 36 | NDUFS8 | NDUFS8 | NDUFS8 | 4860 | 0.11 | 0.29 | YES |
| 37 | COX7C | COX7C | COX7C | 4872 | 0.11 | 0.3 | YES |
| 38 | UQCRHL | UQCRHL | UQCRHL | 4878 | 0.11 | 0.31 | YES |
| 39 | ATP6V0E2 | ATP6V0E2 | ATP6V0E2 | 4893 | 0.11 | 0.32 | YES |
| 40 | COX5A | COX5A | COX5A | 4955 | 0.11 | 0.32 | YES |
| 41 | ATP6V1C2 | ATP6V1C2 | ATP6V1C2 | 5047 | 0.11 | 0.33 | YES |
| 42 | NDUFS3 | NDUFS3 | NDUFS3 | 5105 | 0.1 | 0.34 | YES |
| 43 | ATP6V0E1 | ATP6V0E1 | ATP6V0E1 | 5154 | 0.1 | 0.34 | YES |
| 44 | SDHB | SDHB | SDHB | 5167 | 0.1 | 0.35 | YES |
| 45 | ATP5L | ATP5L | ATP5L | 5195 | 0.1 | 0.36 | YES |
| 46 | ATP6V1B1 | ATP6V1B1 | ATP6V1B1 | 5245 | 0.1 | 0.36 | YES |
| 47 | ATP6V1F | ATP6V1F | ATP6V1F | 5288 | 0.1 | 0.37 | YES |
| 48 | NDUFA11 | NDUFA11 | NDUFA11 | 5298 | 0.099 | 0.38 | YES |
| 49 | NDUFA5 | NDUFA5 | NDUFA5 | 5339 | 0.098 | 0.38 | YES |
| 50 | NDUFB10 | NDUFB10 | NDUFB10 | 5437 | 0.096 | 0.39 | YES |
| 51 | UQCRH | UQCRH | UQCRH | 5513 | 0.094 | 0.39 | YES |
| 52 | ATP5J2 | ATP5J2 | ATP5J2 | 5515 | 0.094 | 0.4 | YES |
| 53 | SDHA | SDHA | SDHA | 5728 | 0.089 | 0.4 | YES |
| 54 | NDUFB3 | NDUFB3 | NDUFB3 | 5851 | 0.086 | 0.4 | YES |
| 55 | ATP5E | ATP5E | ATP5E | 5870 | 0.086 | 0.41 | YES |
| 56 | NDUFA1 | NDUFA1 | NDUFA1 | 5957 | 0.084 | 0.41 | YES |
| 57 | COX8A | COX8A | COX8A | 6022 | 0.083 | 0.41 | YES |
| 58 | COX17 | COX17 | COX17 | 6045 | 0.082 | 0.42 | YES |
| 59 | COX6A1 | COX6A1 | COX6A1 | 6067 | 0.082 | 0.42 | YES |
| 60 | NDUFA4 | NDUFA4 | NDUFA4 | 6093 | 0.082 | 0.43 | YES |
| 61 | COX4I1 | COX4I1 | COX4I1 | 6163 | 0.08 | 0.43 | YES |
| 62 | NDUFA7 | NDUFA7 | NDUFA7 | 6185 | 0.08 | 0.44 | YES |
| 63 | NDUFS5 | NDUFS5 | NDUFS5 | 6192 | 0.079 | 0.45 | YES |
| 64 | UQCRFS1 | UQCRFS1 | UQCRFS1 | 6273 | 0.078 | 0.45 | YES |
| 65 | ATP5I | ATP5I | ATP5I | 6338 | 0.076 | 0.45 | YES |
| 66 | NDUFB8 | NDUFB8 | NDUFB8 | 6353 | 0.076 | 0.46 | YES |
| 67 | ATP5O | ATP5O | ATP5O | 6512 | 0.073 | 0.46 | YES |
| 68 | COX6B1 | COX6B1 | COX6B1 | 6544 | 0.072 | 0.46 | YES |
| 69 | SDHD | SDHD | SDHD | 6643 | 0.07 | 0.46 | YES |
| 70 | ATP6V1G2 | ATP6V1G2 | ATP6V1G2 | 6788 | 0.068 | 0.46 | YES |
| 71 | ATP6V0B | ATP6V0B | ATP6V0B | 6827 | 0.067 | 0.46 | YES |
| 72 | UQCRB | UQCRB | UQCRB | 6848 | 0.067 | 0.47 | YES |
| 73 | NDUFV1 | NDUFV1 | NDUFV1 | 6880 | 0.066 | 0.47 | YES |
| 74 | ATP5G3 | ATP5G3 | ATP5G3 | 6952 | 0.065 | 0.48 | YES |
| 75 | ATP5F1 | ATP5F1 | ATP5F1 | 7148 | 0.061 | 0.47 | YES |
| 76 | NDUFB5 | NDUFB5 | NDUFB5 | 7200 | 0.06 | 0.47 | YES |
| 77 | NDUFB4 | NDUFB4 | NDUFB4 | 7229 | 0.06 | 0.48 | YES |
| 78 | ATP6V1D | ATP6V1D | ATP6V1D | 7252 | 0.059 | 0.48 | YES |
| 79 | ATP6V1G1 | ATP6V1G1 | ATP6V1G1 | 7258 | 0.059 | 0.48 | YES |
| 80 | ATP5C1 | ATP5C1 | ATP5C1 | 7263 | 0.059 | 0.49 | YES |
| 81 | COX7B | COX7B | COX7B | 7454 | 0.056 | 0.48 | YES |
| 82 | NDUFA9 | NDUFA9 | NDUFA9 | 7627 | 0.053 | 0.48 | YES |
| 83 | TCIRG1 | TCIRG1 | TCIRG1 | 7841 | 0.049 | 0.47 | YES |
| 84 | UQCR10 | UQCR10 | UQCR10 | 7866 | 0.049 | 0.48 | YES |
| 85 | ATP5G1 | ATP5G1 | ATP5G1 | 7930 | 0.048 | 0.48 | YES |
| 86 | NDUFA10 | NDUFA10 | NDUFA10 | 7945 | 0.047 | 0.48 | YES |
| 87 | COX7A2L | COX7A2L | COX7A2L | 8032 | 0.046 | 0.48 | YES |
| 88 | ATP6V0D1 | ATP6V0D1 | ATP6V0D1 | 8068 | 0.045 | 0.48 | YES |
| 89 | ATP6V0C | ATP6V0C | ATP6V0C | 8131 | 0.044 | 0.48 | YES |
| 90 | ATP5A1 | ATP5A1 | ATP5A1 | 8177 | 0.043 | 0.48 | YES |
| 91 | ATP5J | ATP5J | ATP5J | 8212 | 0.043 | 0.49 | YES |
| 92 | ATP6V1H | ATP6V1H | ATP6V1H | 8276 | 0.041 | 0.49 | YES |
| 93 | NDUFA6 | NDUFA6 | NDUFA6 | 8281 | 0.041 | 0.49 | YES |
| 94 | ATP6V1E1 | ATP6V1E1 | ATP6V1E1 | 8312 | 0.041 | 0.49 | YES |
| 95 | CYC1 | CYC1 | CYC1 | 8510 | 0.038 | 0.48 | NO |
| 96 | NDUFV3 | NDUFV3 | NDUFV3 | 8615 | 0.036 | 0.48 | NO |
| 97 | ATP6V0A1 | ATP6V0A1 | ATP6V0A1 | 8674 | 0.035 | 0.48 | NO |
| 98 | PPA2 | PPA2 | PPA2 | 8760 | 0.034 | 0.48 | NO |
| 99 | COX10 | COX10 | COX10 | 9105 | 0.029 | 0.47 | NO |
| 100 | ATP5B | ATP5B | ATP5B | 9326 | 0.025 | 0.46 | NO |
| 101 | UQCRC1 | UQCRC1 | UQCRC1 | 9606 | 0.021 | 0.44 | NO |
| 102 | NDUFS2 | NDUFS2 | NDUFS2 | 9617 | 0.021 | 0.44 | NO |
| 103 | ATP5G2 | ATP5G2 | ATP5G2 | 9669 | 0.02 | 0.44 | NO |
| 104 | UQCRC2 | UQCRC2 | UQCRC2 | 10011 | 0.015 | 0.43 | NO |
| 105 | SDHC | SDHC | SDHC | 10038 | 0.014 | 0.43 | NO |
| 106 | COX15 | COX15 | COX15 | 10334 | 0.0094 | 0.41 | NO |
| 107 | ATP6AP1 | ATP6AP1 | ATP6AP1 | 10472 | 0.0071 | 0.41 | NO |
| 108 | ATP6V1B2 | ATP6V1B2 | ATP6V1B2 | 11307 | -0.0058 | 0.36 | NO |
| 109 | ATP6V0A2 | ATP6V0A2 | ATP6V0A2 | 11766 | -0.013 | 0.34 | NO |
| 110 | NDUFS1 | NDUFS1 | NDUFS1 | 12252 | -0.021 | 0.32 | NO |
| 111 | ATP6V1A | ATP6V1A | ATP6V1A | 12465 | -0.025 | 0.31 | NO |
| 112 | ATP6V1C1 | ATP6V1C1 | ATP6V1C1 | 12893 | -0.033 | 0.29 | NO |
| 113 | NDUFA4L2 | NDUFA4L2 | NDUFA4L2 | 14313 | -0.06 | 0.22 | NO |
| 114 | ATP4B | ATP4B | ATP4B | 16873 | -0.15 | 0.095 | NO |
| 115 | ATP6V0D2 | ATP6V0D2 | ATP6V0D2 | 17653 | -0.22 | 0.074 | NO |
Figure S89. Get High-res Image This plot shows mRNAseq_cNMF expression data heatmap (on the left) a RunningEnrichmentScore(RES) plot (on the top right) and a Signal2Noise(S2N) plot (on the bottom right) of genes in the pathway: KEGG PYRUVATE METABOLISM.

Figure S90. Get High-res Image For the top 5 core enriched genes in the pathway: KEGG PYRUVATE METABOLISM, this volcano plot shows how much they are up/down-regulated and significant. The significance was calculated by empirical bayesian fit
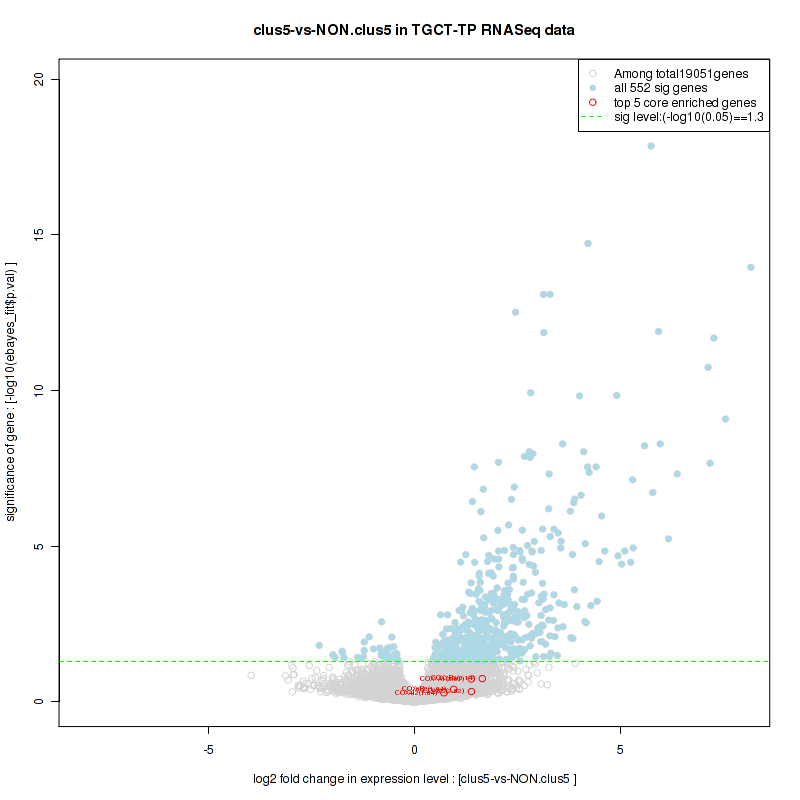
Table S46. Get Full Table This table shows a Running Enrichment Score (RES) of each gene in this pathway, that is, the enrichment score at this point in the ranked list of genes. All genes are ranked by Signal-to-Noise (S2N), a measure of similarity as default and are used to obtain ES matrix of all genes. In this way, GSEA tool uses expression pattern of not only overlapped genes but also not-overlapped genes to produce ES matrix.
| Rank | GENE | SYMBOL | DESC | LIST.LOC | S2N | RES | CORE_ENRICHMENT |
|---|---|---|---|---|---|---|---|
| 1 | PDK4 | PDK4 | PDK4 | 798 | 0.41 | 0.0018 | YES |
| 2 | SLC16A8 | SLC16A8 | SLC16A8 | 3319 | 0.17 | -0.11 | YES |
| 3 | UCP2 | UCP2 | UCP2 | 3489 | 0.16 | -0.1 | YES |
| 4 | NDUFS4 | NDUFS4 | NDUFS4 | 3586 | 0.16 | -0.093 | YES |
| 5 | UCP1 | UCP1 | UCP1 | 3734 | 0.15 | -0.085 | YES |
| 6 | NDUFA3 | NDUFA3 | NDUFA3 | 3882 | 0.14 | -0.078 | YES |
| 7 | NDUFB2 | NDUFB2 | NDUFB2 | 3938 | 0.14 | -0.066 | YES |
| 8 | NDUFC1 | NDUFC1 | NDUFC1 | 3990 | 0.14 | -0.054 | YES |
| 9 | NDUFB1 | NDUFB1 | NDUFB1 | 3998 | 0.14 | -0.039 | YES |
| 10 | PDK3 | PDK3 | PDK3 | 4051 | 0.14 | -0.027 | YES |
| 11 | NDUFA2 | NDUFA2 | NDUFA2 | 4158 | 0.13 | -0.019 | YES |
| 12 | ETFB | ETFB | ETFB | 4243 | 0.13 | -0.0096 | YES |
| 13 | NDUFV2 | NDUFV2 | NDUFV2 | 4309 | 0.13 | 0.00037 | YES |
| 14 | NDUFB9 | NDUFB9 | NDUFB9 | 4343 | 0.13 | 0.012 | YES |
| 15 | NDUFS7 | NDUFS7 | NDUFS7 | 4365 | 0.12 | 0.024 | YES |
| 16 | ATP5H | ATP5H | ATP5H | 4372 | 0.12 | 0.037 | YES |
| 17 | NDUFAB1 | NDUFAB1 | NDUFAB1 | 4390 | 0.12 | 0.049 | YES |
| 18 | MDH2 | MDH2 | MDH2 | 4451 | 0.12 | 0.059 | YES |
| 19 | UQCRQ | UQCRQ | UQCRQ | 4485 | 0.12 | 0.07 | YES |
| 20 | NDUFS6 | NDUFS6 | NDUFS6 | 4493 | 0.12 | 0.083 | YES |
| 21 | COX6C | COX6C | COX6C | 4516 | 0.12 | 0.094 | YES |
| 22 | UQCR11 | UQCR11 | UQCR11 | 4541 | 0.12 | 0.11 | YES |
| 23 | ATP5D | ATP5D | ATP5D | 4625 | 0.12 | 0.11 | YES |
| 24 | NDUFA8 | NDUFA8 | NDUFA8 | 4711 | 0.12 | 0.12 | YES |
| 25 | NDUFC2 | NDUFC2 | NDUFC2 | 4744 | 0.11 | 0.13 | YES |
| 26 | NDUFB7 | NDUFB7 | NDUFB7 | 4789 | 0.11 | 0.14 | YES |
| 27 | NDUFB6 | NDUFB6 | NDUFB6 | 4827 | 0.11 | 0.15 | YES |
| 28 | COX5B | COX5B | COX5B | 4842 | 0.11 | 0.16 | YES |
| 29 | NDUFS8 | NDUFS8 | NDUFS8 | 4860 | 0.11 | 0.17 | YES |
| 30 | COX7C | COX7C | COX7C | 4872 | 0.11 | 0.18 | YES |
| 31 | UQCRHL | UQCRHL | UQCRHL | 4878 | 0.11 | 0.2 | YES |
| 32 | CYCS | CYCS | CYCS | 4916 | 0.11 | 0.2 | YES |
| 33 | COX5A | COX5A | COX5A | 4955 | 0.11 | 0.22 | YES |
| 34 | NDUFS3 | NDUFS3 | NDUFS3 | 5105 | 0.1 | 0.22 | YES |
| 35 | SDHB | SDHB | SDHB | 5167 | 0.1 | 0.22 | YES |
| 36 | ATP5L | ATP5L | ATP5L | 5195 | 0.1 | 0.24 | YES |
| 37 | NDUFA11 | NDUFA11 | NDUFA11 | 5298 | 0.099 | 0.24 | YES |
| 38 | NDUFA5 | NDUFA5 | NDUFA5 | 5339 | 0.098 | 0.25 | YES |
| 39 | NDUFB10 | NDUFB10 | NDUFB10 | 5437 | 0.096 | 0.25 | YES |
| 40 | UQCRH | UQCRH | UQCRH | 5513 | 0.094 | 0.26 | YES |
| 41 | ATP5J2 | ATP5J2 | ATP5J2 | 5515 | 0.094 | 0.27 | YES |
| 42 | UCP3 | UCP3 | UCP3 | 5536 | 0.094 | 0.28 | YES |
| 43 | NDUFA12 | NDUFA12 | NDUFA12 | 5652 | 0.091 | 0.28 | YES |
| 44 | SDHA | SDHA | SDHA | 5728 | 0.089 | 0.29 | YES |
| 45 | NDUFA13 | NDUFA13 | NDUFA13 | 5837 | 0.086 | 0.29 | YES |
| 46 | NDUFB3 | NDUFB3 | NDUFB3 | 5851 | 0.086 | 0.3 | YES |
| 47 | ATP5E | ATP5E | ATP5E | 5870 | 0.086 | 0.31 | YES |
| 48 | NDUFA1 | NDUFA1 | NDUFA1 | 5957 | 0.084 | 0.31 | YES |
| 49 | SLC16A3 | SLC16A3 | SLC16A3 | 5975 | 0.084 | 0.32 | YES |
| 50 | LDHB | LDHB | LDHB | 5983 | 0.084 | 0.33 | YES |
| 51 | COX8A | COX8A | COX8A | 6022 | 0.083 | 0.34 | YES |
| 52 | COX6A1 | COX6A1 | COX6A1 | 6067 | 0.082 | 0.34 | YES |
| 53 | ETFDH | ETFDH | ETFDH | 6084 | 0.082 | 0.35 | YES |
| 54 | NDUFA4 | NDUFA4 | NDUFA4 | 6093 | 0.082 | 0.36 | YES |
| 55 | COX4I1 | COX4I1 | COX4I1 | 6163 | 0.08 | 0.36 | YES |
| 56 | NDUFA7 | NDUFA7 | NDUFA7 | 6185 | 0.08 | 0.37 | YES |
| 57 | NDUFS5 | NDUFS5 | NDUFS5 | 6192 | 0.079 | 0.38 | YES |
| 58 | UQCRFS1 | UQCRFS1 | UQCRFS1 | 6273 | 0.078 | 0.38 | YES |
| 59 | ATP5I | ATP5I | ATP5I | 6338 | 0.076 | 0.39 | YES |
| 60 | NDUFB8 | NDUFB8 | NDUFB8 | 6353 | 0.076 | 0.39 | YES |
| 61 | PDK2 | PDK2 | PDK2 | 6432 | 0.075 | 0.4 | YES |
| 62 | ATP5O | ATP5O | ATP5O | 6512 | 0.073 | 0.4 | YES |
| 63 | COX6B1 | COX6B1 | COX6B1 | 6544 | 0.072 | 0.41 | YES |
| 64 | IDH3G | IDH3G | IDH3G | 6617 | 0.071 | 0.41 | YES |
| 65 | SDHD | SDHD | SDHD | 6643 | 0.07 | 0.42 | YES |
| 66 | UQCRB | UQCRB | UQCRB | 6848 | 0.067 | 0.41 | YES |
| 67 | ADHFE1 | ADHFE1 | ADHFE1 | 6876 | 0.066 | 0.42 | YES |
| 68 | NDUFV1 | NDUFV1 | NDUFV1 | 6880 | 0.066 | 0.42 | YES |
| 69 | ATP5F1 | ATP5F1 | ATP5F1 | 7148 | 0.061 | 0.42 | YES |
| 70 | NDUFB5 | NDUFB5 | NDUFB5 | 7200 | 0.06 | 0.42 | YES |
| 71 | NDUFB4 | NDUFB4 | NDUFB4 | 7229 | 0.06 | 0.43 | YES |
| 72 | ATP5C1 | ATP5C1 | ATP5C1 | 7263 | 0.059 | 0.43 | YES |
| 73 | ETFA | ETFA | ETFA | 7406 | 0.056 | 0.43 | YES |
| 74 | COX7B | COX7B | COX7B | 7454 | 0.056 | 0.43 | YES |
| 75 | IDH3A | IDH3A | IDH3A | 7612 | 0.053 | 0.43 | YES |
| 76 | NDUFA9 | NDUFA9 | NDUFA9 | 7627 | 0.053 | 0.44 | YES |
| 77 | BSG | BSG | BSG | 7919 | 0.048 | 0.42 | YES |
| 78 | ATP5G1 | ATP5G1 | ATP5G1 | 7930 | 0.048 | 0.43 | YES |
| 79 | NDUFA10 | NDUFA10 | NDUFA10 | 7945 | 0.047 | 0.43 | YES |
| 80 | COX7A2L | COX7A2L | COX7A2L | 8032 | 0.046 | 0.43 | YES |
| 81 | ATP5A1 | ATP5A1 | ATP5A1 | 8177 | 0.043 | 0.43 | YES |
| 82 | ATP5J | ATP5J | ATP5J | 8212 | 0.043 | 0.43 | YES |
| 83 | NDUFA6 | NDUFA6 | NDUFA6 | 8281 | 0.041 | 0.43 | YES |
| 84 | LDHA | LDHA | LDHA | 8339 | 0.04 | 0.44 | YES |
| 85 | SUCLG1 | SUCLG1 | SUCLG1 | 8368 | 0.04 | 0.44 | YES |
| 86 | SUCLA2 | SUCLA2 | SUCLA2 | 8480 | 0.038 | 0.44 | YES |
| 87 | CYC1 | CYC1 | CYC1 | 8510 | 0.038 | 0.44 | YES |
| 88 | IDH3B | IDH3B | IDH3B | 8554 | 0.037 | 0.44 | YES |
| 89 | OGDH | OGDH | OGDH | 8561 | 0.037 | 0.44 | YES |
| 90 | NDUFV3 | NDUFV3 | NDUFV3 | 8615 | 0.036 | 0.44 | YES |
| 91 | DLD | DLD | DLD | 8935 | 0.031 | 0.43 | NO |
| 92 | ATP5B | ATP5B | ATP5B | 9326 | 0.025 | 0.41 | NO |
| 93 | UQCRC1 | UQCRC1 | UQCRC1 | 9606 | 0.021 | 0.4 | NO |
| 94 | NDUFS2 | NDUFS2 | NDUFS2 | 9617 | 0.021 | 0.4 | NO |
| 95 | FH | FH | FH | 9709 | 0.019 | 0.4 | NO |
| 96 | DLAT | DLAT | DLAT | 9932 | 0.016 | 0.39 | NO |
| 97 | UQCRC2 | UQCRC2 | UQCRC2 | 10011 | 0.015 | 0.39 | NO |
| 98 | SDHC | SDHC | SDHC | 10038 | 0.014 | 0.39 | NO |
| 99 | PDHB | PDHB | PDHB | 10459 | 0.0074 | 0.37 | NO |
| 100 | PDHX | PDHX | PDHX | 10482 | 0.007 | 0.37 | NO |
| 101 | D2HGDH | D2HGDH | D2HGDH | 10491 | 0.0067 | 0.37 | NO |
| 102 | ACO2 | ACO2 | ACO2 | 11345 | -0.0064 | 0.32 | NO |
| 103 | PDHA1 | PDHA1 | PDHA1 | 11564 | -0.0097 | 0.31 | NO |
| 104 | CS | CS | CS | 11662 | -0.011 | 0.31 | NO |
| 105 | IDH2 | IDH2 | IDH2 | 11749 | -0.013 | 0.3 | NO |
| 106 | SUCLG2 | SUCLG2 | SUCLG2 | 11769 | -0.013 | 0.3 | NO |
| 107 | NNT | NNT | NNT | 12057 | -0.018 | 0.29 | NO |
| 108 | NDUFS1 | NDUFS1 | NDUFS1 | 12252 | -0.021 | 0.28 | NO |
| 109 | IDH1 | IDH1 | IDH1 | 12510 | -0.026 | 0.27 | NO |
| 110 | DLST | DLST | DLST | 12710 | -0.03 | 0.26 | NO |
| 111 | SLC16A1 | SLC16A1 | SLC16A1 | 13205 | -0.038 | 0.24 | NO |
| 112 | PDP1 | PDP1 | PDP1 | 13629 | -0.047 | 0.23 | NO |
| 113 | PDK1 | PDK1 | PDK1 | 13697 | -0.048 | 0.23 | NO |
| 114 | L2HGDH | L2HGDH | L2HGDH | 14882 | -0.075 | 0.17 | NO |
| 115 | PDP2 | PDP2 | PDP2 | 17325 | -0.19 | 0.064 | NO |
| 116 | PDPR | PDPR | PDPR | 17953 | -0.26 | 0.058 | NO |
Figure S91. Get High-res Image This plot shows mRNAseq_cNMF expression data heatmap (on the left) a RunningEnrichmentScore(RES) plot (on the top right) and a Signal2Noise(S2N) plot (on the bottom right) of genes in the pathway: KEGG PROPANOATE METABOLISM.
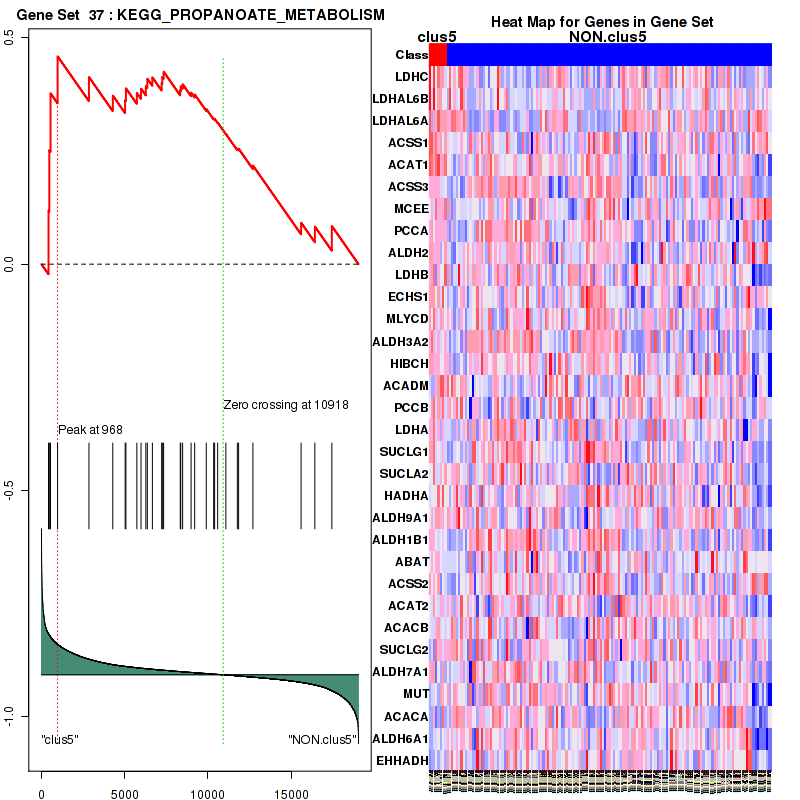
Figure S92. Get High-res Image For the top 5 core enriched genes in the pathway: KEGG PROPANOATE METABOLISM, this volcano plot shows how much they are up/down-regulated and significant. The significance was calculated by empirical bayesian fit
Table S47. Get Full Table This table shows a Running Enrichment Score (RES) of each gene in this pathway, that is, the enrichment score at this point in the ranked list of genes. All genes are ranked by Signal-to-Noise (S2N), a measure of similarity as default and are used to obtain ES matrix of all genes. In this way, GSEA tool uses expression pattern of not only overlapped genes but also not-overlapped genes to produce ES matrix.
| Rank | GENE | SYMBOL | DESC | LIST.LOC | S2N | RES | CORE_ENRICHMENT |
|---|---|---|---|---|---|---|---|
| 1 | LDHC | LDHC | LDHC | 424 | 0.52 | 0.12 | YES |
| 2 | LDHAL6B | LDHAL6B | LDHAL6B | 472 | 0.5 | 0.25 | YES |
| 3 | LDHAL6A | LDHAL6A | LDHAL6A | 544 | 0.48 | 0.38 | YES |
| 4 | ACSS1 | ACSS1 | ACSS1 | 968 | 0.38 | 0.46 | YES |
| 5 | ACAT1 | ACAT1 | ACAT1 | 2853 | 0.2 | 0.41 | NO |
| 6 | ACSS3 | ACSS3 | ACSS3 | 4287 | 0.13 | 0.37 | NO |
| 7 | MCEE | MCEE | MCEE | 5027 | 0.11 | 0.36 | NO |
| 8 | PCCA | PCCA | PCCA | 5075 | 0.1 | 0.39 | NO |
| 9 | ALDH2 | ALDH2 | ALDH2 | 5731 | 0.089 | 0.38 | NO |
| 10 | LDHB | LDHB | LDHB | 5983 | 0.084 | 0.39 | NO |
| 11 | ECHS1 | ECHS1 | ECHS1 | 6272 | 0.078 | 0.39 | NO |
| 12 | MLYCD | MLYCD | MLYCD | 6361 | 0.076 | 0.41 | NO |
| 13 | ALDH3A2 | ALDH3A2 | ALDH3A2 | 6664 | 0.07 | 0.41 | NO |
| 14 | HIBCH | HIBCH | HIBCH | 7222 | 0.06 | 0.4 | NO |
| 15 | ACADM | ACADM | ACADM | 7262 | 0.059 | 0.41 | NO |
| 16 | PCCB | PCCB | PCCB | 7340 | 0.058 | 0.42 | NO |
| 17 | LDHA | LDHA | LDHA | 8339 | 0.04 | 0.38 | NO |
| 18 | SUCLG1 | SUCLG1 | SUCLG1 | 8368 | 0.04 | 0.39 | NO |
| 19 | SUCLA2 | SUCLA2 | SUCLA2 | 8480 | 0.038 | 0.4 | NO |
| 20 | HADHA | HADHA | HADHA | 8991 | 0.03 | 0.38 | NO |
| 21 | ALDH9A1 | ALDH9A1 | ALDH9A1 | 9205 | 0.027 | 0.38 | NO |
| 22 | ALDH1B1 | ALDH1B1 | ALDH1B1 | 9904 | 0.016 | 0.34 | NO |
| 23 | ABAT | ABAT | ABAT | 10346 | 0.009 | 0.32 | NO |
| 24 | ACSS2 | ACSS2 | ACSS2 | 10406 | 0.008 | 0.32 | NO |
| 25 | ACAT2 | ACAT2 | ACAT2 | 10588 | 0.0051 | 0.31 | NO |
| 26 | ACACB | ACACB | ACACB | 11080 | -0.0024 | 0.29 | NO |
| 27 | SUCLG2 | SUCLG2 | SUCLG2 | 11769 | -0.013 | 0.26 | NO |
| 28 | ALDH7A1 | ALDH7A1 | ALDH7A1 | 11846 | -0.014 | 0.26 | NO |
| 29 | MUT | MUT | MUT | 12705 | -0.03 | 0.22 | NO |
| 30 | ACACA | ACACA | ACACA | 15602 | -0.096 | 0.092 | NO |
| 31 | ALDH6A1 | ALDH6A1 | ALDH6A1 | 16428 | -0.13 | 0.083 | NO |
| 32 | EHHADH | EHHADH | EHHADH | 17448 | -0.2 | 0.084 | NO |
Figure S93. Get High-res Image This plot shows mRNAseq_cNMF expression data heatmap (on the left) a RunningEnrichmentScore(RES) plot (on the top right) and a Signal2Noise(S2N) plot (on the bottom right) of genes in the pathway: KEGG VASOPRESSIN REGULATED WATER REABSORPTION.

Figure S94. Get High-res Image For the top 5 core enriched genes in the pathway: KEGG VASOPRESSIN REGULATED WATER REABSORPTION, this volcano plot shows how much they are up/down-regulated and significant. The significance was calculated by empirical bayesian fit

Table S48. Get Full Table This table shows a Running Enrichment Score (RES) of each gene in this pathway, that is, the enrichment score at this point in the ranked list of genes. All genes are ranked by Signal-to-Noise (S2N), a measure of similarity as default and are used to obtain ES matrix of all genes. In this way, GSEA tool uses expression pattern of not only overlapped genes but also not-overlapped genes to produce ES matrix.
| Rank | GENE | SYMBOL | DESC | LIST.LOC | S2N | RES | CORE_ENRICHMENT |
|---|---|---|---|---|---|---|---|
| 1 | PLA2G2A | PLA2G2A | PLA2G2A | 36 | 1.1 | 0.18 | YES |
| 2 | ENPP6 | ENPP6 | ENPP6 | 80 | 0.9 | 0.33 | YES |
| 3 | PLA2G5 | PLA2G5 | PLA2G5 | 103 | 0.82 | 0.47 | YES |
| 4 | PLA2G1B | PLA2G1B | PLA2G1B | 684 | 0.44 | 0.51 | YES |
| 5 | PLA2G2D | PLA2G2D | PLA2G2D | 1179 | 0.35 | 0.54 | YES |
| 6 | PLA2G4A | PLA2G4A | PLA2G4A | 1492 | 0.31 | 0.57 | YES |
| 7 | PPAP2B | PPAP2B | PPAP2B | 2053 | 0.26 | 0.59 | YES |
| 8 | PLA2G2F | PLA2G2F | PLA2G2F | 4201 | 0.13 | 0.5 | NO |
| 9 | PLA2G7 | PLA2G7 | PLA2G7 | 4803 | 0.11 | 0.48 | NO |
| 10 | PPAP2A | PPAP2A | PPAP2A | 5222 | 0.1 | 0.48 | NO |
| 11 | PLA2G4E | PLA2G4E | PLA2G4E | 6455 | 0.074 | 0.42 | NO |
| 12 | CHPT1 | CHPT1 | CHPT1 | 6498 | 0.074 | 0.44 | NO |
| 13 | PAFAH1B3 | PAFAH1B3 | PAFAH1B3 | 7727 | 0.051 | 0.38 | NO |
| 14 | PLA2G12A | PLA2G12A | PLA2G12A | 8001 | 0.046 | 0.37 | NO |
| 15 | LPCAT4 | LPCAT4 | LPCAT4 | 8447 | 0.039 | 0.36 | NO |
| 16 | ENPP2 | ENPP2 | ENPP2 | 9504 | 0.022 | 0.3 | NO |
| 17 | PLD1 | PLD1 | PLD1 | 11020 | -0.0015 | 0.22 | NO |
| 18 | PAFAH1B1 | PAFAH1B1 | PAFAH1B1 | 11040 | -0.0017 | 0.22 | NO |
| 19 | LPCAT1 | LPCAT1 | LPCAT1 | 11413 | -0.0075 | 0.2 | NO |
| 20 | JMJD7-PLA2G4B | JMJD7-PLA2G4B | JMJD7-PLA2G4B | 12266 | -0.022 | 0.16 | NO |
| 21 | LPCAT2 | LPCAT2 | LPCAT2 | 12593 | -0.027 | 0.15 | NO |
| 22 | PAFAH2 | PAFAH2 | PAFAH2 | 12770 | -0.031 | 0.15 | NO |
| 23 | PLA2G6 | PLA2G6 | PLA2G6 | 13388 | -0.042 | 0.12 | NO |
| 24 | PLD2 | PLD2 | PLD2 | 13620 | -0.046 | 0.12 | NO |
| 25 | PLA2G10 | PLA2G10 | PLA2G10 | 14542 | -0.066 | 0.08 | NO |
| 26 | AGPS | AGPS | AGPS | 14563 | -0.066 | 0.09 | NO |
| 27 | PPAP2C | PPAP2C | PPAP2C | 14958 | -0.077 | 0.081 | NO |
| 28 | PLA2G3 | PLA2G3 | PLA2G3 | 16866 | -0.15 | 0.0061 | NO |
| 29 | PAFAH1B2 | PAFAH1B2 | PAFAH1B2 | 17154 | -0.17 | 0.02 | NO |
| 30 | PLA2G12B | PLA2G12B | PLA2G12B | 18854 | -0.49 | 0.01 | NO |
Figure S95. Get High-res Image This plot shows mRNAseq_cNMF expression data heatmap (on the left) a RunningEnrichmentScore(RES) plot (on the top right) and a Signal2Noise(S2N) plot (on the bottom right) of genes in the pathway: KEGG PARKINSONS DISEASE.
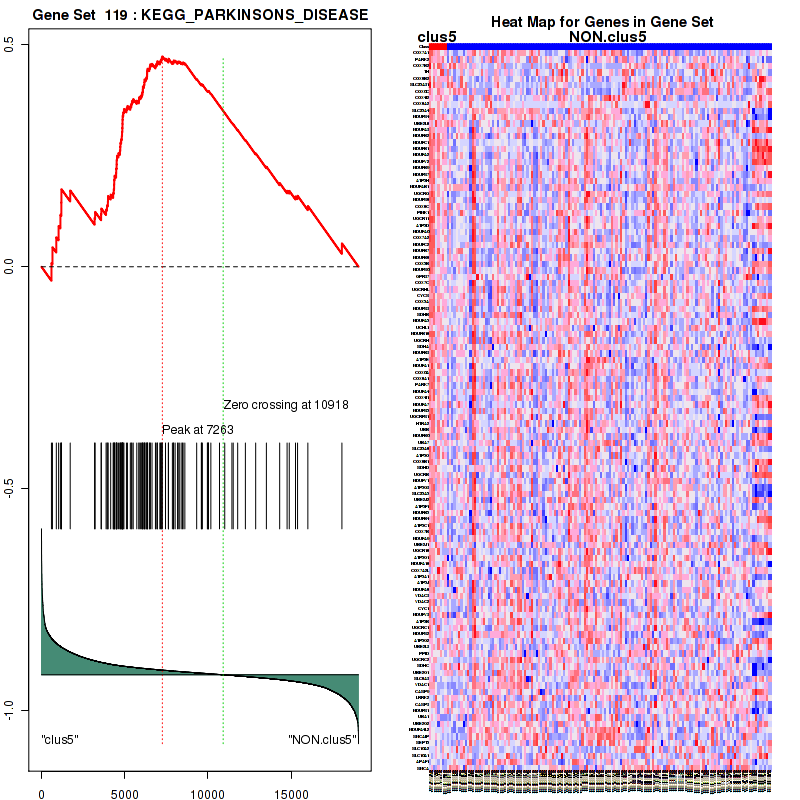
Figure S96. Get High-res Image For the top 5 core enriched genes in the pathway: KEGG PARKINSONS DISEASE, this volcano plot shows how much they are up/down-regulated and significant. The significance was calculated by empirical bayesian fit
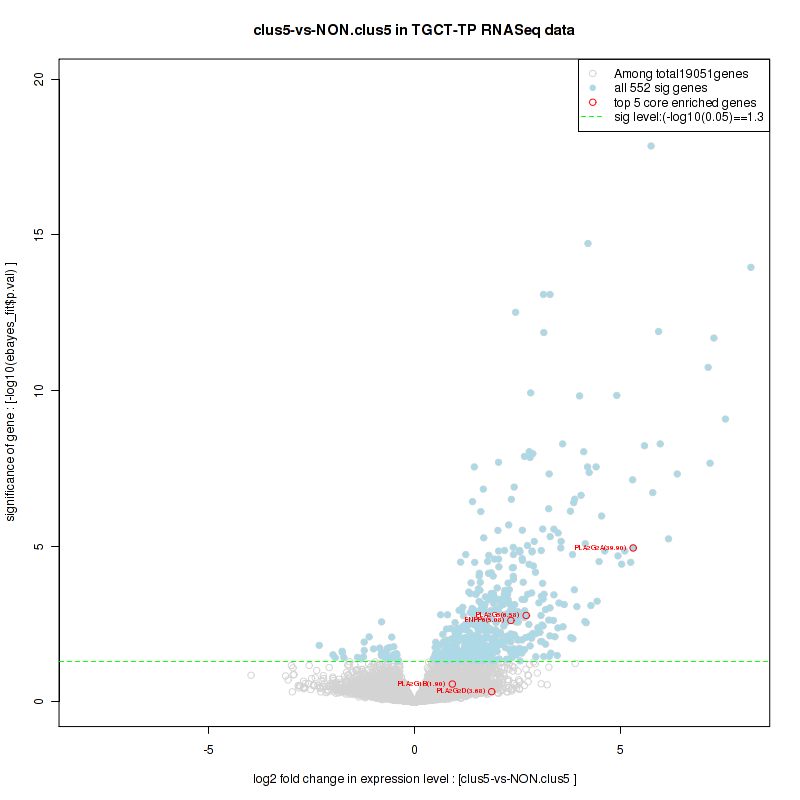
Table S49. Get Full Table This table shows a Running Enrichment Score (RES) of each gene in this pathway, that is, the enrichment score at this point in the ranked list of genes. All genes are ranked by Signal-to-Noise (S2N), a measure of similarity as default and are used to obtain ES matrix of all genes. In this way, GSEA tool uses expression pattern of not only overlapped genes but also not-overlapped genes to produce ES matrix.
| Rank | GENE | SYMBOL | DESC | LIST.LOC | S2N | RES | CORE_ENRICHMENT |
|---|---|---|---|---|---|---|---|
| 1 | GSTA1 | GSTA1 | GSTA1 | 33 | 1.2 | 0.15 | YES |
| 2 | GSTA3 | GSTA3 | GSTA3 | 112 | 0.79 | 0.24 | YES |
| 3 | GSTM5 | GSTM5 | GSTM5 | 121 | 0.78 | 0.34 | YES |
| 4 | GSTM3 | GSTM3 | GSTM3 | 165 | 0.71 | 0.43 | YES |
| 5 | GSTA2 | GSTA2 | GSTA2 | 547 | 0.48 | 0.47 | YES |
| 6 | GGT5 | GGT5 | GGT5 | 1432 | 0.32 | 0.47 | YES |
| 7 | GPX5 | GPX5 | GPX5 | 1664 | 0.29 | 0.49 | YES |
| 8 | GPX3 | GPX3 | GPX3 | 1783 | 0.28 | 0.52 | YES |
| 9 | GSTK1 | GSTK1 | GSTK1 | 3577 | 0.16 | 0.45 | YES |
| 10 | GSTA4 | GSTA4 | GSTA4 | 3937 | 0.14 | 0.45 | YES |
| 11 | MGST2 | MGST2 | MGST2 | 3963 | 0.14 | 0.47 | YES |
| 12 | GSTZ1 | GSTZ1 | GSTZ1 | 4154 | 0.13 | 0.47 | YES |
| 13 | GSTM2 | GSTM2 | GSTM2 | 4366 | 0.12 | 0.48 | YES |
| 14 | GSTM4 | GSTM4 | GSTM4 | 4417 | 0.12 | 0.49 | YES |
| 15 | G6PD | G6PD | G6PD | 4822 | 0.11 | 0.48 | YES |
| 16 | GSTT2 | GSTT2 | GSTT2 | 5107 | 0.1 | 0.48 | YES |
| 17 | SRM | SRM | SRM | 5150 | 0.1 | 0.49 | YES |
| 18 | LAP3 | LAP3 | LAP3 | 5186 | 0.1 | 0.5 | YES |
| 19 | GSTM1 | GSTM1 | GSTM1 | 5191 | 0.1 | 0.52 | YES |
| 20 | MGST3 | MGST3 | MGST3 | 5204 | 0.1 | 0.53 | YES |
| 21 | GSTT1 | GSTT1 | GSTT1 | 5578 | 0.093 | 0.52 | YES |
| 22 | GSTO1 | GSTO1 | GSTO1 | 5650 | 0.091 | 0.53 | YES |
| 23 | GSTO2 | GSTO2 | GSTO2 | 5832 | 0.086 | 0.53 | YES |
| 24 | GPX1 | GPX1 | GPX1 | 6267 | 0.078 | 0.52 | NO |
| 25 | GPX2 | GPX2 | GPX2 | 6366 | 0.076 | 0.52 | NO |
| 26 | PGD | PGD | PGD | 6496 | 0.074 | 0.53 | NO |
| 27 | GPX4 | GPX4 | GPX4 | 6644 | 0.07 | 0.53 | NO |
| 28 | GCLM | GCLM | GCLM | 6957 | 0.064 | 0.52 | NO |
| 29 | GSS | GSS | GSS | 7910 | 0.048 | 0.48 | NO |
| 30 | GGT6 | GGT6 | GGT6 | 8605 | 0.036 | 0.44 | NO |
| 31 | MGST1 | MGST1 | MGST1 | 8667 | 0.035 | 0.44 | NO |
| 32 | GPX7 | GPX7 | GPX7 | 9187 | 0.027 | 0.42 | NO |
| 33 | GSTP1 | GSTP1 | GSTP1 | 9295 | 0.026 | 0.42 | NO |
| 34 | GGCT | GGCT | GGCT | 9691 | 0.02 | 0.4 | NO |
| 35 | TXNDC12 | TXNDC12 | TXNDC12 | 9935 | 0.016 | 0.39 | NO |
| 36 | OPLAH | OPLAH | OPLAH | 10386 | 0.0084 | 0.37 | NO |
| 37 | ODC1 | ODC1 | ODC1 | 10811 | 0.0018 | 0.34 | NO |
| 38 | RRM1 | RRM1 | RRM1 | 11699 | -0.012 | 0.3 | NO |
| 39 | IDH2 | IDH2 | IDH2 | 11749 | -0.013 | 0.3 | NO |
| 40 | IDH1 | IDH1 | IDH1 | 12510 | -0.026 | 0.26 | NO |
| 41 | GSR | GSR | GSR | 12800 | -0.031 | 0.25 | NO |
| 42 | GGT1 | GGT1 | GGT1 | 12843 | -0.032 | 0.25 | NO |
| 43 | RRM2B | RRM2B | RRM2B | 13238 | -0.039 | 0.24 | NO |
| 44 | SMS | SMS | SMS | 13775 | -0.049 | 0.22 | NO |
| 45 | RRM2 | RRM2 | RRM2 | 13826 | -0.05 | 0.22 | NO |
| 46 | GGT7 | GGT7 | GGT7 | 13921 | -0.052 | 0.22 | NO |
| 47 | GCLC | GCLC | GCLC | 14144 | -0.057 | 0.22 | NO |
| 48 | GPX6 | GPX6 | GPX6 | 15609 | -0.096 | 0.15 | NO |
| 49 | ANPEP | ANPEP | ANPEP | 17730 | -0.23 | 0.07 | NO |
Figure S97. Get High-res Image This plot shows mRNAseq_cNMF expression data heatmap (on the left) a RunningEnrichmentScore(RES) plot (on the top right) and a Signal2Noise(S2N) plot (on the bottom right) of genes in the pathway: KEGG PRION DISEASES.

Figure S98. Get High-res Image For the top 5 core enriched genes in the pathway: KEGG PRION DISEASES, this volcano plot shows how much they are up/down-regulated and significant. The significance was calculated by empirical bayesian fit

Table S50. Get Full Table This table shows a Running Enrichment Score (RES) of each gene in this pathway, that is, the enrichment score at this point in the ranked list of genes. All genes are ranked by Signal-to-Noise (S2N), a measure of similarity as default and are used to obtain ES matrix of all genes. In this way, GSEA tool uses expression pattern of not only overlapped genes but also not-overlapped genes to produce ES matrix.
| Rank | GENE | SYMBOL | DESC | LIST.LOC | S2N | RES | CORE_ENRICHMENT |
|---|---|---|---|---|---|---|---|
| 1 | FAM153A | FAM153A | FAM153A | 92 | 0.87 | 0.09 | YES |
| 2 | RPS28 | RPS28 | RPS28 | 1233 | 0.34 | 0.068 | YES |
| 3 | RPS27 | RPS27 | RPS27 | 1516 | 0.31 | 0.087 | YES |
| 4 | RPSAP9 | RPSAP9 | RPSAP9 | 3144 | 0.18 | 0.021 | YES |
| 5 | SEC11C | SEC11C | SEC11C | 3429 | 0.16 | 0.024 | YES |
| 6 | RPL3L | RPL3L | RPL3L | 3712 | 0.15 | 0.025 | YES |
| 7 | RPL39 | RPL39 | RPL39 | 3850 | 0.15 | 0.034 | YES |
| 8 | RPL26L1 | RPL26L1 | RPL26L1 | 3935 | 0.14 | 0.045 | YES |
| 9 | RPL38 | RPL38 | RPL38 | 4096 | 0.14 | 0.052 | YES |
| 10 | RPL34 | RPL34 | RPL34 | 4238 | 0.13 | 0.058 | YES |
| 11 | SSR4 | SSR4 | SSR4 | 4331 | 0.13 | 0.067 | YES |
| 12 | RPL36A | RPL36A | RPL36A | 4422 | 0.12 | 0.076 | YES |
| 13 | SPCS2 | SPCS2 | SPCS2 | 4557 | 0.12 | 0.082 | YES |
| 14 | RPL23A | RPL23A | RPL23A | 4649 | 0.12 | 0.09 | YES |
| 15 | RPS26 | RPS26 | RPS26 | 4684 | 0.12 | 0.1 | YES |
| 16 | RPS14 | RPS14 | RPS14 | 4793 | 0.11 | 0.11 | YES |
| 17 | RPS23 | RPS23 | RPS23 | 4834 | 0.11 | 0.12 | YES |
| 18 | FAU | FAU | FAU | 4968 | 0.11 | 0.12 | YES |
| 19 | RPL18A | RPL18A | RPL18A | 5052 | 0.1 | 0.13 | YES |
| 20 | RPS13 | RPS13 | RPS13 | 5064 | 0.1 | 0.14 | YES |
| 21 | RPS4Y1 | RPS4Y1 | RPS4Y1 | 5118 | 0.1 | 0.15 | YES |
| 22 | RPL37 | RPL37 | RPL37 | 5123 | 0.1 | 0.16 | YES |
| 23 | SEC61G | SEC61G | SEC61G | 5158 | 0.1 | 0.17 | YES |
| 24 | RPLP2 | RPLP2 | RPLP2 | 5213 | 0.1 | 0.18 | YES |
| 25 | RPL26 | RPL26 | RPL26 | 5248 | 0.1 | 0.19 | YES |
| 26 | RPS21 | RPS21 | RPS21 | 5408 | 0.097 | 0.19 | YES |
| 27 | RPL27 | RPL27 | RPL27 | 5505 | 0.094 | 0.2 | YES |
| 28 | RPSA | RPSA | RPSA | 5525 | 0.094 | 0.2 | YES |
| 29 | RPL28 | RPL28 | RPL28 | 5531 | 0.094 | 0.21 | YES |
| 30 | RPL36 | RPL36 | RPL36 | 5639 | 0.091 | 0.22 | YES |
| 31 | RPS27A | RPS27A | RPS27A | 5683 | 0.09 | 0.23 | YES |
| 32 | RPL35 | RPL35 | RPL35 | 5691 | 0.09 | 0.24 | YES |
| 33 | RPS16 | RPS16 | RPS16 | 5757 | 0.089 | 0.24 | YES |
| 34 | SEC61B | SEC61B | SEC61B | 5787 | 0.088 | 0.25 | YES |
| 35 | RPL12 | RPL12 | RPL12 | 5796 | 0.088 | 0.26 | YES |
| 36 | RPL7A | RPL7A | RPL7A | 5846 | 0.086 | 0.27 | YES |
| 37 | RPS3 | RPS3 | RPS3 | 5949 | 0.084 | 0.27 | YES |
| 38 | RPS5 | RPS5 | RPS5 | 5980 | 0.084 | 0.28 | YES |
| 39 | RPL23 | RPL23 | RPL23 | 6010 | 0.083 | 0.28 | YES |
| 40 | RPS29 | RPS29 | RPS29 | 6011 | 0.083 | 0.29 | YES |
| 41 | LOC653566 | LOC653566 | LOC653566 | 6026 | 0.083 | 0.3 | YES |
| 42 | RPS25 | RPS25 | RPS25 | 6044 | 0.082 | 0.31 | YES |
| 43 | RPS9 | RPS9 | RPS9 | 6076 | 0.082 | 0.32 | YES |
| 44 | RPS12 | RPS12 | RPS12 | 6150 | 0.08 | 0.32 | YES |
| 45 | RPS3A | RPS3A | RPS3A | 6206 | 0.079 | 0.33 | YES |
| 46 | RPL18 | RPL18 | RPL18 | 6210 | 0.079 | 0.34 | YES |
| 47 | RPS15 | RPS15 | RPS15 | 6251 | 0.078 | 0.34 | YES |
| 48 | RPS19 | RPS19 | RPS19 | 6282 | 0.078 | 0.35 | YES |
| 49 | RPL8 | RPL8 | RPL8 | 6303 | 0.077 | 0.36 | YES |
| 50 | RPL11 | RPL11 | RPL11 | 6390 | 0.075 | 0.36 | YES |
| 51 | RPS10 | RPS10 | RPS10 | 6408 | 0.075 | 0.37 | YES |
| 52 | UBA52 | UBA52 | UBA52 | 6460 | 0.074 | 0.37 | YES |
| 53 | RPL19 | RPL19 | RPL19 | 6529 | 0.073 | 0.38 | YES |
| 54 | RPL31 | RPL31 | RPL31 | 6533 | 0.073 | 0.39 | YES |
| 55 | RPL37A | RPL37A | RPL37A | 6541 | 0.072 | 0.39 | YES |
| 56 | RPL24 | RPL24 | RPL24 | 6553 | 0.072 | 0.4 | YES |
| 57 | RPL10A | RPL10A | RPL10A | 6620 | 0.071 | 0.4 | YES |
| 58 | RPS6 | RPS6 | RPS6 | 6753 | 0.068 | 0.41 | YES |
| 59 | RPS24 | RPS24 | RPS24 | 6819 | 0.067 | 0.41 | YES |
| 60 | RPL27A | RPL27A | RPL27A | 6863 | 0.066 | 0.42 | YES |
| 61 | RPS18 | RPS18 | RPS18 | 6948 | 0.065 | 0.42 | YES |
| 62 | SRPRB | SRPRB | SRPRB | 6971 | 0.064 | 0.42 | YES |
| 63 | RPS8 | RPS8 | RPS8 | 6973 | 0.064 | 0.43 | YES |
| 64 | RPL14 | RPL14 | RPL14 | 6977 | 0.064 | 0.44 | YES |
| 65 | RPL13 | RPL13 | RPL13 | 7011 | 0.063 | 0.44 | YES |
| 66 | RPL13A | RPL13A | RPL13A | 7016 | 0.063 | 0.45 | YES |
| 67 | SRPR | SRPR | SRPR | 7135 | 0.061 | 0.45 | YES |
| 68 | SRP19 | SRP19 | SRP19 | 7146 | 0.061 | 0.46 | YES |
| 69 | RPL21 | RPL21 | RPL21 | 7235 | 0.06 | 0.46 | YES |
| 70 | RPL41 | RPL41 | RPL41 | 7246 | 0.059 | 0.46 | YES |
| 71 | RPS15A | RPS15A | RPS15A | 7266 | 0.059 | 0.47 | YES |
| 72 | RPL17 | RPL17 | RPL17 | 7351 | 0.057 | 0.47 | YES |
| 73 | RPL10 | RPL10 | RPL10 | 7371 | 0.057 | 0.48 | YES |
| 74 | RPLP1 | RPLP1 | RPLP1 | 7381 | 0.057 | 0.48 | YES |
| 75 | RPL30 | RPL30 | RPL30 | 7404 | 0.056 | 0.49 | YES |
| 76 | RPL32 | RPL32 | RPL32 | 7418 | 0.056 | 0.49 | YES |
| 77 | RPL35A | RPL35A | RPL35A | 7529 | 0.055 | 0.49 | YES |
| 78 | RPS20 | RPS20 | RPS20 | 7550 | 0.054 | 0.5 | YES |
| 79 | RPS11 | RPS11 | RPS11 | 7562 | 0.054 | 0.5 | YES |
| 80 | RPS4X | RPS4X | RPS4X | 7564 | 0.054 | 0.51 | YES |
| 81 | RPLP0 | RPLP0 | RPLP0 | 7588 | 0.054 | 0.51 | YES |
| 82 | RPS7 | RPS7 | RPS7 | 7607 | 0.053 | 0.52 | YES |
| 83 | RPL3 | RPL3 | RPL3 | 7641 | 0.053 | 0.52 | YES |
| 84 | RPS17 | RPS17 | RPS17 | 7733 | 0.051 | 0.52 | YES |
| 85 | RPL22 | RPL22 | RPL22 | 7901 | 0.048 | 0.52 | NO |
| 86 | RPS2 | RPS2 | RPS2 | 7977 | 0.046 | 0.52 | NO |
| 87 | RPL29 | RPL29 | RPL29 | 8109 | 0.044 | 0.52 | NO |
| 88 | RPL5 | RPL5 | RPL5 | 8164 | 0.043 | 0.52 | NO |
| 89 | RPL6 | RPL6 | RPL6 | 8295 | 0.041 | 0.52 | NO |
| 90 | RPL4 | RPL4 | RPL4 | 8809 | 0.033 | 0.5 | NO |
| 91 | SRP14 | SRP14 | SRP14 | 8818 | 0.033 | 0.5 | NO |
| 92 | SRP54 | SRP54 | SRP54 | 8836 | 0.033 | 0.5 | NO |
| 93 | SPCS1 | SPCS1 | SPCS1 | 8869 | 0.032 | 0.5 | NO |
| 94 | DDOST | DDOST | DDOST | 8896 | 0.032 | 0.5 | NO |
| 95 | RPL15 | RPL15 | RPL15 | 9147 | 0.028 | 0.49 | NO |
| 96 | RPL7 | RPL7 | RPL7 | 9194 | 0.027 | 0.5 | NO |
| 97 | SRP68 | SRP68 | SRP68 | 9695 | 0.02 | 0.47 | NO |
| 98 | RPN1 | RPN1 | RPN1 | 10088 | 0.013 | 0.45 | NO |
| 99 | RPN2 | RPN2 | RPN2 | 10253 | 0.01 | 0.44 | NO |
| 100 | SSR2 | SSR2 | SSR2 | 10335 | 0.0093 | 0.44 | NO |
| 101 | RPL9 | RPL9 | RPL9 | 10500 | 0.0066 | 0.43 | NO |
| 102 | SSR3 | SSR3 | SSR3 | 10527 | 0.0062 | 0.43 | NO |
| 103 | SRP72 | SRP72 | SRP72 | 10553 | 0.0057 | 0.43 | NO |
| 104 | SPCS3 | SPCS3 | SPCS3 | 10634 | 0.0045 | 0.43 | NO |
| 105 | SEC11A | SEC11A | SEC11A | 10672 | 0.0039 | 0.43 | NO |
| 106 | SSR1 | SSR1 | SSR1 | 12183 | -0.02 | 0.35 | NO |
| 107 | SEC61A1 | SEC61A1 | SEC61A1 | 12192 | -0.02 | 0.35 | NO |
| 108 | SRP9 | SRP9 | SRP9 | 12375 | -0.024 | 0.34 | NO |
| 109 | SEC61A2 | SEC61A2 | SEC61A2 | 13330 | -0.041 | 0.3 | NO |
| 110 | TRAM1 | TRAM1 | TRAM1 | 13357 | -0.042 | 0.3 | NO |
Figure S99. Get High-res Image This plot shows mRNAseq_cNMF expression data heatmap (on the left) a RunningEnrichmentScore(RES) plot (on the top right) and a Signal2Noise(S2N) plot (on the bottom right) of genes in the pathway: KEGG PATHOGENIC ESCHERICHIA COLI INFECTION.

Figure S100. Get High-res Image For the top 5 core enriched genes in the pathway: KEGG PATHOGENIC ESCHERICHIA COLI INFECTION, this volcano plot shows how much they are up/down-regulated and significant. The significance was calculated by empirical bayesian fit
For the top enriched genes, if you want to check whether they are
-
up-regulated, please check the list of up-regulated genes
-
down-regulated, please check the list of down-regulated genes
For the top enriched genes, if you want to check whether they are
-
highly expressed genes, please check the list of high (top 30%) expressed genes
-
low expressed genes, please check the list of low (bottom 30%) expressed genes
An expression pattern of top(30%)/middle(30%)/low(30%) in this subtype against other subtypes is available in a heatmap
For the top enriched genes, if you want to check whether they are
-
significantly differently expressed genes by eBayes lm fit, please check the list of significant genes
Table 8. Get Full Table This table shows top 10 pathways which are significantly enriched in cluster clus6. It displays only significant gene sets satisfying nom.p.val.threshold (-1), fwer.p.val.threshold (-1) , fdr.q.val.threshold (0.25) and the default table is sorted by Normalized Enrichment Score (NES). Further details on NES statistics, please visit The Broad GSEA website.
| GeneSet(GS) | Size(#genes) | genes.ES.table | ES | NES | NOM.p.val | FDR.q.val | FWER.p.val | Tag.. | Gene.. | Signal | FDR..median. | glob.p.val |
|---|---|---|---|---|---|---|---|---|---|---|---|---|
| KEGG ALANINE ASPARTATE AND GLUTAMATE METABOLISM | 32 | genes.ES.table | 0.58 | 1.6 | 0.0081 | 0.72 | 0.84 | 0.38 | 0.18 | 0.31 | 0.28 | 0.18 |
| KEGG VALINE LEUCINE AND ISOLEUCINE DEGRADATION | 44 | genes.ES.table | 0.54 | 1.9 | 0.0057 | 0.8 | 0.17 | 0.57 | 0.33 | 0.38 | 0 | 0.15 |
| KEGG GLYCOSYLPHOSPHATIDYLINOSITOL GPI ANCHOR BIOSYNTHESIS | 25 | genes.ES.table | 0.49 | 1.7 | 0.016 | 0.67 | 0.64 | 0.64 | 0.37 | 0.4 | 0.18 | 0.15 |
| KEGG PPAR SIGNALING PATHWAY | 68 | genes.ES.table | 0.6 | 1.7 | 0 | 0.66 | 0.66 | 0.43 | 0.18 | 0.35 | 0.18 | 0.15 |
| KEGG PEROXISOME | 76 | genes.ES.table | 0.49 | 1.8 | 0.012 | 0.57 | 0.51 | 0.45 | 0.26 | 0.33 | 0.12 | 0.13 |
| ST WNT BETA CATENIN PATHWAY | 33 | genes.ES.table | 0.6 | 1.7 | 0.014 | 0.66 | 0.77 | 0.21 | 0.076 | 0.2 | 0.22 | 0.16 |
| PID HNF3BPATHWAY | 44 | genes.ES.table | 0.8 | 1.8 | 0 | 0.7 | 0.35 | 0.48 | 0.078 | 0.44 | 0 | 0.14 |
| PID P75NTRPATHWAY | 69 | genes.ES.table | 0.46 | 1.6 | 0.012 | 0.75 | 0.83 | 0.26 | 0.22 | 0.2 | 0.28 | 0.18 |
| PID SYNDECAN 4 PATHWAY | 31 | genes.ES.table | 0.64 | 1.7 | 0.0058 | 0.68 | 0.76 | 0.39 | 0.18 | 0.32 | 0.22 | 0.16 |
| REACTOME PTM GAMMA CARBOXYLATION HYPUSINE FORMATION AND ARYLSULFATASE ACTIVATION | 25 | genes.ES.table | 0.71 | 1.8 | 0 | 0.52 | 0.41 | 0.24 | 0.034 | 0.23 | 0 | 0.12 |
Table S51. Get Full Table This table shows a Running Enrichment Score (RES) of each gene in this pathway, that is, the enrichment score at this point in the ranked list of genes. All genes are ranked by Signal-to-Noise (S2N), a measure of similarity as default and are used to obtain ES matrix of all genes. In this way, GSEA tool uses expression pattern of not only overlapped genes but also not-overlapped genes to produce ES matrix.
| Rank | GENE | SYMBOL | DESC | LIST.LOC | S2N | RES | CORE_ENRICHMENT |
|---|---|---|---|---|---|---|---|
| 1 | HMGCS2 | HMGCS2 | HMGCS2 | 35 | 1.4 | 0.21 | YES |
| 2 | ALDH1B1 | ALDH1B1 | ALDH1B1 | 1316 | 0.47 | 0.21 | YES |
| 3 | EHHADH | EHHADH | EHHADH | 1811 | 0.39 | 0.24 | YES |
| 4 | BCAT2 | BCAT2 | BCAT2 | 2519 | 0.3 | 0.25 | YES |
| 5 | ABAT | ABAT | ABAT | 2750 | 0.28 | 0.28 | YES |
| 6 | ACAA1 | ACAA1 | ACAA1 | 2769 | 0.28 | 0.32 | YES |
| 7 | ALDH6A1 | ALDH6A1 | ALDH6A1 | 3090 | 0.25 | 0.34 | YES |
| 8 | PCCA | PCCA | PCCA | 3350 | 0.23 | 0.36 | YES |
| 9 | ACAA2 | ACAA2 | ACAA2 | 3504 | 0.22 | 0.38 | YES |
| 10 | HMGCS1 | HMGCS1 | HMGCS1 | 3683 | 0.21 | 0.4 | YES |
| 11 | MCCC1 | MCCC1 | MCCC1 | 3942 | 0.19 | 0.42 | YES |
| 12 | BCAT1 | BCAT1 | BCAT1 | 4093 | 0.18 | 0.43 | YES |
| 13 | ALDH2 | ALDH2 | ALDH2 | 4194 | 0.18 | 0.45 | YES |
| 14 | BCKDHB | BCKDHB | BCKDHB | 4441 | 0.16 | 0.46 | YES |
| 15 | ACADSB | ACADSB | ACADSB | 4648 | 0.15 | 0.48 | YES |
| 16 | ECHS1 | ECHS1 | ECHS1 | 4666 | 0.15 | 0.5 | YES |
| 17 | ALDH3A2 | ALDH3A2 | ALDH3A2 | 4910 | 0.14 | 0.5 | YES |
| 18 | HMGCL | HMGCL | HMGCL | 4983 | 0.13 | 0.52 | YES |
| 19 | HIBCH | HIBCH | HIBCH | 5639 | 0.11 | 0.5 | YES |
| 20 | HIBADH | HIBADH | HIBADH | 5785 | 0.1 | 0.51 | YES |
| 21 | MCEE | MCEE | MCEE | 5791 | 0.1 | 0.52 | YES |
| 22 | OXCT2 | OXCT2 | OXCT2 | 5802 | 0.1 | 0.54 | YES |
| 23 | HADHA | HADHA | HADHA | 6265 | 0.084 | 0.52 | YES |
| 24 | ACAD8 | ACAD8 | ACAD8 | 6345 | 0.082 | 0.53 | YES |
| 25 | ACAT1 | ACAT1 | ACAT1 | 6367 | 0.081 | 0.54 | YES |
| 26 | HADH | HADH | HADH | 6653 | 0.072 | 0.54 | NO |
| 27 | MUT | MUT | MUT | 7857 | 0.037 | 0.48 | NO |
| 28 | DBT | DBT | DBT | 8198 | 0.028 | 0.47 | NO |
| 29 | ALDH7A1 | ALDH7A1 | ALDH7A1 | 8627 | 0.018 | 0.45 | NO |
| 30 | BCKDHA | BCKDHA | BCKDHA | 9085 | 0.0071 | 0.42 | NO |
| 31 | AOX1 | AOX1 | AOX1 | 9142 | 0.006 | 0.42 | NO |
| 32 | MCCC2 | MCCC2 | MCCC2 | 9215 | 0.0042 | 0.42 | NO |
| 33 | IVD | IVD | IVD | 9406 | 0.00026 | 0.41 | NO |
| 34 | ACADS | ACADS | ACADS | 9482 | -0.0016 | 0.41 | NO |
| 35 | HSD17B10 | HSD17B10 | HSD17B10 | 9726 | -0.0069 | 0.39 | NO |
| 36 | DLD | DLD | DLD | 9932 | -0.011 | 0.38 | NO |
| 37 | HADHB | HADHB | HADHB | 10031 | -0.014 | 0.38 | NO |
| 38 | ALDH9A1 | ALDH9A1 | ALDH9A1 | 10541 | -0.025 | 0.36 | NO |
| 39 | PCCB | PCCB | PCCB | 10885 | -0.033 | 0.35 | NO |
| 40 | OXCT1 | OXCT1 | OXCT1 | 11723 | -0.053 | 0.31 | NO |
| 41 | ACADM | ACADM | ACADM | 12509 | -0.073 | 0.28 | NO |
| 42 | ACAT2 | ACAT2 | ACAT2 | 13232 | -0.092 | 0.25 | NO |
| 43 | AUH | AUH | AUH | 13765 | -0.11 | 0.24 | NO |
| 44 | IL4I1 | IL4I1 | IL4I1 | 16526 | -0.24 | 0.13 | NO |
Figure S101. Get High-res Image This plot shows mRNAseq_cNMF expression data heatmap (on the left) a RunningEnrichmentScore(RES) plot (on the top right) and a Signal2Noise(S2N) plot (on the bottom right) of genes in the pathway: KEGG ALANINE ASPARTATE AND GLUTAMATE METABOLISM.

Figure S102. Get High-res Image For the top 5 core enriched genes in the pathway: KEGG ALANINE ASPARTATE AND GLUTAMATE METABOLISM, this volcano plot shows how much they are up/down-regulated and significant. The significance was calculated by empirical bayesian fit

Table S52. Get Full Table This table shows a Running Enrichment Score (RES) of each gene in this pathway, that is, the enrichment score at this point in the ranked list of genes. All genes are ranked by Signal-to-Noise (S2N), a measure of similarity as default and are used to obtain ES matrix of all genes. In this way, GSEA tool uses expression pattern of not only overlapped genes but also not-overlapped genes to produce ES matrix.
| Rank | GENE | SYMBOL | DESC | LIST.LOC | S2N | RES | CORE_ENRICHMENT |
|---|---|---|---|---|---|---|---|
| 1 | FGF17 | FGF17 | FGF17 | 435 | 0.75 | 0.14 | YES |
| 2 | FGF23 | FGF23 | FGF23 | 651 | 0.64 | 0.28 | YES |
| 3 | FGF8 | FGF8 | FGF8 | 993 | 0.54 | 0.38 | YES |
| 4 | FGF20 | FGF20 | FGF20 | 1190 | 0.49 | 0.48 | YES |
| 5 | FGF5 | FGF5 | FGF5 | 1280 | 0.47 | 0.58 | YES |
| 6 | FGF1 | FGF1 | FGF1 | 1451 | 0.44 | 0.67 | YES |
| 7 | PIK3R1 | PIK3R1 | PIK3R1 | 4243 | 0.17 | 0.56 | NO |
| 8 | CUX1 | CUX1 | CUX1 | 5872 | 0.097 | 0.5 | NO |
| 9 | MYO18A | MYO18A | MYO18A | 6110 | 0.089 | 0.5 | NO |
| 10 | FGFR1 | FGFR1 | FGFR1 | 6691 | 0.071 | 0.49 | NO |
| 11 | FGFR1OP2 | FGFR1OP2 | FGFR1OP2 | 7238 | 0.054 | 0.47 | NO |
| 12 | GRB2 | GRB2 | GRB2 | 7340 | 0.051 | 0.48 | NO |
| 13 | FGF4 | FGF4 | FGF4 | 8354 | 0.025 | 0.43 | NO |
| 14 | FGF2 | FGF2 | FGF2 | 8388 | 0.024 | 0.43 | NO |
| 15 | PLCG1 | PLCG1 | PLCG1 | 8675 | 0.017 | 0.42 | NO |
| 16 | ZMYM2 | ZMYM2 | ZMYM2 | 9281 | 0.003 | 0.39 | NO |
| 17 | CPSF6 | CPSF6 | CPSF6 | 9770 | -0.0079 | 0.37 | NO |
| 18 | BCR | BCR | BCR | 9905 | -0.011 | 0.36 | NO |
| 19 | TRIM24 | TRIM24 | TRIM24 | 10428 | -0.022 | 0.34 | NO |
| 20 | PIK3CA | PIK3CA | PIK3CA | 10501 | -0.024 | 0.34 | NO |
| 21 | STAT1 | STAT1 | STAT1 | 10875 | -0.033 | 0.33 | NO |
| 22 | FGF9 | FGF9 | FGF9 | 11848 | -0.056 | 0.29 | NO |
| 23 | STAT3 | STAT3 | STAT3 | 11902 | -0.057 | 0.3 | NO |
| 24 | STAT5B | STAT5B | STAT5B | 12131 | -0.063 | 0.3 | NO |
| 25 | FGFR1OP | FGFR1OP | FGFR1OP | 12338 | -0.069 | 0.31 | NO |
| 26 | STAT5A | STAT5A | STAT5A | 13533 | -0.1 | 0.27 | NO |
| 27 | GAB2 | GAB2 | GAB2 | 13625 | -0.1 | 0.28 | NO |
Figure S103. Get High-res Image This plot shows mRNAseq_cNMF expression data heatmap (on the left) a RunningEnrichmentScore(RES) plot (on the top right) and a Signal2Noise(S2N) plot (on the bottom right) of genes in the pathway: KEGG VALINE LEUCINE AND ISOLEUCINE DEGRADATION.

Figure S104. Get High-res Image For the top 5 core enriched genes in the pathway: KEGG VALINE LEUCINE AND ISOLEUCINE DEGRADATION, this volcano plot shows how much they are up/down-regulated and significant. The significance was calculated by empirical bayesian fit

Table S53. Get Full Table This table shows a Running Enrichment Score (RES) of each gene in this pathway, that is, the enrichment score at this point in the ranked list of genes. All genes are ranked by Signal-to-Noise (S2N), a measure of similarity as default and are used to obtain ES matrix of all genes. In this way, GSEA tool uses expression pattern of not only overlapped genes but also not-overlapped genes to produce ES matrix.
| Rank | GENE | SYMBOL | DESC | LIST.LOC | S2N | RES | CORE_ENRICHMENT |
|---|---|---|---|---|---|---|---|
| 1 | SLC2A2 | SLC2A2 | SLC2A2 | 3 | 1.9 | 0.082 | YES |
| 2 | PDX1 | PDX1 | PDX1 | 36 | 1.4 | 0.14 | YES |
| 3 | HNF1A | HNF1A | HNF1A | 56 | 1.3 | 0.2 | YES |
| 4 | AFP | AFP | AFP | 69 | 1.3 | 0.25 | YES |
| 5 | FOXA2 | FOXA2 | FOXA2 | 75 | 1.3 | 0.31 | YES |
| 6 | TTR | TTR | TTR | 79 | 1.2 | 0.36 | YES |
| 7 | F2 | F2 | F2 | 80 | 1.2 | 0.42 | YES |
| 8 | HNF4A | HNF4A | HNF4A | 110 | 1.2 | 0.46 | YES |
| 9 | FOXA1 | FOXA1 | FOXA1 | 112 | 1.1 | 0.51 | YES |
| 10 | APOA1 | APOA1 | APOA1 | 122 | 1.1 | 0.56 | YES |
| 11 | HNF1B | HNF1B | HNF1B | 190 | 0.98 | 0.6 | YES |
| 12 | PKLR | PKLR | PKLR | 228 | 0.93 | 0.64 | YES |
| 13 | ALB | ALB | ALB | 250 | 0.9 | 0.67 | YES |
| 14 | FOXF1 | FOXF1 | FOXF1 | 584 | 0.67 | 0.68 | YES |
| 15 | IGFBP1 | IGFBP1 | IGFBP1 | 787 | 0.6 | 0.7 | YES |
| 16 | FOXA3 | FOXA3 | FOXA3 | 814 | 0.59 | 0.72 | YES |
| 17 | NKX2-1 | NKX2-1 | NKX2-1 | 908 | 0.56 | 0.74 | YES |
| 18 | ALDOB | ALDOB | ALDOB | 930 | 0.56 | 0.77 | YES |
| 19 | PCK1 | PCK1 | PCK1 | 1063 | 0.52 | 0.78 | YES |
| 20 | BDH1 | BDH1 | BDH1 | 1294 | 0.47 | 0.79 | YES |
| 21 | DLK1 | DLK1 | DLK1 | 1494 | 0.43 | 0.8 | YES |
| 22 | KCNJ11 | KCNJ11 | KCNJ11 | 1945 | 0.37 | 0.79 | NO |
| 23 | GCK | GCK | GCK | 3610 | 0.21 | 0.71 | NO |
| 24 | HMGCS1 | HMGCS1 | HMGCS1 | 3683 | 0.21 | 0.72 | NO |
| 25 | ACADVL | ACADVL | ACADVL | 5595 | 0.11 | 0.62 | NO |
| 26 | AKT1 | AKT1 | AKT1 | 5809 | 0.099 | 0.61 | NO |
| 27 | CEBPA | CEBPA | CEBPA | 6537 | 0.075 | 0.58 | NO |
| 28 | HADH | HADH | HADH | 6653 | 0.072 | 0.58 | NO |
| 29 | CEBPB | CEBPB | CEBPB | 7329 | 0.052 | 0.54 | NO |
| 30 | NF1 | NF1 | NF1 | 7807 | 0.038 | 0.52 | NO |
| 31 | NR3C1 | NR3C1 | NR3C1 | 7889 | 0.036 | 0.52 | NO |
| 32 | ALAS1 | ALAS1 | ALAS1 | 8216 | 0.028 | 0.5 | NO |
| 33 | CPT1B | CPT1B | CPT1B | 9016 | 0.009 | 0.46 | NO |
| 34 | SP1 | SP1 | SP1 | 10212 | -0.018 | 0.4 | NO |
| 35 | TFRC | TFRC | TFRC | 10814 | -0.032 | 0.37 | NO |
| 36 | CREB1 | CREB1 | CREB1 | 10857 | -0.033 | 0.37 | NO |
| 37 | CPT1C | CPT1C | CPT1C | 12323 | -0.068 | 0.29 | NO |
| 38 | ACADM | ACADM | ACADM | 12509 | -0.073 | 0.28 | NO |
| 39 | CEBPD | CEBPD | CEBPD | 13389 | -0.096 | 0.24 | NO |
| 40 | UCP2 | UCP2 | UCP2 | 13797 | -0.11 | 0.23 | NO |
| 41 | TAT | TAT | TAT | 14806 | -0.14 | 0.18 | NO |
| 42 | CPT1A | CPT1A | CPT1A | 16710 | -0.26 | 0.091 | NO |
| 43 | ABCC8 | ABCC8 | ABCC8 | 16834 | -0.27 | 0.096 | NO |
| 44 | G6PC | G6PC | G6PC | 18258 | -0.48 | 0.042 | NO |
Figure S105. Get High-res Image This plot shows mRNAseq_cNMF expression data heatmap (on the left) a RunningEnrichmentScore(RES) plot (on the top right) and a Signal2Noise(S2N) plot (on the bottom right) of genes in the pathway: KEGG GLYCOSYLPHOSPHATIDYLINOSITOL GPI ANCHOR BIOSYNTHESIS.

Figure S106. Get High-res Image For the top 5 core enriched genes in the pathway: KEGG GLYCOSYLPHOSPHATIDYLINOSITOL GPI ANCHOR BIOSYNTHESIS, this volcano plot shows how much they are up/down-regulated and significant. The significance was calculated by empirical bayesian fit
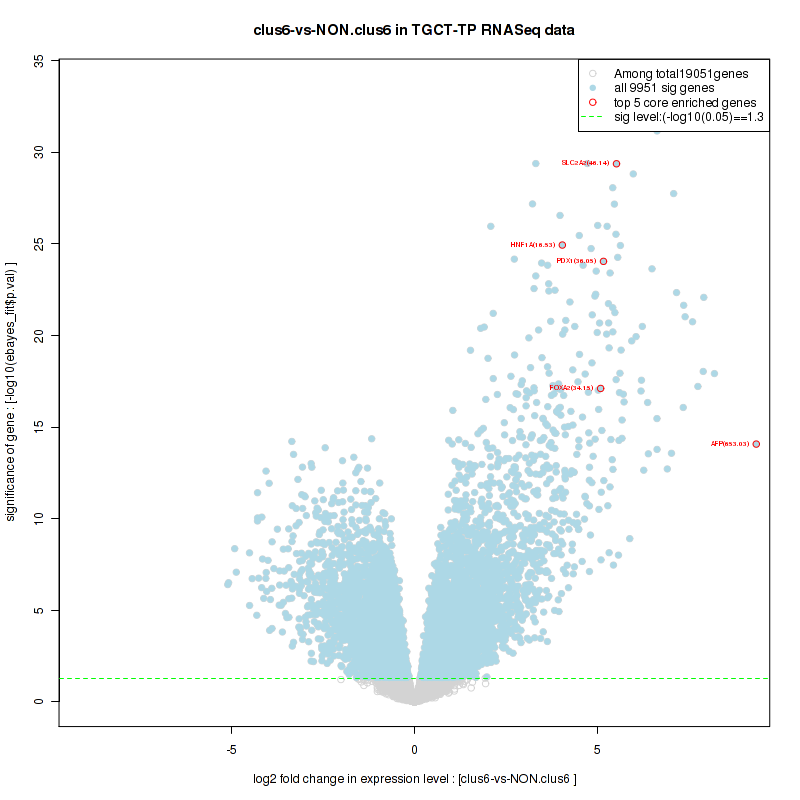
Table S54. Get Full Table This table shows a Running Enrichment Score (RES) of each gene in this pathway, that is, the enrichment score at this point in the ranked list of genes. All genes are ranked by Signal-to-Noise (S2N), a measure of similarity as default and are used to obtain ES matrix of all genes. In this way, GSEA tool uses expression pattern of not only overlapped genes but also not-overlapped genes to produce ES matrix.
| Rank | GENE | SYMBOL | DESC | LIST.LOC | S2N | RES | CORE_ENRICHMENT |
|---|---|---|---|---|---|---|---|
| 1 | SEMA6D | SEMA6D | SEMA6D | 843 | 0.58 | 0.12 | YES |
| 2 | PGAP1 | PGAP1 | PGAP1 | 1467 | 0.44 | 0.2 | YES |
| 3 | PIGF | PIGF | PIGF | 2793 | 0.28 | 0.21 | YES |
| 4 | PIGQ | PIGQ | PIGQ | 3393 | 0.23 | 0.24 | YES |
| 5 | PIGU | PIGU | PIGU | 3482 | 0.22 | 0.3 | YES |
| 6 | PIGS | PIGS | PIGS | 3759 | 0.2 | 0.34 | YES |
| 7 | PLAUR | PLAUR | PLAUR | 4046 | 0.18 | 0.37 | YES |
| 8 | PIGT | PIGT | PIGT | 4616 | 0.15 | 0.39 | YES |
| 9 | PIGX | PIGX | PIGX | 4946 | 0.14 | 0.41 | YES |
| 10 | PIGM | PIGM | PIGM | 5507 | 0.11 | 0.41 | YES |
| 11 | PIGK | PIGK | PIGK | 5779 | 0.1 | 0.42 | YES |
| 12 | PIGN | PIGN | PIGN | 5807 | 0.099 | 0.45 | YES |
| 13 | DPM3 | DPM3 | DPM3 | 5957 | 0.094 | 0.46 | YES |
| 14 | GPAA1 | GPAA1 | GPAA1 | 6146 | 0.088 | 0.48 | YES |
| 15 | DPM1 | DPM1 | DPM1 | 6385 | 0.08 | 0.49 | YES |
| 16 | PIGC | PIGC | PIGC | 6479 | 0.077 | 0.5 | YES |
| 17 | PIGO | PIGO | PIGO | 6959 | 0.063 | 0.5 | YES |
| 18 | DPM2 | DPM2 | DPM2 | 7044 | 0.06 | 0.51 | YES |
| 19 | PIGA | PIGA | PIGA | 8583 | 0.019 | 0.43 | NO |
| 20 | PIGV | PIGV | PIGV | 9882 | -0.01 | 0.37 | NO |
| 21 | PIGW | PIGW | PIGW | 10598 | -0.027 | 0.34 | NO |
| 22 | PIGH | PIGH | PIGH | 10684 | -0.029 | 0.34 | NO |
| 23 | PIGG | PIGG | PIGG | 10865 | -0.033 | 0.34 | NO |
| 24 | PIGP | PIGP | PIGP | 11929 | -0.058 | 0.3 | NO |
| 25 | PIGB | PIGB | PIGB | 13505 | -0.099 | 0.25 | NO |
| 26 | PIGL | PIGL | PIGL | 15200 | -0.16 | 0.2 | NO |
Figure S107. Get High-res Image This plot shows mRNAseq_cNMF expression data heatmap (on the left) a RunningEnrichmentScore(RES) plot (on the top right) and a Signal2Noise(S2N) plot (on the bottom right) of genes in the pathway: KEGG PPAR SIGNALING PATHWAY.

Figure S108. Get High-res Image For the top 5 core enriched genes in the pathway: KEGG PPAR SIGNALING PATHWAY, this volcano plot shows how much they are up/down-regulated and significant. The significance was calculated by empirical bayesian fit
Table S55. Get Full Table This table shows a Running Enrichment Score (RES) of each gene in this pathway, that is, the enrichment score at this point in the ranked list of genes. All genes are ranked by Signal-to-Noise (S2N), a measure of similarity as default and are used to obtain ES matrix of all genes. In this way, GSEA tool uses expression pattern of not only overlapped genes but also not-overlapped genes to produce ES matrix.
| Rank | GENE | SYMBOL | DESC | LIST.LOC | S2N | RES | CORE_ENRICHMENT |
|---|---|---|---|---|---|---|---|
| 1 | F7 | F7 | F7 | 53 | 1.4 | 0.16 | YES |
| 2 | F2 | F2 | F2 | 80 | 1.2 | 0.32 | YES |
| 3 | PROC | PROC | PROC | 154 | 1 | 0.44 | YES |
| 4 | F10 | F10 | F10 | 182 | 0.99 | 0.57 | YES |
| 5 | ARSE | ARSE | ARSE | 565 | 0.68 | 0.63 | YES |
| 6 | PROZ | PROZ | PROZ | 639 | 0.65 | 0.71 | YES |
| 7 | ARSI | ARSI | ARSI | 3408 | 0.23 | 0.59 | NO |
| 8 | ARSH | ARSH | ARSH | 4251 | 0.17 | 0.57 | NO |
| 9 | ARSA | ARSA | ARSA | 4569 | 0.15 | 0.57 | NO |
| 10 | SUMF1 | SUMF1 | SUMF1 | 4686 | 0.15 | 0.58 | NO |
| 11 | ARSJ | ARSJ | ARSJ | 4807 | 0.14 | 0.6 | NO |
| 12 | GGCX | GGCX | GGCX | 4971 | 0.14 | 0.6 | NO |
| 13 | ARSK | ARSK | ARSK | 5475 | 0.11 | 0.59 | NO |
| 14 | EIF5A2 | EIF5A2 | EIF5A2 | 5599 | 0.11 | 0.6 | NO |
| 15 | PROS1 | PROS1 | PROS1 | 5978 | 0.093 | 0.59 | NO |
| 16 | FURIN | FURIN | FURIN | 6349 | 0.082 | 0.58 | NO |
| 17 | ARSB | ARSB | ARSB | 6685 | 0.071 | 0.57 | NO |
| 18 | EIF5A | EIF5A | EIF5A | 8069 | 0.032 | 0.5 | NO |
| 19 | STS | STS | STS | 8402 | 0.024 | 0.49 | NO |
| 20 | SUMF2 | SUMF2 | SUMF2 | 8469 | 0.022 | 0.49 | NO |
| 21 | VKORC1 | VKORC1 | VKORC1 | 8888 | 0.013 | 0.47 | NO |
| 22 | ARSG | ARSG | ARSG | 9214 | 0.0042 | 0.45 | NO |
| 23 | DOHH | DOHH | DOHH | 11776 | -0.054 | 0.32 | NO |
| 24 | DHPS | DHPS | DHPS | 12735 | -0.079 | 0.28 | NO |
| 25 | ARSF | ARSF | ARSF | 17911 | -0.4 | 0.06 | NO |
Figure S109. Get High-res Image This plot shows mRNAseq_cNMF expression data heatmap (on the left) a RunningEnrichmentScore(RES) plot (on the top right) and a Signal2Noise(S2N) plot (on the bottom right) of genes in the pathway: KEGG PEROXISOME.

Figure S110. Get High-res Image For the top 5 core enriched genes in the pathway: KEGG PEROXISOME, this volcano plot shows how much they are up/down-regulated and significant. The significance was calculated by empirical bayesian fit

Table S56. Get Full Table This table shows a Running Enrichment Score (RES) of each gene in this pathway, that is, the enrichment score at this point in the ranked list of genes. All genes are ranked by Signal-to-Noise (S2N), a measure of similarity as default and are used to obtain ES matrix of all genes. In this way, GSEA tool uses expression pattern of not only overlapped genes but also not-overlapped genes to produce ES matrix.
| Rank | GENE | SYMBOL | DESC | LIST.LOC | S2N | RES | CORE_ENRICHMENT |
|---|---|---|---|---|---|---|---|
| 1 | FABP1 | FABP1 | FABP1 | 17 | 1.6 | 0.063 | YES |
| 2 | APOA2 | APOA2 | APOA2 | 31 | 1.4 | 0.12 | YES |
| 3 | HMGCS2 | HMGCS2 | HMGCS2 | 35 | 1.4 | 0.18 | YES |
| 4 | SULT2A1 | SULT2A1 | SULT2A1 | 50 | 1.4 | 0.23 | YES |
| 5 | AGT | AGT | AGT | 98 | 1.2 | 0.28 | YES |
| 6 | APOA1 | APOA1 | APOA1 | 122 | 1.1 | 0.32 | YES |
| 7 | ANKRD1 | ANKRD1 | ANKRD1 | 161 | 1 | 0.36 | YES |
| 8 | APOA5 | APOA5 | APOA5 | 214 | 0.95 | 0.4 | YES |
| 9 | PPARGC1A | PPARGC1A | PPARGC1A | 384 | 0.79 | 0.42 | YES |
| 10 | CYP4A11 | CYP4A11 | CYP4A11 | 750 | 0.61 | 0.43 | YES |
| 11 | TEAD3 | TEAD3 | TEAD3 | 1475 | 0.44 | 0.41 | YES |
| 12 | SMARCD3 | SMARCD3 | SMARCD3 | 1543 | 0.43 | 0.42 | YES |
| 13 | CD36 | CD36 | CD36 | 1602 | 0.42 | 0.44 | YES |
| 14 | FADS1 | FADS1 | FADS1 | 2123 | 0.35 | 0.42 | YES |
| 15 | ABCB4 | ABCB4 | ABCB4 | 2190 | 0.34 | 0.44 | YES |
| 16 | RXRA | RXRA | RXRA | 2231 | 0.34 | 0.45 | YES |
| 17 | MED12 | MED12 | MED12 | 2381 | 0.32 | 0.45 | YES |
| 18 | G0S2 | G0S2 | G0S2 | 2505 | 0.3 | 0.46 | YES |
| 19 | YAP1 | YAP1 | YAP1 | 2561 | 0.3 | 0.47 | YES |
| 20 | WWTR1 | WWTR1 | WWTR1 | 2640 | 0.29 | 0.48 | YES |
| 21 | CTGF | CTGF | CTGF | 3002 | 0.26 | 0.47 | NO |
| 22 | NPAS2 | NPAS2 | NPAS2 | 3481 | 0.22 | 0.45 | NO |
| 23 | PPARA | PPARA | PPARA | 3607 | 0.21 | 0.45 | NO |
| 24 | MED30 | MED30 | MED30 | 3623 | 0.21 | 0.46 | NO |
| 25 | HMGCS1 | HMGCS1 | HMGCS1 | 3683 | 0.21 | 0.47 | NO |
| 26 | MED22 | MED22 | MED22 | 4582 | 0.15 | 0.42 | NO |
| 27 | TEAD1 | TEAD1 | TEAD1 | 4625 | 0.15 | 0.43 | NO |
| 28 | ME1 | ME1 | ME1 | 4679 | 0.15 | 0.43 | NO |
| 29 | UGT1A9 | UGT1A9 | UGT1A9 | 4773 | 0.14 | 0.43 | NO |
| 30 | MED14 | MED14 | MED14 | 4903 | 0.14 | 0.43 | NO |
| 31 | TBL1XR1 | TBL1XR1 | TBL1XR1 | 5420 | 0.12 | 0.41 | NO |
| 32 | RORA | RORA | RORA | 5648 | 0.1 | 0.4 | NO |
| 33 | MED16 | MED16 | MED16 | 5984 | 0.093 | 0.39 | NO |
| 34 | MED8 | MED8 | MED8 | 6060 | 0.091 | 0.39 | NO |
| 35 | CDK19 | CDK19 | CDK19 | 6264 | 0.084 | 0.38 | NO |
| 36 | MED10 | MED10 | MED10 | 6467 | 0.078 | 0.37 | NO |
| 37 | ESRRA | ESRRA | ESRRA | 6793 | 0.068 | 0.36 | NO |
| 38 | PLIN2 | PLIN2 | PLIN2 | 7168 | 0.056 | 0.34 | NO |
| 39 | HDAC3 | HDAC3 | HDAC3 | 7350 | 0.051 | 0.33 | NO |
| 40 | MED24 | MED24 | MED24 | 7448 | 0.048 | 0.33 | NO |
| 41 | MED17 | MED17 | MED17 | 7620 | 0.044 | 0.32 | NO |
| 42 | CCNC | CCNC | CCNC | 7771 | 0.039 | 0.32 | NO |
| 43 | MED11 | MED11 | MED11 | 7830 | 0.038 | 0.32 | NO |
| 44 | MED27 | MED27 | MED27 | 7840 | 0.038 | 0.32 | NO |
| 45 | PRIC285 | PRIC285 | PRIC285 | 8209 | 0.028 | 0.3 | NO |
| 46 | ALAS1 | ALAS1 | ALAS1 | 8216 | 0.028 | 0.3 | NO |
| 47 | MED13L | MED13L | MED13L | 8436 | 0.023 | 0.29 | NO |
| 48 | MED6 | MED6 | MED6 | 8451 | 0.022 | 0.29 | NO |
| 49 | CDK8 | CDK8 | CDK8 | 8474 | 0.022 | 0.29 | NO |
| 50 | MED19 | MED19 | MED19 | 8705 | 0.017 | 0.28 | NO |
| 51 | TNFRSF21 | TNFRSF21 | TNFRSF21 | 8733 | 0.016 | 0.28 | NO |
| 52 | NCOR1 | NCOR1 | NCOR1 | 8808 | 0.014 | 0.27 | NO |
| 53 | NFYB | NFYB | NFYB | 8980 | 0.01 | 0.26 | NO |
| 54 | GLIPR1 | GLIPR1 | GLIPR1 | 9008 | 0.0092 | 0.26 | NO |
| 55 | NCOA6 | NCOA6 | NCOA6 | 9151 | 0.0059 | 0.26 | NO |
| 56 | CPT2 | CPT2 | CPT2 | 9220 | 0.0041 | 0.25 | NO |
| 57 | MED1 | MED1 | MED1 | 9247 | 0.0036 | 0.25 | NO |
| 58 | ABCA1 | ABCA1 | ABCA1 | 9345 | 0.0018 | 0.25 | NO |
| 59 | MED31 | MED31 | MED31 | 9395 | 0.00052 | 0.24 | NO |
| 60 | ACOX1 | ACOX1 | ACOX1 | 9577 | -0.0037 | 0.23 | NO |
| 61 | MED29 | MED29 | MED29 | 9637 | -0.005 | 0.23 | NO |
| 62 | PEX11A | PEX11A | PEX11A | 9812 | -0.0087 | 0.22 | NO |
| 63 | SREBF2 | SREBF2 | SREBF2 | 10137 | -0.016 | 0.21 | NO |
| 64 | MED21 | MED21 | MED21 | 10451 | -0.023 | 0.19 | NO |
| 65 | CREBBP | CREBBP | CREBBP | 10586 | -0.026 | 0.18 | NO |
| 66 | FHL2 | FHL2 | FHL2 | 10787 | -0.031 | 0.18 | NO |
| 67 | MED7 | MED7 | MED7 | 11023 | -0.036 | 0.16 | NO |
| 68 | SLC27A1 | SLC27A1 | SLC27A1 | 11106 | -0.038 | 0.16 | NO |
| 69 | MED18 | MED18 | MED18 | 11181 | -0.04 | 0.16 | NO |
| 70 | NRF1 | NRF1 | NRF1 | 11445 | -0.047 | 0.15 | NO |
| 71 | NFYA | NFYA | NFYA | 11913 | -0.057 | 0.12 | NO |
| 72 | ACSL1 | ACSL1 | ACSL1 | 12308 | -0.068 | 0.11 | NO |
| 73 | MED20 | MED20 | MED20 | 12322 | -0.068 | 0.11 | NO |
| 74 | HMGCR | HMGCR | HMGCR | 12438 | -0.071 | 0.11 | NO |
| 75 | ACADM | ACADM | ACADM | 12509 | -0.073 | 0.11 | NO |
| 76 | MED25 | MED25 | MED25 | 12658 | -0.077 | 0.1 | NO |
| 77 | PPARG | PPARG | PPARG | 12817 | -0.08 | 0.096 | NO |
| 78 | NCOA3 | NCOA3 | NCOA3 | 13071 | -0.088 | 0.086 | NO |
| 79 | MED4 | MED4 | MED4 | 13163 | -0.09 | 0.085 | NO |
| 80 | NCOA1 | NCOA1 | NCOA1 | 13404 | -0.096 | 0.076 | NO |
| 81 | MED9 | MED9 | MED9 | 13744 | -0.11 | 0.063 | NO |
| 82 | MED23 | MED23 | MED23 | 13886 | -0.11 | 0.06 | NO |
| 83 | TEAD2 | TEAD2 | TEAD2 | 14146 | -0.12 | 0.051 | NO |
| 84 | TBL1X | TBL1X | TBL1X | 14209 | -0.12 | 0.053 | NO |
| 85 | TRIB3 | TRIB3 | TRIB3 | 14272 | -0.12 | 0.055 | NO |
| 86 | SREBF1 | SREBF1 | SREBF1 | 14442 | -0.13 | 0.051 | NO |
| 87 | EP300 | EP300 | EP300 | 14932 | -0.15 | 0.031 | NO |
| 88 | ANGPTL4 | ANGPTL4 | ANGPTL4 | 15268 | -0.17 | 0.021 | NO |
| 89 | TEAD4 | TEAD4 | TEAD4 | 15347 | -0.17 | 0.024 | NO |
| 90 | MED15 | MED15 | MED15 | 15425 | -0.18 | 0.027 | NO |
| 91 | ARNTL | ARNTL | ARNTL | 15458 | -0.18 | 0.032 | NO |
| 92 | FDFT1 | FDFT1 | FDFT1 | 15605 | -0.18 | 0.032 | NO |
| 93 | NR1D1 | NR1D1 | NR1D1 | 15637 | -0.19 | 0.038 | NO |
| 94 | TXNRD1 | TXNRD1 | TXNRD1 | 15876 | -0.2 | 0.034 | NO |
| 95 | CYP7A1 | CYP7A1 | CYP7A1 | 16200 | -0.22 | 0.026 | NO |
| 96 | MED26 | MED26 | MED26 | 16309 | -0.23 | 0.029 | NO |
| 97 | GRHL1 | GRHL1 | GRHL1 | 16405 | -0.24 | 0.034 | NO |
| 98 | CPT1A | CPT1A | CPT1A | 16710 | -0.26 | 0.029 | NO |
| 99 | CYP1A1 | CYP1A1 | CYP1A1 | 16944 | -0.28 | 0.028 | NO |
| 100 | TGS1 | TGS1 | TGS1 | 17032 | -0.29 | 0.035 | NO |
| 101 | TIAM2 | TIAM2 | TIAM2 | 17219 | -0.31 | 0.038 | NO |
| 102 | CLOCK | CLOCK | CLOCK | 17837 | -0.39 | 0.021 | NO |
| 103 | NCOA2 | NCOA2 | NCOA2 | 17942 | -0.4 | 0.032 | NO |
| 104 | PPARGC1B | PPARGC1B | PPARGC1B | 18738 | -0.64 | 0.016 | NO |
Figure S111. Get High-res Image This plot shows mRNAseq_cNMF expression data heatmap (on the left) a RunningEnrichmentScore(RES) plot (on the top right) and a Signal2Noise(S2N) plot (on the bottom right) of genes in the pathway: ST WNT BETA CATENIN PATHWAY.
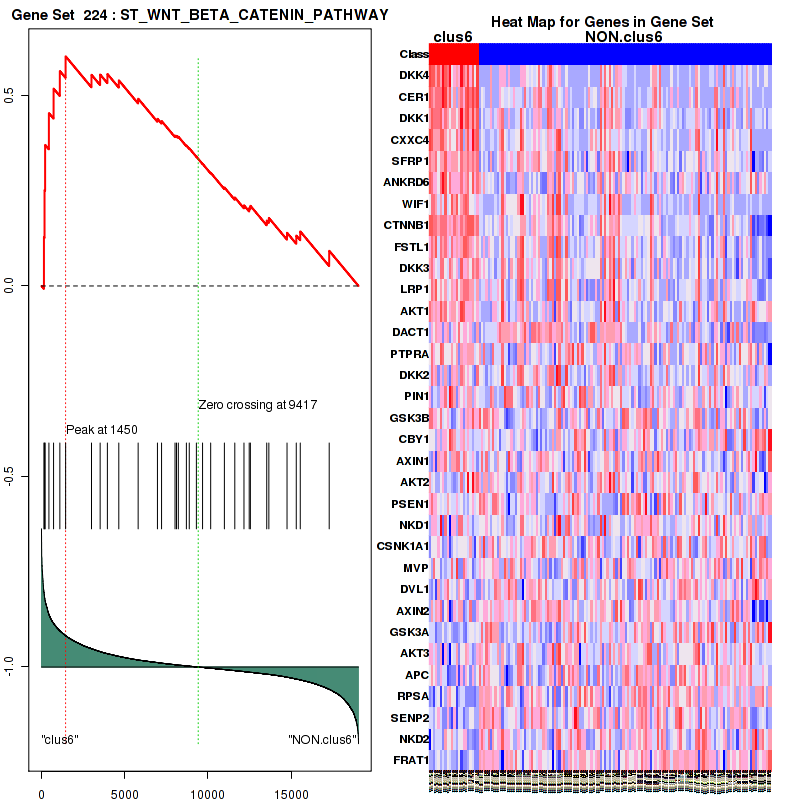
Figure S112. Get High-res Image For the top 5 core enriched genes in the pathway: ST WNT BETA CATENIN PATHWAY, this volcano plot shows how much they are up/down-regulated and significant. The significance was calculated by empirical bayesian fit

Table S57. Get Full Table This table shows a Running Enrichment Score (RES) of each gene in this pathway, that is, the enrichment score at this point in the ranked list of genes. All genes are ranked by Signal-to-Noise (S2N), a measure of similarity as default and are used to obtain ES matrix of all genes. In this way, GSEA tool uses expression pattern of not only overlapped genes but also not-overlapped genes to produce ES matrix.
| Rank | GENE | SYMBOL | DESC | LIST.LOC | S2N | RES | CORE_ENRICHMENT |
|---|---|---|---|---|---|---|---|
| 1 | AGXT | AGXT | AGXT | 9 | 1.7 | 0.1 | YES |
| 2 | ACOX2 | ACOX2 | ACOX2 | 240 | 0.91 | 0.15 | YES |
| 3 | SLC27A2 | SLC27A2 | SLC27A2 | 279 | 0.88 | 0.2 | YES |
| 4 | HAO2 | HAO2 | HAO2 | 421 | 0.76 | 0.24 | YES |
| 5 | BAAT | BAAT | BAAT | 1105 | 0.51 | 0.23 | YES |
| 6 | EPHX2 | EPHX2 | EPHX2 | 1155 | 0.5 | 0.26 | YES |
| 7 | NOS2 | NOS2 | NOS2 | 1398 | 0.45 | 0.27 | YES |
| 8 | XDH | XDH | XDH | 1425 | 0.45 | 0.3 | YES |
| 9 | EHHADH | EHHADH | EHHADH | 1811 | 0.39 | 0.3 | YES |
| 10 | DAO | DAO | DAO | 1878 | 0.38 | 0.32 | YES |
| 11 | PXMP2 | PXMP2 | PXMP2 | 2107 | 0.35 | 0.33 | YES |
| 12 | PHYH | PHYH | PHYH | 2125 | 0.35 | 0.35 | YES |
| 13 | PIPOX | PIPOX | PIPOX | 2191 | 0.34 | 0.36 | YES |
| 14 | FAR2 | FAR2 | FAR2 | 2340 | 0.32 | 0.38 | YES |
| 15 | PEX11G | PEX11G | PEX11G | 2402 | 0.32 | 0.39 | YES |
| 16 | PAOX | PAOX | PAOX | 2578 | 0.3 | 0.4 | YES |
| 17 | CRAT | CRAT | CRAT | 2720 | 0.28 | 0.41 | YES |
| 18 | ACOX3 | ACOX3 | ACOX3 | 2766 | 0.28 | 0.42 | YES |
| 19 | ACAA1 | ACAA1 | ACAA1 | 2769 | 0.28 | 0.44 | YES |
| 20 | AMACR | AMACR | AMACR | 2776 | 0.28 | 0.46 | YES |
| 21 | CROT | CROT | CROT | 2819 | 0.27 | 0.47 | YES |
| 22 | ACSL5 | ACSL5 | ACSL5 | 3328 | 0.23 | 0.46 | YES |
| 23 | DDO | DDO | DDO | 3427 | 0.22 | 0.47 | YES |
| 24 | MLYCD | MLYCD | MLYCD | 3786 | 0.2 | 0.46 | YES |
| 25 | GSTK1 | GSTK1 | GSTK1 | 3823 | 0.2 | 0.47 | YES |
| 26 | AGPS | AGPS | AGPS | 4106 | 0.18 | 0.47 | YES |
| 27 | IDH2 | IDH2 | IDH2 | 4156 | 0.18 | 0.47 | YES |
| 28 | IDH1 | IDH1 | IDH1 | 4372 | 0.16 | 0.47 | YES |
| 29 | GNPAT | GNPAT | GNPAT | 4432 | 0.16 | 0.48 | YES |
| 30 | ABCD1 | ABCD1 | ABCD1 | 4455 | 0.16 | 0.49 | YES |
| 31 | DECR2 | DECR2 | DECR2 | 4556 | 0.16 | 0.49 | YES |
| 32 | PECR | PECR | PECR | 4712 | 0.15 | 0.49 | YES |
| 33 | PEX10 | PEX10 | PEX10 | 4834 | 0.14 | 0.49 | YES |
| 34 | HMGCL | HMGCL | HMGCL | 4983 | 0.13 | 0.49 | YES |
| 35 | PEX6 | PEX6 | PEX6 | 5201 | 0.12 | 0.49 | NO |
| 36 | NUDT12 | NUDT12 | NUDT12 | 5569 | 0.11 | 0.48 | NO |
| 37 | PRDX5 | PRDX5 | PRDX5 | 5758 | 0.1 | 0.47 | NO |
| 38 | ABCD3 | ABCD3 | ABCD3 | 5916 | 0.096 | 0.47 | NO |
| 39 | PEX13 | PEX13 | PEX13 | 5953 | 0.094 | 0.48 | NO |
| 40 | DHRS4 | DHRS4 | DHRS4 | 6717 | 0.07 | 0.44 | NO |
| 41 | PEX19 | PEX19 | PEX19 | 6769 | 0.068 | 0.44 | NO |
| 42 | SCP2 | SCP2 | SCP2 | 6770 | 0.068 | 0.44 | NO |
| 43 | PXMP4 | PXMP4 | PXMP4 | 6891 | 0.065 | 0.44 | NO |
| 44 | ECH1 | ECH1 | ECH1 | 7071 | 0.059 | 0.44 | NO |
| 45 | FAR1 | FAR1 | FAR1 | 7397 | 0.05 | 0.42 | NO |
| 46 | CAT | CAT | CAT | 7545 | 0.046 | 0.42 | NO |
| 47 | HACL1 | HACL1 | HACL1 | 8309 | 0.026 | 0.38 | NO |
| 48 | PEX16 | PEX16 | PEX16 | 8453 | 0.022 | 0.37 | NO |
| 49 | NUDT19 | NUDT19 | NUDT19 | 8803 | 0.014 | 0.35 | NO |
| 50 | PMVK | PMVK | PMVK | 8977 | 0.01 | 0.35 | NO |
| 51 | PEX11B | PEX11B | PEX11B | 9322 | 0.0023 | 0.33 | NO |
| 52 | HSD17B4 | HSD17B4 | HSD17B4 | 9380 | 0.00082 | 0.32 | NO |
| 53 | PEX7 | PEX7 | PEX7 | 9516 | -0.0023 | 0.32 | NO |
| 54 | ACOX1 | ACOX1 | ACOX1 | 9577 | -0.0037 | 0.32 | NO |
| 55 | PEX26 | PEX26 | PEX26 | 9769 | -0.0078 | 0.3 | NO |
| 56 | PEX11A | PEX11A | PEX11A | 9812 | -0.0087 | 0.3 | NO |
| 57 | PEX14 | PEX14 | PEX14 | 10248 | -0.018 | 0.28 | NO |
| 58 | MPV17 | MPV17 | MPV17 | 10280 | -0.019 | 0.28 | NO |
| 59 | PEX12 | PEX12 | PEX12 | 11099 | -0.038 | 0.24 | NO |
| 60 | PEX5 | PEX5 | PEX5 | 11983 | -0.059 | 0.2 | NO |
| 61 | ACSL1 | ACSL1 | ACSL1 | 12308 | -0.068 | 0.18 | NO |
| 62 | ACOT8 | ACOT8 | ACOT8 | 12437 | -0.071 | 0.18 | NO |
| 63 | PEX1 | PEX1 | PEX1 | 12569 | -0.075 | 0.18 | NO |
| 64 | PRDX1 | PRDX1 | PRDX1 | 13103 | -0.089 | 0.16 | NO |
| 65 | ABCD4 | ABCD4 | ABCD4 | 13228 | -0.092 | 0.16 | NO |
| 66 | ACSL3 | ACSL3 | ACSL3 | 13591 | -0.1 | 0.14 | NO |
| 67 | PEX2 | PEX2 | PEX2 | 13742 | -0.11 | 0.14 | NO |
| 68 | PEX3 | PEX3 | PEX3 | 14208 | -0.12 | 0.12 | NO |
| 69 | MVK | MVK | MVK | 14261 | -0.12 | 0.13 | NO |
| 70 | SLC25A17 | SLC25A17 | SLC25A17 | 14910 | -0.15 | 0.1 | NO |
| 71 | SOD1 | SOD1 | SOD1 | 14959 | -0.15 | 0.11 | NO |
| 72 | SOD2 | SOD2 | SOD2 | 15213 | -0.16 | 0.11 | NO |
| 73 | ACSL4 | ACSL4 | ACSL4 | 16147 | -0.22 | 0.071 | NO |
| 74 | MPV17L | MPV17L | MPV17L | 17173 | -0.3 | 0.035 | NO |
| 75 | ABCD2 | ABCD2 | ABCD2 | 18145 | -0.45 | 0.01 | NO |
| 76 | ACSL6 | ACSL6 | ACSL6 | 18700 | -0.62 | 0.018 | NO |
Figure S113. Get High-res Image This plot shows mRNAseq_cNMF expression data heatmap (on the left) a RunningEnrichmentScore(RES) plot (on the top right) and a Signal2Noise(S2N) plot (on the bottom right) of genes in the pathway: PID HNF3BPATHWAY.

Figure S114. Get High-res Image For the top 5 core enriched genes in the pathway: PID HNF3BPATHWAY, this volcano plot shows how much they are up/down-regulated and significant. The significance was calculated by empirical bayesian fit

Table S58. Get Full Table This table shows a Running Enrichment Score (RES) of each gene in this pathway, that is, the enrichment score at this point in the ranked list of genes. All genes are ranked by Signal-to-Noise (S2N), a measure of similarity as default and are used to obtain ES matrix of all genes. In this way, GSEA tool uses expression pattern of not only overlapped genes but also not-overlapped genes to produce ES matrix.
| Rank | GENE | SYMBOL | DESC | LIST.LOC | S2N | RES | CORE_ENRICHMENT |
|---|---|---|---|---|---|---|---|
| 1 | APOC3 | APOC3 | APOC3 | 4 | 1.8 | 0.091 | YES |
| 2 | APOA2 | APOA2 | APOA2 | 31 | 1.4 | 0.16 | YES |
| 3 | AMN | AMN | AMN | 34 | 1.4 | 0.23 | YES |
| 4 | ABCG8 | ABCG8 | ABCG8 | 37 | 1.4 | 0.3 | YES |
| 5 | MTTP | MTTP | MTTP | 41 | 1.4 | 0.37 | YES |
| 6 | APOB | APOB | APOB | 51 | 1.4 | 0.44 | YES |
| 7 | LIPC | LIPC | LIPC | 102 | 1.2 | 0.49 | YES |
| 8 | APOA1 | APOA1 | APOA1 | 122 | 1.1 | 0.55 | YES |
| 9 | APOA5 | APOA5 | APOA5 | 214 | 0.95 | 0.59 | YES |
| 10 | CUBN | CUBN | CUBN | 222 | 0.93 | 0.63 | YES |
| 11 | ALB | ALB | ALB | 250 | 0.9 | 0.68 | YES |
| 12 | PNLIPRP2 | PNLIPRP2 | PNLIPRP2 | 357 | 0.81 | 0.71 | YES |
| 13 | APOC2 | APOC2 | APOC2 | 1214 | 0.49 | 0.69 | NO |
| 14 | SDC1 | SDC1 | SDC1 | 1629 | 0.41 | 0.69 | NO |
| 15 | HSPG2 | HSPG2 | HSPG2 | 2530 | 0.3 | 0.66 | NO |
| 16 | SCARB1 | SCARB1 | SCARB1 | 2541 | 0.3 | 0.67 | NO |
| 17 | LDLR | LDLR | LDLR | 2553 | 0.3 | 0.68 | NO |
| 18 | BMP1 | BMP1 | BMP1 | 2799 | 0.28 | 0.68 | NO |
| 19 | LPL | LPL | LPL | 3004 | 0.26 | 0.69 | NO |
| 20 | LPA | LPA | LPA | 3111 | 0.25 | 0.69 | NO |
| 21 | ABCG5 | ABCG5 | ABCG5 | 3249 | 0.24 | 0.7 | NO |
| 22 | CAV1 | CAV1 | CAV1 | 3647 | 0.21 | 0.69 | NO |
| 23 | FABP4 | FABP4 | FABP4 | 3732 | 0.2 | 0.69 | NO |
| 24 | P4HB | P4HB | P4HB | 5806 | 0.099 | 0.59 | NO |
| 25 | CLPS | CLPS | CLPS | 6715 | 0.07 | 0.55 | NO |
| 26 | PPP1CA | PPP1CA | PPP1CA | 7260 | 0.053 | 0.52 | NO |
| 27 | ABHD5 | ABHD5 | ABHD5 | 7270 | 0.053 | 0.52 | NO |
| 28 | PPP1CC | PPP1CC | PPP1CC | 7976 | 0.034 | 0.49 | NO |
| 29 | PRKACA | PRKACA | PRKACA | 8075 | 0.032 | 0.48 | NO |
| 30 | LCAT | LCAT | LCAT | 8116 | 0.03 | 0.48 | NO |
| 31 | PRKACB | PRKACB | PRKACB | 8125 | 0.03 | 0.48 | NO |
| 32 | PPP1CB | PPP1CB | PPP1CB | 8559 | 0.02 | 0.46 | NO |
| 33 | A2M | A2M | A2M | 8722 | 0.016 | 0.45 | NO |
| 34 | ABCA1 | ABCA1 | ABCA1 | 9345 | 0.0018 | 0.42 | NO |
| 35 | SAR1B | SAR1B | SAR1B | 10080 | -0.015 | 0.38 | NO |
| 36 | APOE | APOE | APOE | 10434 | -0.023 | 0.37 | NO |
| 37 | PLTP | PLTP | PLTP | 10874 | -0.033 | 0.34 | NO |
| 38 | MGLL | MGLL | MGLL | 11930 | -0.058 | 0.29 | NO |
| 39 | ABCG1 | ABCG1 | ABCG1 | 11997 | -0.059 | 0.29 | NO |
| 40 | PLIN1 | PLIN1 | PLIN1 | 14004 | -0.12 | 0.19 | NO |
| 41 | CETP | CETP | CETP | 15426 | -0.18 | 0.12 | NO |
| 42 | LDLRAP1 | LDLRAP1 | LDLRAP1 | 17187 | -0.3 | 0.047 | NO |
| 43 | LIPE | LIPE | LIPE | 18064 | -0.43 | 0.023 | NO |
| 44 | PRKACG | PRKACG | PRKACG | 18608 | -0.59 | 0.023 | NO |
Figure S115. Get High-res Image This plot shows mRNAseq_cNMF expression data heatmap (on the left) a RunningEnrichmentScore(RES) plot (on the top right) and a Signal2Noise(S2N) plot (on the bottom right) of genes in the pathway: PID P75NTRPATHWAY.
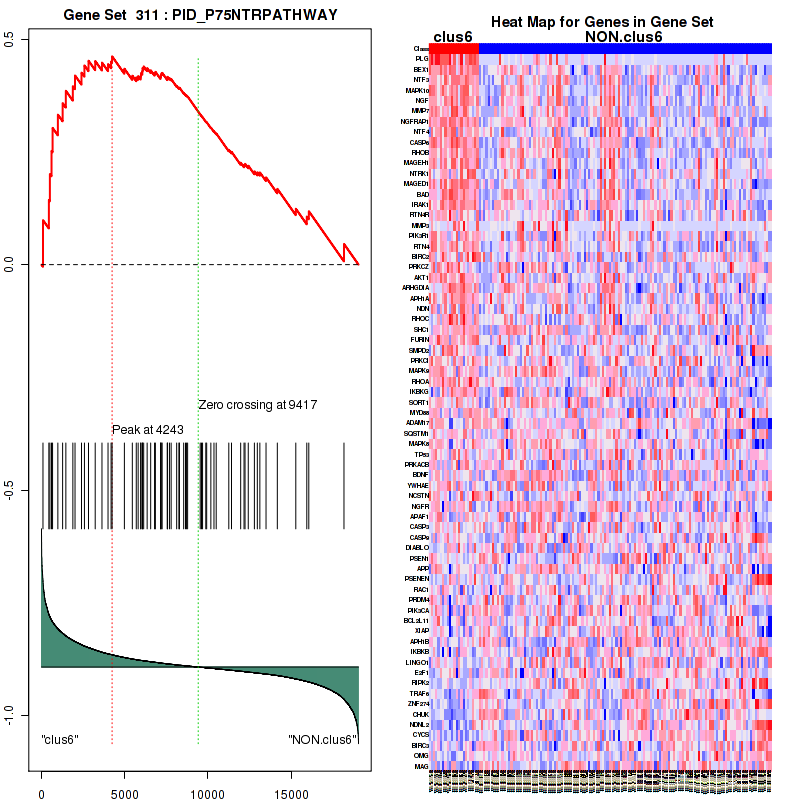
Figure S116. Get High-res Image For the top 5 core enriched genes in the pathway: PID P75NTRPATHWAY, this volcano plot shows how much they are up/down-regulated and significant. The significance was calculated by empirical bayesian fit
Table S59. Get Full Table This table shows a Running Enrichment Score (RES) of each gene in this pathway, that is, the enrichment score at this point in the ranked list of genes. All genes are ranked by Signal-to-Noise (S2N), a measure of similarity as default and are used to obtain ES matrix of all genes. In this way, GSEA tool uses expression pattern of not only overlapped genes but also not-overlapped genes to produce ES matrix.
| Rank | GENE | SYMBOL | DESC | LIST.LOC | S2N | RES | CORE_ENRICHMENT |
|---|---|---|---|---|---|---|---|
| 1 | PIGZ | PIGZ | PIGZ | 493 | 0.72 | 0.18 | YES |
| 2 | PGAP1 | PGAP1 | PGAP1 | 1467 | 0.44 | 0.25 | YES |
| 3 | PIGF | PIGF | PIGF | 2793 | 0.28 | 0.25 | YES |
| 4 | PIGQ | PIGQ | PIGQ | 3393 | 0.23 | 0.28 | YES |
| 5 | PIGU | PIGU | PIGU | 3482 | 0.22 | 0.34 | YES |
| 6 | PIGS | PIGS | PIGS | 3759 | 0.2 | 0.38 | YES |
| 7 | PIGT | PIGT | PIGT | 4616 | 0.15 | 0.38 | YES |
| 8 | PIGX | PIGX | PIGX | 4946 | 0.14 | 0.4 | YES |
| 9 | PIGM | PIGM | PIGM | 5507 | 0.11 | 0.4 | YES |
| 10 | PIGK | PIGK | PIGK | 5779 | 0.1 | 0.42 | YES |
| 11 | PIGN | PIGN | PIGN | 5807 | 0.099 | 0.44 | YES |
| 12 | PIGY | PIGY | PIGY | 5921 | 0.096 | 0.46 | YES |
| 13 | GPAA1 | GPAA1 | GPAA1 | 6146 | 0.088 | 0.48 | YES |
| 14 | PIGC | PIGC | PIGC | 6479 | 0.077 | 0.48 | YES |
| 15 | PIGO | PIGO | PIGO | 6959 | 0.063 | 0.47 | YES |
| 16 | DPM2 | DPM2 | DPM2 | 7044 | 0.06 | 0.49 | YES |
| 17 | PIGA | PIGA | PIGA | 8583 | 0.019 | 0.41 | NO |
| 18 | PIGV | PIGV | PIGV | 9882 | -0.01 | 0.34 | NO |
| 19 | PIGW | PIGW | PIGW | 10598 | -0.027 | 0.32 | NO |
| 20 | PIGH | PIGH | PIGH | 10684 | -0.029 | 0.32 | NO |
| 21 | PIGG | PIGG | PIGG | 10865 | -0.033 | 0.32 | NO |
| 22 | PIGP | PIGP | PIGP | 11929 | -0.058 | 0.28 | NO |
| 23 | GPLD1 | GPLD1 | GPLD1 | 12776 | -0.08 | 0.26 | NO |
| 24 | PIGB | PIGB | PIGB | 13505 | -0.099 | 0.25 | NO |
| 25 | PIGL | PIGL | PIGL | 15200 | -0.16 | 0.2 | NO |
Figure S117. Get High-res Image This plot shows mRNAseq_cNMF expression data heatmap (on the left) a RunningEnrichmentScore(RES) plot (on the top right) and a Signal2Noise(S2N) plot (on the bottom right) of genes in the pathway: PID SYNDECAN 4 PATHWAY.
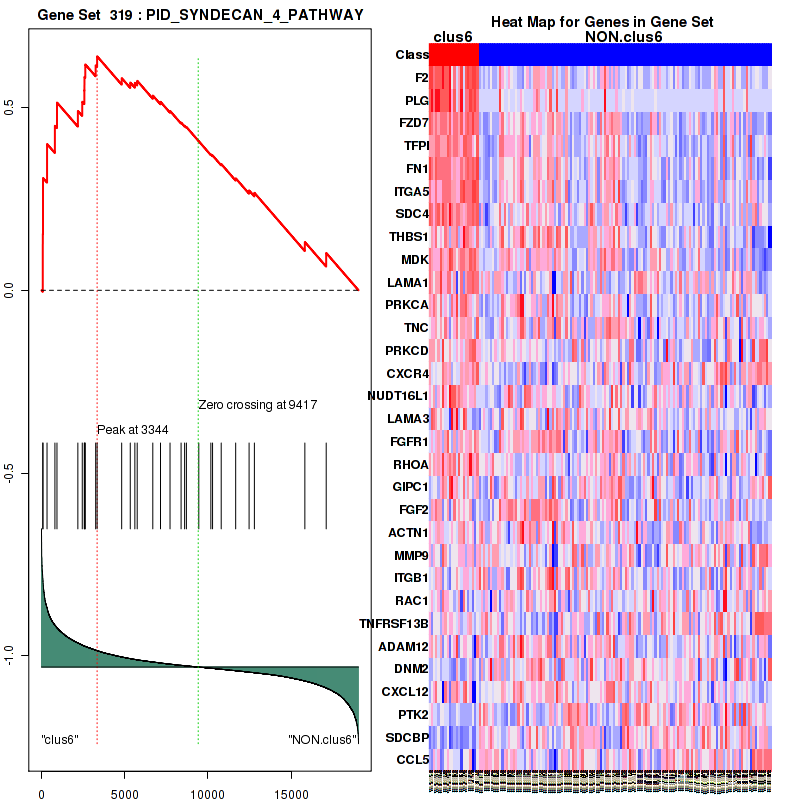
Figure S118. Get High-res Image For the top 5 core enriched genes in the pathway: PID SYNDECAN 4 PATHWAY, this volcano plot shows how much they are up/down-regulated and significant. The significance was calculated by empirical bayesian fit
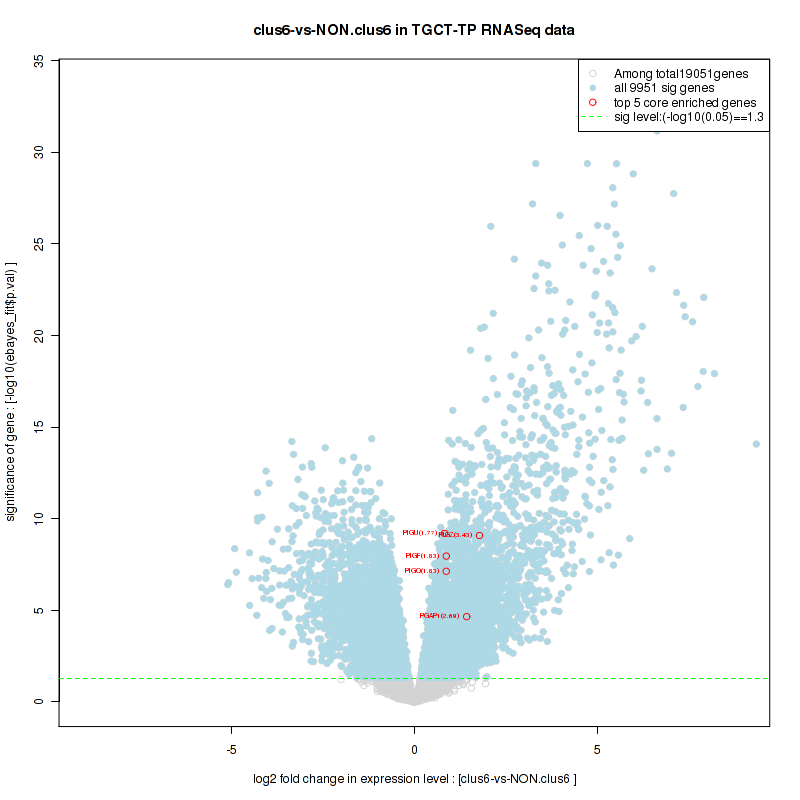
Table S60. Get Full Table This table shows a Running Enrichment Score (RES) of each gene in this pathway, that is, the enrichment score at this point in the ranked list of genes. All genes are ranked by Signal-to-Noise (S2N), a measure of similarity as default and are used to obtain ES matrix of all genes. In this way, GSEA tool uses expression pattern of not only overlapped genes but also not-overlapped genes to produce ES matrix.
| Rank | GENE | SYMBOL | DESC | LIST.LOC | S2N | RES | CORE_ENRICHMENT |
|---|---|---|---|---|---|---|---|
| 1 | APOC3 | APOC3 | APOC3 | 4 | 1.8 | 0.075 | YES |
| 2 | FABP1 | FABP1 | FABP1 | 17 | 1.6 | 0.14 | YES |
| 3 | APOA2 | APOA2 | APOA2 | 31 | 1.4 | 0.2 | YES |
| 4 | HMGCS2 | HMGCS2 | HMGCS2 | 35 | 1.4 | 0.25 | YES |
| 5 | APOA1 | APOA1 | APOA1 | 122 | 1.1 | 0.29 | YES |
| 6 | APOA5 | APOA5 | APOA5 | 214 | 0.95 | 0.33 | YES |
| 7 | ACOX2 | ACOX2 | ACOX2 | 240 | 0.91 | 0.36 | YES |
| 8 | SLC27A2 | SLC27A2 | SLC27A2 | 279 | 0.88 | 0.4 | YES |
| 9 | AQP7 | AQP7 | AQP7 | 353 | 0.82 | 0.43 | YES |
| 10 | MMP1 | MMP1 | MMP1 | 407 | 0.77 | 0.45 | YES |
| 11 | SLC27A6 | SLC27A6 | SLC27A6 | 470 | 0.73 | 0.48 | YES |
| 12 | CYP4A11 | CYP4A11 | CYP4A11 | 750 | 0.61 | 0.49 | YES |
| 13 | CYP8B1 | CYP8B1 | CYP8B1 | 1047 | 0.53 | 0.5 | YES |
| 14 | PCK1 | PCK1 | PCK1 | 1063 | 0.52 | 0.52 | YES |
| 15 | OLR1 | OLR1 | OLR1 | 1566 | 0.42 | 0.51 | YES |
| 16 | CD36 | CD36 | CD36 | 1602 | 0.42 | 0.52 | YES |
| 17 | UCP1 | UCP1 | UCP1 | 1610 | 0.42 | 0.54 | YES |
| 18 | SCD5 | SCD5 | SCD5 | 1645 | 0.41 | 0.55 | YES |
| 19 | FABP2 | FABP2 | FABP2 | 1766 | 0.39 | 0.56 | YES |
| 20 | EHHADH | EHHADH | EHHADH | 1811 | 0.39 | 0.58 | YES |
| 21 | RXRA | RXRA | RXRA | 2231 | 0.34 | 0.57 | YES |
| 22 | ADIPOQ | ADIPOQ | ADIPOQ | 2383 | 0.32 | 0.57 | YES |
| 23 | PCK2 | PCK2 | PCK2 | 2411 | 0.31 | 0.58 | YES |
| 24 | FADS2 | FADS2 | FADS2 | 2605 | 0.29 | 0.59 | YES |
| 25 | ACOX3 | ACOX3 | ACOX3 | 2766 | 0.28 | 0.59 | YES |
| 26 | ACAA1 | ACAA1 | ACAA1 | 2769 | 0.28 | 0.6 | YES |
| 27 | LPL | LPL | LPL | 3004 | 0.26 | 0.6 | YES |
| 28 | CYP27A1 | CYP27A1 | CYP27A1 | 3152 | 0.25 | 0.6 | YES |
| 29 | ACSL5 | ACSL5 | ACSL5 | 3328 | 0.23 | 0.6 | YES |
| 30 | PPARA | PPARA | PPARA | 3607 | 0.21 | 0.6 | NO |
| 31 | FABP4 | FABP4 | FABP4 | 3732 | 0.2 | 0.6 | NO |
| 32 | DBI | DBI | DBI | 4585 | 0.15 | 0.56 | NO |
| 33 | ME1 | ME1 | ME1 | 4679 | 0.15 | 0.56 | NO |
| 34 | ILK | ILK | ILK | 5426 | 0.12 | 0.52 | NO |
| 35 | FABP7 | FABP7 | FABP7 | 5586 | 0.11 | 0.52 | NO |
| 36 | PDPK1 | PDPK1 | PDPK1 | 6714 | 0.07 | 0.46 | NO |
| 37 | SCP2 | SCP2 | SCP2 | 6770 | 0.068 | 0.46 | NO |
| 38 | RXRB | RXRB | RXRB | 7349 | 0.051 | 0.44 | NO |
| 39 | UBC | UBC | UBC | 8851 | 0.014 | 0.36 | NO |
| 40 | CPT1B | CPT1B | CPT1B | 9016 | 0.009 | 0.35 | NO |
| 41 | CPT2 | CPT2 | CPT2 | 9220 | 0.0041 | 0.34 | NO |
| 42 | ACOX1 | ACOX1 | ACOX1 | 9577 | -0.0037 | 0.32 | NO |
| 43 | SCD | SCD | SCD | 9701 | -0.0062 | 0.31 | NO |
| 44 | RXRG | RXRG | RXRG | 9848 | -0.0095 | 0.31 | NO |
| 45 | NR1H3 | NR1H3 | NR1H3 | 10267 | -0.019 | 0.28 | NO |
| 46 | PLTP | PLTP | PLTP | 10874 | -0.033 | 0.26 | NO |
| 47 | SLC27A1 | SLC27A1 | SLC27A1 | 11106 | -0.038 | 0.24 | NO |
| 48 | SLC27A5 | SLC27A5 | SLC27A5 | 11393 | -0.046 | 0.23 | NO |
| 49 | ACSL1 | ACSL1 | ACSL1 | 12308 | -0.068 | 0.19 | NO |
| 50 | CPT1C | CPT1C | CPT1C | 12323 | -0.068 | 0.19 | NO |
| 51 | ACADM | ACADM | ACADM | 12509 | -0.073 | 0.18 | NO |
| 52 | SLC27A4 | SLC27A4 | SLC27A4 | 12594 | -0.075 | 0.18 | NO |
| 53 | PPARG | PPARG | PPARG | 12817 | -0.08 | 0.17 | NO |
| 54 | ACSL3 | ACSL3 | ACSL3 | 13591 | -0.1 | 0.13 | NO |
| 55 | PLIN1 | PLIN1 | PLIN1 | 14004 | -0.12 | 0.12 | NO |
| 56 | ANGPTL4 | ANGPTL4 | ANGPTL4 | 15268 | -0.17 | 0.058 | NO |
| 57 | FABP3 | FABP3 | FABP3 | 15782 | -0.19 | 0.039 | NO |
| 58 | SORBS1 | SORBS1 | SORBS1 | 15812 | -0.2 | 0.045 | NO |
| 59 | FABP5 | FABP5 | FABP5 | 16062 | -0.21 | 0.04 | NO |
| 60 | ACSL4 | ACSL4 | ACSL4 | 16147 | -0.22 | 0.045 | NO |
| 61 | CYP7A1 | CYP7A1 | CYP7A1 | 16200 | -0.22 | 0.051 | NO |
| 62 | PPARD | PPARD | PPARD | 16321 | -0.23 | 0.054 | NO |
| 63 | ACADL | ACADL | ACADL | 16465 | -0.24 | 0.056 | NO |
| 64 | CPT1A | CPT1A | CPT1A | 16710 | -0.26 | 0.054 | NO |
| 65 | GK2 | GK2 | GK2 | 17356 | -0.32 | 0.033 | NO |
| 66 | FABP6 | FABP6 | FABP6 | 17511 | -0.34 | 0.039 | NO |
| 67 | GK | GK | GK | 17986 | -0.41 | 0.031 | NO |
| 68 | ACSL6 | ACSL6 | ACSL6 | 18700 | -0.62 | 0.018 | NO |
Figure S119. Get High-res Image This plot shows mRNAseq_cNMF expression data heatmap (on the left) a RunningEnrichmentScore(RES) plot (on the top right) and a Signal2Noise(S2N) plot (on the bottom right) of genes in the pathway: REACTOME PTM GAMMA CARBOXYLATION HYPUSINE FORMATION AND ARYLSULFATASE ACTIVATION.

Figure S120. Get High-res Image For the top 5 core enriched genes in the pathway: REACTOME PTM GAMMA CARBOXYLATION HYPUSINE FORMATION AND ARYLSULFATASE ACTIVATION, this volcano plot shows how much they are up/down-regulated and significant. The significance was calculated by empirical bayesian fit

For the top enriched genes, if you want to check whether they are
-
up-regulated, please check the list of up-regulated genes
-
down-regulated, please check the list of down-regulated genes
For the top enriched genes, if you want to check whether they are
-
highly expressed genes, please check the list of high (top 30%) expressed genes
-
low expressed genes, please check the list of low (bottom 30%) expressed genes
An expression pattern of top(30%)/middle(30%)/low(30%) in this subtype against other subtypes is available in a heatmap
For the top enriched genes, if you want to check whether they are
-
significantly differently expressed genes by eBayes lm fit, please check the list of significant genes
-
Gene set database = c2.cp.v4.0.symbols.gmt
-
Expression data file = TGCT-TP.uncv2.mRNAseq_RSEM_normalized_log2.txt
-
Phenotype data file = TGCT-TP.mergedcluster.txt
For the Gene Set Enrichment Analysis (GSEA), Broad GSEA-P-R.1.0 version is used with class2: canonical pathways geneses from MSigDB. Further details about statistics are available inThe Broad GSEA website.
In addition to the links below, the full results of the analysis summarized in this report can also be downloaded programmatically using firehose_get, or interactively from either the Broad GDAC website or TCGA Data Coordination Center Portal.