PAthway Representation and Analysis by Direct Inference on Graphical Models (PARADIGM) predicts the activity of a diverse set of molecular concepts such as genes, complexes, and processes. The predicted activities are called Inferred Pathway Levels (IPLs) and are derived from a probabilistic belief propagation strategy that incorporates multimodal data such as copy number and gene expression estimates with a concept's pathway context.
There were 43 significant pathways identified in this analysis.
Table 1. Get Full Table Top 10 out of 131 pathways in order of significance.
| Pathway.Name | Avg.Num.Perturbations |
|---|---|
| Nephrin/Neph1 signaling in the kidney podocyte | 227 |
| HIF-1-alpha transcription factor network | 192 |
| TCR signaling in naïve CD8+ T cells | 138 |
| FOXA2 and FOXA3 transcription factor networks | 127 |
| TCGA08_retinoblastoma | 113 |
| PDGFR-alpha signaling pathway | 111 |
| Syndecan-4-mediated signaling events | 104 |
| Aurora B signaling | 92 |
| IL12-mediated signaling events | 91 |
| TCGA08_p53 | 89 |
The following list describes the columns found in Table 2.
-
Pathway.Name = Full pathway name of curated PARADIGM pathway
-
Significance.Ratio = (Ave.Num.Perturbations)/ (Cohort Size) where Cohort Size is 518 . Pathway is significant if Significance.Ratio > 0.05 .
-
Avg.Num.Perturbations = Average number of samples with perturbations across the pathway concepts determined by a background permutation model (>2 standard deviations away from the permuted distribution)
-
Total.Perturbations = Total number of perturbed concepts across all samples (>2 standard deviations away from the permuted distribution)
-
Num.Entities = Number of concepts that belong to the pathway
-
Min.Mean.Truth = Minimum IPL for concepts in the pathway among real samples
-
Max.Mean.Truth = Maximum IPL for concepts in the pathway among real samples
-
Min.Mean.Within = Minimum IPL for concepts in the pathway among null samples using "within permutation" (values are permuted across genes)
-
Max.Mean.Within = Maximum IPL for concepts in the pathway among null samples using "within permutation" (values are permuted across genes)
-
Min.Mean.Any = Minimum IPL for concepts in the pathway among null samples using "any permutation" (values are permuted across samples and genes)
-
Max.Mean.Any = Maximum IPL for concepts in the pathway among null samples using "any permutation" (values are permuted across samples and genes).
Table 2. Get Full Table This summary table provides a report of cancer type specific pathway perturbations. Click on the links in the first column to display more detailed results for each pathway. A pathway is defined as significant (red number in Significance.Ratio column) if the Ave.Num.Perturbationsis > 5% of the cohort size ( 518 ).
| Pathway.Name | Significance.Ratio | Avg.Num.Perturbations | Total.Perturbations | Num.Entities | Min.Mean.Truth | Max.Mean.Truth | Min.Mean.Within | Max.Mean.Within | Min.Mean.Any | Max.Mean.Within.1 |
|---|---|---|---|---|---|---|---|---|---|---|
| Nephrin/Neph1 signaling in the kidney podocyte | 0.4382 | 227 | 7728 | 34 | -0.51 | 0.03 | 1000 | -1000 | -0.057 | -1000 |
| HIF-1-alpha transcription factor network | 0.3707 | 192 | 14658 | 76 | -1.1 | 0.046 | 1000 | -1000 | -0.13 | -1000 |
| TCR signaling in naïve CD8+ T cells | 0.2664 | 138 | 12867 | 93 | -0.44 | 0.2 | 1000 | -1000 | -0.082 | -1000 |
| FOXA2 and FOXA3 transcription factor networks | 0.2452 | 127 | 5845 | 46 | -1.1 | 0.036 | 1000 | -1000 | -0.098 | -1000 |
| TCGA08_retinoblastoma | 0.2181 | 113 | 911 | 8 | -0.58 | 0.16 | 1000 | -1000 | -0.007 | -1000 |
| PDGFR-alpha signaling pathway | 0.2143 | 111 | 4923 | 44 | -0.22 | 0.037 | 1000 | -1000 | -0.04 | -1000 |
| Syndecan-4-mediated signaling events | 0.2008 | 104 | 7033 | 67 | -0.44 | 0.088 | 1000 | -1000 | -0.052 | -1000 |
| Aurora B signaling | 0.1776 | 92 | 6227 | 67 | -0.26 | 0.042 | 1000 | -1000 | -0.044 | -1000 |
| IL12-mediated signaling events | 0.1757 | 91 | 7925 | 87 | -0.45 | 0.12 | 1000 | -1000 | -0.11 | -1000 |
| TCGA08_p53 | 0.1718 | 89 | 629 | 7 | -0.42 | 0.22 | 1000 | -1000 | -0.014 | -1000 |
| EGFR-dependent Endothelin signaling events | 0.1602 | 83 | 1750 | 21 | -0.57 | 0.043 | 1000 | -1000 | -0.063 | -1000 |
| Glypican 1 network | 0.1583 | 82 | 3941 | 48 | -0.4 | 0.046 | 1000 | -1000 | -0.054 | -1000 |
| amb2 Integrin signaling | 0.1506 | 78 | 6427 | 82 | -0.45 | 0.038 | 1000 | -1000 | -0.052 | -1000 |
| FOXM1 transcription factor network | 0.1429 | 74 | 3794 | 51 | -0.56 | 0.031 | 1000 | -1000 | -0.11 | -1000 |
| BMP receptor signaling | 0.1371 | 71 | 5755 | 81 | -0.53 | 0.054 | 1000 | -1000 | -0.09 | -1000 |
| Aurora C signaling | 0.1313 | 68 | 477 | 7 | -0.26 | 0.027 | 1000 | -1000 | -0.016 | -1000 |
| Glypican 2 network | 0.1178 | 61 | 244 | 4 | -0.04 | -1000 | 1000 | -1000 | -0.006 | -1000 |
| IL4-mediated signaling events | 0.1100 | 57 | 5237 | 91 | -0.79 | 0.49 | 1000 | -1000 | -0.11 | -1000 |
| Caspase cascade in apoptosis | 0.1062 | 55 | 4076 | 74 | -0.29 | 0.094 | 1000 | -1000 | -0.052 | -1000 |
| Syndecan-1-mediated signaling events | 0.1004 | 52 | 1776 | 34 | -0.25 | 0.03 | 1000 | -1000 | -0.058 | -1000 |
| JNK signaling in the CD4+ TCR pathway | 0.0985 | 51 | 869 | 17 | -0.22 | 0.03 | 1000 | -1000 | -0.048 | -1000 |
| HIF-2-alpha transcription factor network | 0.0965 | 50 | 2169 | 43 | -0.53 | 0.25 | 1000 | -1000 | -0.066 | -1000 |
| Hypoxic and oxygen homeostasis regulation of HIF-1-alpha | 0.0965 | 50 | 1678 | 33 | -0.57 | 0.055 | 1000 | -1000 | -0.049 | -1000 |
| Fc-epsilon receptor I signaling in mast cells | 0.0946 | 49 | 4779 | 97 | -0.24 | 0.041 | 1000 | -1000 | -0.082 | -1000 |
| Reelin signaling pathway | 0.0753 | 39 | 2190 | 56 | -0.17 | 0.08 | 1000 | -1000 | -0.054 | -1000 |
| Effects of Botulinum toxin | 0.0734 | 38 | 1003 | 26 | -0.24 | 0.04 | 1000 | -1000 | -0.033 | -1000 |
| Arf6 signaling events | 0.0714 | 37 | 2307 | 62 | -0.57 | 0.065 | 1000 | -1000 | -0.048 | -1000 |
| Calcium signaling in the CD4+ TCR pathway | 0.0714 | 37 | 1160 | 31 | -0.37 | 0.029 | 1000 | -1000 | -0.066 | -1000 |
| Lissencephaly gene (LIS1) in neuronal migration and development | 0.0676 | 35 | 1890 | 54 | -0.44 | 0.042 | 1000 | -1000 | -0.087 | -1000 |
| Signaling events mediated by the Hedgehog family | 0.0676 | 35 | 1857 | 52 | -0.28 | 0.067 | 1000 | -1000 | -0.062 | -1000 |
| IL27-mediated signaling events | 0.0637 | 33 | 1706 | 51 | -0.59 | 0.06 | 1000 | -1000 | -0.057 | -1000 |
| Calcineurin-regulated NFAT-dependent transcription in lymphocytes | 0.0637 | 33 | 2283 | 68 | -0.33 | 0.058 | 1000 | -1000 | -0.098 | -1000 |
| PLK1 signaling events | 0.0618 | 32 | 2766 | 85 | -0.19 | 0.043 | 1000 | -1000 | -0.039 | -1000 |
| IL2 signaling events mediated by STAT5 | 0.0618 | 32 | 712 | 22 | -0.3 | 0.036 | 1000 | -1000 | -0.054 | -1000 |
| IL23-mediated signaling events | 0.0618 | 32 | 1942 | 60 | -0.26 | 0.03 | 1000 | -1000 | -0.083 | -1000 |
| Ephrin A reverse signaling | 0.0598 | 31 | 217 | 7 | -0.023 | 0.012 | 1000 | -1000 | -0.023 | -1000 |
| p75(NTR)-mediated signaling | 0.0598 | 31 | 3909 | 125 | -0.3 | 0.079 | 1000 | -1000 | -0.098 | -1000 |
| LPA4-mediated signaling events | 0.0579 | 30 | 366 | 12 | -0.1 | 0.011 | 1000 | -1000 | -0.031 | -1000 |
| Coregulation of Androgen receptor activity | 0.0560 | 29 | 2279 | 76 | -0.85 | 0.055 | 1000 | -1000 | -0.034 | -1000 |
| S1P1 pathway | 0.0541 | 28 | 1032 | 36 | -0.25 | 0.03 | 1000 | -1000 | -0.053 | -1000 |
| IL2 signaling events mediated by PI3K | 0.0521 | 27 | 1601 | 58 | -0.3 | 0.047 | 1000 | -1000 | -0.048 | -1000 |
| Integrins in angiogenesis | 0.0502 | 26 | 2192 | 84 | -0.26 | 0.068 | 1000 | -1000 | -0.074 | -1000 |
| BCR signaling pathway | 0.0502 | 26 | 2600 | 99 | -0.22 | 0.057 | 1000 | -1000 | -0.081 | -1000 |
| Glucocorticoid receptor regulatory network | 0.0483 | 25 | 2873 | 114 | -0.34 | 0.15 | 1000 | -1000 | -0.073 | -1000 |
| VEGFR1 specific signals | 0.0483 | 25 | 1401 | 56 | -0.32 | 0.03 | 1000 | -1000 | -0.068 | -1000 |
| Ceramide signaling pathway | 0.0444 | 23 | 1767 | 76 | -0.57 | 0.21 | 1000 | -1000 | -0.049 | -1000 |
| Regulation of Telomerase | 0.0444 | 23 | 2382 | 102 | -0.57 | 0.062 | 1000 | -1000 | -0.081 | -1000 |
| Wnt signaling | 0.0425 | 22 | 160 | 7 | -0.044 | 0.028 | 1000 | -1000 | -0.031 | -1000 |
| Signaling events mediated by PTP1B | 0.0405 | 21 | 1668 | 76 | -0.57 | 0.066 | 1000 | -1000 | -0.062 | -1000 |
| Angiopoietin receptor Tie2-mediated signaling | 0.0405 | 21 | 1905 | 88 | -0.2 | 0.046 | 1000 | -1000 | -0.082 | -1000 |
| Visual signal transduction: Rods | 0.0405 | 21 | 1097 | 52 | -0.16 | 0.04 | 1000 | -1000 | -0.062 | -1000 |
| FoxO family signaling | 0.0386 | 20 | 1325 | 64 | -0.55 | 0.096 | 1000 | -1000 | -0.064 | -1000 |
| HIV-1 Nef: Negative effector of Fas and TNF-alpha | 0.0386 | 20 | 928 | 45 | -0.37 | 0.078 | 1000 | -1000 | -0.071 | -1000 |
| Noncanonical Wnt signaling pathway | 0.0367 | 19 | 506 | 26 | -0.099 | 0.029 | 1000 | -1000 | -0.057 | -1000 |
| Neurotrophic factor-mediated Trk receptor signaling | 0.0367 | 19 | 2339 | 120 | -0.11 | 0.081 | 1000 | -1000 | -0.073 | -1000 |
| Signaling events mediated by Stem cell factor receptor (c-Kit) | 0.0367 | 19 | 1539 | 78 | -0.24 | 0.046 | 1000 | -1000 | -0.07 | -1000 |
| Syndecan-2-mediated signaling events | 0.0347 | 18 | 1302 | 69 | -0.45 | 0.064 | 1000 | -1000 | -0.059 | -1000 |
| EPO signaling pathway | 0.0347 | 18 | 1023 | 55 | -0.17 | 0.036 | 1000 | -1000 | -0.081 | -1000 |
| IL6-mediated signaling events | 0.0347 | 18 | 1355 | 75 | -0.22 | 0.059 | 1000 | -1000 | -0.06 | -1000 |
| Regulation of nuclear SMAD2/3 signaling | 0.0309 | 16 | 2201 | 136 | -0.29 | 0.1 | 1000 | -1000 | -0.056 | -1000 |
| Presenilin action in Notch and Wnt signaling | 0.0309 | 16 | 1001 | 61 | -0.14 | 0.085 | 1000 | -1000 | -0.055 | -1000 |
| Aurora A signaling | 0.0309 | 16 | 987 | 60 | -0.15 | 0.063 | 1000 | -1000 | -0.034 | -1000 |
| Endothelins | 0.0309 | 16 | 1548 | 96 | -0.33 | 0.049 | 1000 | -1000 | -0.068 | -1000 |
| Stabilization and expansion of the E-cadherin adherens junction | 0.0309 | 16 | 1189 | 74 | -0.57 | 0.11 | 1000 | -1000 | -0.09 | -1000 |
| Thromboxane A2 receptor signaling | 0.0290 | 15 | 1624 | 105 | -0.57 | 0.046 | 1000 | -1000 | -0.063 | -1000 |
| S1P5 pathway | 0.0290 | 15 | 257 | 17 | -0.075 | 0.029 | 1000 | -1000 | -0.026 | -1000 |
| LPA receptor mediated events | 0.0290 | 15 | 1603 | 102 | -0.25 | 0.052 | 1000 | -1000 | -0.083 | -1000 |
| Class I PI3K signaling events | 0.0290 | 15 | 1099 | 73 | -0.3 | 0.08 | 1000 | -1000 | -0.069 | -1000 |
| IFN-gamma pathway | 0.0270 | 14 | 1000 | 68 | -0.25 | 0.043 | 1000 | -1000 | -0.08 | -1000 |
| Signaling events regulated by Ret tyrosine kinase | 0.0270 | 14 | 1167 | 82 | -0.029 | 0.03 | 1000 | -1000 | -0.09 | -1000 |
| Canonical Wnt signaling pathway | 0.0270 | 14 | 725 | 51 | -0.14 | 0.098 | 1000 | -1000 | -0.064 | -1000 |
| E-cadherin signaling in keratinocytes | 0.0270 | 14 | 632 | 43 | -0.22 | 0.042 | 1000 | -1000 | -0.043 | -1000 |
| Signaling mediated by p38-alpha and p38-beta | 0.0251 | 13 | 609 | 44 | -0.04 | 0.054 | 1000 | -1000 | -0.039 | -1000 |
| Nongenotropic Androgen signaling | 0.0251 | 13 | 716 | 52 | -0.11 | 0.045 | 1000 | -1000 | -0.05 | -1000 |
| S1P3 pathway | 0.0251 | 13 | 553 | 42 | -0.24 | 0.052 | 1000 | -1000 | -0.039 | -1000 |
| PLK2 and PLK4 events | 0.0232 | 12 | 38 | 3 | 0.005 | 0.026 | 1000 | -1000 | -0.02 | -1000 |
| Paxillin-independent events mediated by a4b1 and a4b7 | 0.0232 | 12 | 457 | 37 | -0.17 | 0.058 | 1000 | -1000 | -0.052 | -1000 |
| Plasma membrane estrogen receptor signaling | 0.0232 | 12 | 1040 | 86 | -0.15 | 0.053 | 1000 | -1000 | -0.095 | -1000 |
| Regulation of Androgen receptor activity | 0.0232 | 12 | 908 | 70 | -0.92 | 0.054 | 1000 | -1000 | -0.065 | -1000 |
| Sphingosine 1-phosphate (S1P) pathway | 0.0212 | 11 | 325 | 28 | -0.075 | 0.049 | 1000 | -1000 | -0.041 | -1000 |
| FAS signaling pathway (CD95) | 0.0212 | 11 | 555 | 47 | -0.28 | 0.049 | 1000 | -1000 | -0.057 | -1000 |
| Signaling events mediated by VEGFR1 and VEGFR2 | 0.0212 | 11 | 1402 | 125 | -0.24 | 0.044 | 1000 | -1000 | -0.084 | -1000 |
| TCGA08_rtk_signaling | 0.0212 | 11 | 302 | 26 | -0.22 | 0.057 | 1000 | -1000 | -0.018 | -1000 |
| ErbB4 signaling events | 0.0193 | 10 | 750 | 69 | -0.16 | 0.094 | 1000 | -1000 | -0.075 | -1000 |
| S1P4 pathway | 0.0193 | 10 | 271 | 25 | -0.075 | 0.039 | 1000 | -1000 | -0.041 | -1000 |
| E-cadherin signaling events | 0.0193 | 10 | 54 | 5 | 0.007 | 0.026 | 1000 | -1000 | -0.001 | -1000 |
| a4b1 and a4b7 Integrin signaling | 0.0174 | 9 | 45 | 5 | 0.011 | 0.029 | 1000 | -1000 | -0.013 | -1000 |
| ceramide signaling pathway | 0.0174 | 9 | 449 | 49 | -0.066 | 0.045 | 1000 | -1000 | -0.054 | -1000 |
| Signaling events mediated by PRL | 0.0174 | 9 | 307 | 34 | -0.045 | 0.063 | 1000 | -1000 | -0.054 | -1000 |
| Visual signal transduction: Cones | 0.0154 | 8 | 318 | 38 | -0.013 | 0.044 | 1000 | -1000 | -0.022 | -1000 |
| Signaling events activated by Hepatocyte Growth Factor Receptor (c-Met) | 0.0135 | 7 | 660 | 85 | -0.039 | 0.082 | 1000 | -1000 | -0.063 | -1000 |
| mTOR signaling pathway | 0.0135 | 7 | 387 | 53 | -0.061 | 0.054 | 1000 | -1000 | -0.055 | -1000 |
| Ephrin B reverse signaling | 0.0135 | 7 | 351 | 48 | -0.049 | 0.054 | 1000 | -1000 | -0.038 | -1000 |
| Canonical NF-kappaB pathway | 0.0116 | 6 | 267 | 39 | -0.12 | 0.058 | 1000 | -1000 | -0.065 | -1000 |
| IL1-mediated signaling events | 0.0116 | 6 | 382 | 62 | -0.04 | 0.065 | 1000 | -1000 | -0.082 | -1000 |
| Syndecan-3-mediated signaling events | 0.0116 | 6 | 235 | 35 | -0.012 | 0.079 | 1000 | -1000 | -0.053 | -1000 |
| E-cadherin signaling in the nascent adherens junction | 0.0116 | 6 | 462 | 76 | -0.032 | 0.051 | 1000 | -1000 | -0.083 | -1000 |
| ErbB2/ErbB3 signaling events | 0.0097 | 5 | 334 | 65 | -0.13 | 0.042 | 1000 | -1000 | -0.072 | -1000 |
| Cellular roles of Anthrax toxin | 0.0097 | 5 | 209 | 39 | -0.01 | 0.039 | 1000 | -1000 | -0.031 | -1000 |
| Insulin-mediated glucose transport | 0.0097 | 5 | 165 | 32 | -0.043 | 0.057 | 1000 | -1000 | -0.044 | -1000 |
| Signaling events mediated by HDAC Class III | 0.0097 | 5 | 234 | 40 | -0.054 | 0.055 | 1000 | -1000 | -0.03 | -1000 |
| EPHB forward signaling | 0.0097 | 5 | 466 | 85 | -0.054 | 0.074 | 1000 | -1000 | -0.095 | -1000 |
| PDGFR-beta signaling pathway | 0.0097 | 5 | 503 | 97 | -0.018 | 0.086 | 1000 | -1000 | -0.082 | -1000 |
| Class IB PI3K non-lipid kinase events | 0.0097 | 5 | 15 | 3 | -0.023 | 0.023 | 1000 | -1000 | -0.002 | -1000 |
| p38 MAPK signaling pathway | 0.0097 | 5 | 252 | 44 | -0.065 | 0.057 | 1000 | -1000 | -0.052 | -1000 |
| Ras signaling in the CD4+ TCR pathway | 0.0097 | 5 | 101 | 17 | -0.01 | 0.055 | 1000 | -1000 | -0.037 | -1000 |
| Regulation of p38-alpha and p38-beta | 0.0077 | 4 | 256 | 54 | -0.022 | 0.068 | 1000 | -1000 | -0.061 | -1000 |
| Insulin Pathway | 0.0077 | 4 | 336 | 74 | -0.032 | 0.08 | 1000 | -1000 | -0.085 | -1000 |
| BARD1 signaling events | 0.0058 | 3 | 220 | 57 | -0.097 | 0.076 | 1000 | -1000 | -0.072 | -1000 |
| Osteopontin-mediated events | 0.0058 | 3 | 114 | 38 | 0 | 0.087 | 1000 | -1000 | -0.06 | -1000 |
| Hedgehog signaling events mediated by Gli proteins | 0.0058 | 3 | 231 | 65 | -0.007 | 0.1 | 1000 | -1000 | -0.056 | -1000 |
| Arf6 downstream pathway | 0.0058 | 3 | 165 | 43 | -0.048 | 0.049 | 1000 | -1000 | -0.034 | -1000 |
| Class I PI3K signaling events mediated by Akt | 0.0058 | 3 | 226 | 68 | -0.043 | 0.056 | 1000 | -1000 | -0.048 | -1000 |
| Nectin adhesion pathway | 0.0058 | 3 | 190 | 63 | 0 | 0.058 | 1000 | -1000 | -0.069 | -1000 |
| RXR and RAR heterodimerization with other nuclear receptor | 0.0058 | 3 | 162 | 52 | -0.014 | 0.1 | 1000 | -1000 | -0.05 | -1000 |
| Signaling mediated by p38-gamma and p38-delta | 0.0058 | 3 | 59 | 15 | 0 | 0.031 | 1000 | -1000 | -0.034 | -1000 |
| Arf6 trafficking events | 0.0058 | 3 | 256 | 71 | -0.12 | 0.062 | 1000 | -1000 | -0.05 | -1000 |
| Role of Calcineurin-dependent NFAT signaling in lymphocytes | 0.0039 | 2 | 223 | 83 | -0.043 | 0.074 | 1000 | -1000 | -0.06 | -1000 |
| Signaling events mediated by HDAC Class I | 0.0039 | 2 | 208 | 104 | -0.057 | 0.075 | 1000 | -1000 | -0.046 | -1000 |
| Retinoic acid receptors-mediated signaling | 0.0039 | 2 | 118 | 58 | -0.016 | 0.053 | 1000 | -1000 | -0.063 | -1000 |
| Paxillin-dependent events mediated by a4b1 | 0.0039 | 2 | 76 | 36 | -0.053 | 0.055 | 1000 | -1000 | -0.052 | -1000 |
| Atypical NF-kappaB pathway | 0.0039 | 2 | 62 | 31 | 0 | 0.037 | 1000 | -1000 | -0.036 | -1000 |
| IGF1 pathway | 0.0039 | 2 | 145 | 57 | -0.048 | 0.079 | 1000 | -1000 | -0.077 | -1000 |
| Signaling events mediated by HDAC Class II | 0.0019 | 1 | 112 | 75 | -0.041 | 0.063 | 1000 | -1000 | -0.04 | -1000 |
| Circadian rhythm pathway | 0.0019 | 1 | 24 | 22 | -0.014 | 0.069 | 1000 | -1000 | -0.044 | -1000 |
| Arf1 pathway | 0.0019 | 1 | 75 | 54 | 0 | 0.049 | 1000 | -1000 | -0.026 | -1000 |
| Regulation of cytoplasmic and nuclear SMAD2/3 signaling | 0.0000 | 0 | 15 | 23 | -0.027 | 0.057 | 1000 | -1000 | -0.05 | -1000 |
| TRAIL signaling pathway | 0.0000 | 0 | 30 | 48 | 0 | 0.073 | 1000 | -1000 | -0.059 | -1000 |
| Sumoylation by RanBP2 regulates transcriptional repression | 0.0000 | 0 | 2 | 27 | 0 | 0.071 | 1000 | -1000 | -0.055 | -1000 |
| Rapid glucocorticoid signaling | 0.0000 | 0 | 8 | 20 | -0.007 | 0.037 | 1000 | -1000 | -0.014 | -1000 |
| Alternative NF-kappaB pathway | 0.0000 | 0 | 10 | 13 | 0 | 0.062 | 1000 | -1000 | -0.01 | -1000 |
| Total | NA | 3640 | 201778 | 7203 | -30 | -990 | 131000 | -131000 | -7.4 | -131000 |
Figure S1. Get High-res Image This plot shows pathway concept perturbations across all samples against a permutation model. The concepts along the x-axis are sorted by lowest to highest mean activity for the real patient samples. Mean inferred activities are plotted along the y-axis as a colored band showing the average level and one standard deviation range. Real samples are shown in red and permuted samples in black.
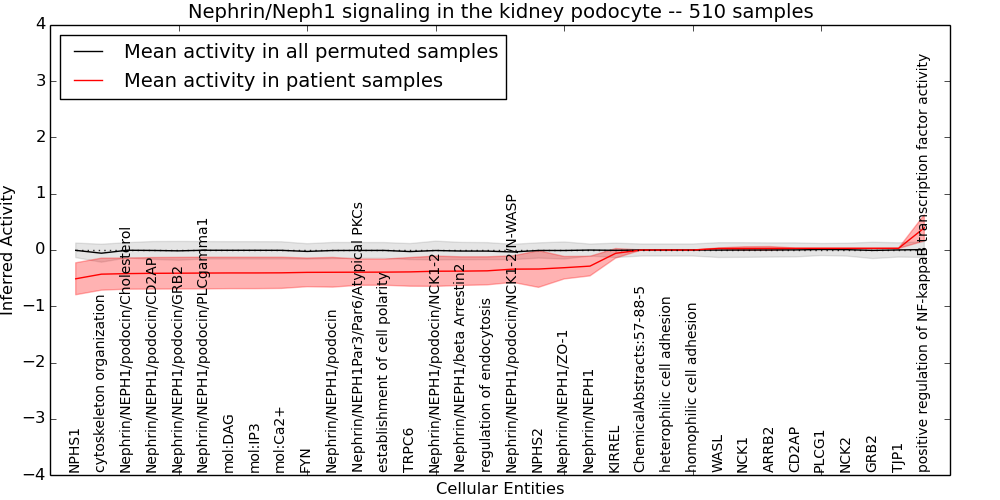
Table S1. Get Full Table This table displays mean, standard deviation, and perturbation statistics for Inferred Pathway Levels (IPLs). A mean perturbation of -9999 implies that the IPLs across all the real samples did not differ enough from the IPLs generated by a background model of permuted samples (> 1 Std.Dev from the permuted sample IPLs).
| Entity | Mean | Std.Dev | Mean.of.Up.Perturbations | Number.of.Up.Perturbations | Mean.of.Down.Perturbations | Number.of.Down.Perturbations | Number.of.Total.Perturbations |
|---|---|---|---|---|---|---|---|
| positive regulation of NF-kappaB transcription factor activity | 0.39 | 0.23 | 0.52 | 379 | -10000 | 0 | 379 |
| KIRREL | -0.058 | 0.084 | -10000 | 0 | -0.62 | 8 | 8 |
| Nephrin/NEPH1Par3/Par6/Atypical PKCs | -0.39 | 0.23 | -10000 | 0 | -0.53 | 379 | 379 |
| PLCG1 | 0.029 | 0.006 | -10000 | 0 | -10000 | 0 | 0 |
| ARRB2 | 0.028 | 0.033 | -10000 | 0 | -0.71 | 1 | 1 |
| WASL | 0.027 | 0.009 | -10000 | 0 | -10000 | 0 | 0 |
| Nephrin/NEPH1/podocin/CD2AP | -0.41 | 0.28 | -10000 | 0 | -0.54 | 400 | 400 |
| ChemicalAbstracts:57-88-5 | 0 | 0 | -10000 | 0 | -10000 | 0 | 0 |
| Nephrin/NEPH1/podocin/NCK1-2/N-WASP | -0.34 | 0.24 | -10000 | 0 | -0.56 | 224 | 224 |
| FYN | -0.4 | 0.26 | 0.26 | 1 | -0.51 | 400 | 401 |
| mol:Ca2+ | -0.41 | 0.28 | -10000 | 0 | -0.53 | 398 | 398 |
| mol:DAG | -0.41 | 0.28 | -10000 | 0 | -0.53 | 398 | 398 |
| NPHS2 | -0.34 | 0.33 | -10000 | 0 | -0.69 | 235 | 235 |
| mol:IP3 | -0.41 | 0.28 | -10000 | 0 | -0.53 | 398 | 398 |
| regulation of endocytosis | -0.37 | 0.25 | -10000 | 0 | -0.62 | 211 | 211 |
| Nephrin/NEPH1/podocin/Cholesterol | -0.42 | 0.28 | -10000 | 0 | -0.54 | 404 | 404 |
| establishment of cell polarity | -0.39 | 0.23 | -10000 | 0 | -0.52 | 379 | 379 |
| Nephrin/NEPH1/podocin/NCK1-2 | -0.38 | 0.27 | -10000 | 0 | -0.65 | 209 | 209 |
| Nephrin/NEPH1/beta Arrestin2 | -0.38 | 0.25 | -10000 | 0 | -0.63 | 211 | 211 |
| NPHS1 | -0.51 | 0.28 | -10000 | 0 | -0.67 | 392 | 392 |
| Nephrin/NEPH1/podocin | -0.4 | 0.26 | -10000 | 0 | -0.51 | 404 | 404 |
| TJP1 | 0.03 | 0.003 | -10000 | 0 | -10000 | 0 | 0 |
| NCK1 | 0.027 | 0.03 | -10000 | 0 | -0.64 | 1 | 1 |
| NCK2 | 0.029 | 0.006 | -10000 | 0 | -10000 | 0 | 0 |
| heterophilic cell adhesion | 0 | 0 | -10000 | 0 | -10000 | 0 | 0 |
| Nephrin/NEPH1/podocin/PLCgamma1 | -0.41 | 0.28 | -10000 | 0 | -0.54 | 398 | 398 |
| CD2AP | 0.029 | 0.006 | -10000 | 0 | -10000 | 0 | 0 |
| Nephrin/NEPH1/podocin/GRB2 | -0.41 | 0.28 | -10000 | 0 | -0.54 | 395 | 395 |
| GRB2 | 0.029 | 0.005 | -10000 | 0 | -10000 | 0 | 0 |
| homophilic cell adhesion | 0 | 0 | -10000 | 0 | -10000 | 0 | 0 |
| TRPC6 | -0.39 | 0.26 | 0.28 | 1 | -0.5 | 397 | 398 |
| cytoskeleton organization | -0.43 | 0.28 | -10000 | 0 | -0.59 | 349 | 349 |
| Nephrin/NEPH1 | -0.29 | 0.17 | -10000 | 0 | -0.38 | 379 | 379 |
| Nephrin/NEPH1/ZO-1 | -0.32 | 0.2 | -10000 | 0 | -0.43 | 377 | 377 |
Figure S2. Get High-res Image This plot shows pathway concept perturbations across all samples against a permutation model. The concepts along the x-axis are sorted by lowest to highest mean activity for the real patient samples. Mean inferred activities are plotted along the y-axis as a colored band showing the average level and one standard deviation range. Real samples are shown in red and permuted samples in black.
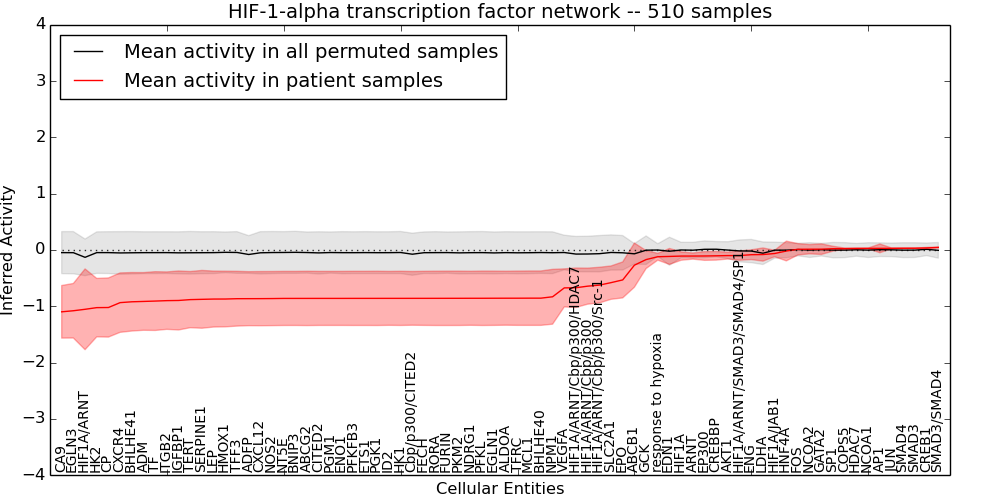
Table S2. Get Full Table This table displays mean, standard deviation, and perturbation statistics for Inferred Pathway Levels (IPLs). A mean perturbation of -9999 implies that the IPLs across all the real samples did not differ enough from the IPLs generated by a background model of permuted samples (> 1 Std.Dev from the permuted sample IPLs).
| Entity | Mean | Std.Dev | Mean.of.Up.Perturbations | Number.of.Up.Perturbations | Mean.of.Down.Perturbations | Number.of.Down.Perturbations | Number.of.Total.Perturbations |
|---|---|---|---|---|---|---|---|
| PKM2 | -0.86 | 0.48 | -10000 | 0 | -1.2 | 294 | 294 |
| HDAC7 | 0.027 | 0.01 | -10000 | 0 | -10000 | 0 | 0 |
| HIF1A/ARNT/Cbp/p300/Src-1 | -0.62 | 0.32 | -10000 | 0 | -0.89 | 234 | 234 |
| SMAD4 | 0.031 | 0.005 | -10000 | 0 | -10000 | 0 | 0 |
| ID2 | -0.86 | 0.48 | -10000 | 0 | -1.2 | 292 | 292 |
| AP1 | 0.029 | 0.078 | -10000 | 0 | -0.46 | 12 | 12 |
| ABCG2 | -0.86 | 0.48 | -10000 | 0 | -1.2 | 298 | 298 |
| HIF1A | -0.11 | 0.074 | -10000 | 0 | -0.77 | 2 | 2 |
| TFF3 | -0.87 | 0.49 | -10000 | 0 | -1.2 | 296 | 296 |
| GATA2 | 0.015 | 0.094 | -10000 | 0 | -0.6 | 11 | 11 |
| AKT1 | -0.099 | 0.061 | -10000 | 0 | -0.31 | 1 | 1 |
| response to hypoxia | -0.12 | 0.061 | -10000 | 0 | -0.3 | 12 | 12 |
| MCL1 | -0.86 | 0.48 | -10000 | 0 | -1.2 | 292 | 292 |
| NDRG1 | -0.86 | 0.48 | -10000 | 0 | -1.2 | 294 | 294 |
| SERPINE1 | -0.88 | 0.51 | -10000 | 0 | -1.2 | 293 | 293 |
| FECH | -0.86 | 0.48 | -10000 | 0 | -1.2 | 293 | 293 |
| FURIN | -0.86 | 0.48 | -10000 | 0 | -1.2 | 297 | 297 |
| NCOA2 | 0.014 | 0.083 | -10000 | 0 | -0.64 | 8 | 8 |
| EP300 | -0.11 | 0.078 | -10000 | 0 | -0.39 | 8 | 8 |
| HMOX1 | -0.87 | 0.5 | -10000 | 0 | -1.2 | 300 | 300 |
| BHLHE40 | -0.86 | 0.48 | -10000 | 0 | -1.2 | 294 | 294 |
| BHLHE41 | -0.92 | 0.52 | -10000 | 0 | -1.3 | 308 | 308 |
| HIF1A/ARNT/SMAD3/SMAD4/SP1 | -0.099 | 0.083 | -10000 | 0 | -0.54 | 2 | 2 |
| ENG | -0.084 | 0.087 | 0.43 | 1 | -0.49 | 2 | 3 |
| JUN | 0.029 | 0.007 | -10000 | 0 | -10000 | 0 | 0 |
| RORA | -0.86 | 0.48 | -10000 | 0 | -1.2 | 294 | 294 |
| ABCB1 | -0.27 | 0.39 | -10000 | 0 | -1.3 | 64 | 64 |
| TFRC | -0.86 | 0.48 | -10000 | 0 | -1.2 | 293 | 293 |
| CXCR4 | -0.94 | 0.53 | -10000 | 0 | -1.3 | 308 | 308 |
| TF | -0.91 | 0.52 | -10000 | 0 | -1.3 | 301 | 301 |
| CITED2 | -0.86 | 0.48 | -10000 | 0 | -1.2 | 293 | 293 |
| HIF1A/ARNT | -1.1 | 0.72 | -10000 | 0 | -1.4 | 328 | 328 |
| LDHA | -0.081 | 0.12 | -10000 | 0 | -0.78 | 12 | 12 |
| ETS1 | -0.86 | 0.48 | -10000 | 0 | -1.2 | 294 | 294 |
| PGK1 | -0.86 | 0.48 | -10000 | 0 | -1.2 | 294 | 294 |
| NOS2 | -0.86 | 0.48 | -10000 | 0 | -1.2 | 294 | 294 |
| ITGB2 | -0.9 | 0.51 | -10000 | 0 | -1.2 | 308 | 308 |
| ALDOA | -0.86 | 0.48 | -10000 | 0 | -1.2 | 291 | 291 |
| Cbp/p300/CITED2 | -0.86 | 0.48 | -10000 | 0 | -1.2 | 279 | 279 |
| FOS | 0.013 | 0.1 | -10000 | 0 | -0.63 | 12 | 12 |
| HK2 | -1 | 0.52 | -10000 | 0 | -1.3 | 362 | 362 |
| SP1 | 0.023 | 0.043 | -10000 | 0 | -10000 | 0 | 0 |
| GCK | -0.17 | 0.16 | -10000 | 0 | -0.84 | 13 | 13 |
| HK1 | -0.86 | 0.48 | -10000 | 0 | -1.2 | 294 | 294 |
| NPM1 | -0.83 | 0.49 | -10000 | 0 | -1.2 | 283 | 283 |
| EGLN1 | -0.86 | 0.48 | -10000 | 0 | -1.2 | 293 | 293 |
| CREB1 | 0.036 | 0.01 | -10000 | 0 | -10000 | 0 | 0 |
| PGM1 | -0.86 | 0.48 | -10000 | 0 | -1.2 | 297 | 297 |
| SMAD3 | 0.031 | 0.003 | -10000 | 0 | -10000 | 0 | 0 |
| EDN1 | -0.11 | 0.14 | -10000 | 0 | -0.62 | 16 | 16 |
| IGFBP1 | -0.9 | 0.52 | -10000 | 0 | -1.3 | 296 | 296 |
| VEGFA | -0.67 | 0.34 | -10000 | 0 | -0.93 | 272 | 272 |
| HIF1A/JAB1 | -0.062 | 0.057 | -10000 | 0 | -0.58 | 2 | 2 |
| CP | -1 | 0.53 | -10000 | 0 | -1.3 | 354 | 354 |
| CXCL12 | -0.86 | 0.48 | -10000 | 0 | -1.2 | 295 | 295 |
| COPS5 | 0.025 | 0.01 | -10000 | 0 | -10000 | 0 | 0 |
| SMAD3/SMAD4 | 0.046 | 0.008 | -10000 | 0 | -10000 | 0 | 0 |
| BNIP3 | -0.86 | 0.48 | -10000 | 0 | -1.2 | 294 | 294 |
| EGLN3 | -1.1 | 0.48 | -10000 | 0 | -1.3 | 376 | 376 |
| CA9 | -1.1 | 0.47 | -10000 | 0 | -1.3 | 384 | 384 |
| TERT | -0.88 | 0.5 | -10000 | 0 | -1.2 | 292 | 292 |
| ENO1 | -0.86 | 0.48 | -10000 | 0 | -1.2 | 294 | 294 |
| PFKL | -0.86 | 0.48 | -10000 | 0 | -1.2 | 294 | 294 |
| NCOA1 | 0.029 | 0.005 | -10000 | 0 | -10000 | 0 | 0 |
| ADM | -0.91 | 0.51 | -10000 | 0 | -1.3 | 306 | 306 |
| ARNT | -0.11 | 0.055 | -10000 | 0 | -10000 | 0 | 0 |
| HNF4A | -0.018 | 0.18 | -10000 | 0 | -0.64 | 38 | 38 |
| ADFP | -0.86 | 0.48 | -10000 | 0 | -1.2 | 304 | 304 |
| SLC2A1 | -0.58 | 0.3 | -10000 | 0 | -0.84 | 212 | 212 |
| LEP | -0.87 | 0.5 | -10000 | 0 | -1.2 | 298 | 298 |
| HIF1A/ARNT/Cbp/p300 | -0.64 | 0.32 | -10000 | 0 | -0.91 | 245 | 245 |
| EPO | -0.53 | 0.32 | -10000 | 0 | -0.89 | 180 | 180 |
| CREBBP | -0.1 | 0.077 | -10000 | 0 | -0.32 | 19 | 19 |
| HIF1A/ARNT/Cbp/p300/HDAC7 | -0.67 | 0.35 | -10000 | 0 | -0.95 | 248 | 248 |
| PFKFB3 | -0.86 | 0.48 | -10000 | 0 | -1.2 | 294 | 294 |
| NT5E | -0.86 | 0.48 | -10000 | 0 | -1.2 | 294 | 294 |
Figure S3. Get High-res Image This plot shows pathway concept perturbations across all samples against a permutation model. The concepts along the x-axis are sorted by lowest to highest mean activity for the real patient samples. Mean inferred activities are plotted along the y-axis as a colored band showing the average level and one standard deviation range. Real samples are shown in red and permuted samples in black.
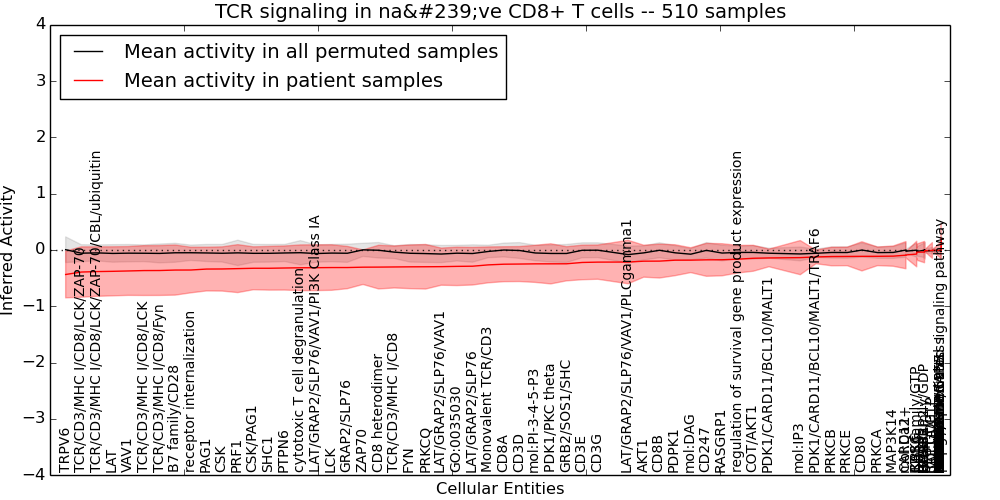
Table S3. Get Full Table This table displays mean, standard deviation, and perturbation statistics for Inferred Pathway Levels (IPLs). A mean perturbation of -9999 implies that the IPLs across all the real samples did not differ enough from the IPLs generated by a background model of permuted samples (> 1 Std.Dev from the permuted sample IPLs).
| Entity | Mean | Std.Dev | Mean.of.Up.Perturbations | Number.of.Up.Perturbations | Mean.of.Down.Perturbations | Number.of.Down.Perturbations | Number.of.Total.Perturbations |
|---|---|---|---|---|---|---|---|
| GRB2/SOS1/SHC | -0.24 | 0.3 | 0.3 | 5 | -0.58 | 203 | 208 |
| FYN | -0.3 | 0.39 | 0.44 | 12 | -0.71 | 219 | 231 |
| LAT/GRAP2/SLP76 | -0.29 | 0.33 | 0.38 | 3 | -0.65 | 211 | 214 |
| IKBKB | 0.028 | 0.008 | -10000 | 0 | -10000 | 0 | 0 |
| AKT1 | -0.2 | 0.28 | 0.45 | 20 | -0.48 | 220 | 240 |
| B2M | 0.026 | 0.007 | -10000 | 0 | -10000 | 0 | 0 |
| IKBKG | -0.056 | 0.085 | 0.17 | 9 | -0.17 | 68 | 77 |
| MAP3K8 | 0.027 | 0.039 | -10000 | 0 | -0.59 | 2 | 2 |
| mol:Ca2+ | -0.088 | 0.054 | 0.071 | 12 | -0.12 | 331 | 343 |
| integrin-mediated signaling pathway | 0.026 | 0.069 | -10000 | 0 | -0.37 | 15 | 15 |
| LAT/GRAP2/SLP76/VAV1/PI3K Class IA | -0.32 | 0.41 | 0.5 | 15 | -0.72 | 229 | 244 |
| TRPV6 | -0.44 | 0.42 | 0.7 | 44 | -0.64 | 394 | 438 |
| CD28 | -0.019 | 0.16 | -10000 | 0 | -0.59 | 38 | 38 |
| SHC1 | -0.32 | 0.39 | 0.42 | 6 | -0.73 | 225 | 231 |
| receptor internalization | -0.36 | 0.41 | 0.46 | 1 | -0.76 | 233 | 234 |
| PRF1 | -0.33 | 0.43 | 0.41 | 1 | -0.83 | 187 | 188 |
| KRAS | 0.029 | 0.006 | -10000 | 0 | -10000 | 0 | 0 |
| GRB2 | 0.029 | 0.005 | -10000 | 0 | -10000 | 0 | 0 |
| COT/AKT1 | -0.15 | 0.23 | 0.42 | 18 | -0.38 | 202 | 220 |
| LAT | -0.38 | 0.44 | 0.48 | 6 | -0.81 | 232 | 238 |
| EntrezGene:6955 | -0.003 | 0.005 | -10000 | 0 | -10000 | 0 | 0 |
| CD3D | -0.25 | 0.31 | -10000 | 0 | -0.6 | 228 | 228 |
| CD3E | -0.22 | 0.31 | -10000 | 0 | -0.6 | 204 | 204 |
| CD3G | -0.22 | 0.3 | -10000 | 0 | -0.6 | 200 | 200 |
| RASGRP2 | -0.014 | 0.029 | 0.095 | 4 | -0.12 | 3 | 7 |
| RASGRP1 | -0.17 | 0.29 | 0.47 | 24 | -0.46 | 205 | 229 |
| HLA-A | 0.022 | 0.04 | -10000 | 0 | -0.6 | 2 | 2 |
| RASSF5 | 0.011 | 0.1 | -10000 | 0 | -0.59 | 15 | 15 |
| RAP1A/GTP/RAPL | 0.026 | 0.069 | -10000 | 0 | -0.37 | 15 | 15 |
| mol:GTP | 0 | 0 | -10000 | 0 | -10000 | 0 | 0 |
| mol:GDP | -0.008 | 0.14 | 0.25 | 56 | -0.14 | 4 | 60 |
| PDK1/CARD11/BCL10/MALT1/TRAF6 | -0.12 | 0.12 | -10000 | 0 | -0.27 | 171 | 171 |
| PRKCA | -0.11 | 0.17 | 0.19 | 30 | -0.3 | 164 | 194 |
| GRAP2 | -0.013 | 0.16 | -10000 | 0 | -0.59 | 35 | 35 |
| mol:IP3 | -0.14 | 0.3 | 0.24 | 150 | -0.46 | 203 | 353 |
| EntrezGene:6957 | -0.003 | 0.006 | -10000 | 0 | -10000 | 0 | 0 |
| TCR/CD3/MHC I/CD8 | -0.3 | 0.37 | 0.26 | 1 | -0.7 | 223 | 224 |
| ORAI1 | 0.2 | 0.26 | 0.67 | 6 | -0.56 | 44 | 50 |
| CSK | -0.34 | 0.39 | 0.37 | 5 | -0.74 | 228 | 233 |
| B7 family/CD28 | -0.36 | 0.45 | 0.32 | 2 | -0.82 | 219 | 221 |
| CHUK | 0.029 | 0.006 | -10000 | 0 | -10000 | 0 | 0 |
| TCR/CD3/MHC I/CD8/LCK/ZAP-70 | -0.39 | 0.45 | -10000 | 0 | -0.84 | 233 | 233 |
| PTPN6 | -0.32 | 0.39 | 0.28 | 2 | -0.73 | 225 | 227 |
| VAV1 | -0.37 | 0.43 | 0.53 | 4 | -0.8 | 232 | 236 |
| Monovalent TCR/CD3 | -0.26 | 0.32 | -10000 | 0 | -0.61 | 222 | 222 |
| CBL | 0.029 | 0.03 | -10000 | 0 | -0.64 | 1 | 1 |
| LCK | -0.31 | 0.4 | 0.44 | 11 | -0.74 | 219 | 230 |
| PAG1 | -0.34 | 0.39 | 0.3 | 3 | -0.74 | 228 | 231 |
| RAP1A | 0.029 | 0.005 | -10000 | 0 | -10000 | 0 | 0 |
| TCR/CD3/MHC I/CD8/LCK | -0.37 | 0.44 | -10000 | 0 | -0.81 | 232 | 232 |
| CD80 | -0.11 | 0.26 | -10000 | 0 | -0.6 | 114 | 114 |
| CD86 | -0.072 | 0.23 | -10000 | 0 | -0.59 | 81 | 81 |
| PDK1/CARD11/BCL10/MALT1 | -0.14 | 0.16 | 0.16 | 1 | -0.32 | 177 | 178 |
| HRAS | 0.029 | 0.027 | -10000 | 0 | -0.59 | 1 | 1 |
| GO:0035030 | -0.29 | 0.34 | 0.42 | 3 | -0.65 | 220 | 223 |
| CD8A | -0.25 | 0.31 | -10000 | 0 | -0.6 | 230 | 230 |
| CD8B | -0.2 | 0.3 | -10000 | 0 | -0.6 | 184 | 184 |
| PTPRC | -0.037 | 0.19 | -10000 | 0 | -0.59 | 53 | 53 |
| PDK1/PKC theta | -0.25 | 0.36 | 0.55 | 22 | -0.6 | 221 | 243 |
| CSK/PAG1 | -0.32 | 0.38 | 0.41 | 5 | -0.72 | 226 | 231 |
| SOS1 | 0.029 | 0.005 | -10000 | 0 | -10000 | 0 | 0 |
| peptide-MHC class I | 0.033 | 0.034 | -10000 | 0 | -0.44 | 2 | 2 |
| GRAP2/SLP76 | -0.31 | 0.38 | 0.34 | 1 | -0.71 | 216 | 217 |
| STIM1 | 0.11 | 0.11 | 0.95 | 1 | -0.6 | 3 | 4 |
| RAS family/GTP | -0.038 | 0.14 | 0.33 | 28 | -0.2 | 3 | 31 |
| TCR/CD3/MHC I/CD8/LCK/ZAP-70/CBL/ubiquitin | -0.38 | 0.44 | 0.47 | 1 | -0.82 | 233 | 234 |
| mol:DAG | -0.18 | 0.22 | 0.14 | 2 | -0.42 | 213 | 215 |
| RAP1A/GDP | 0.001 | 0.082 | 0.2 | 30 | -10000 | 0 | 30 |
| PLCG1 | 0.029 | 0.006 | -10000 | 0 | -10000 | 0 | 0 |
| CD247 | -0.18 | 0.29 | -10000 | 0 | -0.6 | 166 | 166 |
| cytotoxic T cell degranulation | -0.32 | 0.41 | 0.41 | 1 | -0.78 | 192 | 193 |
| RAP1A/GTP | -0.005 | 0.01 | -10000 | 0 | -10000 | 0 | 0 |
| mol:PI-3-4-5-P3 | -0.25 | 0.33 | 0.43 | 19 | -0.57 | 228 | 247 |
| LAT/GRAP2/SLP76/VAV1/PLCgamma1 | -0.21 | 0.39 | 0.27 | 112 | -0.62 | 210 | 322 |
| NRAS | 0.029 | 0.005 | -10000 | 0 | -10000 | 0 | 0 |
| ZAP70 | -0.3 | 0.31 | -10000 | 0 | -0.59 | 276 | 276 |
| GRB2/SOS1 | 0.043 | 0.01 | -10000 | 0 | -10000 | 0 | 0 |
| LAT/GRAP2/SLP76/VAV1 | -0.3 | 0.33 | 0.31 | 1 | -0.65 | 217 | 218 |
| MALT1 | 0.029 | 0.005 | -10000 | 0 | -10000 | 0 | 0 |
| TRAF6 | 0.03 | 0.003 | -10000 | 0 | -10000 | 0 | 0 |
| CD8 heterodimer | -0.3 | 0.39 | -10000 | 0 | -0.71 | 236 | 236 |
| CARD11 | -0.092 | 0.24 | -10000 | 0 | -0.59 | 98 | 98 |
| PRKCB | -0.12 | 0.16 | 0.18 | 27 | -0.3 | 176 | 203 |
| PRKCE | -0.11 | 0.16 | 0.18 | 28 | -0.3 | 169 | 197 |
| PRKCQ | -0.3 | 0.4 | 0.47 | 21 | -0.7 | 227 | 248 |
| LCP2 | -0.013 | 0.14 | -10000 | 0 | -0.59 | 30 | 30 |
| BCL10 | 0.029 | 0.006 | -10000 | 0 | -10000 | 0 | 0 |
| regulation of survival gene product expression | -0.16 | 0.25 | 0.41 | 22 | -0.41 | 216 | 238 |
| IKK complex | -0.005 | 0.15 | 0.28 | 62 | -0.13 | 5 | 67 |
| RAS family/GDP | -0.012 | 0.013 | -10000 | 0 | -10000 | 0 | 0 |
| MAP3K14 | -0.11 | 0.18 | 0.37 | 17 | -0.3 | 165 | 182 |
| PDPK1 | -0.18 | 0.28 | 0.48 | 21 | -0.46 | 213 | 234 |
| TCR/CD3/MHC I/CD8/Fyn | -0.36 | 0.44 | 0.43 | 1 | -0.83 | 226 | 227 |
Figure S4. Get High-res Image This plot shows pathway concept perturbations across all samples against a permutation model. The concepts along the x-axis are sorted by lowest to highest mean activity for the real patient samples. Mean inferred activities are plotted along the y-axis as a colored band showing the average level and one standard deviation range. Real samples are shown in red and permuted samples in black.
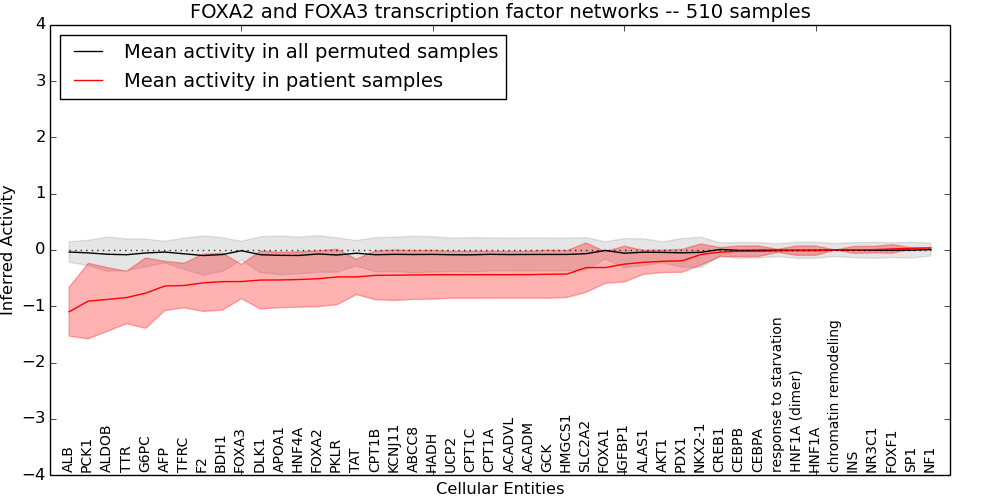
Table S4. Get Full Table This table displays mean, standard deviation, and perturbation statistics for Inferred Pathway Levels (IPLs). A mean perturbation of -9999 implies that the IPLs across all the real samples did not differ enough from the IPLs generated by a background model of permuted samples (> 1 Std.Dev from the permuted sample IPLs).
| Entity | Mean | Std.Dev | Mean.of.Up.Perturbations | Number.of.Up.Perturbations | Mean.of.Down.Perturbations | Number.of.Down.Perturbations | Number.of.Total.Perturbations |
|---|---|---|---|---|---|---|---|
| ACADVL | -0.44 | 0.42 | -9999 | 0 | -0.99 | 136 | 136 |
| PCK1 | -0.91 | 0.67 | -9999 | 0 | -1.3 | 314 | 314 |
| HNF4A | -0.52 | 0.49 | -9999 | 0 | -1.2 | 141 | 141 |
| KCNJ11 | -0.45 | 0.45 | -9999 | 0 | -1.1 | 132 | 132 |
| AKT1 | -0.2 | 0.2 | -9999 | 0 | -0.54 | 52 | 52 |
| response to starvation | -0.015 | 0.027 | -9999 | 0 | -10000 | 0 | 0 |
| DLK1 | -0.53 | 0.52 | -9999 | 0 | -1.1 | 171 | 171 |
| NKX2-1 | -0.08 | 0.19 | -9999 | 0 | -0.66 | 9 | 9 |
| ACADM | -0.44 | 0.42 | -9999 | 0 | -0.99 | 135 | 135 |
| TAT | -0.48 | 0.31 | -9999 | 0 | -0.75 | 236 | 236 |
| CEBPB | -0.023 | 0.093 | -9999 | 0 | -0.64 | 9 | 9 |
| CEBPA | -0.022 | 0.094 | -9999 | 0 | -0.63 | 10 | 10 |
| TTR | -0.84 | 0.47 | -9999 | 0 | -1.2 | 298 | 298 |
| PKLR | -0.48 | 0.49 | -9999 | 0 | -1.2 | 136 | 136 |
| APOA1 | -0.53 | 0.49 | -9999 | 0 | -1.2 | 143 | 143 |
| CPT1C | -0.44 | 0.42 | -9999 | 0 | -1 | 132 | 132 |
| ALAS1 | -0.22 | 0.21 | -9999 | 0 | -0.62 | 38 | 38 |
| TFRC | -0.63 | 0.4 | -9999 | 0 | -0.93 | 264 | 264 |
| FOXF1 | 0.019 | 0.076 | -9999 | 0 | -0.57 | 8 | 8 |
| NF1 | 0.036 | 0.006 | -9999 | 0 | -10000 | 0 | 0 |
| HNF1A (dimer) | -0.011 | 0.083 | -9999 | 0 | -0.68 | 4 | 4 |
| CPT1A | -0.44 | 0.42 | -9999 | 0 | -0.99 | 136 | 136 |
| HMGCS1 | -0.43 | 0.42 | -9999 | 0 | -0.99 | 130 | 130 |
| NR3C1 | 0.006 | 0.058 | -9999 | 0 | -0.67 | 1 | 1 |
| CPT1B | -0.45 | 0.43 | -9999 | 0 | -1 | 134 | 134 |
| chromatin remodeling | 0 | 0 | -9999 | 0 | -10000 | 0 | 0 |
| SP1 | 0.03 | 0.007 | -9999 | 0 | -10000 | 0 | 0 |
| GCK | -0.43 | 0.43 | -9999 | 0 | -1 | 130 | 130 |
| CREB1 | -0.038 | 0.08 | -9999 | 0 | -0.25 | 8 | 8 |
| IGFBP1 | -0.25 | 0.32 | -9999 | 0 | -0.79 | 96 | 96 |
| PDX1 | -0.19 | 0.2 | -9999 | 0 | -0.8 | 11 | 11 |
| UCP2 | -0.44 | 0.42 | -9999 | 0 | -1 | 133 | 133 |
| ALDOB | -0.88 | 0.57 | -9999 | 0 | -1.2 | 382 | 382 |
| AFP | -0.64 | 0.44 | -9999 | 0 | -0.86 | 320 | 320 |
| BDH1 | -0.56 | 0.51 | -9999 | 0 | -1.1 | 199 | 199 |
| HADH | -0.44 | 0.43 | -9999 | 0 | -1 | 129 | 129 |
| F2 | -0.58 | 0.51 | -9999 | 0 | -1.2 | 171 | 171 |
| HNF1A | -0.011 | 0.083 | -9999 | 0 | -0.68 | 4 | 4 |
| G6PC | -0.77 | 0.62 | -9999 | 0 | -1.4 | 240 | 240 |
| SLC2A2 | -0.31 | 0.44 | -9999 | 0 | -1.5 | 46 | 46 |
| INS | 0.001 | 0.062 | -9999 | 0 | -10000 | 0 | 0 |
| FOXA1 | -0.31 | 0.28 | -9999 | 0 | -0.71 | 142 | 142 |
| FOXA3 | -0.56 | 0.31 | -9999 | 0 | -0.72 | 355 | 355 |
| FOXA2 | -0.51 | 0.5 | -9999 | 0 | -1.1 | 145 | 145 |
| ABCC8 | -0.44 | 0.43 | -9999 | 0 | -1 | 125 | 125 |
| ALB | -1.1 | 0.44 | -9999 | 0 | -1.2 | 440 | 440 |
Figure S5. Get High-res Image This plot shows pathway concept perturbations across all samples against a permutation model. The concepts along the x-axis are sorted by lowest to highest mean activity for the real patient samples. Mean inferred activities are plotted along the y-axis as a colored band showing the average level and one standard deviation range. Real samples are shown in red and permuted samples in black.
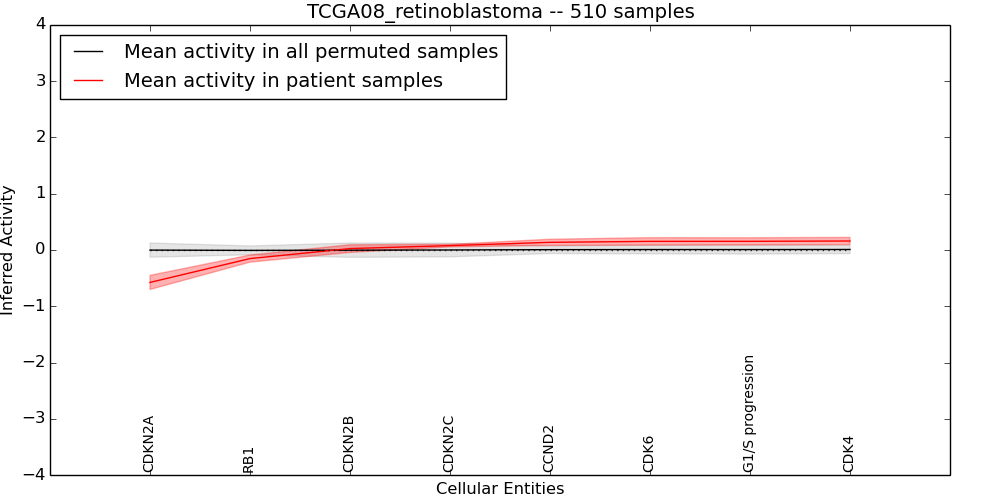
Table S5. Get Full Table This table displays mean, standard deviation, and perturbation statistics for Inferred Pathway Levels (IPLs). A mean perturbation of -9999 implies that the IPLs across all the real samples did not differ enough from the IPLs generated by a background model of permuted samples (> 1 Std.Dev from the permuted sample IPLs).
| Entity | Mean | Std.Dev | Mean.of.Up.Perturbations | Number.of.Up.Perturbations | Mean.of.Down.Perturbations | Number.of.Down.Perturbations | Number.of.Total.Perturbations |
|---|---|---|---|---|---|---|---|
| CDKN2B | 0.025 | 0.068 | -10000 | 0 | -0.59 | 6 | 6 |
| CDKN2C | 0.078 | 0.023 | -10000 | 0 | -10000 | 0 | 0 |
| CDKN2A | -0.58 | 0.12 | -10000 | 0 | -0.6 | 489 | 489 |
| CCND2 | 0.14 | 0.055 | 0.22 | 90 | -10000 | 0 | 90 |
| RB1 | -0.15 | 0.064 | 0.28 | 1 | -0.24 | 90 | 91 |
| CDK4 | 0.16 | 0.064 | 0.3 | 54 | -10000 | 0 | 54 |
| CDK6 | 0.15 | 0.066 | 0.25 | 87 | -0.16 | 1 | 88 |
| G1/S progression | 0.15 | 0.064 | 0.24 | 92 | -0.27 | 1 | 93 |
Figure S6. Get High-res Image This plot shows pathway concept perturbations across all samples against a permutation model. The concepts along the x-axis are sorted by lowest to highest mean activity for the real patient samples. Mean inferred activities are plotted along the y-axis as a colored band showing the average level and one standard deviation range. Real samples are shown in red and permuted samples in black.
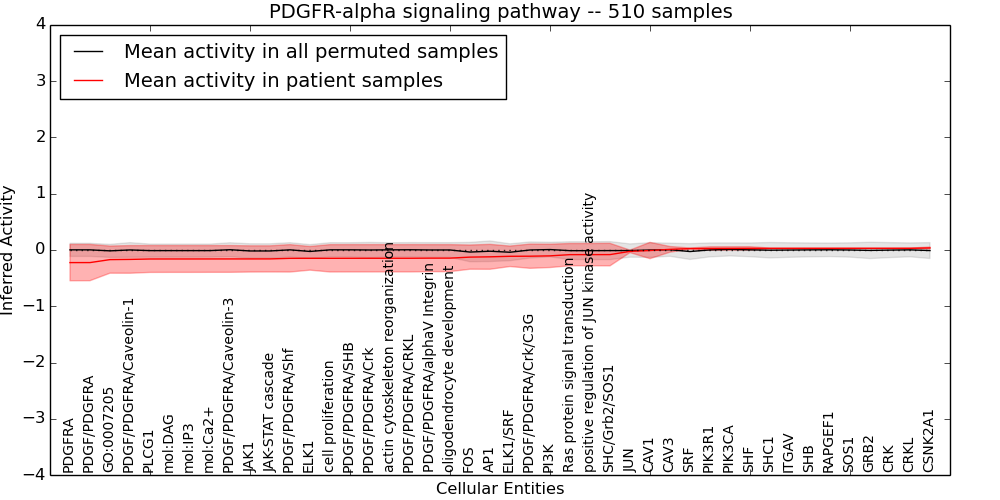
Table S6. Get Full Table This table displays mean, standard deviation, and perturbation statistics for Inferred Pathway Levels (IPLs). A mean perturbation of -9999 implies that the IPLs across all the real samples did not differ enough from the IPLs generated by a background model of permuted samples (> 1 Std.Dev from the permuted sample IPLs).
| Entity | Mean | Std.Dev | Mean.of.Up.Perturbations | Number.of.Up.Perturbations | Mean.of.Down.Perturbations | Number.of.Down.Perturbations | Number.of.Total.Perturbations |
|---|---|---|---|---|---|---|---|
| PDGFRA | -0.22 | 0.32 | -10000 | 0 | -0.63 | 196 | 196 |
| PDGF/PDGFRA/CRKL | -0.15 | 0.24 | -10000 | 0 | -0.46 | 190 | 190 |
| positive regulation of JUN kinase activity | -0.082 | 0.2 | -10000 | 0 | -0.35 | 172 | 172 |
| CRKL | 0.03 | 0.004 | -10000 | 0 | -10000 | 0 | 0 |
| PDGF/PDGFRA/Caveolin-3 | -0.16 | 0.24 | -10000 | 0 | -0.46 | 196 | 196 |
| AP1 | -0.12 | 0.22 | 0.47 | 1 | -1 | 12 | 13 |
| mol:IP3 | -0.16 | 0.24 | -10000 | 0 | -0.47 | 187 | 187 |
| PLCG1 | -0.16 | 0.24 | -10000 | 0 | -0.47 | 187 | 187 |
| PDGF/PDGFRA/alphaV Integrin | -0.14 | 0.24 | -10000 | 0 | -0.46 | 185 | 185 |
| RAPGEF1 | 0.029 | 0.006 | -10000 | 0 | -10000 | 0 | 0 |
| CRK | 0.029 | 0.005 | -10000 | 0 | -10000 | 0 | 0 |
| mol:Ca2+ | -0.16 | 0.24 | -10000 | 0 | -0.47 | 187 | 187 |
| CAV3 | 0.012 | 0.05 | -10000 | 0 | -0.63 | 3 | 3 |
| CAV1 | -0.009 | 0.14 | -10000 | 0 | -0.59 | 30 | 30 |
| SHC/Grb2/SOS1 | -0.082 | 0.2 | -10000 | 0 | -0.35 | 172 | 172 |
| PDGF/PDGFRA/Shf | -0.15 | 0.24 | -10000 | 0 | -0.46 | 192 | 192 |
| FOS | -0.13 | 0.22 | -10000 | 0 | -1 | 12 | 12 |
| JUN | -0.024 | 0.022 | -10000 | 0 | -10000 | 0 | 0 |
| oligodendrocyte development | -0.14 | 0.24 | -10000 | 0 | -0.46 | 185 | 185 |
| GRB2 | 0.029 | 0.005 | -10000 | 0 | -10000 | 0 | 0 |
| PIK3R1 | 0.026 | 0.031 | -10000 | 0 | -0.64 | 1 | 1 |
| mol:DAG | -0.16 | 0.24 | -10000 | 0 | -0.47 | 187 | 187 |
| PDGF/PDGFRA | -0.22 | 0.32 | -10000 | 0 | -0.63 | 196 | 196 |
| actin cytoskeleton reorganization | -0.15 | 0.24 | -10000 | 0 | -0.46 | 192 | 192 |
| SRF | 0.025 | 0.01 | -10000 | 0 | -10000 | 0 | 0 |
| SHC1 | 0.029 | 0.007 | -10000 | 0 | -10000 | 0 | 0 |
| PI3K | -0.1 | 0.21 | -10000 | 0 | -0.39 | 166 | 166 |
| PDGF/PDGFRA/Crk/C3G | -0.11 | 0.22 | -10000 | 0 | -0.39 | 190 | 190 |
| JAK1 | -0.16 | 0.23 | -10000 | 0 | -0.46 | 192 | 192 |
| ELK1/SRF | -0.11 | 0.18 | -10000 | 0 | -0.35 | 173 | 173 |
| SHB | 0.029 | 0.006 | -10000 | 0 | -10000 | 0 | 0 |
| SHF | 0.029 | 0.03 | -10000 | 0 | -0.64 | 1 | 1 |
| CSNK2A1 | 0.037 | 0.017 | -10000 | 0 | -10000 | 0 | 0 |
| GO:0007205 | -0.17 | 0.24 | -10000 | 0 | -0.48 | 195 | 195 |
| SOS1 | 0.029 | 0.005 | -10000 | 0 | -10000 | 0 | 0 |
| Ras protein signal transduction | -0.082 | 0.2 | -10000 | 0 | -0.35 | 172 | 172 |
| PDGF/PDGFRA/SHB | -0.15 | 0.24 | -10000 | 0 | -0.46 | 192 | 192 |
| PDGF/PDGFRA/Caveolin-1 | -0.17 | 0.25 | -10000 | 0 | -0.46 | 196 | 196 |
| ITGAV | 0.029 | 0.007 | -10000 | 0 | -10000 | 0 | 0 |
| ELK1 | -0.15 | 0.21 | -10000 | 0 | -0.42 | 187 | 187 |
| PIK3CA | 0.027 | 0.03 | -10000 | 0 | -0.64 | 1 | 1 |
| PDGF/PDGFRA/Crk | -0.15 | 0.24 | -10000 | 0 | -0.46 | 191 | 191 |
| JAK-STAT cascade | -0.16 | 0.23 | -10000 | 0 | -0.46 | 192 | 192 |
| cell proliferation | -0.15 | 0.24 | -10000 | 0 | -0.46 | 192 | 192 |
Figure S7. Get High-res Image This plot shows pathway concept perturbations across all samples against a permutation model. The concepts along the x-axis are sorted by lowest to highest mean activity for the real patient samples. Mean inferred activities are plotted along the y-axis as a colored band showing the average level and one standard deviation range. Real samples are shown in red and permuted samples in black.
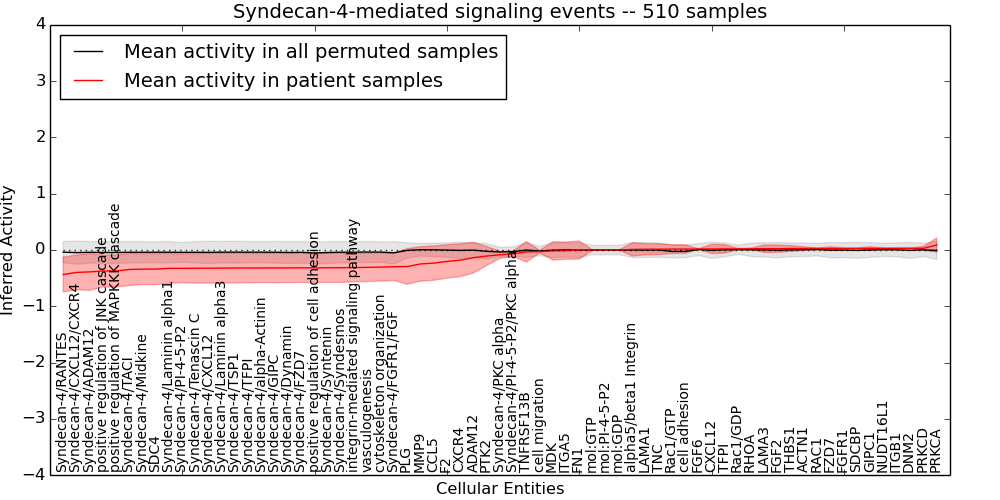
Table S7. Get Full Table This table displays mean, standard deviation, and perturbation statistics for Inferred Pathway Levels (IPLs). A mean perturbation of -9999 implies that the IPLs across all the real samples did not differ enough from the IPLs generated by a background model of permuted samples (> 1 Std.Dev from the permuted sample IPLs).
| Entity | Mean | Std.Dev | Mean.of.Up.Perturbations | Number.of.Up.Perturbations | Mean.of.Down.Perturbations | Number.of.Down.Perturbations | Number.of.Total.Perturbations |
|---|---|---|---|---|---|---|---|
| PTK2 | -0.11 | 0.17 | -10000 | 0 | -0.46 | 46 | 46 |
| Syndecan-4/Syndesmos | -0.32 | 0.26 | -10000 | 0 | -0.57 | 212 | 212 |
| positive regulation of JNK cascade | -0.37 | 0.28 | -10000 | 0 | -0.65 | 210 | 210 |
| Syndecan-4/ADAM12 | -0.39 | 0.33 | -10000 | 0 | -0.68 | 243 | 243 |
| CCL5 | -0.23 | 0.3 | -10000 | 0 | -0.59 | 217 | 217 |
| Rac1/GDP | 0.02 | 0.007 | -10000 | 0 | -10000 | 0 | 0 |
| DNM2 | 0.03 | 0.003 | -10000 | 0 | -10000 | 0 | 0 |
| ITGA5 | -0.012 | 0.15 | -10000 | 0 | -0.59 | 34 | 34 |
| SDCBP | 0.028 | 0.007 | -10000 | 0 | -10000 | 0 | 0 |
| PLG | -0.29 | 0.32 | -10000 | 0 | -0.59 | 265 | 265 |
| ADAM12 | -0.14 | 0.27 | -10000 | 0 | -0.59 | 136 | 136 |
| mol:GTP | 0 | 0 | -10000 | 0 | -10000 | 0 | 0 |
| NUDT16L1 | 0.029 | 0.006 | -10000 | 0 | -10000 | 0 | 0 |
| mol:PI-4-5-P2 | 0 | 0 | -10000 | 0 | -10000 | 0 | 0 |
| Syndecan-4/PKC alpha | -0.085 | 0.064 | -10000 | 0 | -10000 | 0 | 0 |
| Syndecan-4/Laminin alpha1 | -0.33 | 0.27 | -10000 | 0 | -0.59 | 205 | 205 |
| Syndecan-4/CXCL12/CXCR4 | -0.4 | 0.31 | -10000 | 0 | -0.72 | 202 | 202 |
| Syndecan-4/Laminin alpha3 | -0.32 | 0.26 | -10000 | 0 | -0.57 | 219 | 219 |
| MDK | -0.016 | 0.16 | -10000 | 0 | -0.59 | 38 | 38 |
| Syndecan-4/FZD7 | -0.32 | 0.26 | -10000 | 0 | -0.58 | 199 | 199 |
| Syndecan-4/Midkine | -0.34 | 0.28 | -10000 | 0 | -0.59 | 228 | 228 |
| FZD7 | 0.027 | 0.03 | -10000 | 0 | -0.64 | 1 | 1 |
| Syndecan-4/FGFR1/FGF | -0.3 | 0.25 | -10000 | 0 | -0.62 | 121 | 121 |
| THBS1 | 0.026 | 0.051 | -10000 | 0 | -0.64 | 3 | 3 |
| integrin-mediated signaling pathway | -0.31 | 0.25 | -10000 | 0 | -0.55 | 222 | 222 |
| positive regulation of MAPKKK cascade | -0.37 | 0.28 | -10000 | 0 | -0.65 | 210 | 210 |
| Syndecan-4/TACI | -0.35 | 0.28 | -10000 | 0 | -0.61 | 229 | 229 |
| CXCR4 | -0.18 | 0.29 | -10000 | 0 | -0.59 | 174 | 174 |
| cell adhesion | 0.016 | 0.076 | 0.22 | 4 | -0.3 | 13 | 17 |
| Syndecan-4/Dynamin | -0.32 | 0.26 | -10000 | 0 | -0.6 | 183 | 183 |
| Syndecan-4/TSP1 | -0.32 | 0.26 | -10000 | 0 | -0.58 | 205 | 205 |
| Syndecan-4/GIPC | -0.32 | 0.26 | -10000 | 0 | -0.58 | 203 | 203 |
| Syndecan-4/RANTES | -0.44 | 0.31 | -10000 | 0 | -0.68 | 273 | 273 |
| ITGB1 | 0.03 | 0.004 | -10000 | 0 | -10000 | 0 | 0 |
| LAMA1 | 0.013 | 0.099 | -10000 | 0 | -0.56 | 14 | 14 |
| LAMA3 | 0.022 | 0.067 | -10000 | 0 | -0.59 | 6 | 6 |
| RAC1 | 0.027 | 0.009 | -10000 | 0 | -10000 | 0 | 0 |
| PRKCA | 0.088 | 0.13 | 0.99 | 8 | -10000 | 0 | 8 |
| Syndecan-4/alpha-Actinin | -0.32 | 0.26 | -10000 | 0 | -0.57 | 217 | 217 |
| TFPI | 0.019 | 0.075 | -10000 | 0 | -0.57 | 8 | 8 |
| F2 | -0.2 | 0.3 | -10000 | 0 | -0.58 | 191 | 191 |
| alpha5/beta1 Integrin | 0.011 | 0.12 | -10000 | 0 | -0.43 | 34 | 34 |
| positive regulation of cell adhesion | -0.32 | 0.26 | -10000 | 0 | -0.59 | 182 | 182 |
| ACTN1 | 0.027 | 0.03 | -10000 | 0 | -0.64 | 1 | 1 |
| TNC | 0.015 | 0.097 | -10000 | 0 | -0.64 | 11 | 11 |
| Syndecan-4/CXCL12 | -0.32 | 0.26 | -10000 | 0 | -0.6 | 187 | 187 |
| FGF6 | 0.018 | 0.004 | -10000 | 0 | -10000 | 0 | 0 |
| RHOA | 0.021 | 0.014 | -10000 | 0 | -10000 | 0 | 0 |
| CXCL12 | 0.018 | 0.082 | -10000 | 0 | -0.54 | 10 | 10 |
| TNFRSF13B | -0.033 | 0.18 | -10000 | 0 | -0.59 | 50 | 50 |
| FGF2 | 0.023 | 0.065 | -10000 | 0 | -0.62 | 5 | 5 |
| FGFR1 | 0.028 | 0.009 | -10000 | 0 | -10000 | 0 | 0 |
| Syndecan-4/PI-4-5-P2 | -0.33 | 0.26 | -10000 | 0 | -0.55 | 245 | 245 |
| mol:GDP | 0 | 0 | -10000 | 0 | -10000 | 0 | 0 |
| FN1 | -0.001 | 0.16 | -10000 | 0 | -0.57 | 37 | 37 |
| cell migration | -0.028 | 0.021 | -10000 | 0 | -10000 | 0 | 0 |
| PRKCD | 0.03 | 0.036 | -10000 | 0 | -0.57 | 1 | 1 |
| vasculogenesis | -0.31 | 0.25 | -10000 | 0 | -0.56 | 205 | 205 |
| SDC4 | -0.34 | 0.28 | -10000 | 0 | -0.58 | 245 | 245 |
| Syndecan-4/Tenascin C | -0.32 | 0.26 | -10000 | 0 | -0.57 | 222 | 222 |
| Syndecan-4/PI-4-5-P2/PKC alpha | -0.067 | 0.049 | -10000 | 0 | -10000 | 0 | 0 |
| Syndecan-4/Syntenin | -0.32 | 0.26 | -10000 | 0 | -0.59 | 180 | 180 |
| MMP9 | -0.25 | 0.31 | -10000 | 0 | -0.58 | 231 | 231 |
| Rac1/GTP | 0.016 | 0.078 | 0.22 | 4 | -0.3 | 13 | 17 |
| cytoskeleton organization | -0.3 | 0.25 | -10000 | 0 | -0.55 | 212 | 212 |
| GIPC1 | 0.029 | 0.03 | -10000 | 0 | -0.64 | 1 | 1 |
| Syndecan-4/TFPI | -0.32 | 0.26 | -10000 | 0 | -0.57 | 218 | 218 |
Figure S8. Get High-res Image This plot shows pathway concept perturbations across all samples against a permutation model. The concepts along the x-axis are sorted by lowest to highest mean activity for the real patient samples. Mean inferred activities are plotted along the y-axis as a colored band showing the average level and one standard deviation range. Real samples are shown in red and permuted samples in black.
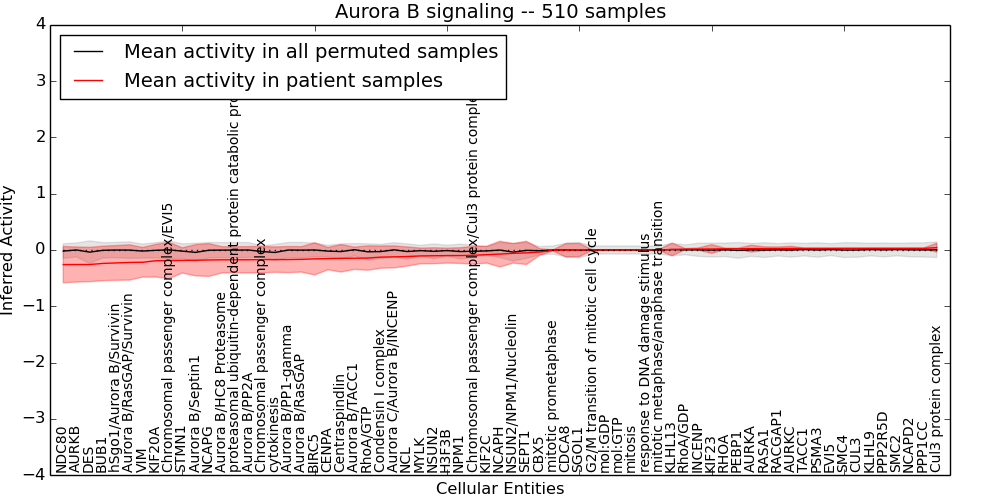
Table S8. Get Full Table This table displays mean, standard deviation, and perturbation statistics for Inferred Pathway Levels (IPLs). A mean perturbation of -9999 implies that the IPLs across all the real samples did not differ enough from the IPLs generated by a background model of permuted samples (> 1 Std.Dev from the permuted sample IPLs).
| Entity | Mean | Std.Dev | Mean.of.Up.Perturbations | Number.of.Up.Perturbations | Mean.of.Down.Perturbations | Number.of.Down.Perturbations | Number.of.Total.Perturbations |
|---|---|---|---|---|---|---|---|
| Condensin I complex | -0.13 | 0.2 | -10000 | 0 | -0.4 | 147 | 147 |
| STMN1 | -0.18 | 0.22 | -10000 | 0 | -0.42 | 239 | 239 |
| Aurora B/RasGAP/Survivin | -0.22 | 0.31 | -10000 | 0 | -0.55 | 228 | 228 |
| Chromosomal passenger complex/Cul3 protein complex | -0.094 | 0.16 | -10000 | 0 | -0.31 | 144 | 144 |
| BIRC5 | -0.16 | 0.29 | -10000 | 0 | -0.6 | 149 | 149 |
| DES | -0.26 | 0.31 | -10000 | 0 | -0.66 | 158 | 158 |
| Aurora C/Aurora B/INCENP | -0.12 | 0.2 | -10000 | 0 | -0.33 | 235 | 235 |
| Aurora B/TACC1 | -0.15 | 0.2 | -10000 | 0 | -0.36 | 238 | 238 |
| Aurora B/PP2A | -0.17 | 0.24 | -10000 | 0 | -0.42 | 238 | 238 |
| mol:GTP | 0 | 0 | -10000 | 0 | -10000 | 0 | 0 |
| CBX5 | -0.036 | 0.06 | -10000 | 0 | -0.22 | 3 | 3 |
| mitotic metaphase/anaphase transition | 0 | 0.006 | -10000 | 0 | -10000 | 0 | 0 |
| NDC80 | -0.26 | 0.32 | -10000 | 0 | -0.57 | 242 | 242 |
| Cul3 protein complex | 0.042 | 0.08 | -10000 | 0 | -0.4 | 15 | 15 |
| KIF2C | -0.083 | 0.15 | -10000 | 0 | -0.28 | 121 | 121 |
| PEBP1 | 0.023 | 0.011 | -10000 | 0 | -10000 | 0 | 0 |
| KIF20A | -0.19 | 0.29 | -10000 | 0 | -0.59 | 177 | 177 |
| mol:GDP | 0 | 0 | -10000 | 0 | -10000 | 0 | 0 |
| Aurora B/RasGAP | -0.17 | 0.23 | -10000 | 0 | -0.42 | 216 | 216 |
| SEPT1 | -0.051 | 0.21 | -10000 | 0 | -0.59 | 66 | 66 |
| SMC2 | 0.029 | 0.006 | -10000 | 0 | -10000 | 0 | 0 |
| SMC4 | 0.029 | 0.007 | -10000 | 0 | -10000 | 0 | 0 |
| NSUN2/NPM1/Nucleolin | -0.059 | 0.17 | 0.28 | 2 | -0.7 | 12 | 14 |
| PSMA3 | 0.028 | 0.008 | -10000 | 0 | -10000 | 0 | 0 |
| G2/M transition of mitotic cell cycle | -0.001 | 0.004 | -10000 | 0 | -10000 | 0 | 0 |
| H3F3B | -0.1 | 0.13 | -10000 | 0 | -0.24 | 235 | 235 |
| AURKB | -0.26 | 0.31 | -10000 | 0 | -0.59 | 239 | 239 |
| AURKC | 0.027 | 0.039 | -10000 | 0 | -0.59 | 2 | 2 |
| CDCA8 | -0.006 | 0.12 | -10000 | 0 | -0.61 | 19 | 19 |
| cytokinesis | -0.17 | 0.22 | -10000 | 0 | -0.48 | 140 | 140 |
| Aurora B/Septin1 | -0.18 | 0.28 | -10000 | 0 | -0.55 | 150 | 150 |
| AURKA | 0.024 | 0.062 | -10000 | 0 | -0.59 | 5 | 5 |
| INCENP | 0.017 | 0.02 | -10000 | 0 | -10000 | 0 | 0 |
| KLHL13 | 0.01 | 0.11 | -10000 | 0 | -0.62 | 16 | 16 |
| BUB1 | -0.24 | 0.31 | -10000 | 0 | -0.59 | 220 | 220 |
| hSgo1/Aurora B/Survivin | -0.23 | 0.31 | -10000 | 0 | -0.52 | 244 | 244 |
| EVI5 | 0.028 | 0.006 | -10000 | 0 | -10000 | 0 | 0 |
| RhoA/GTP | -0.14 | 0.22 | -10000 | 0 | -0.46 | 122 | 122 |
| SGOL1 | -0.001 | 0.12 | -10000 | 0 | -0.61 | 18 | 18 |
| CENPA | -0.15 | 0.2 | 0.19 | 1 | -0.39 | 187 | 188 |
| NCAPG | -0.18 | 0.29 | -10000 | 0 | -0.59 | 171 | 171 |
| Aurora B/HC8 Proteasome | -0.17 | 0.23 | -10000 | 0 | -0.42 | 238 | 238 |
| NCAPD2 | 0.029 | 0.006 | -10000 | 0 | -10000 | 0 | 0 |
| Aurora B/PP1-gamma | -0.17 | 0.23 | -10000 | 0 | -0.42 | 230 | 230 |
| RHOA | 0.021 | 0.014 | -10000 | 0 | -10000 | 0 | 0 |
| NCAPH | -0.073 | 0.23 | -10000 | 0 | -0.59 | 84 | 84 |
| NPM1 | -0.099 | 0.14 | -10000 | 0 | -0.62 | 6 | 6 |
| RASA1 | 0.025 | 0.031 | -10000 | 0 | -0.64 | 1 | 1 |
| KLHL9 | 0.029 | 0.006 | -10000 | 0 | -10000 | 0 | 0 |
| mitotic prometaphase | -0.006 | 0.008 | -10000 | 0 | -10000 | 0 | 0 |
| proteasomal ubiquitin-dependent protein catabolic process | -0.17 | 0.23 | -10000 | 0 | -0.42 | 238 | 238 |
| PPP1CC | 0.029 | 0.006 | -10000 | 0 | -10000 | 0 | 0 |
| Centraspindlin | -0.15 | 0.24 | -10000 | 0 | -0.46 | 157 | 157 |
| RhoA/GDP | 0.016 | 0.01 | -10000 | 0 | -10000 | 0 | 0 |
| NSUN2 | -0.1 | 0.14 | -10000 | 0 | -0.53 | 8 | 8 |
| MYLK | -0.1 | 0.14 | -10000 | 0 | -0.25 | 238 | 238 |
| KIF23 | 0.017 | 0.078 | -10000 | 0 | -0.6 | 8 | 8 |
| VIM | -0.22 | 0.26 | -10000 | 0 | -0.47 | 250 | 250 |
| RACGAP1 | 0.025 | 0.029 | -10000 | 0 | -0.6 | 1 | 1 |
| mitosis | 0 | 0 | -10000 | 0 | -10000 | 0 | 0 |
| NCL | -0.12 | 0.17 | -10000 | 0 | -0.64 | 18 | 18 |
| Chromosomal passenger complex | -0.17 | 0.24 | 0.18 | 1 | -0.45 | 184 | 185 |
| Chromosomal passenger complex/EVI5 | -0.19 | 0.32 | -10000 | 0 | -0.59 | 166 | 166 |
| TACC1 | 0.028 | 0.009 | -10000 | 0 | -10000 | 0 | 0 |
| PPP2R5D | 0.029 | 0.006 | -10000 | 0 | -10000 | 0 | 0 |
| CUL3 | 0.029 | 0.007 | -10000 | 0 | -10000 | 0 | 0 |
| response to DNA damage stimulus | 0 | 0 | -10000 | 0 | -10000 | 0 | 0 |
Figure S9. Get High-res Image This plot shows pathway concept perturbations across all samples against a permutation model. The concepts along the x-axis are sorted by lowest to highest mean activity for the real patient samples. Mean inferred activities are plotted along the y-axis as a colored band showing the average level and one standard deviation range. Real samples are shown in red and permuted samples in black.
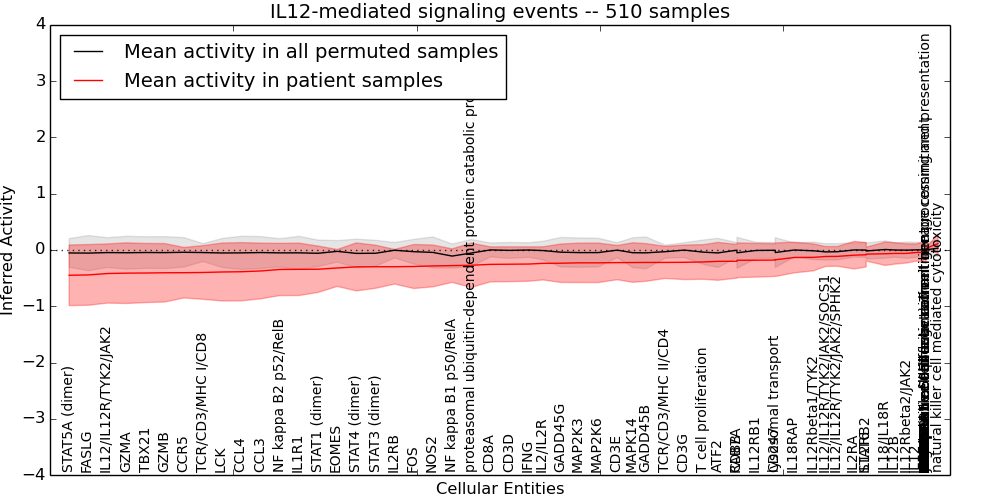
Table S9. Get Full Table This table displays mean, standard deviation, and perturbation statistics for Inferred Pathway Levels (IPLs). A mean perturbation of -9999 implies that the IPLs across all the real samples did not differ enough from the IPLs generated by a background model of permuted samples (> 1 Std.Dev from the permuted sample IPLs).
| Entity | Mean | Std.Dev | Mean.of.Up.Perturbations | Number.of.Up.Perturbations | Mean.of.Down.Perturbations | Number.of.Down.Perturbations | Number.of.Total.Perturbations |
|---|---|---|---|---|---|---|---|
| IL12/IL12R/TYK2/JAK2/SOCS1 | -0.12 | 0.18 | -10000 | 0 | -0.45 | 67 | 67 |
| TBX21 | -0.41 | 0.53 | 0.79 | 1 | -1 | 175 | 176 |
| B2M | 0.023 | 0.015 | -10000 | 0 | -10000 | 0 | 0 |
| TYK2 | 0.003 | 0.038 | -10000 | 0 | -10000 | 0 | 0 |
| IL12RB1 | -0.18 | 0.3 | -10000 | 0 | -0.63 | 158 | 158 |
| GADD45B | -0.22 | 0.34 | 0.61 | 1 | -0.72 | 75 | 76 |
| IL12RB2 | -0.084 | 0.22 | -10000 | 0 | -0.6 | 74 | 74 |
| GADD45G | -0.24 | 0.34 | 0.61 | 1 | -0.69 | 110 | 111 |
| natural killer cell activation | -0.011 | 0.026 | -10000 | 0 | -10000 | 0 | 0 |
| RELB | 0.03 | 0.004 | -10000 | 0 | -10000 | 0 | 0 |
| RELA | 0.03 | 0.003 | -10000 | 0 | -10000 | 0 | 0 |
| IL18 | 0.022 | 0.061 | -10000 | 0 | -0.58 | 5 | 5 |
| IL2RA | -0.092 | 0.24 | -10000 | 0 | -0.59 | 100 | 100 |
| IFNG | -0.25 | 0.31 | -10000 | 0 | -0.59 | 230 | 230 |
| STAT3 (dimer) | -0.3 | 0.38 | -10000 | 0 | -0.76 | 165 | 165 |
| HLA-DRB5 | -0.009 | 0.15 | -10000 | 0 | -0.59 | 31 | 31 |
| FASLG | -0.44 | 0.54 | 0.79 | 1 | -1.1 | 175 | 176 |
| NF kappa B2 p52/RelB | -0.35 | 0.46 | -10000 | 0 | -0.94 | 157 | 157 |
| CD4 | 0.018 | 0.082 | -10000 | 0 | -0.59 | 9 | 9 |
| SOCS1 | 0.022 | 0.067 | -10000 | 0 | -0.59 | 6 | 6 |
| EntrezGene:6955 | -0.003 | 0.009 | -10000 | 0 | -10000 | 0 | 0 |
| CD3D | -0.25 | 0.31 | -10000 | 0 | -0.6 | 228 | 228 |
| CD3E | -0.22 | 0.3 | -10000 | 0 | -0.6 | 204 | 204 |
| CD3G | -0.22 | 0.31 | -10000 | 0 | -0.6 | 200 | 200 |
| IL12Rbeta2/JAK2 | -0.061 | 0.17 | -10000 | 0 | -0.45 | 74 | 74 |
| CCL3 | -0.37 | 0.5 | 0.79 | 1 | -0.99 | 162 | 163 |
| CCL4 | -0.39 | 0.52 | 0.79 | 1 | -1 | 157 | 158 |
| HLA-A | 0.02 | 0.041 | -10000 | 0 | -0.59 | 2 | 2 |
| IL18/IL18R | -0.066 | 0.21 | -10000 | 0 | -0.39 | 139 | 139 |
| NOS2 | -0.28 | 0.37 | -10000 | 0 | -0.78 | 134 | 134 |
| IL12/IL12R/TYK2/JAK2/SPHK2 | -0.11 | 0.18 | -10000 | 0 | -0.43 | 71 | 71 |
| IL1R1 | -0.34 | 0.47 | 0.79 | 1 | -0.95 | 151 | 152 |
| IL4 | 0.018 | 0.038 | -10000 | 0 | -10000 | 0 | 0 |
| JAK2 | 0.003 | 0.037 | -10000 | 0 | -10000 | 0 | 0 |
| EntrezGene:6957 | -0.004 | 0.009 | -10000 | 0 | -10000 | 0 | 0 |
| TCR/CD3/MHC I/CD8 | -0.4 | 0.48 | -10000 | 0 | -0.9 | 226 | 226 |
| RAB7A | -0.18 | 0.31 | 0.55 | 5 | -0.67 | 41 | 46 |
| lysosomal transport | -0.17 | 0.3 | 0.55 | 5 | -0.63 | 41 | 46 |
| FOS | -0.29 | 0.39 | -10000 | 0 | -0.73 | 185 | 185 |
| STAT4 (dimer) | -0.3 | 0.43 | 0.58 | 5 | -0.82 | 162 | 167 |
| STAT5A (dimer) | -0.45 | 0.54 | -10000 | 0 | -1 | 209 | 209 |
| GZMA | -0.41 | 0.54 | -10000 | 0 | -1 | 187 | 187 |
| GZMB | -0.4 | 0.52 | -10000 | 0 | -1 | 172 | 172 |
| HLX | -0.042 | 0.2 | -10000 | 0 | -0.59 | 58 | 58 |
| LCK | -0.39 | 0.52 | 0.56 | 1 | -1 | 162 | 163 |
| TCR/CD3/MHC II/CD4 | -0.22 | 0.28 | -10000 | 0 | -0.53 | 214 | 214 |
| IL2/IL2R | -0.24 | 0.3 | -10000 | 0 | -0.72 | 88 | 88 |
| MAPK14 | -0.22 | 0.35 | 0.62 | 1 | -0.72 | 93 | 94 |
| CCR5 | -0.4 | 0.45 | 0.61 | 1 | -0.89 | 195 | 196 |
| IL1B | -0.005 | 0.075 | -10000 | 0 | -0.61 | 6 | 6 |
| STAT6 | -0.074 | 0.12 | -10000 | 0 | -10000 | 0 | 0 |
| STAT4 | -0.006 | 0.14 | -10000 | 0 | -0.59 | 29 | 29 |
| STAT3 | 0.03 | 0.005 | -10000 | 0 | -10000 | 0 | 0 |
| STAT1 | 0.028 | 0.028 | -10000 | 0 | -0.59 | 1 | 1 |
| NFKB1 | 0.028 | 0.03 | -10000 | 0 | -0.64 | 1 | 1 |
| NFKB2 | 0.029 | 0.006 | -10000 | 0 | -10000 | 0 | 0 |
| IL12B | -0.061 | 0.19 | -10000 | 0 | -0.62 | 52 | 52 |
| CD8A | -0.26 | 0.31 | -10000 | 0 | -0.6 | 230 | 230 |
| CD8B | -0.2 | 0.3 | -10000 | 0 | -0.6 | 184 | 184 |
| T-helper 1 cell differentiation | 0 | 0 | -10000 | 0 | -10000 | 0 | 0 |
| natural killer cell mediated cytotoxicity | 0.12 | 0.18 | 0.44 | 67 | -10000 | 0 | 67 |
| IL2RB | -0.3 | 0.31 | -10000 | 0 | -0.59 | 270 | 270 |
| proteasomal ubiquitin-dependent protein catabolic process | -0.27 | 0.39 | 0.57 | 5 | -0.75 | 156 | 161 |
| IL2RG | -0.011 | 0.15 | -10000 | 0 | -0.59 | 34 | 34 |
| IL12 | -0.044 | 0.15 | -10000 | 0 | -0.48 | 52 | 52 |
| STAT5A | 0.03 | 0.005 | -10000 | 0 | -10000 | 0 | 0 |
| CD247 | -0.18 | 0.29 | -10000 | 0 | -0.6 | 166 | 166 |
| IL2 | 0.013 | 0.085 | -10000 | 0 | -0.59 | 10 | 10 |
| SPHK2 | 0.027 | 0.042 | -10000 | 0 | -0.64 | 2 | 2 |
| FRAP1 | 0 | 0 | -10000 | 0 | -10000 | 0 | 0 |
| IL12A | 0.002 | 0.037 | -10000 | 0 | -10000 | 0 | 0 |
| IL12/IL12R/TYK2/JAK2 | -0.42 | 0.53 | -10000 | 0 | -1 | 174 | 174 |
| MAP2K3 | -0.23 | 0.35 | 0.61 | 1 | -0.71 | 109 | 110 |
| RIPK2 | 0.027 | 0.028 | -10000 | 0 | -0.59 | 1 | 1 |
| MAP2K6 | -0.23 | 0.35 | 0.61 | 1 | -0.69 | 121 | 122 |
| regulation of dendritic cell antigen processing and presentation | 0 | 0 | -10000 | 0 | -10000 | 0 | 0 |
| HLA-DRA | 0.024 | 0.055 | -10000 | 0 | -0.59 | 4 | 4 |
| IL18RAP | -0.13 | 0.27 | -10000 | 0 | -0.6 | 132 | 132 |
| IL12Rbeta1/TYK2 | -0.13 | 0.24 | -10000 | 0 | -0.48 | 158 | 158 |
| EOMES | -0.32 | 0.33 | -10000 | 0 | -0.56 | 264 | 264 |
| STAT1 (dimer) | -0.34 | 0.41 | -10000 | 0 | -0.79 | 198 | 198 |
| T cell proliferation | -0.21 | 0.31 | 0.48 | 4 | -0.6 | 132 | 136 |
| T-helper 1 cell lineage commitment | 0 | 0 | -10000 | 0 | -10000 | 0 | 0 |
| IL18R1 | 0.018 | 0.075 | -10000 | 0 | -0.61 | 7 | 7 |
| CD8-positive alpha-beta T cell lineage commitment | 0 | 0 | -10000 | 0 | -10000 | 0 | 0 |
| NF kappa B1 p50/RelA | -0.28 | 0.3 | -10000 | 0 | -0.66 | 141 | 141 |
| ATF2 | -0.2 | 0.34 | 0.56 | 6 | -0.68 | 90 | 96 |
Figure S10. Get High-res Image This plot shows pathway concept perturbations across all samples against a permutation model. The concepts along the x-axis are sorted by lowest to highest mean activity for the real patient samples. Mean inferred activities are plotted along the y-axis as a colored band showing the average level and one standard deviation range. Real samples are shown in red and permuted samples in black.
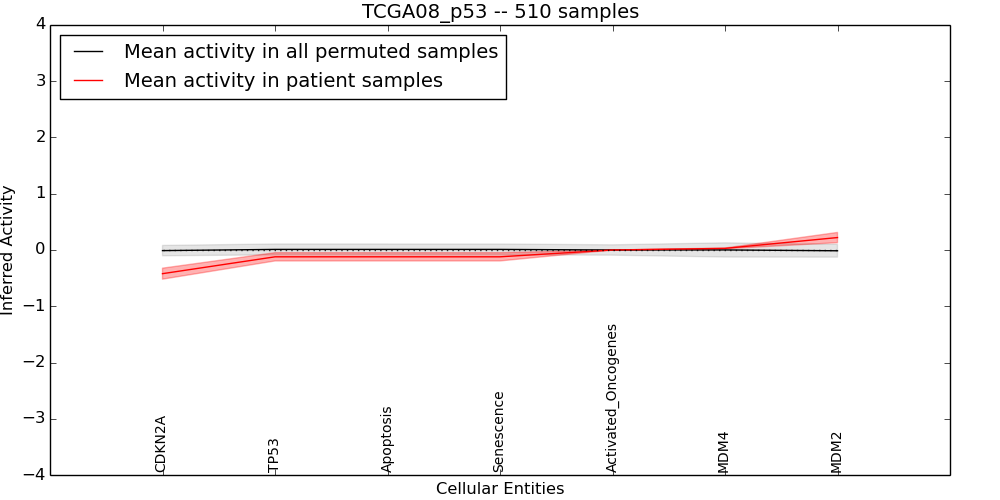
Table S10. Get Full Table This table displays mean, standard deviation, and perturbation statistics for Inferred Pathway Levels (IPLs). A mean perturbation of -9999 implies that the IPLs across all the real samples did not differ enough from the IPLs generated by a background model of permuted samples (> 1 Std.Dev from the permuted sample IPLs).
| Entity | Mean | Std.Dev | Mean.of.Up.Perturbations | Number.of.Up.Perturbations | Mean.of.Down.Perturbations | Number.of.Down.Perturbations | Number.of.Total.Perturbations |
|---|---|---|---|---|---|---|---|
| CDKN2A | -0.42 | 0.098 | 0.17 | 3 | -0.44 | 489 | 492 |
| TP53 | -0.12 | 0.074 | -10000 | 0 | -0.37 | 32 | 32 |
| Senescence | -0.12 | 0.073 | -10000 | 0 | -0.36 | 32 | 32 |
| Apoptosis | -0.12 | 0.073 | -10000 | 0 | -0.36 | 32 | 32 |
| Activated_Oncogenes | 0 | 0 | -10000 | 0 | -10000 | 0 | 0 |
| MDM2 | 0.22 | 0.091 | 0.42 | 41 | -10000 | 0 | 41 |
| MDM4 | 0.029 | 0.006 | -10000 | 0 | -10000 | 0 | 0 |
Figure S11. Get High-res Image This plot shows pathway concept perturbations across all samples against a permutation model. The concepts along the x-axis are sorted by lowest to highest mean activity for the real patient samples. Mean inferred activities are plotted along the y-axis as a colored band showing the average level and one standard deviation range. Real samples are shown in red and permuted samples in black.
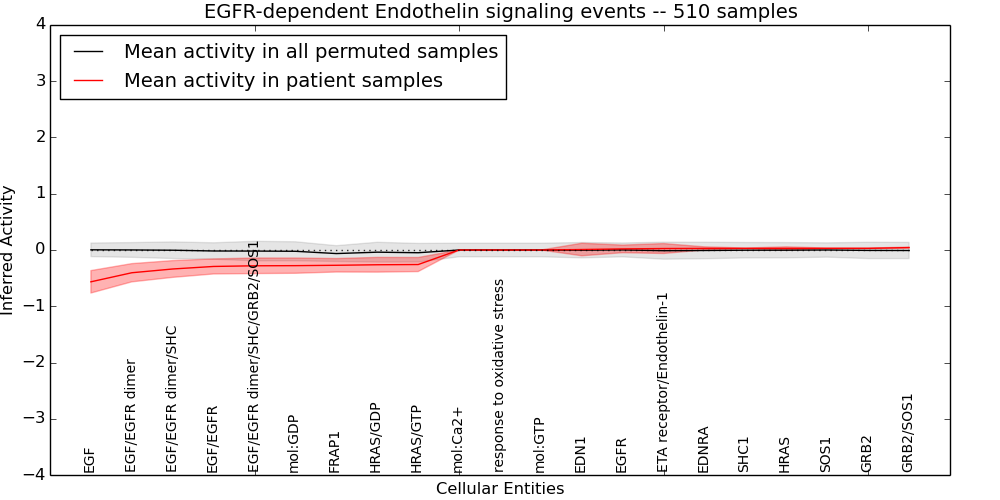
Table S11. Get Full Table This table displays mean, standard deviation, and perturbation statistics for Inferred Pathway Levels (IPLs). A mean perturbation of -9999 implies that the IPLs across all the real samples did not differ enough from the IPLs generated by a background model of permuted samples (> 1 Std.Dev from the permuted sample IPLs).
| Entity | Mean | Std.Dev | Mean.of.Up.Perturbations | Number.of.Up.Perturbations | Mean.of.Down.Perturbations | Number.of.Down.Perturbations | Number.of.Total.Perturbations |
|---|---|---|---|---|---|---|---|
| HRAS | 0.029 | 0.027 | -9999 | 0 | -0.59 | 1 | 1 |
| EGFR | 0.02 | 0.068 | -9999 | 0 | -0.6 | 6 | 6 |
| EGF/EGFR | -0.29 | 0.13 | -9999 | 0 | -0.35 | 410 | 410 |
| EGF/EGFR dimer/SHC/GRB2/SOS1 | -0.28 | 0.14 | -9999 | 0 | -0.65 | 5 | 5 |
| mol:GTP | 0 | 0 | -9999 | 0 | -10000 | 0 | 0 |
| EDNRA | 0.029 | 0.028 | -9999 | 0 | -0.59 | 1 | 1 |
| response to oxidative stress | 0 | 0 | -9999 | 0 | -10000 | 0 | 0 |
| EGF | -0.57 | 0.2 | -9999 | 0 | -0.63 | 460 | 460 |
| EGF/EGFR dimer/SHC | -0.34 | 0.15 | -9999 | 0 | -0.41 | 398 | 398 |
| mol:GDP | -0.28 | 0.14 | -9999 | 0 | -0.64 | 5 | 5 |
| mol:Ca2+ | 0 | 0 | -9999 | 0 | -10000 | 0 | 0 |
| EDN1 | 0.008 | 0.11 | -9999 | 0 | -0.59 | 17 | 17 |
| GRB2/SOS1 | 0.043 | 0.01 | -9999 | 0 | -10000 | 0 | 0 |
| HRAS/GTP | -0.26 | 0.12 | -9999 | 0 | -0.6 | 6 | 6 |
| SHC1 | 0.029 | 0.007 | -9999 | 0 | -10000 | 0 | 0 |
| HRAS/GDP | -0.26 | 0.13 | -9999 | 0 | -0.61 | 6 | 6 |
| FRAP1 | -0.27 | 0.12 | -9999 | 0 | -0.62 | 5 | 5 |
| EGF/EGFR dimer | -0.4 | 0.16 | -9999 | 0 | -0.48 | 412 | 412 |
| SOS1 | 0.029 | 0.005 | -9999 | 0 | -10000 | 0 | 0 |
| GRB2 | 0.029 | 0.005 | -9999 | 0 | -10000 | 0 | 0 |
| ETA receptor/Endothelin-1 | 0.026 | 0.088 | -9999 | 0 | -0.43 | 18 | 18 |
Figure S12. Get High-res Image This plot shows pathway concept perturbations across all samples against a permutation model. The concepts along the x-axis are sorted by lowest to highest mean activity for the real patient samples. Mean inferred activities are plotted along the y-axis as a colored band showing the average level and one standard deviation range. Real samples are shown in red and permuted samples in black.
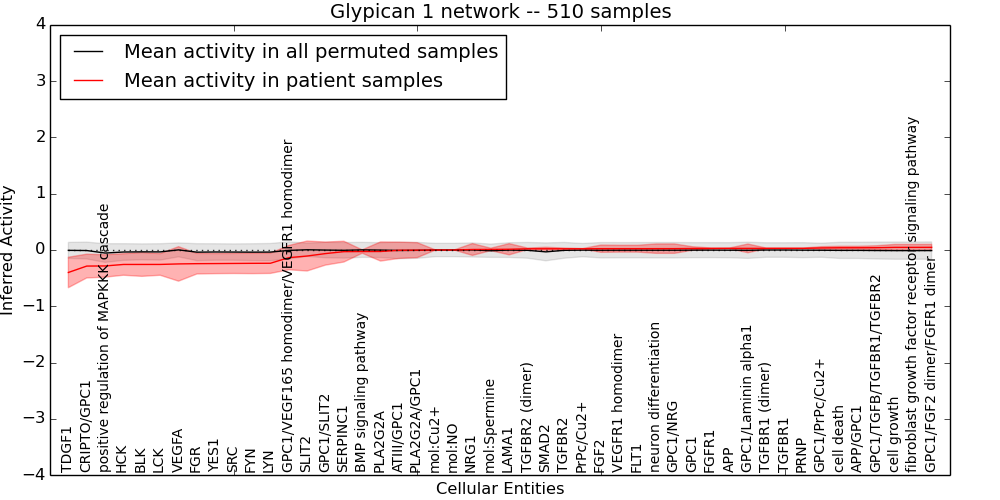
Table S12. Get Full Table This table displays mean, standard deviation, and perturbation statistics for Inferred Pathway Levels (IPLs). A mean perturbation of -9999 implies that the IPLs across all the real samples did not differ enough from the IPLs generated by a background model of permuted samples (> 1 Std.Dev from the permuted sample IPLs).
| Entity | Mean | Std.Dev | Mean.of.Up.Perturbations | Number.of.Up.Perturbations | Mean.of.Down.Perturbations | Number.of.Down.Perturbations | Number.of.Total.Perturbations |
|---|---|---|---|---|---|---|---|
| GPC1/FGF2 dimer/FGFR1 dimer | 0.047 | 0.053 | -10000 | 0 | -0.4 | 6 | 6 |
| fibroblast growth factor receptor signaling pathway | 0.046 | 0.053 | -10000 | 0 | -0.4 | 6 | 6 |
| LAMA1 | 0.013 | 0.099 | -10000 | 0 | -0.56 | 14 | 14 |
| PRNP | 0.029 | 0.006 | -10000 | 0 | -10000 | 0 | 0 |
| GPC1/SLIT2 | -0.064 | 0.2 | -10000 | 0 | -0.47 | 101 | 101 |
| SMAD2 | 0.022 | 0.027 | -10000 | 0 | -0.37 | 1 | 1 |
| GPC1/PrPc/Cu2+ | 0.037 | 0.023 | -10000 | 0 | -0.41 | 1 | 1 |
| GPC1/Laminin alpha1 | 0.029 | 0.078 | -10000 | 0 | -0.46 | 11 | 11 |
| TDGF1 | -0.4 | 0.27 | -10000 | 0 | -0.54 | 383 | 383 |
| CRIPTO/GPC1 | -0.29 | 0.21 | -10000 | 0 | -0.47 | 262 | 262 |
| APP/GPC1 | 0.04 | 0.026 | -10000 | 0 | -0.47 | 1 | 1 |
| mol:NO | 0 | 0 | -10000 | 0 | -10000 | 0 | 0 |
| YES1 | -0.24 | 0.18 | -10000 | 0 | -0.4 | 259 | 259 |
| FLT1 | 0.023 | 0.061 | -10000 | 0 | -0.59 | 5 | 5 |
| GPC1/TGFB/TGFBR1/TGFBR2 | 0.041 | 0.035 | -10000 | 0 | -0.4 | 1 | 1 |
| SERPINC1 | -0.029 | 0.18 | -10000 | 0 | -0.63 | 44 | 44 |
| FYN | -0.24 | 0.18 | -10000 | 0 | -0.4 | 261 | 261 |
| FGR | -0.24 | 0.18 | -10000 | 0 | -0.41 | 262 | 262 |
| positive regulation of MAPKKK cascade | -0.28 | 0.2 | 0.38 | 3 | -0.44 | 257 | 260 |
| SLIT2 | -0.11 | 0.27 | -10000 | 0 | -0.62 | 108 | 108 |
| GPC1/NRG | 0.024 | 0.084 | -10000 | 0 | -0.46 | 13 | 13 |
| NRG1 | 0.009 | 0.1 | -10000 | 0 | -0.56 | 16 | 16 |
| GPC1/VEGF165 homodimer/VEGFR1 homodimer | -0.14 | 0.22 | -10000 | 0 | -0.37 | 224 | 224 |
| LYN | -0.24 | 0.18 | -10000 | 0 | -0.4 | 253 | 253 |
| mol:Spermine | 0.01 | 0.022 | -10000 | 0 | -0.47 | 1 | 1 |
| cell growth | 0.046 | 0.053 | -10000 | 0 | -0.4 | 6 | 6 |
| BMP signaling pathway | -0.027 | 0.03 | 0.63 | 1 | -10000 | 0 | 1 |
| SRC | -0.24 | 0.18 | -10000 | 0 | -0.4 | 254 | 254 |
| TGFBR1 | 0.029 | 0.006 | -10000 | 0 | -10000 | 0 | 0 |
| mol:Cu2+ | 0 | 0 | -10000 | 0 | -10000 | 0 | 0 |
| PLA2G2A | -0.027 | 0.17 | -10000 | 0 | -0.59 | 43 | 43 |
| GPC1 | 0.027 | 0.03 | -10000 | 0 | -0.64 | 1 | 1 |
| TGFBR1 (dimer) | 0.029 | 0.006 | -10000 | 0 | -10000 | 0 | 0 |
| VEGFA | -0.25 | 0.31 | -10000 | 0 | -0.59 | 228 | 228 |
| BLK | -0.26 | 0.21 | -10000 | 0 | -0.44 | 266 | 266 |
| HCK | -0.26 | 0.19 | -10000 | 0 | -0.42 | 266 | 266 |
| FGF2 | 0.023 | 0.065 | -10000 | 0 | -0.62 | 5 | 5 |
| FGFR1 | 0.028 | 0.009 | -10000 | 0 | -10000 | 0 | 0 |
| VEGFR1 homodimer | 0.023 | 0.061 | -10000 | 0 | -0.59 | 5 | 5 |
| TGFBR2 | 0.022 | 0.014 | -10000 | 0 | -10000 | 0 | 0 |
| cell death | 0.04 | 0.026 | -10000 | 0 | -0.47 | 1 | 1 |
| ATIII/GPC1 | -0.005 | 0.14 | -10000 | 0 | -0.47 | 45 | 45 |
| PLA2G2A/GPC1 | -0.002 | 0.13 | -10000 | 0 | -0.43 | 44 | 44 |
| LCK | -0.26 | 0.19 | -10000 | 0 | -0.42 | 270 | 270 |
| neuron differentiation | 0.024 | 0.083 | -10000 | 0 | -0.46 | 13 | 13 |
| PrPc/Cu2+ | 0.022 | 0.004 | -10000 | 0 | -10000 | 0 | 0 |
| APP | 0.029 | 0.006 | -10000 | 0 | -10000 | 0 | 0 |
| TGFBR2 (dimer) | 0.022 | 0.014 | -10000 | 0 | -10000 | 0 | 0 |
Figure S13. Get High-res Image This plot shows pathway concept perturbations across all samples against a permutation model. The concepts along the x-axis are sorted by lowest to highest mean activity for the real patient samples. Mean inferred activities are plotted along the y-axis as a colored band showing the average level and one standard deviation range. Real samples are shown in red and permuted samples in black.
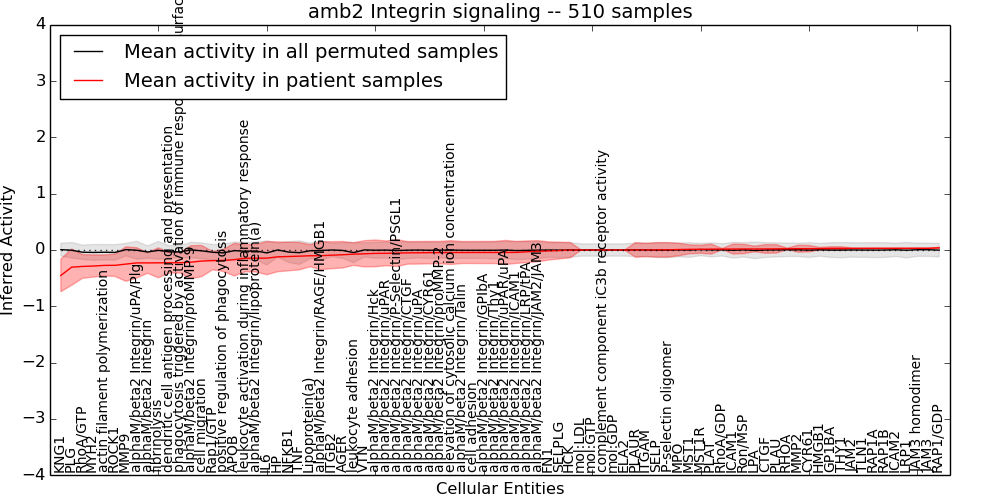
Table S13. Get Full Table This table displays mean, standard deviation, and perturbation statistics for Inferred Pathway Levels (IPLs). A mean perturbation of -9999 implies that the IPLs across all the real samples did not differ enough from the IPLs generated by a background model of permuted samples (> 1 Std.Dev from the permuted sample IPLs).
| Entity | Mean | Std.Dev | Mean.of.Up.Perturbations | Number.of.Up.Perturbations | Mean.of.Down.Perturbations | Number.of.Down.Perturbations | Number.of.Total.Perturbations |
|---|---|---|---|---|---|---|---|
| alphaM/beta2 Integrin/proMMP-2 | -0.046 | 0.2 | -10000 | 0 | -0.43 | 99 | 99 |
| alphaM/beta2 Integrin/GPIbA | -0.044 | 0.2 | -10000 | 0 | -0.43 | 97 | 97 |
| alphaM/beta2 Integrin/proMMP-9 | -0.22 | 0.29 | -10000 | 0 | -0.48 | 251 | 251 |
| PLAUR | 0.001 | 0.13 | -10000 | 0 | -0.59 | 24 | 24 |
| HMGB1 | 0.025 | 0.022 | -10000 | 0 | -10000 | 0 | 0 |
| alphaM/beta2 Integrin/Talin | -0.045 | 0.2 | -10000 | 0 | -0.43 | 96 | 96 |
| AGER | -0.085 | 0.24 | -10000 | 0 | -0.59 | 90 | 90 |
| RAP1A | 0.029 | 0.005 | -10000 | 0 | -10000 | 0 | 0 |
| SELPLG | -0.01 | 0.15 | -10000 | 0 | -0.59 | 32 | 32 |
| mol:LDL | 0 | 0 | -10000 | 0 | -10000 | 0 | 0 |
| alphaM/beta2 Integrin/RAGE/HMGB1 | -0.1 | 0.25 | -10000 | 0 | -0.61 | 58 | 58 |
| mol:GTP | 0 | 0 | -10000 | 0 | -10000 | 0 | 0 |
| MMP9 | -0.25 | 0.31 | -10000 | 0 | -0.59 | 231 | 231 |
| CYR61 | 0.023 | 0.058 | -10000 | 0 | -0.48 | 6 | 6 |
| TLN1 | 0.029 | 0.006 | -10000 | 0 | -10000 | 0 | 0 |
| Rap1/GTP | -0.19 | 0.16 | -10000 | 0 | -0.44 | 103 | 103 |
| RHOA | 0.021 | 0.014 | -10000 | 0 | -10000 | 0 | 0 |
| P-selectin oligomer | 0.003 | 0.13 | -10000 | 0 | -0.63 | 20 | 20 |
| MYH2 | -0.28 | 0.2 | -10000 | 0 | -0.5 | 177 | 177 |
| MST1R | 0.013 | 0.072 | -10000 | 0 | -0.58 | 7 | 7 |
| leukocyte activation during inflammatory response | -0.15 | 0.24 | -10000 | 0 | -0.55 | 80 | 80 |
| APOB | -0.17 | 0.29 | -10000 | 0 | -0.59 | 166 | 166 |
| mol:GDP | 0 | 0 | -10000 | 0 | -10000 | 0 | 0 |
| complement component iC3b receptor activity | 0 | 0 | -10000 | 0 | -10000 | 0 | 0 |
| MMP2 | 0.023 | 0.062 | -10000 | 0 | -0.6 | 5 | 5 |
| JAM3 | 0.03 | 0.003 | -10000 | 0 | -10000 | 0 | 0 |
| GP1BA | 0.028 | 0.03 | -10000 | 0 | -0.64 | 1 | 1 |
| alphaM/beta2 Integrin/CTGF | -0.051 | 0.2 | -10000 | 0 | -0.43 | 101 | 101 |
| alphaM/beta2 Integrin | -0.23 | 0.18 | -10000 | 0 | -0.4 | 211 | 211 |
| JAM3 homodimer | 0.03 | 0.003 | -10000 | 0 | -10000 | 0 | 0 |
| ICAM2 | 0.029 | 0.005 | -10000 | 0 | -10000 | 0 | 0 |
| ICAM1 | 0.017 | 0.09 | -10000 | 0 | -0.59 | 11 | 11 |
| phagocytosis triggered by activation of immune response cell surface activating receptor | -0.23 | 0.18 | -10000 | 0 | -0.4 | 211 | 211 |
| cell adhesion | -0.044 | 0.2 | -10000 | 0 | -0.42 | 97 | 97 |
| NFKB1 | -0.12 | 0.25 | 0.4 | 4 | -0.63 | 62 | 66 |
| THY1 | 0.029 | 0.03 | -10000 | 0 | -0.64 | 1 | 1 |
| RhoA/GDP | 0.016 | 0.01 | -10000 | 0 | -10000 | 0 | 0 |
| Lipoprotein(a) | -0.1 | 0.2 | -10000 | 0 | -0.38 | 166 | 166 |
| alphaM/beta2 Integrin/LRP/tPA | -0.031 | 0.19 | -10000 | 0 | -0.4 | 97 | 97 |
| IL6 | -0.14 | 0.3 | 0.39 | 2 | -0.72 | 76 | 78 |
| ITGB2 | -0.092 | 0.24 | -10000 | 0 | -0.59 | 96 | 96 |
| elevation of cytosolic calcium ion concentration | -0.045 | 0.21 | -10000 | 0 | -0.41 | 115 | 115 |
| alphaM/beta2 Integrin/JAM2/JAM3 | -0.022 | 0.19 | -10000 | 0 | -0.39 | 96 | 96 |
| JAM2 | 0.029 | 0.006 | -10000 | 0 | -10000 | 0 | 0 |
| alphaM/beta2 Integrin/ICAM1 | -0.043 | 0.2 | -10000 | 0 | -0.52 | 40 | 40 |
| alphaM/beta2 Integrin/uPA/Plg | -0.23 | 0.27 | -10000 | 0 | -0.45 | 272 | 272 |
| RhoA/GTP | -0.29 | 0.21 | -10000 | 0 | -0.51 | 189 | 189 |
| positive regulation of phagocytosis | -0.18 | 0.2 | -10000 | 0 | -0.54 | 81 | 81 |
| Ron/MSP | 0.018 | 0.082 | -10000 | 0 | -0.45 | 14 | 14 |
| alphaM/beta2 Integrin/uPAR/uPA | -0.044 | 0.22 | -10000 | 0 | -0.41 | 115 | 115 |
| alphaM/beta2 Integrin/uPAR | -0.059 | 0.22 | -10000 | 0 | -0.45 | 109 | 109 |
| PLAU | 0.02 | 0.075 | -10000 | 0 | -0.56 | 8 | 8 |
| PLAT | 0.015 | 0.089 | -10000 | 0 | -0.6 | 10 | 10 |
| actin filament polymerization | -0.27 | 0.19 | -10000 | 0 | -0.48 | 177 | 177 |
| MST1 | 0.012 | 0.08 | -10000 | 0 | -0.61 | 8 | 8 |
| alphaM/beta2 Integrin/lipoprotein(a) | -0.14 | 0.25 | -10000 | 0 | -0.56 | 79 | 79 |
| TNF | -0.11 | 0.24 | 0.39 | 3 | -0.6 | 63 | 66 |
| RAP1B | 0.029 | 0.005 | -10000 | 0 | -10000 | 0 | 0 |
| alphaM/beta2 Integrin/uPA | -0.05 | 0.2 | -10000 | 0 | -0.43 | 102 | 102 |
| fibrinolysis | -0.23 | 0.27 | -10000 | 0 | -0.45 | 272 | 272 |
| HCK | -0.002 | 0.14 | -10000 | 0 | -0.59 | 26 | 26 |
| dendritic cell antigen processing and presentation | -0.23 | 0.18 | -10000 | 0 | -0.4 | 211 | 211 |
| VTN | -0.068 | 0.23 | -10000 | 0 | -0.62 | 76 | 76 |
| alphaM/beta2 Integrin/CYR61 | -0.047 | 0.2 | -10000 | 0 | -0.43 | 99 | 99 |
| LPA | 0.018 | 0.051 | -10000 | 0 | -0.63 | 3 | 3 |
| LRP1 | 0.029 | 0.005 | -10000 | 0 | -10000 | 0 | 0 |
| cell migration | -0.2 | 0.28 | -10000 | 0 | -0.44 | 251 | 251 |
| FN1 | -0.017 | 0.16 | -10000 | 0 | -0.59 | 37 | 37 |
| alphaM/beta2 Integrin/Thy1 | -0.044 | 0.2 | -10000 | 0 | -0.43 | 97 | 97 |
| MPO | 0.008 | 0.11 | -10000 | 0 | -0.59 | 17 | 17 |
| KNG1 | -0.45 | 0.29 | -10000 | 0 | -0.63 | 370 | 370 |
| RAP1/GDP | 0.038 | 0.01 | -10000 | 0 | -10000 | 0 | 0 |
| ROCK1 | -0.27 | 0.2 | -10000 | 0 | -0.49 | 173 | 173 |
| ELA2 | 0 | 0 | -10000 | 0 | -10000 | 0 | 0 |
| PLG | -0.3 | 0.32 | -10000 | 0 | -0.61 | 265 | 265 |
| CTGF | 0.019 | 0.078 | -10000 | 0 | -0.64 | 7 | 7 |
| alphaM/beta2 Integrin/Hck | -0.06 | 0.24 | -10000 | 0 | -0.5 | 99 | 99 |
| ITGAM | 0.001 | 0.12 | -10000 | 0 | -0.59 | 19 | 19 |
| alphaM/beta2 Integrin/P-Selectin/PSGL1 | -0.055 | 0.24 | -10000 | 0 | -0.58 | 61 | 61 |
| HP | -0.12 | 0.26 | -10000 | 0 | -0.59 | 124 | 124 |
| leukocyte adhesion | -0.073 | 0.2 | -10000 | 0 | -0.54 | 41 | 41 |
| SELP | 0.003 | 0.13 | -10000 | 0 | -0.64 | 20 | 20 |
Figure S14. Get High-res Image This plot shows pathway concept perturbations across all samples against a permutation model. The concepts along the x-axis are sorted by lowest to highest mean activity for the real patient samples. Mean inferred activities are plotted along the y-axis as a colored band showing the average level and one standard deviation range. Real samples are shown in red and permuted samples in black.
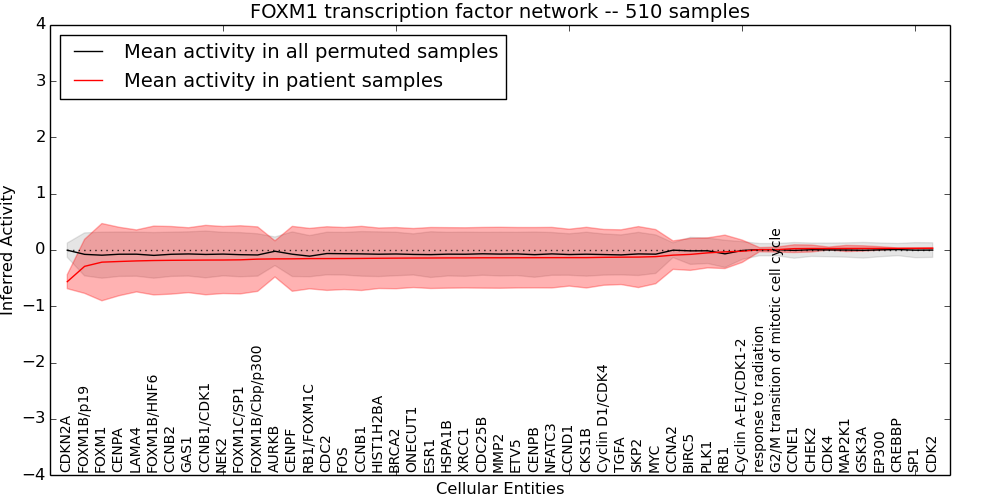
Table S14. Get Full Table This table displays mean, standard deviation, and perturbation statistics for Inferred Pathway Levels (IPLs). A mean perturbation of -9999 implies that the IPLs across all the real samples did not differ enough from the IPLs generated by a background model of permuted samples (> 1 Std.Dev from the permuted sample IPLs).
| Entity | Mean | Std.Dev | Mean.of.Up.Perturbations | Number.of.Up.Perturbations | Mean.of.Down.Perturbations | Number.of.Down.Perturbations | Number.of.Total.Perturbations |
|---|---|---|---|---|---|---|---|
| NFATC3 | -0.14 | 0.54 | 0.8 | 1 | -1.1 | 88 | 89 |
| PLK1 | -0.051 | 0.27 | -10000 | 0 | -0.5 | 116 | 116 |
| BIRC5 | -0.078 | 0.28 | -10000 | 0 | -0.84 | 7 | 7 |
| HSPA1B | -0.14 | 0.54 | 0.8 | 2 | -1.1 | 85 | 87 |
| MAP2K1 | 0.027 | 0.054 | -10000 | 0 | -10000 | 0 | 0 |
| BRCA2 | -0.14 | 0.54 | -10000 | 0 | -1.1 | 88 | 88 |
| FOXM1 | -0.22 | 0.69 | -10000 | 0 | -1.4 | 97 | 97 |
| XRCC1 | -0.14 | 0.54 | -10000 | 0 | -1.1 | 85 | 85 |
| FOXM1B/p19 | -0.29 | 0.48 | -10000 | 0 | -1.1 | 86 | 86 |
| Cyclin D1/CDK4 | -0.13 | 0.5 | -10000 | 0 | -1 | 81 | 81 |
| CDC2 | -0.15 | 0.57 | -10000 | 0 | -1.1 | 97 | 97 |
| TGFA | -0.13 | 0.49 | -10000 | 0 | -0.98 | 81 | 81 |
| SKP2 | -0.13 | 0.54 | 0.73 | 5 | -1.1 | 87 | 92 |
| CCNE1 | 0.024 | 0.069 | -10000 | 0 | -0.6 | 6 | 6 |
| CKS1B | -0.14 | 0.54 | 0.71 | 1 | -1.1 | 84 | 85 |
| RB1 | -0.033 | 0.3 | -10000 | 0 | -0.9 | 14 | 14 |
| FOXM1C/SP1 | -0.17 | 0.61 | -10000 | 0 | -1.3 | 90 | 90 |
| AURKB | -0.16 | 0.32 | -10000 | 0 | -1.1 | 10 | 10 |
| CENPF | -0.16 | 0.58 | -10000 | 0 | -1.2 | 84 | 84 |
| CDK4 | 0.027 | 0.025 | -10000 | 0 | -10000 | 0 | 0 |
| MYC | -0.12 | 0.48 | -10000 | 0 | -0.95 | 87 | 87 |
| CHEK2 | 0.026 | 0.062 | -10000 | 0 | -0.64 | 1 | 1 |
| ONECUT1 | -0.14 | 0.52 | -10000 | 0 | -1.1 | 88 | 88 |
| CDKN2A | -0.56 | 0.12 | -10000 | 0 | -0.59 | 489 | 489 |
| LAMA4 | -0.19 | 0.55 | 0.8 | 1 | -1.1 | 89 | 90 |
| FOXM1B/HNF6 | -0.19 | 0.61 | -10000 | 0 | -1.3 | 88 | 88 |
| FOS | -0.15 | 0.55 | -10000 | 0 | -1.1 | 95 | 95 |
| SP1 | 0.029 | 0.009 | -10000 | 0 | -10000 | 0 | 0 |
| CDC25B | -0.14 | 0.54 | -10000 | 0 | -1.1 | 87 | 87 |
| response to radiation | 0.006 | 0.037 | -10000 | 0 | -10000 | 0 | 0 |
| CENPB | -0.14 | 0.54 | -10000 | 0 | -1.1 | 79 | 79 |
| CENPA | -0.2 | 0.61 | -10000 | 0 | -1.2 | 109 | 109 |
| NEK2 | -0.18 | 0.6 | 0.71 | 1 | -1.2 | 98 | 99 |
| HIST1H2BA | -0.15 | 0.54 | 0.8 | 1 | -1.1 | 83 | 84 |
| CCNA2 | -0.091 | 0.25 | -10000 | 0 | -0.6 | 100 | 100 |
| EP300 | 0.028 | 0.03 | -10000 | 0 | -0.64 | 1 | 1 |
| CCNB1/CDK1 | -0.18 | 0.62 | -10000 | 0 | -1.3 | 90 | 90 |
| CCNB2 | -0.18 | 0.6 | 0.79 | 1 | -1.2 | 106 | 107 |
| CCNB1 | -0.15 | 0.57 | -10000 | 0 | -1.2 | 89 | 89 |
| ETV5 | -0.14 | 0.54 | -10000 | 0 | -1.1 | 87 | 87 |
| ESR1 | -0.14 | 0.54 | 0.8 | 1 | -1.1 | 80 | 81 |
| CCND1 | -0.14 | 0.51 | -10000 | 0 | -1 | 82 | 82 |
| GSK3A | 0.028 | 0.047 | -10000 | 0 | -10000 | 0 | 0 |
| Cyclin A-E1/CDK1-2 | -0.022 | 0.2 | -10000 | 0 | -0.41 | 96 | 96 |
| CDK2 | 0.031 | 0.011 | -10000 | 0 | -10000 | 0 | 0 |
| G2/M transition of mitotic cell cycle | 0.007 | 0.045 | -10000 | 0 | -10000 | 0 | 0 |
| FOXM1B/Cbp/p300 | -0.16 | 0.57 | -10000 | 0 | -1.2 | 91 | 91 |
| GAS1 | -0.18 | 0.58 | -10000 | 0 | -1.1 | 107 | 107 |
| MMP2 | -0.14 | 0.54 | 0.8 | 1 | -1.1 | 84 | 85 |
| RB1/FOXM1C | -0.15 | 0.54 | -10000 | 0 | -1.1 | 87 | 87 |
| CREBBP | 0.029 | 0.006 | -10000 | 0 | -10000 | 0 | 0 |
Figure S15. Get High-res Image This plot shows pathway concept perturbations across all samples against a permutation model. The concepts along the x-axis are sorted by lowest to highest mean activity for the real patient samples. Mean inferred activities are plotted along the y-axis as a colored band showing the average level and one standard deviation range. Real samples are shown in red and permuted samples in black.
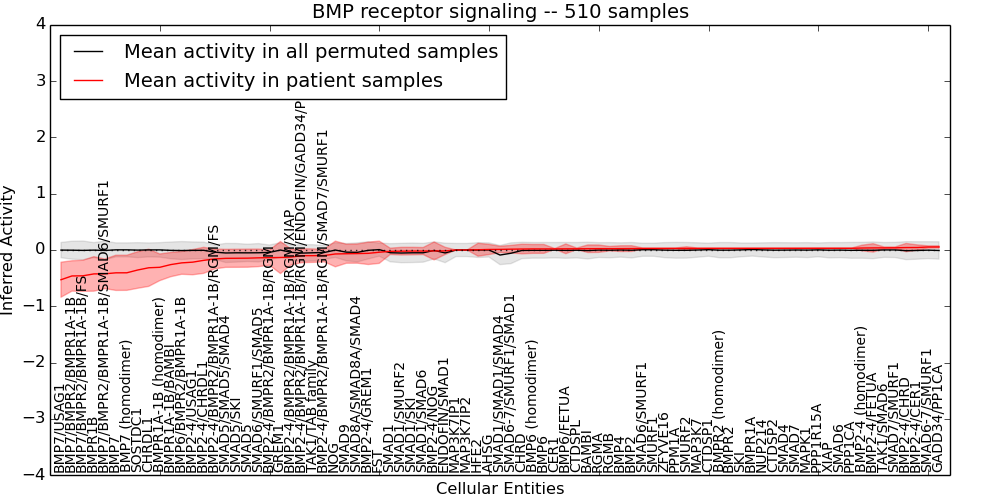
Table S15. Get Full Table This table displays mean, standard deviation, and perturbation statistics for Inferred Pathway Levels (IPLs). A mean perturbation of -9999 implies that the IPLs across all the real samples did not differ enough from the IPLs generated by a background model of permuted samples (> 1 Std.Dev from the permuted sample IPLs).
| Entity | Mean | Std.Dev | Mean.of.Up.Perturbations | Number.of.Up.Perturbations | Mean.of.Down.Perturbations | Number.of.Down.Perturbations | Number.of.Total.Perturbations |
|---|---|---|---|---|---|---|---|
| BMP7/BMPR2/BMPR1A-1B/FS | -0.46 | 0.28 | -10000 | 0 | -0.56 | 407 | 407 |
| SMAD6-7/SMURF1 | 0.054 | 0.021 | -10000 | 0 | -10000 | 0 | 0 |
| NOG | -0.07 | 0.23 | -10000 | 0 | -0.6 | 81 | 81 |
| SMAD9 | -0.066 | 0.17 | -10000 | 0 | -0.63 | 38 | 38 |
| SMAD4 | 0.029 | 0.005 | -10000 | 0 | -10000 | 0 | 0 |
| SMAD5 | -0.14 | 0.16 | -10000 | 0 | -0.5 | 30 | 30 |
| BMP7/USAG1 | -0.53 | 0.31 | -10000 | 0 | -0.65 | 416 | 416 |
| SMAD5/SKI | -0.15 | 0.16 | 0.33 | 2 | -0.48 | 28 | 30 |
| SMAD1 | -0.024 | 0.056 | -10000 | 0 | -10000 | 0 | 0 |
| BMP2 | 0.025 | 0.051 | -10000 | 0 | -0.64 | 3 | 3 |
| SMAD1/SMAD1/SMAD4 | 0.011 | 0.056 | -10000 | 0 | -10000 | 0 | 0 |
| BMPR1A | 0.029 | 0.006 | -10000 | 0 | -10000 | 0 | 0 |
| BMPR1B | -0.42 | 0.31 | -10000 | 0 | -0.63 | 350 | 350 |
| BMPR1A-1B/BAMBI | -0.26 | 0.22 | -10000 | 0 | -0.41 | 345 | 345 |
| AHSG | 0.009 | 0.091 | -10000 | 0 | -0.6 | 11 | 11 |
| CER1 | 0.02 | 0.006 | -10000 | 0 | -10000 | 0 | 0 |
| BMP2-4/CER1 | 0.044 | 0.048 | -10000 | 0 | -0.41 | 4 | 4 |
| BMP2-4/BMPR2/BMPR1A-1B/RGM/ENDOFIN/GADD34/PP1CA | -0.1 | 0.12 | -10000 | 0 | -0.46 | 9 | 9 |
| BMP2-4 (homodimer) | 0.035 | 0.051 | -10000 | 0 | -0.47 | 4 | 4 |
| RGMB | 0.023 | 0.04 | -10000 | 0 | -0.59 | 2 | 2 |
| BMP6/BMPR2/BMPR1A-1B | -0.23 | 0.2 | -10000 | 0 | -0.37 | 335 | 335 |
| RGMA | 0.023 | 0.066 | -10000 | 0 | -0.64 | 5 | 5 |
| SMURF1 | 0.027 | 0.009 | -10000 | 0 | -10000 | 0 | 0 |
| BMP2-4/BMPR2/BMPR1A-1B/RGM/XIAP | -0.12 | 0.14 | -10000 | 0 | -0.41 | 33 | 33 |
| BMP2-4/USAG1 | -0.22 | 0.22 | -10000 | 0 | -0.41 | 292 | 292 |
| SMAD6/SMURF1/SMAD5 | -0.14 | 0.16 | 0.31 | 1 | -0.49 | 26 | 27 |
| SOSTDC1 | -0.36 | 0.32 | -10000 | 0 | -0.64 | 293 | 293 |
| BMP7/BMPR2/BMPR1A-1B | -0.46 | 0.27 | -10000 | 0 | -0.56 | 419 | 419 |
| SKI | 0.029 | 0.006 | -10000 | 0 | -10000 | 0 | 0 |
| BMP6 (homodimer) | 0.019 | 0.079 | -10000 | 0 | -0.6 | 8 | 8 |
| HFE2 | 0.005 | 0.12 | -10000 | 0 | -0.59 | 18 | 18 |
| ZFYVE16 | 0.027 | 0.009 | -10000 | 0 | -10000 | 0 | 0 |
| MAP3K7 | 0.028 | 0.007 | -10000 | 0 | -10000 | 0 | 0 |
| BMP2-4/CHRD | 0.043 | 0.073 | -10000 | 0 | -0.43 | 10 | 10 |
| SMAD5/SMAD5/SMAD4 | -0.15 | 0.16 | 0.31 | 1 | -0.51 | 24 | 25 |
| MAPK1 | 0.03 | 0.004 | -10000 | 0 | -10000 | 0 | 0 |
| TAK1/TAB family | -0.1 | 0.12 | -10000 | 0 | -0.39 | 16 | 16 |
| BMP7 (homodimer) | -0.4 | 0.31 | -10000 | 0 | -0.63 | 332 | 332 |
| NUP214 | 0.029 | 0.006 | -10000 | 0 | -10000 | 0 | 0 |
| BMP6/FETUA | 0.021 | 0.086 | -10000 | 0 | -0.45 | 15 | 15 |
| SMAD1/SKI | -0.019 | 0.067 | 0.34 | 1 | -0.42 | 1 | 2 |
| SMAD6 | 0.03 | 0.003 | -10000 | 0 | -10000 | 0 | 0 |
| CTDSP2 | 0.029 | 0.005 | -10000 | 0 | -10000 | 0 | 0 |
| BMP2-4/FETUA | 0.037 | 0.075 | -10000 | 0 | -0.38 | 14 | 14 |
| MAP3K7IP1 | 0 | 0 | -10000 | 0 | -10000 | 0 | 0 |
| GREM1 | -0.13 | 0.28 | -10000 | 0 | -0.63 | 126 | 126 |
| BMPR2 (homodimer) | 0.029 | 0.007 | -10000 | 0 | -10000 | 0 | 0 |
| GADD34/PP1CA | 0.054 | 0.02 | -10000 | 0 | -10000 | 0 | 0 |
| BMPR1A-1B (homodimer) | -0.31 | 0.24 | -10000 | 0 | -0.47 | 347 | 347 |
| CHRDL1 | -0.32 | 0.33 | -10000 | 0 | -0.63 | 265 | 265 |
| ENDOFIN/SMAD1 | -0.016 | 0.065 | 0.34 | 1 | -0.44 | 1 | 2 |
| SMAD6-7/SMURF1/SMAD1 | 0.015 | 0.067 | -10000 | 0 | -10000 | 0 | 0 |
| SMAD6/SMURF1 | 0.027 | 0.009 | -10000 | 0 | -10000 | 0 | 0 |
| BAMBI | 0.022 | 0.067 | -10000 | 0 | -0.58 | 6 | 6 |
| SMURF2 | 0.028 | 0.03 | -10000 | 0 | -0.64 | 1 | 1 |
| BMP2-4/CHRDL1 | -0.18 | 0.23 | -10000 | 0 | -0.41 | 258 | 258 |
| BMP2-4/GREM1 | -0.059 | 0.2 | -10000 | 0 | -0.4 | 124 | 124 |
| SMAD7 | 0.029 | 0.005 | -10000 | 0 | -10000 | 0 | 0 |
| SMAD8A/SMAD8A/SMAD4 | -0.064 | 0.17 | -10000 | 0 | -0.58 | 43 | 43 |
| SMAD1/SMAD6 | -0.018 | 0.063 | -10000 | 0 | -0.44 | 1 | 1 |
| TAK1/SMAD6 | 0.038 | 0.016 | -10000 | 0 | -10000 | 0 | 0 |
| BMP7 | -0.41 | 0.31 | -10000 | 0 | -0.64 | 332 | 332 |
| BMP6 | 0.019 | 0.079 | -10000 | 0 | -0.6 | 8 | 8 |
| MAP3K7IP2 | 0 | 0 | -10000 | 0 | -10000 | 0 | 0 |
| BMP2-4/BMPR2/BMPR1A-1B/RGM/SMAD7/SMURF1 | -0.098 | 0.11 | -10000 | 0 | -0.35 | 27 | 27 |
| PPM1A | 0.028 | 0.008 | -10000 | 0 | -10000 | 0 | 0 |
| SMAD1/SMURF2 | -0.021 | 0.068 | 0.34 | 1 | -0.44 | 1 | 2 |
| SMAD7/SMURF1 | 0.039 | 0.015 | -10000 | 0 | -10000 | 0 | 0 |
| CTDSPL | 0.021 | 0.014 | -10000 | 0 | -10000 | 0 | 0 |
| PPP1CA | 0.03 | 0.003 | -10000 | 0 | -10000 | 0 | 0 |
| XIAP | 0.03 | 0.003 | -10000 | 0 | -10000 | 0 | 0 |
| CTDSP1 | 0.029 | 0.007 | -10000 | 0 | -10000 | 0 | 0 |
| PPP1R15A | 0.03 | 0.003 | -10000 | 0 | -10000 | 0 | 0 |
| BMP2-4/BMPR2/BMPR1A-1B/RGM/FS | -0.16 | 0.18 | -10000 | 0 | -0.5 | 66 | 66 |
| CHRD | 0.017 | 0.086 | -10000 | 0 | -0.62 | 9 | 9 |
| BMPR2 | 0.029 | 0.007 | -10000 | 0 | -10000 | 0 | 0 |
| BMP2-4/BMPR2/BMPR1A-1B/RGM | -0.14 | 0.14 | -10000 | 0 | -0.41 | 34 | 34 |
| BMP4 | 0.024 | 0.051 | -10000 | 0 | -0.64 | 3 | 3 |
| FST | -0.04 | 0.2 | -10000 | 0 | -0.63 | 52 | 52 |
| BMP2-4/NOG | -0.017 | 0.16 | -10000 | 0 | -0.38 | 80 | 80 |
| BMP7/BMPR2/BMPR1A-1B/SMAD6/SMURF1 | -0.42 | 0.26 | -10000 | 0 | -0.54 | 395 | 395 |
Figure S16. Get High-res Image This plot shows pathway concept perturbations across all samples against a permutation model. The concepts along the x-axis are sorted by lowest to highest mean activity for the real patient samples. Mean inferred activities are plotted along the y-axis as a colored band showing the average level and one standard deviation range. Real samples are shown in red and permuted samples in black.
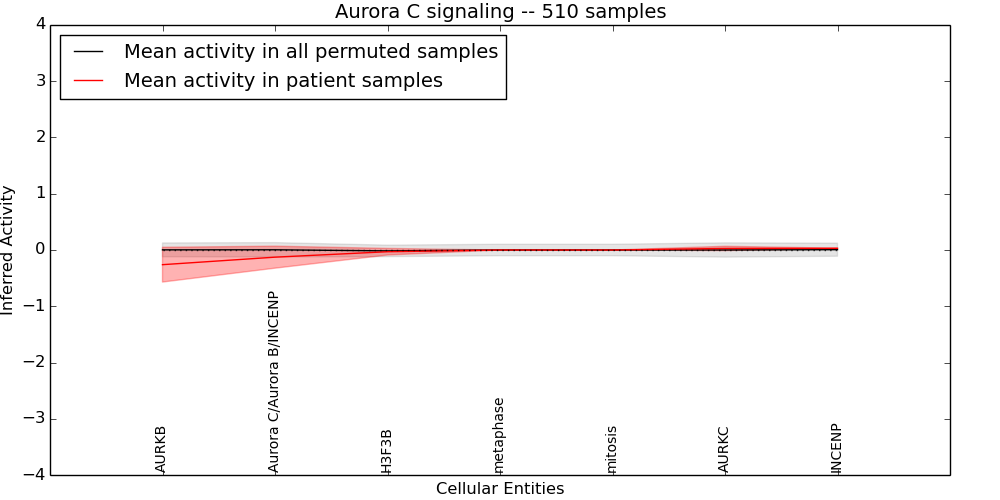
Table S16. Get Full Table This table displays mean, standard deviation, and perturbation statistics for Inferred Pathway Levels (IPLs). A mean perturbation of -9999 implies that the IPLs across all the real samples did not differ enough from the IPLs generated by a background model of permuted samples (> 1 Std.Dev from the permuted sample IPLs).
| Entity | Mean | Std.Dev | Mean.of.Up.Perturbations | Number.of.Up.Perturbations | Mean.of.Down.Perturbations | Number.of.Down.Perturbations | Number.of.Total.Perturbations |
|---|---|---|---|---|---|---|---|
| INCENP | 0.03 | 0.003 | -9999 | 0 | -10000 | 0 | 0 |
| Aurora C/Aurora B/INCENP | -0.13 | 0.2 | -9999 | 0 | -0.34 | 235 | 235 |
| metaphase | 0 | 0 | -9999 | 0 | -10000 | 0 | 0 |
| mitosis | 0 | 0 | -9999 | 0 | -10000 | 0 | 0 |
| H3F3B | -0.031 | 0.059 | -9999 | 0 | -0.62 | 1 | 1 |
| AURKB | -0.26 | 0.31 | -9999 | 0 | -0.59 | 239 | 239 |
| AURKC | 0.027 | 0.039 | -9999 | 0 | -0.59 | 2 | 2 |
Figure S17. Get High-res Image This plot shows pathway concept perturbations across all samples against a permutation model. The concepts along the x-axis are sorted by lowest to highest mean activity for the real patient samples. Mean inferred activities are plotted along the y-axis as a colored band showing the average level and one standard deviation range. Real samples are shown in red and permuted samples in black.
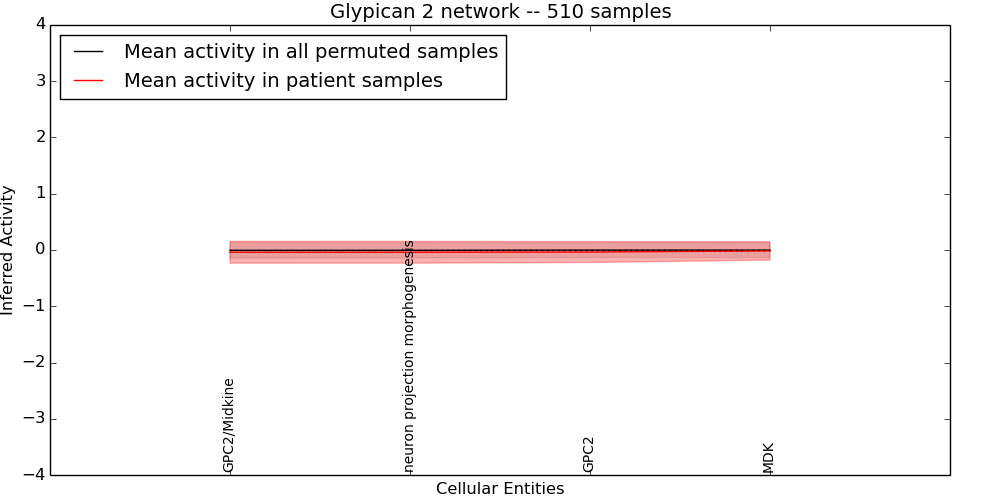
Table S17. Get Full Table This table displays mean, standard deviation, and perturbation statistics for Inferred Pathway Levels (IPLs). A mean perturbation of -9999 implies that the IPLs across all the real samples did not differ enough from the IPLs generated by a background model of permuted samples (> 1 Std.Dev from the permuted sample IPLs).
| Entity | Mean | Std.Dev | Mean.of.Up.Perturbations | Number.of.Up.Perturbations | Mean.of.Down.Perturbations | Number.of.Down.Perturbations | Number.of.Total.Perturbations |
|---|---|---|---|---|---|---|---|
| MDK | -0.016 | 0.16 | -9999 | 0 | -0.59 | 38 | 38 |
| GPC2 | -0.036 | 0.19 | -9999 | 0 | -0.59 | 52 | 52 |
| GPC2/Midkine | -0.04 | 0.19 | -9999 | 0 | -0.48 | 77 | 77 |
| neuron projection morphogenesis | -0.04 | 0.19 | -9999 | 0 | -0.48 | 77 | 77 |
Figure S18. Get High-res Image This plot shows pathway concept perturbations across all samples against a permutation model. The concepts along the x-axis are sorted by lowest to highest mean activity for the real patient samples. Mean inferred activities are plotted along the y-axis as a colored band showing the average level and one standard deviation range. Real samples are shown in red and permuted samples in black.
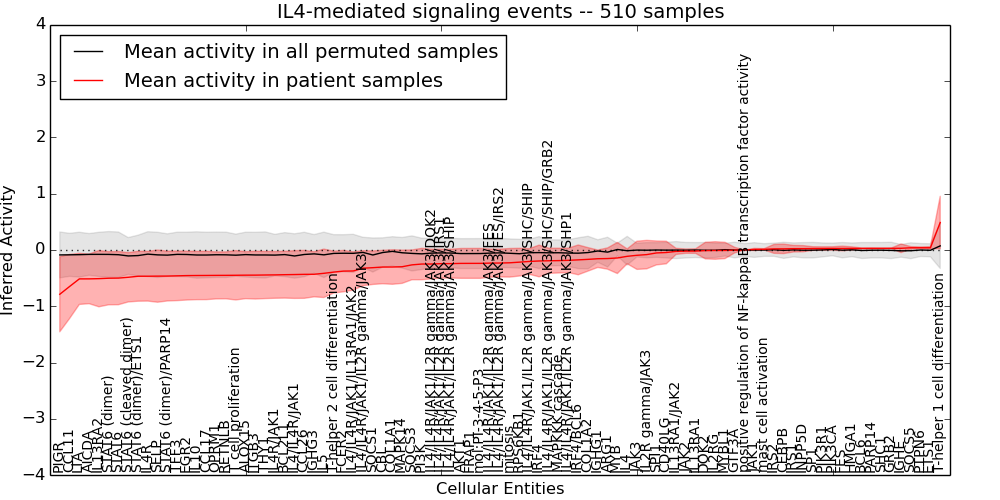
Table S18. Get Full Table This table displays mean, standard deviation, and perturbation statistics for Inferred Pathway Levels (IPLs). A mean perturbation of -9999 implies that the IPLs across all the real samples did not differ enough from the IPLs generated by a background model of permuted samples (> 1 Std.Dev from the permuted sample IPLs).
| Entity | Mean | Std.Dev | Mean.of.Up.Perturbations | Number.of.Up.Perturbations | Mean.of.Down.Perturbations | Number.of.Down.Perturbations | Number.of.Total.Perturbations |
|---|---|---|---|---|---|---|---|
| BCL2L1 | -0.44 | 0.42 | -10000 | 0 | -1.1 | 84 | 84 |
| STAT6 (cleaved dimer) | -0.48 | 0.44 | -10000 | 0 | -1.1 | 123 | 123 |
| IGHG1 | -0.16 | 0.16 | -10000 | 0 | -0.51 | 7 | 7 |
| IGHG3 | -0.43 | 0.4 | -10000 | 0 | -1 | 107 | 107 |
| AKT1 | -0.24 | 0.26 | -10000 | 0 | -0.72 | 55 | 55 |
| IL4/IL4R/JAK1/IL2R gamma/JAK3/SHP1 | -0.18 | 0.22 | -10000 | 0 | -0.66 | 39 | 39 |
| IL4/IL4R/JAK1/IL2R gamma/JAK3/IRS1 | -0.24 | 0.26 | -10000 | 0 | -0.74 | 46 | 46 |
| THY1 | -0.44 | 0.42 | -10000 | 0 | -1.1 | 78 | 78 |
| MYB | -0.14 | 0.28 | -10000 | 0 | -0.59 | 139 | 139 |
| HMGA1 | 0.028 | 0.028 | -10000 | 0 | -0.59 | 1 | 1 |
| IL4/IL4R/JAK1/IL2R gamma/JAK3 | -0.32 | 0.31 | -10000 | 0 | -0.79 | 101 | 101 |
| IL4/IL4R/JAK1/IL2R gamma/JAK3/SHIP | -0.24 | 0.26 | -10000 | 0 | -0.75 | 44 | 44 |
| SP1 | 0.026 | 0.032 | -10000 | 0 | -10000 | 0 | 0 |
| INPP5D | 0.024 | 0.055 | -10000 | 0 | -0.59 | 4 | 4 |
| SOCS5 | 0.04 | 0.021 | -10000 | 0 | -10000 | 0 | 0 |
| STAT6 (dimer)/ETS1 | -0.47 | 0.44 | -10000 | 0 | -1.1 | 113 | 113 |
| SOCS1 | -0.31 | 0.3 | -10000 | 0 | -0.77 | 59 | 59 |
| SOCS3 | -0.26 | 0.26 | -10000 | 0 | -0.8 | 37 | 37 |
| FCER2 | -0.38 | 0.37 | -10000 | 0 | -0.95 | 89 | 89 |
| PARP14 | 0.029 | 0.009 | -10000 | 0 | -10000 | 0 | 0 |
| CCL17 | -0.45 | 0.43 | -10000 | 0 | -1.1 | 81 | 81 |
| GRB2 | 0.029 | 0.005 | -10000 | 0 | -10000 | 0 | 0 |
| IL4/IL4R/JAK1/IL2R gamma/JAK3/SHC/SHIP | -0.2 | 0.23 | -10000 | 0 | -0.69 | 38 | 38 |
| T cell proliferation | -0.45 | 0.44 | -10000 | 0 | -1.1 | 98 | 98 |
| IL4R/JAK1 | -0.44 | 0.42 | -10000 | 0 | -1.1 | 93 | 93 |
| EGR2 | -0.46 | 0.43 | -10000 | 0 | -1.1 | 89 | 89 |
| JAK2 | -0.02 | 0.039 | -10000 | 0 | -10000 | 0 | 0 |
| JAK3 | -0.094 | 0.25 | -10000 | 0 | -0.59 | 103 | 103 |
| PIK3R1 | 0.026 | 0.031 | -10000 | 0 | -0.64 | 1 | 1 |
| JAK1 | 0.01 | 0.019 | -10000 | 0 | -10000 | 0 | 0 |
| COL1A2 | -0.17 | 0.21 | -10000 | 0 | -0.69 | 30 | 30 |
| CCL26 | -0.43 | 0.43 | -10000 | 0 | -1.1 | 83 | 83 |
| IL4R | -0.47 | 0.44 | -10000 | 0 | -1.1 | 94 | 94 |
| PTPN6 | 0.04 | 0.015 | -10000 | 0 | -10000 | 0 | 0 |
| IL13RA2 | -0.51 | 0.5 | -10000 | 0 | -1.3 | 111 | 111 |
| IL13RA1 | -0.019 | 0.041 | -10000 | 0 | -10000 | 0 | 0 |
| IRF4 | -0.2 | 0.28 | -10000 | 0 | -0.75 | 59 | 59 |
| ARG1 | -0.15 | 0.19 | -10000 | 0 | -0.75 | 13 | 13 |
| CBL | -0.3 | 0.3 | -10000 | 0 | -0.77 | 91 | 91 |
| GTF3A | -0.002 | 0.049 | -10000 | 0 | -10000 | 0 | 0 |
| PIK3CA | 0.027 | 0.03 | -10000 | 0 | -0.64 | 1 | 1 |
| IL13RA1/JAK2 | -0.025 | 0.055 | -10000 | 0 | -10000 | 0 | 0 |
| IRF4/BCL6 | -0.18 | 0.26 | -10000 | 0 | -0.73 | 43 | 43 |
| CD40LG | -0.045 | 0.2 | -10000 | 0 | -0.64 | 51 | 51 |
| MAPK14 | -0.3 | 0.3 | -10000 | 0 | -0.8 | 75 | 75 |
| mitosis | -0.23 | 0.25 | -10000 | 0 | -0.68 | 55 | 55 |
| STAT6 | -0.5 | 0.47 | -10000 | 0 | -1.2 | 102 | 102 |
| SPI1 | -0.052 | 0.21 | -10000 | 0 | -0.58 | 70 | 70 |
| RPS6KB1 | -0.22 | 0.25 | -10000 | 0 | -0.68 | 43 | 43 |
| STAT6 (dimer) | -0.5 | 0.47 | -10000 | 0 | -1.2 | 101 | 101 |
| STAT6 (dimer)/PARP14 | -0.46 | 0.44 | -10000 | 0 | -1.1 | 100 | 100 |
| mast cell activation | 0.012 | 0.011 | -10000 | 0 | -10000 | 0 | 0 |
| IL4/IL4R/JAK1/IL2R gamma/JAK3/DOK2 | -0.25 | 0.26 | -10000 | 0 | -0.73 | 61 | 61 |
| FRAP1 | -0.24 | 0.27 | -10000 | 0 | -0.72 | 55 | 55 |
| LTA | -0.51 | 0.45 | -10000 | 0 | -1.2 | 108 | 108 |
| FES | 0.027 | 0.042 | -10000 | 0 | -0.64 | 2 | 2 |
| T-helper 1 cell differentiation | 0.49 | 0.47 | 1.2 | 103 | -10000 | 0 | 103 |
| CCL11 | -0.65 | 0.57 | -10000 | 0 | -1.3 | 204 | 204 |
| IL4/IL4R/JAK1/IL2R gamma/JAK3/FES | -0.23 | 0.25 | -10000 | 0 | -0.71 | 49 | 49 |
| IL2RG | -0.009 | 0.16 | -10000 | 0 | -0.59 | 34 | 34 |
| IL10 | -0.45 | 0.43 | -10000 | 0 | -1.2 | 80 | 80 |
| IRS1 | 0.023 | 0.059 | -10000 | 0 | -0.64 | 4 | 4 |
| IRS2 | 0.02 | 0.079 | -10000 | 0 | -0.6 | 8 | 8 |
| IL4 | -0.11 | 0.13 | -10000 | 0 | -1.1 | 3 | 3 |
| IL5 | -0.41 | 0.43 | -10000 | 0 | -1.1 | 78 | 78 |
| IL4/IL4R/JAK1/IL13RA1/JAK2 | -0.37 | 0.34 | -10000 | 0 | -0.87 | 84 | 84 |
| COL1A1 | -0.3 | 0.31 | -10000 | 0 | -0.69 | 143 | 143 |
| positive regulation of NF-kappaB transcription factor activity | 0 | 0 | -10000 | 0 | -10000 | 0 | 0 |
| IL4/IL4R/JAK1 | -0.44 | 0.42 | -10000 | 0 | -1.1 | 78 | 78 |
| IL2R gamma/JAK3 | -0.082 | 0.25 | -10000 | 0 | -0.55 | 107 | 107 |
| TFF3 | -0.46 | 0.44 | -10000 | 0 | -1.1 | 91 | 91 |
| ALOX15 | -0.45 | 0.42 | -10000 | 0 | -1.1 | 84 | 84 |
| MYBL1 | -0.008 | 0.14 | -10000 | 0 | -0.59 | 30 | 30 |
| T-helper 2 cell differentiation | -0.39 | 0.37 | -10000 | 0 | -0.95 | 93 | 93 |
| SHC1 | 0.029 | 0.007 | -10000 | 0 | -10000 | 0 | 0 |
| CEBPB | 0.02 | 0.085 | -10000 | 0 | -0.6 | 9 | 9 |
| IL4/IL4R/JAK1/IL2R gamma/JAK3/FES/IRS2 | -0.23 | 0.25 | -10000 | 0 | -0.71 | 45 | 45 |
| mol:PI-3-4-5-P3 | -0.24 | 0.27 | -10000 | 0 | -0.72 | 55 | 55 |
| PI3K | -0.25 | 0.28 | -10000 | 0 | -0.76 | 55 | 55 |
| DOK2 | -0.01 | 0.15 | -10000 | 0 | -0.59 | 31 | 31 |
| ETS1 | 0.04 | 0.02 | -10000 | 0 | -10000 | 0 | 0 |
| IL4/IL4R/JAK1/IL2R gamma/JAK3/SHC/SHIP/GRB2 | -0.19 | 0.22 | -10000 | 0 | -0.67 | 39 | 39 |
| ITGB3 | -0.45 | 0.42 | -10000 | 0 | -1.1 | 78 | 78 |
| PIGR | -0.79 | 0.67 | -10000 | 0 | -1.4 | 247 | 247 |
| IGHE | 0.03 | 0.077 | 0.26 | 9 | -0.43 | 2 | 11 |
| MAPKKK cascade | -0.19 | 0.22 | -10000 | 0 | -0.66 | 39 | 39 |
| BCL6 | 0.028 | 0.007 | -10000 | 0 | -10000 | 0 | 0 |
| OPRM1 | -0.45 | 0.42 | -10000 | 0 | -1.1 | 82 | 82 |
| RETNLB | -0.45 | 0.42 | -10000 | 0 | -1.1 | 82 | 82 |
| SELP | -0.46 | 0.46 | -10000 | 0 | -1.2 | 81 | 81 |
| AICDA | -0.51 | 0.44 | -10000 | 0 | -1.1 | 133 | 133 |
Figure S19. Get High-res Image This plot shows pathway concept perturbations across all samples against a permutation model. The concepts along the x-axis are sorted by lowest to highest mean activity for the real patient samples. Mean inferred activities are plotted along the y-axis as a colored band showing the average level and one standard deviation range. Real samples are shown in red and permuted samples in black.
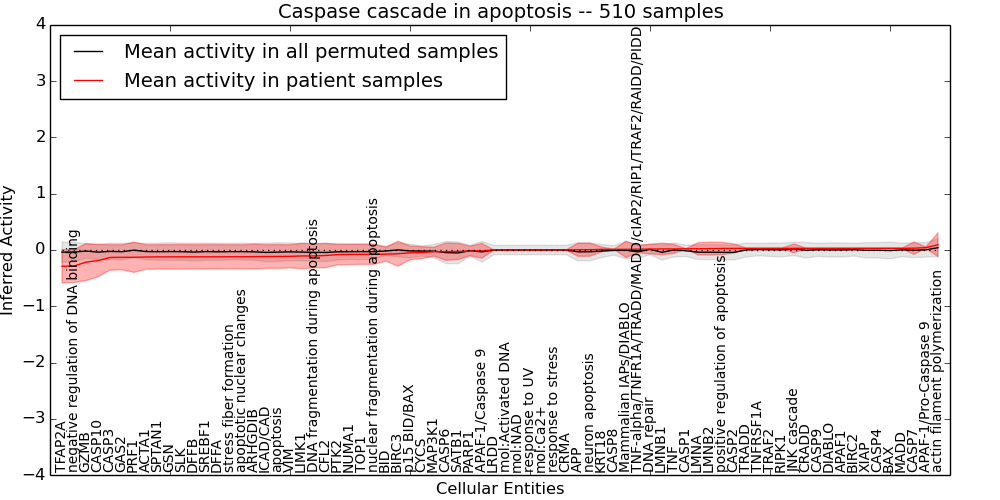
Table S19. Get Full Table This table displays mean, standard deviation, and perturbation statistics for Inferred Pathway Levels (IPLs). A mean perturbation of -9999 implies that the IPLs across all the real samples did not differ enough from the IPLs generated by a background model of permuted samples (> 1 Std.Dev from the permuted sample IPLs).
| Entity | Mean | Std.Dev | Mean.of.Up.Perturbations | Number.of.Up.Perturbations | Mean.of.Down.Perturbations | Number.of.Down.Perturbations | Number.of.Total.Perturbations |
|---|---|---|---|---|---|---|---|
| TOP1 | -0.078 | 0.18 | -10000 | 0 | -0.37 | 109 | 109 |
| ACTA1 | -0.12 | 0.22 | -10000 | 0 | -0.49 | 111 | 111 |
| NUMA1 | -0.079 | 0.18 | -10000 | 0 | -0.38 | 110 | 110 |
| SPTAN1 | -0.12 | 0.22 | -10000 | 0 | -0.49 | 107 | 107 |
| LIMK1 | -0.11 | 0.22 | 0.41 | 1 | -0.48 | 108 | 109 |
| BIRC3 | -0.066 | 0.22 | -10000 | 0 | -0.59 | 79 | 79 |
| BIRC2 | 0.03 | 0.004 | -10000 | 0 | -10000 | 0 | 0 |
| BAX | 0.03 | 0.003 | -10000 | 0 | -10000 | 0 | 0 |
| CASP10 | -0.19 | 0.29 | -10000 | 0 | -0.55 | 183 | 183 |
| CRMA | 0 | 0 | -10000 | 0 | -10000 | 0 | 0 |
| XIAP | 0.03 | 0.003 | -10000 | 0 | -10000 | 0 | 0 |
| PTK2 | -0.082 | 0.18 | -10000 | 0 | -0.38 | 109 | 109 |
| DIABLO | 0.029 | 0.005 | -10000 | 0 | -10000 | 0 | 0 |
| apoptotic nuclear changes | -0.12 | 0.21 | -10000 | 0 | -0.48 | 107 | 107 |
| response to UV | 0 | 0 | -10000 | 0 | -10000 | 0 | 0 |
| CRADD | 0.029 | 0.005 | -10000 | 0 | -10000 | 0 | 0 |
| GSN | -0.12 | 0.22 | -10000 | 0 | -0.49 | 107 | 107 |
| MADD | 0.03 | 0.003 | -10000 | 0 | -10000 | 0 | 0 |
| TFAP2A | -0.29 | 0.3 | -10000 | 0 | -0.54 | 268 | 268 |
| BID | -0.074 | 0.12 | -10000 | 0 | -0.28 | 108 | 108 |
| MAP3K1 | -0.03 | 0.078 | -10000 | 0 | -10000 | 0 | 0 |
| TRADD | 0.029 | 0.006 | -10000 | 0 | -10000 | 0 | 0 |
| mol:Ca2+ | 0 | 0 | -10000 | 0 | -10000 | 0 | 0 |
| APAF-1/Pro-Caspase 9 | 0.042 | 0.013 | -10000 | 0 | -10000 | 0 | 0 |
| mol:Activated DNA | 0 | 0 | -10000 | 0 | -10000 | 0 | 0 |
| ARHGDIB | -0.12 | 0.22 | 0.34 | 2 | -0.49 | 107 | 109 |
| CASP9 | 0.029 | 0.006 | -10000 | 0 | -10000 | 0 | 0 |
| DNA repair | 0.016 | 0.084 | 0.3 | 12 | -0.2 | 2 | 14 |
| neuron apoptosis | 0.005 | 0.12 | -10000 | 0 | -0.63 | 14 | 14 |
| mol:NAD | 0 | 0 | -10000 | 0 | -10000 | 0 | 0 |
| DNA fragmentation during apoptosis | -0.11 | 0.21 | -10000 | 0 | -0.46 | 109 | 109 |
| APAF1 | 0.029 | 0.006 | -10000 | 0 | -10000 | 0 | 0 |
| CASP6 | -0.03 | 0.15 | 0.38 | 1 | -0.9 | 7 | 8 |
| TRAF2 | 0.029 | 0.006 | -10000 | 0 | -10000 | 0 | 0 |
| ICAD/CAD | -0.12 | 0.21 | 0.43 | 1 | -0.47 | 107 | 108 |
| CASP7 | 0.032 | 0.11 | 0.28 | 25 | -0.33 | 8 | 33 |
| KRT18 | 0.011 | 0.041 | -10000 | 0 | -0.32 | 1 | 1 |
| apoptosis | -0.12 | 0.21 | 0.41 | 2 | -0.48 | 91 | 93 |
| DFFA | -0.12 | 0.22 | -10000 | 0 | -0.49 | 107 | 107 |
| DFFB | -0.12 | 0.22 | -10000 | 0 | -0.49 | 107 | 107 |
| PARP1 | -0.017 | 0.085 | 0.2 | 2 | -0.31 | 12 | 14 |
| actin filament polymerization | 0.094 | 0.21 | 0.45 | 100 | -0.41 | 2 | 102 |
| TNF | 0.019 | 0.08 | -10000 | 0 | -0.61 | 8 | 8 |
| CYCS | -0.047 | 0.11 | 0.19 | 5 | -0.22 | 103 | 108 |
| SATB1 | -0.027 | 0.14 | 0.44 | 2 | -0.83 | 7 | 9 |
| SLK | -0.12 | 0.22 | 0.34 | 1 | -0.49 | 108 | 109 |
| p15 BID/BAX | -0.052 | 0.12 | -10000 | 0 | -0.28 | 2 | 2 |
| CASP2 | 0.028 | 0.082 | -10000 | 0 | -0.47 | 2 | 2 |
| JNK cascade | 0.029 | 0.078 | -10000 | 0 | -10000 | 0 | 0 |
| CASP3 | -0.13 | 0.23 | -10000 | 0 | -0.52 | 107 | 107 |
| LMNB2 | 0.025 | 0.11 | 0.36 | 11 | -0.54 | 6 | 17 |
| RIPK1 | 0.029 | 0.006 | -10000 | 0 | -10000 | 0 | 0 |
| CASP4 | 0.03 | 0.004 | -10000 | 0 | -10000 | 0 | 0 |
| Mammalian IAPs/DIABLO | 0.012 | 0.14 | -10000 | 0 | -0.33 | 75 | 75 |
| negative regulation of DNA binding | -0.29 | 0.29 | -10000 | 0 | -0.53 | 268 | 268 |
| stress fiber formation | -0.12 | 0.21 | 0.34 | 1 | -0.48 | 108 | 109 |
| GZMB | -0.22 | 0.33 | -10000 | 0 | -0.63 | 185 | 185 |
| CASP1 | 0.021 | 0.003 | -10000 | 0 | -10000 | 0 | 0 |
| LMNB1 | 0.019 | 0.1 | 0.39 | 8 | -0.42 | 6 | 14 |
| APP | 0.005 | 0.12 | -10000 | 0 | -0.64 | 14 | 14 |
| TNFRSF1A | 0.029 | 0.006 | -10000 | 0 | -10000 | 0 | 0 |
| response to stress | 0 | 0 | -10000 | 0 | -10000 | 0 | 0 |
| CASP8 | 0.011 | 0.002 | -10000 | 0 | -10000 | 0 | 0 |
| VIM | -0.11 | 0.21 | -10000 | 0 | -0.47 | 91 | 91 |
| LMNA | 0.022 | 0.11 | 0.36 | 11 | -0.38 | 10 | 21 |
| TNF-alpha/TNFR1A/TRADD/MADD/cIAP2/RIP1/TRAF2/RAIDD/PIDD | 0.014 | 0.066 | -10000 | 0 | -0.5 | 2 | 2 |
| LRDD | 0 | 0 | -10000 | 0 | -10000 | 0 | 0 |
| SREBF1 | -0.12 | 0.22 | 0.3 | 1 | -0.49 | 107 | 108 |
| APAF-1/Caspase 9 | -0.015 | 0.13 | -10000 | 0 | -0.59 | 22 | 22 |
| nuclear fragmentation during apoptosis | -0.077 | 0.18 | 0.24 | 1 | -0.37 | 110 | 111 |
| CFL2 | -0.098 | 0.22 | 0.41 | 2 | -0.46 | 100 | 102 |
| GAS2 | -0.13 | 0.22 | 0.41 | 1 | -0.49 | 116 | 117 |
| positive regulation of apoptosis | 0.027 | 0.11 | 0.36 | 11 | -0.46 | 7 | 18 |
| PRF1 | -0.13 | 0.27 | -10000 | 0 | -0.59 | 131 | 131 |
Figure S20. Get High-res Image This plot shows pathway concept perturbations across all samples against a permutation model. The concepts along the x-axis are sorted by lowest to highest mean activity for the real patient samples. Mean inferred activities are plotted along the y-axis as a colored band showing the average level and one standard deviation range. Real samples are shown in red and permuted samples in black.
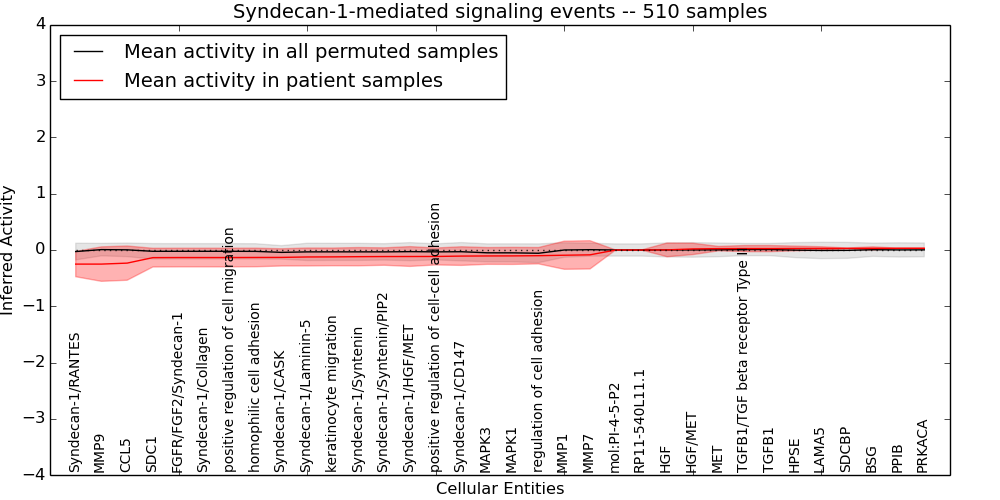
Table S20. Get Full Table This table displays mean, standard deviation, and perturbation statistics for Inferred Pathway Levels (IPLs). A mean perturbation of -9999 implies that the IPLs across all the real samples did not differ enough from the IPLs generated by a background model of permuted samples (> 1 Std.Dev from the permuted sample IPLs).
| Entity | Mean | Std.Dev | Mean.of.Up.Perturbations | Number.of.Up.Perturbations | Mean.of.Down.Perturbations | Number.of.Down.Perturbations | Number.of.Total.Perturbations |
|---|---|---|---|---|---|---|---|
| TGFB1 | 0.025 | 0.055 | -10000 | 0 | -0.59 | 4 | 4 |
| CCL5 | -0.23 | 0.3 | -10000 | 0 | -0.59 | 217 | 217 |
| SDCBP | 0.028 | 0.007 | -10000 | 0 | -10000 | 0 | 0 |
| FGFR/FGF2/Syndecan-1 | -0.13 | 0.17 | 0.29 | 1 | -0.4 | 89 | 90 |
| mol:PI-4-5-P2 | 0 | 0 | -10000 | 0 | -10000 | 0 | 0 |
| RP11-540L11.1 | 0 | 0 | -10000 | 0 | -10000 | 0 | 0 |
| Syndecan-1/Laminin-5 | -0.12 | 0.16 | -10000 | 0 | -0.46 | 44 | 44 |
| Syndecan-1/Syntenin | -0.12 | 0.16 | 0.33 | 2 | -0.46 | 42 | 44 |
| MAPK3 | -0.11 | 0.15 | -10000 | 0 | -0.5 | 22 | 22 |
| HGF/MET | 0.019 | 0.1 | -10000 | 0 | -0.47 | 20 | 20 |
| TGFB1/TGF beta receptor Type II | 0.025 | 0.054 | -10000 | 0 | -0.59 | 4 | 4 |
| BSG | 0.029 | 0.028 | -10000 | 0 | -0.59 | 1 | 1 |
| keratinocyte migration | -0.12 | 0.16 | -10000 | 0 | -0.45 | 44 | 44 |
| Syndecan-1/RANTES | -0.25 | 0.22 | 0.4 | 2 | -0.5 | 183 | 185 |
| Syndecan-1/CD147 | -0.11 | 0.17 | -10000 | 0 | -0.53 | 22 | 22 |
| Syndecan-1/Syntenin/PIP2 | -0.12 | 0.16 | 0.26 | 1 | -0.45 | 42 | 43 |
| LAMA5 | 0.028 | 0.03 | -10000 | 0 | -0.64 | 1 | 1 |
| positive regulation of cell-cell adhesion | -0.12 | 0.15 | -10000 | 0 | -0.44 | 43 | 43 |
| MMP7 | -0.086 | 0.25 | -10000 | 0 | -0.63 | 89 | 89 |
| HGF | 0.002 | 0.12 | -10000 | 0 | -0.6 | 20 | 20 |
| Syndecan-1/CASK | -0.13 | 0.15 | -10000 | 0 | -0.38 | 89 | 89 |
| Syndecan-1/HGF/MET | -0.12 | 0.18 | -10000 | 0 | -0.47 | 55 | 55 |
| regulation of cell adhesion | -0.1 | 0.14 | 0.52 | 1 | -0.49 | 22 | 23 |
| HPSE | 0.027 | 0.042 | -10000 | 0 | -0.64 | 2 | 2 |
| positive regulation of cell migration | -0.13 | 0.17 | 0.29 | 1 | -0.4 | 89 | 90 |
| SDC1 | -0.14 | 0.17 | -10000 | 0 | -0.4 | 89 | 89 |
| Syndecan-1/Collagen | -0.13 | 0.17 | 0.29 | 1 | -0.4 | 89 | 90 |
| PPIB | 0.03 | 0.003 | -10000 | 0 | -10000 | 0 | 0 |
| MET | 0.024 | 0.04 | -10000 | 0 | -0.59 | 2 | 2 |
| PRKACA | 0.03 | 0.002 | -10000 | 0 | -10000 | 0 | 0 |
| MMP9 | -0.25 | 0.31 | -10000 | 0 | -0.59 | 231 | 231 |
| MAPK1 | -0.1 | 0.15 | 0.28 | 1 | -0.5 | 22 | 23 |
| homophilic cell adhesion | -0.13 | 0.16 | 0.29 | 1 | -0.39 | 89 | 90 |
| MMP1 | -0.093 | 0.25 | -10000 | 0 | -0.6 | 99 | 99 |
Figure S21. Get High-res Image This plot shows pathway concept perturbations across all samples against a permutation model. The concepts along the x-axis are sorted by lowest to highest mean activity for the real patient samples. Mean inferred activities are plotted along the y-axis as a colored band showing the average level and one standard deviation range. Real samples are shown in red and permuted samples in black.
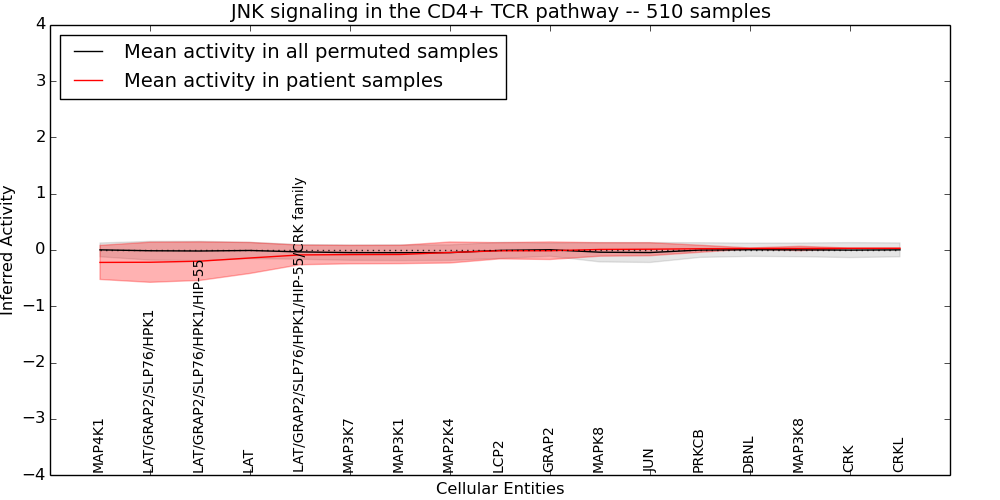
Table S21. Get Full Table This table displays mean, standard deviation, and perturbation statistics for Inferred Pathway Levels (IPLs). A mean perturbation of -9999 implies that the IPLs across all the real samples did not differ enough from the IPLs generated by a background model of permuted samples (> 1 Std.Dev from the permuted sample IPLs).
| Entity | Mean | Std.Dev | Mean.of.Up.Perturbations | Number.of.Up.Perturbations | Mean.of.Down.Perturbations | Number.of.Down.Perturbations | Number.of.Total.Perturbations |
|---|---|---|---|---|---|---|---|
| LAT/GRAP2/SLP76/HPK1 | -0.22 | 0.36 | -10000 | 0 | -0.77 | 118 | 118 |
| MAP4K1 | -0.22 | 0.3 | -10000 | 0 | -0.59 | 207 | 207 |
| MAP3K8 | 0.027 | 0.039 | -10000 | 0 | -0.59 | 2 | 2 |
| PRKCB | 0.022 | 0.063 | -10000 | 0 | -0.61 | 5 | 5 |
| DBNL | 0.027 | 0.009 | -10000 | 0 | -10000 | 0 | 0 |
| CRKL | 0.03 | 0.004 | -10000 | 0 | -10000 | 0 | 0 |
| MAP3K1 | -0.08 | 0.16 | -10000 | 0 | -0.51 | 38 | 38 |
| JUN | 0.014 | 0.12 | 0.33 | 2 | -0.58 | 12 | 14 |
| MAP3K7 | -0.082 | 0.16 | -10000 | 0 | -0.51 | 40 | 40 |
| GRAP2 | -0.013 | 0.16 | -10000 | 0 | -0.59 | 35 | 35 |
| CRK | 0.029 | 0.005 | -10000 | 0 | -10000 | 0 | 0 |
| MAP2K4 | -0.044 | 0.19 | 0.29 | 28 | -0.48 | 39 | 67 |
| LAT | -0.14 | 0.28 | -10000 | 0 | -0.59 | 141 | 141 |
| LCP2 | -0.014 | 0.14 | -10000 | 0 | -0.59 | 30 | 30 |
| MAPK8 | 0.01 | 0.12 | -10000 | 0 | -0.6 | 13 | 13 |
| LAT/GRAP2/SLP76/HPK1/HIP-55/CRK family | -0.087 | 0.17 | -10000 | 0 | -0.52 | 43 | 43 |
| LAT/GRAP2/SLP76/HPK1/HIP-55 | -0.2 | 0.34 | -10000 | 0 | -0.73 | 116 | 116 |
Figure S22. Get High-res Image This plot shows pathway concept perturbations across all samples against a permutation model. The concepts along the x-axis are sorted by lowest to highest mean activity for the real patient samples. Mean inferred activities are plotted along the y-axis as a colored band showing the average level and one standard deviation range. Real samples are shown in red and permuted samples in black.
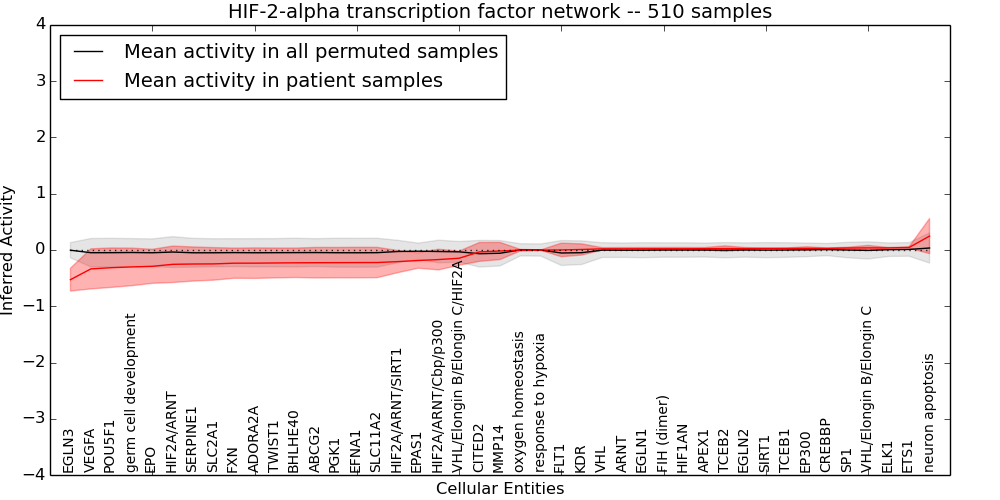
Table S22. Get Full Table This table displays mean, standard deviation, and perturbation statistics for Inferred Pathway Levels (IPLs). A mean perturbation of -9999 implies that the IPLs across all the real samples did not differ enough from the IPLs generated by a background model of permuted samples (> 1 Std.Dev from the permuted sample IPLs).
| Entity | Mean | Std.Dev | Mean.of.Up.Perturbations | Number.of.Up.Perturbations | Mean.of.Down.Perturbations | Number.of.Down.Perturbations | Number.of.Total.Perturbations |
|---|---|---|---|---|---|---|---|
| MMP14 | -0.017 | 0.15 | -10000 | 0 | -0.72 | 19 | 19 |
| oxygen homeostasis | -0.003 | 0.014 | -10000 | 0 | -10000 | 0 | 0 |
| TCEB2 | 0.025 | 0.049 | -10000 | 0 | -0.6 | 3 | 3 |
| TCEB1 | 0.028 | 0.007 | -10000 | 0 | -10000 | 0 | 0 |
| VHL/Elongin B/Elongin C/HIF2A | -0.15 | 0.12 | -10000 | 0 | -0.45 | 9 | 9 |
| EPO | -0.29 | 0.3 | -10000 | 0 | -0.69 | 130 | 130 |
| FIH (dimer) | 0.022 | 0.023 | -10000 | 0 | -10000 | 0 | 0 |
| APEX1 | 0.024 | 0.019 | -10000 | 0 | -10000 | 0 | 0 |
| SERPINE1 | -0.25 | 0.3 | -10000 | 0 | -0.8 | 68 | 68 |
| FLT1 | 0.001 | 0.12 | -10000 | 0 | -0.75 | 9 | 9 |
| ADORA2A | -0.23 | 0.27 | 0.5 | 3 | -0.66 | 84 | 87 |
| germ cell development | -0.3 | 0.33 | -10000 | 0 | -0.73 | 142 | 142 |
| SLC11A2 | -0.22 | 0.27 | -10000 | 0 | -0.73 | 45 | 45 |
| BHLHE40 | -0.23 | 0.26 | -10000 | 0 | -0.74 | 44 | 44 |
| HIF1AN | 0.022 | 0.023 | -10000 | 0 | -10000 | 0 | 0 |
| HIF2A/ARNT/SIRT1 | -0.21 | 0.2 | -10000 | 0 | -0.48 | 85 | 85 |
| ETS1 | 0.045 | 0.012 | -10000 | 0 | -10000 | 0 | 0 |
| CITED2 | -0.034 | 0.17 | -10000 | 0 | -0.74 | 21 | 21 |
| KDR | 0.009 | 0.099 | -10000 | 0 | -0.8 | 6 | 6 |
| PGK1 | -0.22 | 0.27 | -10000 | 0 | -0.73 | 46 | 46 |
| SIRT1 | 0.028 | 0.006 | -10000 | 0 | -10000 | 0 | 0 |
| response to hypoxia | -0.002 | 0.004 | -10000 | 0 | -10000 | 0 | 0 |
| HIF2A/ARNT | -0.25 | 0.32 | -10000 | 0 | -0.76 | 89 | 89 |
| EPAS1 | -0.19 | 0.14 | 0.33 | 1 | -0.36 | 105 | 106 |
| SP1 | 0.036 | 0.013 | -10000 | 0 | -10000 | 0 | 0 |
| ABCG2 | -0.23 | 0.27 | -10000 | 0 | -0.73 | 48 | 48 |
| EFNA1 | -0.22 | 0.27 | -10000 | 0 | -0.73 | 47 | 47 |
| FXN | -0.23 | 0.27 | 0.51 | 2 | -0.65 | 84 | 86 |
| POU5F1 | -0.31 | 0.35 | -10000 | 0 | -0.77 | 145 | 145 |
| neuron apoptosis | 0.25 | 0.31 | 0.73 | 89 | -10000 | 0 | 89 |
| EP300 | 0.028 | 0.03 | -10000 | 0 | -0.64 | 1 | 1 |
| EGLN3 | -0.53 | 0.2 | -10000 | 0 | -0.6 | 451 | 451 |
| EGLN2 | 0.025 | 0.018 | -10000 | 0 | -10000 | 0 | 0 |
| EGLN1 | 0.022 | 0.022 | -10000 | 0 | -10000 | 0 | 0 |
| VHL/Elongin B/Elongin C | 0.037 | 0.044 | -10000 | 0 | -0.38 | 3 | 3 |
| VHL | 0.021 | 0.021 | -10000 | 0 | -0.32 | 1 | 1 |
| ARNT | 0.021 | 0.023 | -10000 | 0 | -10000 | 0 | 0 |
| SLC2A1 | -0.25 | 0.29 | 0.48 | 2 | -0.71 | 87 | 89 |
| TWIST1 | -0.23 | 0.27 | 0.51 | 2 | -0.65 | 85 | 87 |
| ELK1 | 0.037 | 0.007 | -10000 | 0 | -10000 | 0 | 0 |
| HIF2A/ARNT/Cbp/p300 | -0.17 | 0.18 | -10000 | 0 | -0.5 | 28 | 28 |
| VEGFA | -0.34 | 0.36 | -10000 | 0 | -0.73 | 185 | 185 |
| CREBBP | 0.029 | 0.006 | -10000 | 0 | -10000 | 0 | 0 |
Figure S23. Get High-res Image This plot shows pathway concept perturbations across all samples against a permutation model. The concepts along the x-axis are sorted by lowest to highest mean activity for the real patient samples. Mean inferred activities are plotted along the y-axis as a colored band showing the average level and one standard deviation range. Real samples are shown in red and permuted samples in black.
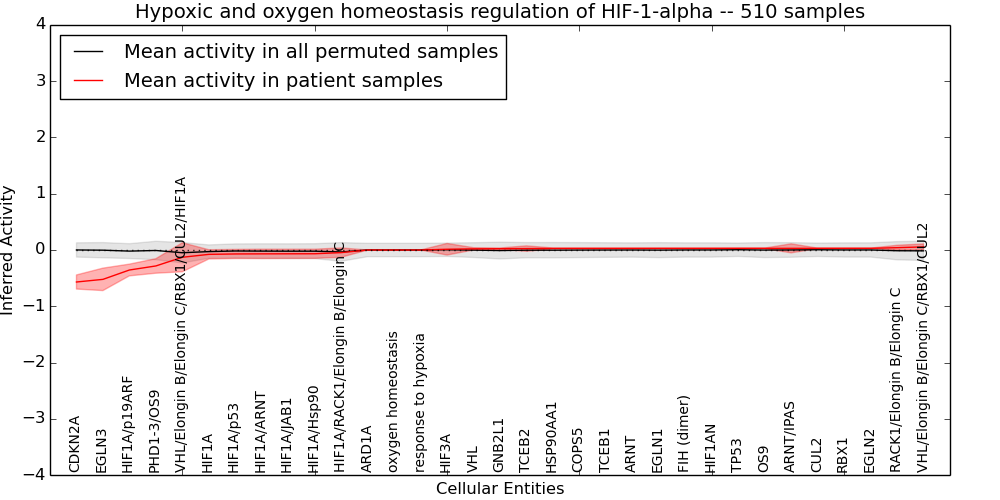
Table S23. Get Full Table This table displays mean, standard deviation, and perturbation statistics for Inferred Pathway Levels (IPLs). A mean perturbation of -9999 implies that the IPLs across all the real samples did not differ enough from the IPLs generated by a background model of permuted samples (> 1 Std.Dev from the permuted sample IPLs).
| Entity | Mean | Std.Dev | Mean.of.Up.Perturbations | Number.of.Up.Perturbations | Mean.of.Down.Perturbations | Number.of.Down.Perturbations | Number.of.Total.Perturbations |
|---|---|---|---|---|---|---|---|
| HIF3A | 0.013 | 0.1 | -10000 | 0 | -0.62 | 13 | 13 |
| oxygen homeostasis | 0 | 0 | -10000 | 0 | -10000 | 0 | 0 |
| TCEB2 | 0.025 | 0.049 | -10000 | 0 | -0.6 | 3 | 3 |
| TCEB1 | 0.028 | 0.007 | -10000 | 0 | -10000 | 0 | 0 |
| HIF1A/p53 | -0.07 | 0.081 | 0.26 | 1 | -0.46 | 15 | 16 |
| HIF1A | -0.078 | 0.083 | -10000 | 0 | -0.49 | 15 | 15 |
| COPS5 | 0.028 | 0.007 | -10000 | 0 | -10000 | 0 | 0 |
| VHL/Elongin B/Elongin C/RBX1/CUL2 | 0.055 | 0.053 | -10000 | 0 | -10000 | 0 | 0 |
| FIH (dimer) | 0.029 | 0.006 | -10000 | 0 | -10000 | 0 | 0 |
| CDKN2A | -0.57 | 0.12 | -10000 | 0 | -0.59 | 489 | 489 |
| ARNT/IPAS | 0.029 | 0.08 | -10000 | 0 | -0.46 | 13 | 13 |
| HIF1AN | 0.029 | 0.006 | -10000 | 0 | -10000 | 0 | 0 |
| GNB2L1 | 0.023 | 0.013 | -10000 | 0 | -10000 | 0 | 0 |
| HIF1A/ARNT | -0.069 | 0.083 | 0.26 | 1 | -0.47 | 15 | 16 |
| CUL2 | 0.03 | 0.004 | -10000 | 0 | -10000 | 0 | 0 |
| OS9 | 0.029 | 0.005 | -10000 | 0 | -10000 | 0 | 0 |
| RACK1/Elongin B/Elongin C | 0.041 | 0.043 | -10000 | 0 | -0.38 | 3 | 3 |
| response to hypoxia | 0 | 0 | -10000 | 0 | -10000 | 0 | 0 |
| HIF1A/Hsp90 | -0.067 | 0.081 | -10000 | 0 | -0.47 | 15 | 15 |
| PHD1-3/OS9 | -0.28 | 0.13 | -10000 | 0 | -0.42 | 21 | 21 |
| HIF1A/RACK1/Elongin B/Elongin C | -0.047 | 0.083 | -10000 | 0 | -0.46 | 13 | 13 |
| VHL | 0.021 | 0.021 | -10000 | 0 | -0.32 | 1 | 1 |
| HSP90AA1 | 0.028 | 0.008 | -10000 | 0 | -10000 | 0 | 0 |
| HIF1A/JAB1 | -0.068 | 0.082 | -10000 | 0 | -0.46 | 15 | 15 |
| EGLN3 | -0.52 | 0.2 | -10000 | 0 | -0.59 | 451 | 451 |
| EGLN2 | 0.03 | 0.004 | -10000 | 0 | -10000 | 0 | 0 |
| EGLN1 | 0.029 | 0.006 | -10000 | 0 | -10000 | 0 | 0 |
| TP53 | 0.029 | 0.005 | -10000 | 0 | -10000 | 0 | 0 |
| VHL/Elongin B/Elongin C/RBX1/CUL2/HIF1A | -0.13 | 0.26 | -10000 | 0 | -0.52 | 142 | 142 |
| ARNT | 0.029 | 0.007 | -10000 | 0 | -10000 | 0 | 0 |
| ARD1A | 0 | 0 | -10000 | 0 | -10000 | 0 | 0 |
| RBX1 | 0.03 | 0.004 | -10000 | 0 | -10000 | 0 | 0 |
| HIF1A/p19ARF | -0.36 | 0.1 | -10000 | 0 | -0.38 | 452 | 452 |
Figure S24. Get High-res Image This plot shows pathway concept perturbations across all samples against a permutation model. The concepts along the x-axis are sorted by lowest to highest mean activity for the real patient samples. Mean inferred activities are plotted along the y-axis as a colored band showing the average level and one standard deviation range. Real samples are shown in red and permuted samples in black.
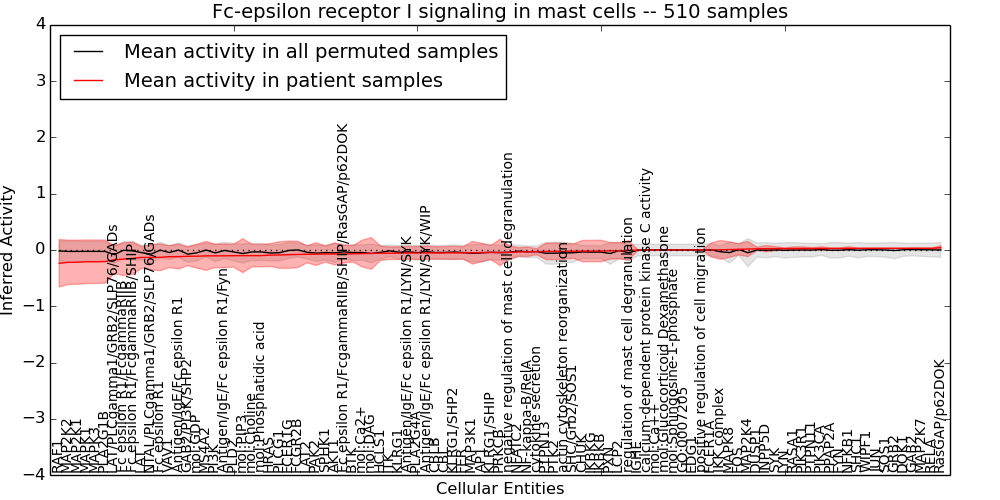
Table S24. Get Full Table This table displays mean, standard deviation, and perturbation statistics for Inferred Pathway Levels (IPLs). A mean perturbation of -9999 implies that the IPLs across all the real samples did not differ enough from the IPLs generated by a background model of permuted samples (> 1 Std.Dev from the permuted sample IPLs).
| Entity | Mean | Std.Dev | Mean.of.Up.Perturbations | Number.of.Up.Perturbations | Mean.of.Down.Perturbations | Number.of.Down.Perturbations | Number.of.Total.Perturbations |
|---|---|---|---|---|---|---|---|
| PPAP2A | 0.028 | 0.009 | -10000 | 0 | -10000 | 0 | 0 |
| LAT2 | -0.076 | 0.15 | -10000 | 0 | -0.43 | 55 | 55 |
| AP1 | -0.045 | 0.16 | -10000 | 0 | -0.47 | 18 | 18 |
| mol:PIP3 | -0.1 | 0.3 | 0.44 | 38 | -0.59 | 85 | 123 |
| IKBKB | -0.017 | 0.19 | 0.34 | 62 | -0.3 | 48 | 110 |
| AKT1 | -0.071 | 0.2 | 0.43 | 13 | -0.52 | 21 | 34 |
| IKBKG | -0.018 | 0.19 | 0.34 | 56 | -0.31 | 36 | 92 |
| MS4A2 | -0.1 | 0.26 | -10000 | 0 | -0.59 | 111 | 111 |
| mol:Sphingosine-1-phosphate | 0 | 0 | -10000 | 0 | -10000 | 0 | 0 |
| PIK3CA | 0.027 | 0.03 | -10000 | 0 | -0.64 | 1 | 1 |
| MAP3K1 | -0.049 | 0.2 | 0.35 | 36 | -0.4 | 60 | 96 |
| mol:Ca2+ | -0.064 | 0.24 | 0.4 | 40 | -0.43 | 83 | 123 |
| LYN | 0.025 | 0.012 | -10000 | 0 | -10000 | 0 | 0 |
| CBLB | -0.051 | 0.11 | -10000 | 0 | -0.34 | 19 | 19 |
| SHC1 | 0.029 | 0.007 | -10000 | 0 | -10000 | 0 | 0 |
| RasGAP/p62DOK | 0.041 | 0.036 | -10000 | 0 | -0.35 | 2 | 2 |
| positive regulation of cell migration | 0 | 0 | -10000 | 0 | -10000 | 0 | 0 |
| INPP5D | 0.024 | 0.055 | -10000 | 0 | -0.59 | 4 | 4 |
| PLD2 | -0.1 | 0.2 | 0.34 | 17 | -0.6 | 20 | 37 |
| PTPN13 | -0.025 | 0.14 | 0.39 | 3 | -0.67 | 9 | 12 |
| PTPN11 | 0.026 | 0.014 | -10000 | 0 | -10000 | 0 | 0 |
| GO:0007205 | 0 | 0 | -10000 | 0 | -10000 | 0 | 0 |
| regulation of mast cell degranulation | -0.006 | 0.17 | 0.43 | 31 | -0.36 | 2 | 33 |
| SYK | 0.024 | 0.036 | -10000 | 0 | -0.49 | 2 | 2 |
| GRB2 | 0.029 | 0.005 | -10000 | 0 | -10000 | 0 | 0 |
| LAT/PLCgamma1/GRB2/SLP76/GADs | -0.17 | 0.25 | -10000 | 0 | -0.58 | 108 | 108 |
| LAT | -0.13 | 0.19 | -10000 | 0 | -0.46 | 92 | 92 |
| PAK2 | -0.072 | 0.2 | 0.35 | 21 | -0.43 | 71 | 92 |
| NFATC2 | -0.035 | 0.076 | -10000 | 0 | -0.58 | 3 | 3 |
| HRAS | -0.09 | 0.2 | 0.31 | 9 | -0.46 | 79 | 88 |
| GAB2 | 0.03 | 0.003 | -10000 | 0 | -10000 | 0 | 0 |
| PLA2G1B | -0.21 | 0.38 | -10000 | 0 | -0.8 | 148 | 148 |
| Fc epsilon R1 | -0.13 | 0.24 | -10000 | 0 | -0.41 | 202 | 202 |
| Antigen/IgE/Fc epsilon R1 | -0.12 | 0.22 | -10000 | 0 | -0.38 | 202 | 202 |
| mol:GDP | -0.11 | 0.21 | 0.26 | 1 | -0.47 | 107 | 108 |
| JUN | 0.029 | 0.006 | -10000 | 0 | -10000 | 0 | 0 |
| mol:Ca++ | 0 | 0 | -10000 | 0 | -10000 | 0 | 0 |
| PIK3R1 | 0.026 | 0.031 | -10000 | 0 | -0.64 | 1 | 1 |
| FOS | 0.012 | 0.1 | -10000 | 0 | -0.63 | 12 | 12 |
| Antigen/IgE/Fc epsilon R1/LYN/SYK | -0.054 | 0.12 | -10000 | 0 | -0.35 | 23 | 23 |
| CHUK | -0.019 | 0.19 | 0.34 | 57 | -0.3 | 48 | 105 |
| KLRG1 | -0.055 | 0.11 | -10000 | 0 | -0.34 | 22 | 22 |
| VAV1 | -0.12 | 0.19 | -10000 | 0 | -0.45 | 101 | 101 |
| calcium-dependent protein kinase C activity | 0 | 0 | -10000 | 0 | -10000 | 0 | 0 |
| CBL | -0.051 | 0.11 | -10000 | 0 | -0.35 | 20 | 20 |
| negative regulation of mast cell degranulation | -0.043 | 0.12 | -10000 | 0 | -0.46 | 8 | 8 |
| BTK | -0.068 | 0.15 | -10000 | 0 | -0.43 | 17 | 17 |
| Fc epsilon R1/FcgammaRIIB/SHIP/RasGAP/p62DOK | -0.071 | 0.16 | -10000 | 0 | -0.36 | 82 | 82 |
| GAB2/PI3K/SHP2 | -0.11 | 0.17 | -10000 | 0 | -0.56 | 22 | 22 |
| Antigen/IgE/Fc epsilon R1/LYN/SYK/WIP | -0.052 | 0.12 | -10000 | 0 | -0.36 | 25 | 25 |
| RAF1 | -0.24 | 0.42 | -10000 | 0 | -0.9 | 148 | 148 |
| Fc epsilon R1/FcgammaRIIB/SHIP | -0.15 | 0.29 | -10000 | 0 | -0.66 | 84 | 84 |
| FCER1G | -0.083 | 0.24 | -10000 | 0 | -0.6 | 93 | 93 |
| FCER1A | 0 | 0.12 | -10000 | 0 | -0.63 | 19 | 19 |
| Antigen/IgE/Fc epsilon R1/Fyn | -0.1 | 0.21 | -10000 | 0 | -0.35 | 198 | 198 |
| MAPK3 | -0.21 | 0.39 | -10000 | 0 | -0.81 | 148 | 148 |
| MAPK1 | -0.21 | 0.39 | -10000 | 0 | -0.81 | 148 | 148 |
| NFKB1 | 0.028 | 0.03 | -10000 | 0 | -0.64 | 1 | 1 |
| MAPK8 | 0.007 | 0.14 | -10000 | 0 | -0.7 | 14 | 14 |
| DUSP1 | 0.021 | 0.03 | -10000 | 0 | -0.59 | 1 | 1 |
| NF-kappa-B/RelA | -0.031 | 0.084 | -10000 | 0 | -0.28 | 1 | 1 |
| actin cytoskeleton reorganization | -0.023 | 0.14 | 0.4 | 3 | -0.67 | 9 | 12 |
| mol:Glucocorticoid Dexamethasone | 0 | 0 | -10000 | 0 | -10000 | 0 | 0 |
| PI3K | -0.1 | 0.21 | 0.26 | 1 | -0.48 | 87 | 88 |
| FER | -0.05 | 0.11 | -10000 | 0 | -0.35 | 21 | 21 |
| RELA | 0.03 | 0.003 | -10000 | 0 | -10000 | 0 | 0 |
| ITK | -0.056 | 0.11 | -10000 | 0 | -0.26 | 82 | 82 |
| SOS1 | 0.029 | 0.005 | -10000 | 0 | -10000 | 0 | 0 |
| PLCG1 | -0.089 | 0.24 | 0.39 | 13 | -0.49 | 92 | 105 |
| cytokine secretion | -0.03 | 0.053 | -10000 | 0 | -10000 | 0 | 0 |
| SPHK1 | -0.071 | 0.14 | -10000 | 0 | -0.45 | 34 | 34 |
| PTK2 | -0.025 | 0.15 | 0.4 | 3 | -0.71 | 9 | 12 |
| NTAL/PLCgamma1/GRB2/SLP76/GADs | -0.13 | 0.22 | -10000 | 0 | -0.56 | 83 | 83 |
| EDG1 | 0 | 0 | -10000 | 0 | -10000 | 0 | 0 |
| mol:DAG | -0.061 | 0.28 | 0.41 | 51 | -0.54 | 72 | 123 |
| MAP2K2 | -0.22 | 0.39 | -10000 | 0 | -0.83 | 148 | 148 |
| MAP2K1 | -0.22 | 0.39 | -10000 | 0 | -0.83 | 148 | 148 |
| MAP2K7 | 0.03 | 0.003 | -10000 | 0 | -10000 | 0 | 0 |
| KLRG1/SHP2 | -0.051 | 0.12 | 0.29 | 2 | -0.34 | 19 | 21 |
| MAP2K4 | 0.017 | 0.14 | -10000 | 0 | -0.81 | 12 | 12 |
| Fc epsilon R1/FcgammaRIIB | -0.16 | 0.29 | -10000 | 0 | -0.47 | 218 | 218 |
| mol:Choline | -0.1 | 0.2 | 0.34 | 17 | -0.59 | 20 | 37 |
| SHC/Grb2/SOS1 | -0.021 | 0.13 | -10000 | 0 | -0.4 | 1 | 1 |
| FYN | 0.028 | 0.008 | -10000 | 0 | -10000 | 0 | 0 |
| DOK1 | 0.029 | 0.005 | -10000 | 0 | -10000 | 0 | 0 |
| PXN | -0.015 | 0.15 | 0.42 | 10 | -0.67 | 8 | 18 |
| HCLS1 | -0.058 | 0.13 | -10000 | 0 | -0.41 | 29 | 29 |
| PRKCB | -0.044 | 0.24 | 0.37 | 57 | -0.41 | 73 | 130 |
| FCGR2B | -0.079 | 0.23 | -10000 | 0 | -0.59 | 89 | 89 |
| IGHE | -0.003 | 0.011 | -10000 | 0 | -10000 | 0 | 0 |
| KLRG1/SHIP | -0.044 | 0.12 | -10000 | 0 | -0.47 | 8 | 8 |
| LCP2 | -0.014 | 0.14 | -10000 | 0 | -0.59 | 30 | 30 |
| PLA2G4A | -0.052 | 0.12 | -10000 | 0 | -0.36 | 20 | 20 |
| RASA1 | 0.025 | 0.031 | -10000 | 0 | -0.64 | 1 | 1 |
| mol:Phosphatidic acid | -0.1 | 0.2 | 0.34 | 17 | -0.59 | 20 | 37 |
| IKK complex | 0.002 | 0.17 | 0.32 | 61 | -0.25 | 3 | 64 |
| WIPF1 | 0.029 | 0.006 | -10000 | 0 | -10000 | 0 | 0 |
Figure S25. Get High-res Image This plot shows pathway concept perturbations across all samples against a permutation model. The concepts along the x-axis are sorted by lowest to highest mean activity for the real patient samples. Mean inferred activities are plotted along the y-axis as a colored band showing the average level and one standard deviation range. Real samples are shown in red and permuted samples in black.
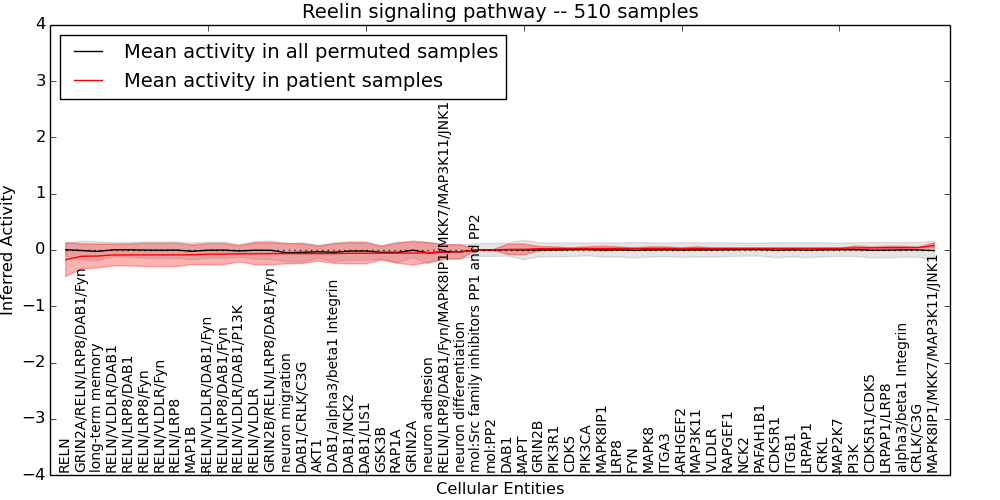
Table S25. Get Full Table This table displays mean, standard deviation, and perturbation statistics for Inferred Pathway Levels (IPLs). A mean perturbation of -9999 implies that the IPLs across all the real samples did not differ enough from the IPLs generated by a background model of permuted samples (> 1 Std.Dev from the permuted sample IPLs).
| Entity | Mean | Std.Dev | Mean.of.Up.Perturbations | Number.of.Up.Perturbations | Mean.of.Down.Perturbations | Number.of.Down.Perturbations | Number.of.Total.Perturbations |
|---|---|---|---|---|---|---|---|
| CDK5R1/CDK5 | 0.039 | 0.015 | -10000 | 0 | -10000 | 0 | 0 |
| VLDLR | 0.029 | 0.007 | -10000 | 0 | -10000 | 0 | 0 |
| CRKL | 0.03 | 0.004 | -10000 | 0 | -10000 | 0 | 0 |
| LRPAP1 | 0.03 | 0.004 | -10000 | 0 | -10000 | 0 | 0 |
| FYN | 0.028 | 0.008 | -10000 | 0 | -10000 | 0 | 0 |
| ITGA3 | 0.028 | 0.028 | -10000 | 0 | -0.59 | 1 | 1 |
| RELN/VLDLR/Fyn | -0.087 | 0.21 | -10000 | 0 | -0.4 | 153 | 153 |
| MAPK8IP1/MKK7/MAP3K11/JNK1 | 0.08 | 0.047 | -10000 | 0 | -0.51 | 2 | 2 |
| AKT1 | -0.064 | 0.13 | -10000 | 0 | -0.38 | 13 | 13 |
| MAP2K7 | 0.03 | 0.003 | -10000 | 0 | -10000 | 0 | 0 |
| RAPGEF1 | 0.029 | 0.006 | -10000 | 0 | -10000 | 0 | 0 |
| DAB1 | 0.011 | 0.093 | -10000 | 0 | -0.59 | 12 | 12 |
| RELN/LRP8/DAB1 | -0.088 | 0.2 | -10000 | 0 | -0.37 | 163 | 163 |
| LRPAP1/LRP8 | 0.042 | 0.023 | -10000 | 0 | -0.43 | 1 | 1 |
| RELN/LRP8/DAB1/Fyn | -0.074 | 0.19 | -10000 | 0 | -0.35 | 162 | 162 |
| DAB1/alpha3/beta1 Integrin | -0.063 | 0.18 | -10000 | 0 | -0.6 | 1 | 1 |
| long-term memory | -0.11 | 0.21 | -10000 | 0 | -0.62 | 19 | 19 |
| DAB1/LIS1 | -0.058 | 0.19 | -10000 | 0 | -0.62 | 1 | 1 |
| DAB1/CRLK/C3G | -0.064 | 0.18 | -10000 | 0 | -0.6 | 1 | 1 |
| PIK3CA | 0.027 | 0.03 | -10000 | 0 | -0.64 | 1 | 1 |
| DAB1/NCK2 | -0.058 | 0.19 | -10000 | 0 | -0.62 | 1 | 1 |
| ARHGEF2 | 0.029 | 0.007 | -10000 | 0 | -10000 | 0 | 0 |
| mol:Src family inhibitors PP1 and PP2 | 0 | 0 | -10000 | 0 | -10000 | 0 | 0 |
| GRIN2A | -0.055 | 0.21 | -10000 | 0 | -0.6 | 68 | 68 |
| CDK5R1 | 0.029 | 0.005 | -10000 | 0 | -10000 | 0 | 0 |
| RELN | -0.17 | 0.3 | -10000 | 0 | -0.63 | 153 | 153 |
| PIK3R1 | 0.026 | 0.031 | -10000 | 0 | -0.64 | 1 | 1 |
| RELN/LRP8/Fyn | -0.087 | 0.21 | -10000 | 0 | -0.4 | 154 | 154 |
| GRIN2A/RELN/LRP8/DAB1/Fyn | -0.11 | 0.22 | -10000 | 0 | -0.39 | 141 | 141 |
| MAPK8 | 0.028 | 0.03 | -10000 | 0 | -0.64 | 1 | 1 |
| RELN/VLDLR/DAB1 | -0.088 | 0.19 | -10000 | 0 | -0.37 | 162 | 162 |
| ITGB1 | 0.03 | 0.004 | -10000 | 0 | -10000 | 0 | 0 |
| MAP1B | -0.086 | 0.18 | -10000 | 0 | -0.35 | 134 | 134 |
| RELN/LRP8 | -0.086 | 0.21 | -10000 | 0 | -0.4 | 154 | 154 |
| GRIN2B/RELN/LRP8/DAB1/Fyn | -0.065 | 0.2 | -10000 | 0 | -0.36 | 130 | 130 |
| PI3K | 0.037 | 0.035 | -10000 | 0 | -0.47 | 2 | 2 |
| mol:PP2 | 0 | 0 | -10000 | 0 | -10000 | 0 | 0 |
| alpha3/beta1 Integrin | 0.042 | 0.023 | -10000 | 0 | -0.43 | 1 | 1 |
| RAP1A | -0.055 | 0.18 | 0.45 | 5 | -0.56 | 1 | 6 |
| PAFAH1B1 | 0.029 | 0.005 | -10000 | 0 | -10000 | 0 | 0 |
| MAPK8IP1 | 0.027 | 0.042 | -10000 | 0 | -0.64 | 2 | 2 |
| CRLK/C3G | 0.043 | 0.01 | -10000 | 0 | -10000 | 0 | 0 |
| GRIN2B | 0.023 | 0.039 | -10000 | 0 | -0.59 | 2 | 2 |
| NCK2 | 0.029 | 0.006 | -10000 | 0 | -10000 | 0 | 0 |
| neuron differentiation | -0.032 | 0.13 | -10000 | 0 | -0.38 | 29 | 29 |
| neuron adhesion | -0.047 | 0.17 | 0.4 | 8 | -0.54 | 1 | 9 |
| LRP8 | 0.028 | 0.028 | -10000 | 0 | -0.59 | 1 | 1 |
| GSK3B | -0.058 | 0.12 | -10000 | 0 | -0.36 | 9 | 9 |
| RELN/VLDLR/DAB1/Fyn | -0.074 | 0.19 | -10000 | 0 | -0.35 | 161 | 161 |
| MAP3K11 | 0.029 | 0.03 | -10000 | 0 | -0.64 | 1 | 1 |
| RELN/VLDLR/DAB1/P13K | -0.068 | 0.14 | -10000 | 0 | -0.29 | 139 | 139 |
| CDK5 | 0.027 | 0.009 | -10000 | 0 | -10000 | 0 | 0 |
| MAPT | 0.011 | 0.098 | 0.71 | 5 | -0.59 | 6 | 11 |
| neuron migration | -0.065 | 0.18 | 0.46 | 4 | -0.52 | 2 | 6 |
| RELN/LRP8/DAB1/Fyn/MAPK8IP1/MKK7/MAP3K11/JNK1 | -0.033 | 0.13 | -10000 | 0 | -0.38 | 29 | 29 |
| RELN/VLDLR | -0.067 | 0.2 | -10000 | 0 | -0.36 | 153 | 153 |
Figure S26. Get High-res Image This plot shows pathway concept perturbations across all samples against a permutation model. The concepts along the x-axis are sorted by lowest to highest mean activity for the real patient samples. Mean inferred activities are plotted along the y-axis as a colored band showing the average level and one standard deviation range. Real samples are shown in red and permuted samples in black.
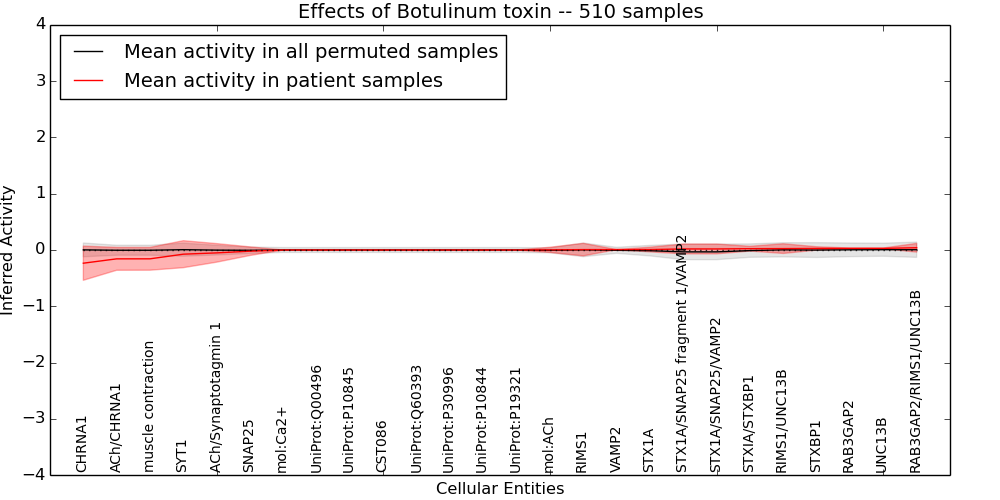
Table S26. Get Full Table This table displays mean, standard deviation, and perturbation statistics for Inferred Pathway Levels (IPLs). A mean perturbation of -9999 implies that the IPLs across all the real samples did not differ enough from the IPLs generated by a background model of permuted samples (> 1 Std.Dev from the permuted sample IPLs).
| Entity | Mean | Std.Dev | Mean.of.Up.Perturbations | Number.of.Up.Perturbations | Mean.of.Down.Perturbations | Number.of.Down.Perturbations | Number.of.Total.Perturbations |
|---|---|---|---|---|---|---|---|
| STX1A | 0.008 | 0.042 | -10000 | 0 | -0.44 | 4 | 4 |
| UniProt:P19321 | 0 | 0 | -10000 | 0 | -10000 | 0 | 0 |
| RIMS1/UNC13B | 0.025 | 0.086 | -10000 | 0 | -0.46 | 15 | 15 |
| STXBP1 | 0.028 | 0.03 | -10000 | 0 | -0.64 | 1 | 1 |
| ACh/CHRNA1 | -0.16 | 0.2 | -10000 | 0 | -0.39 | 217 | 217 |
| RAB3GAP2/RIMS1/UNC13B | 0.04 | 0.078 | -10000 | 0 | -0.39 | 15 | 15 |
| mol:Ca2+ | 0 | 0 | -10000 | 0 | -10000 | 0 | 0 |
| UniProt:P30996 | 0 | 0 | -10000 | 0 | -10000 | 0 | 0 |
| UniProt:Q60393 | 0 | 0 | -10000 | 0 | -10000 | 0 | 0 |
| CST086 | 0 | 0 | -10000 | 0 | -10000 | 0 | 0 |
| RIMS1 | 0.007 | 0.11 | -10000 | 0 | -0.63 | 15 | 15 |
| mol:ACh | 0.003 | 0.046 | 0.1 | 43 | -0.15 | 3 | 46 |
| RAB3GAP2 | 0.029 | 0.006 | -10000 | 0 | -10000 | 0 | 0 |
| STX1A/SNAP25/VAMP2 | 0.019 | 0.087 | -10000 | 0 | -0.4 | 8 | 8 |
| UniProt:P10844 | 0 | 0 | -10000 | 0 | -10000 | 0 | 0 |
| muscle contraction | -0.16 | 0.2 | -10000 | 0 | -0.39 | 217 | 217 |
| UNC13B | 0.029 | 0.006 | -10000 | 0 | -10000 | 0 | 0 |
| CHRNA1 | -0.24 | 0.3 | -10000 | 0 | -0.59 | 217 | 217 |
| UniProt:P10845 | 0 | 0 | -10000 | 0 | -10000 | 0 | 0 |
| ACh/Synaptotagmin 1 | -0.051 | 0.16 | -10000 | 0 | -0.42 | 80 | 80 |
| SNAP25 | -0.021 | 0.077 | 0.12 | 4 | -0.21 | 71 | 75 |
| VAMP2 | 0.007 | 0.001 | -10000 | 0 | -10000 | 0 | 0 |
| SYT1 | -0.074 | 0.24 | -10000 | 0 | -0.63 | 80 | 80 |
| UniProt:Q00496 | 0 | 0 | -10000 | 0 | -10000 | 0 | 0 |
| STXIA/STXBP1 | 0.024 | 0.043 | -10000 | 0 | -0.38 | 5 | 5 |
| STX1A/SNAP25 fragment 1/VAMP2 | 0.019 | 0.087 | -10000 | 0 | -0.4 | 8 | 8 |
Figure S27. Get High-res Image This plot shows pathway concept perturbations across all samples against a permutation model. The concepts along the x-axis are sorted by lowest to highest mean activity for the real patient samples. Mean inferred activities are plotted along the y-axis as a colored band showing the average level and one standard deviation range. Real samples are shown in red and permuted samples in black.
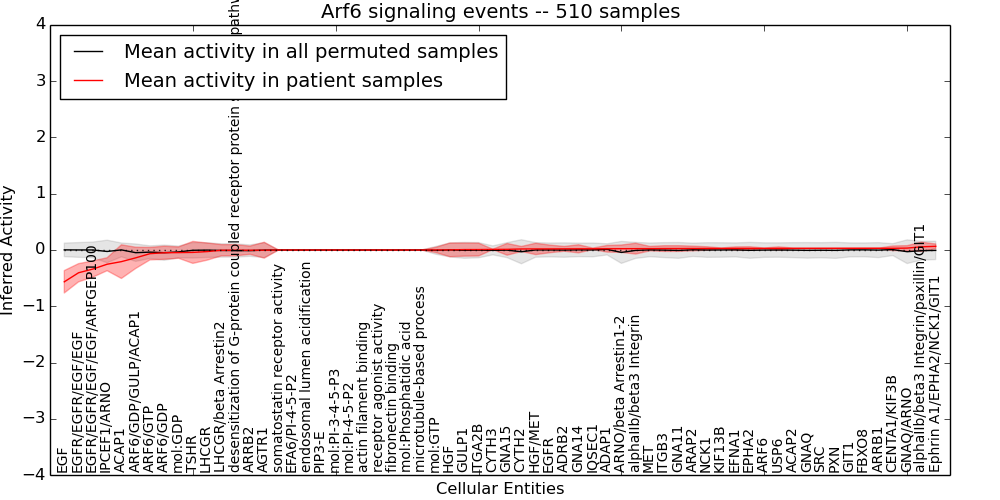
Table S27. Get Full Table This table displays mean, standard deviation, and perturbation statistics for Inferred Pathway Levels (IPLs). A mean perturbation of -9999 implies that the IPLs across all the real samples did not differ enough from the IPLs generated by a background model of permuted samples (> 1 Std.Dev from the permuted sample IPLs).
| Entity | Mean | Std.Dev | Mean.of.Up.Perturbations | Number.of.Up.Perturbations | Mean.of.Down.Perturbations | Number.of.Down.Perturbations | Number.of.Total.Perturbations |
|---|---|---|---|---|---|---|---|
| CENTA1/KIF3B | 0.03 | 0.041 | -10000 | 0 | -0.4 | 4 | 4 |
| ARNO/beta Arrestin1-2 | 0.023 | 0.066 | -10000 | 0 | -0.78 | 1 | 1 |
| EGFR | 0.019 | 0.068 | -10000 | 0 | -0.6 | 6 | 6 |
| EPHA2 | 0.028 | 0.03 | -10000 | 0 | -0.64 | 1 | 1 |
| USP6 | 0.028 | 0.028 | -10000 | 0 | -0.59 | 1 | 1 |
| IQSEC1 | 0.021 | 0.014 | -10000 | 0 | -10000 | 0 | 0 |
| EGFR/EGFR/EGF/EGF | -0.4 | 0.16 | -10000 | 0 | -0.48 | 412 | 412 |
| ARRB2 | -0.004 | 0.073 | -10000 | 0 | -0.26 | 36 | 36 |
| mol:GTP | 0.001 | 0.046 | 0.19 | 6 | -0.18 | 4 | 10 |
| ARRB1 | 0.03 | 0.003 | -10000 | 0 | -10000 | 0 | 0 |
| FBXO8 | 0.03 | 0.004 | -10000 | 0 | -10000 | 0 | 0 |
| TSHR | -0.043 | 0.2 | -10000 | 0 | -0.59 | 58 | 58 |
| EGF | -0.57 | 0.2 | -10000 | 0 | -0.63 | 460 | 460 |
| somatostatin receptor activity | 0 | 0 | 0.001 | 14 | -0.001 | 24 | 38 |
| ARAP2 | 0.027 | 0.042 | -10000 | 0 | -0.64 | 2 | 2 |
| mol:GDP | -0.046 | 0.1 | 0.25 | 5 | -0.34 | 23 | 28 |
| mol:PI-3-4-5-P3 | 0 | 0 | 0.001 | 7 | -0.001 | 10 | 17 |
| ITGA2B | 0.008 | 0.11 | -10000 | 0 | -0.59 | 18 | 18 |
| ARF6 | 0.028 | 0.008 | -10000 | 0 | -10000 | 0 | 0 |
| Ephrin A1/EPHA2/NCK1/GIT1 | 0.065 | 0.042 | -10000 | 0 | -0.37 | 2 | 2 |
| ADAP1 | 0.022 | 0.059 | -10000 | 0 | -0.64 | 4 | 4 |
| KIF13B | 0.027 | 0.009 | -10000 | 0 | -10000 | 0 | 0 |
| HGF/MET | 0.019 | 0.1 | -10000 | 0 | -0.47 | 20 | 20 |
| PXN | 0.029 | 0.006 | -10000 | 0 | -10000 | 0 | 0 |
| ARF6/GTP | -0.065 | 0.11 | 0.29 | 11 | -0.33 | 27 | 38 |
| EGFR/EGFR/EGF/EGF/ARFGEP100 | -0.34 | 0.14 | -10000 | 0 | -0.4 | 409 | 409 |
| ADRB2 | 0.021 | 0.043 | -10000 | 0 | -0.64 | 2 | 2 |
| receptor agonist activity | 0 | 0 | 0 | 20 | 0 | 14 | 34 |
| actin filament binding | 0 | 0 | 0.001 | 19 | -0.001 | 25 | 44 |
| SRC | 0.029 | 0.006 | -10000 | 0 | -10000 | 0 | 0 |
| ITGB3 | 0.026 | 0.051 | -10000 | 0 | -0.64 | 3 | 3 |
| GNAQ | 0.029 | 0.006 | -10000 | 0 | -10000 | 0 | 0 |
| EFA6/PI-4-5-P2 | 0 | 0.001 | 0.002 | 24 | -0.001 | 13 | 37 |
| ARF6/GDP | -0.049 | 0.12 | 0.27 | 5 | -0.42 | 15 | 20 |
| ARF6/GDP/GULP/ACAP1 | -0.14 | 0.19 | 0.27 | 1 | -0.46 | 66 | 67 |
| alphaIIb/beta3 Integrin/paxillin/GIT1 | 0.057 | 0.083 | -10000 | 0 | -0.37 | 4 | 4 |
| ACAP1 | -0.21 | 0.3 | -10000 | 0 | -0.59 | 195 | 195 |
| ACAP2 | 0.029 | 0.007 | -10000 | 0 | -10000 | 0 | 0 |
| LHCGR/beta Arrestin2 | -0.004 | 0.1 | -10000 | 0 | -0.36 | 36 | 36 |
| EFNA1 | 0.027 | 0.028 | -10000 | 0 | -0.59 | 1 | 1 |
| HGF | 0.002 | 0.12 | -10000 | 0 | -0.6 | 20 | 20 |
| CYTH3 | 0.011 | 0.004 | -10000 | 0 | -10000 | 0 | 0 |
| CYTH2 | 0.018 | 0.045 | -10000 | 0 | -0.99 | 1 | 1 |
| NCK1 | 0.027 | 0.03 | -10000 | 0 | -0.64 | 1 | 1 |
| fibronectin binding | 0 | 0 | 0.001 | 29 | -0.001 | 12 | 41 |
| endosomal lumen acidification | 0 | 0 | 0.001 | 3 | -0.001 | 23 | 26 |
| microtubule-based process | 0 | 0 | -10000 | 0 | -0.001 | 1 | 1 |
| GULP1 | 0.007 | 0.12 | -10000 | 0 | -0.62 | 17 | 17 |
| GNAQ/ARNO | 0.034 | 0.044 | -10000 | 0 | -0.92 | 1 | 1 |
| mol:Phosphatidic acid | 0 | 0 | 0 | 4 | -10000 | 0 | 4 |
| PIP3-E | 0 | 0 | 0.001 | 2 | 0 | 1 | 3 |
| MET | 0.024 | 0.04 | -10000 | 0 | -0.59 | 2 | 2 |
| GNA14 | 0.021 | 0.072 | -10000 | 0 | -0.64 | 6 | 6 |
| GNA15 | 0.012 | 0.1 | -10000 | 0 | -0.59 | 15 | 15 |
| GIT1 | 0.029 | 0.005 | -10000 | 0 | -10000 | 0 | 0 |
| mol:PI-4-5-P2 | 0 | 0 | 0.001 | 22 | -0.001 | 13 | 35 |
| GNA11 | 0.026 | 0.051 | -10000 | 0 | -0.64 | 3 | 3 |
| LHCGR | -0.028 | 0.15 | -10000 | 0 | -0.59 | 35 | 35 |
| AGTR1 | -0.003 | 0.14 | -10000 | 0 | -0.62 | 25 | 25 |
| desensitization of G-protein coupled receptor protein signaling pathway | -0.004 | 0.099 | -10000 | 0 | -0.36 | 36 | 36 |
| IPCEF1/ARNO | -0.25 | 0.12 | -10000 | 0 | -0.64 | 6 | 6 |
| alphaIIb/beta3 Integrin | 0.024 | 0.096 | -10000 | 0 | -0.44 | 21 | 21 |
Figure S28. Get High-res Image This plot shows pathway concept perturbations across all samples against a permutation model. The concepts along the x-axis are sorted by lowest to highest mean activity for the real patient samples. Mean inferred activities are plotted along the y-axis as a colored band showing the average level and one standard deviation range. Real samples are shown in red and permuted samples in black.
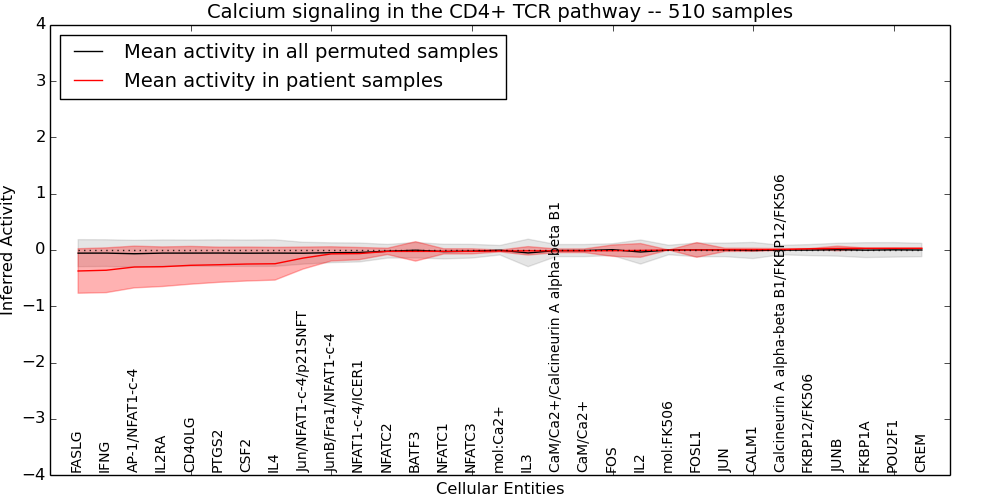
Table S28. Get Full Table This table displays mean, standard deviation, and perturbation statistics for Inferred Pathway Levels (IPLs). A mean perturbation of -9999 implies that the IPLs across all the real samples did not differ enough from the IPLs generated by a background model of permuted samples (> 1 Std.Dev from the permuted sample IPLs).
| Entity | Mean | Std.Dev | Mean.of.Up.Perturbations | Number.of.Up.Perturbations | Mean.of.Down.Perturbations | Number.of.Down.Perturbations | Number.of.Total.Perturbations |
|---|---|---|---|---|---|---|---|
| NFATC1 | -0.024 | 0.046 | -10000 | 0 | -10000 | 0 | 0 |
| NFATC2 | -0.025 | 0.056 | -10000 | 0 | -0.45 | 3 | 3 |
| NFATC3 | -0.024 | 0.045 | -10000 | 0 | -10000 | 0 | 0 |
| CD40LG | -0.27 | 0.34 | 0.42 | 2 | -0.77 | 104 | 106 |
| PTGS2 | -0.26 | 0.31 | 0.42 | 1 | -0.72 | 97 | 98 |
| JUNB | 0.027 | 0.042 | -10000 | 0 | -0.64 | 2 | 2 |
| CaM/Ca2+/Calcineurin A alpha-beta B1 | -0.014 | 0.033 | -10000 | 0 | -10000 | 0 | 0 |
| CaM/Ca2+ | -0.014 | 0.033 | -10000 | 0 | -10000 | 0 | 0 |
| CALM1 | 0.004 | 0.027 | -10000 | 0 | -10000 | 0 | 0 |
| JUN | 0.003 | 0.028 | -10000 | 0 | -10000 | 0 | 0 |
| mol:Ca2+ | -0.017 | 0.016 | -10000 | 0 | -10000 | 0 | 0 |
| Calcineurin A alpha-beta B1/FKBP12/FK506 | 0.009 | 0.015 | -10000 | 0 | -10000 | 0 | 0 |
| FOSL1 | 0.001 | 0.13 | -10000 | 0 | -0.59 | 24 | 24 |
| CREM | 0.029 | 0.004 | -10000 | 0 | -10000 | 0 | 0 |
| Jun/NFAT1-c-4/p21SNFT | -0.14 | 0.2 | -10000 | 0 | -0.59 | 27 | 27 |
| FOS | -0.012 | 0.1 | -10000 | 0 | -0.64 | 12 | 12 |
| IFNG | -0.36 | 0.4 | -10000 | 0 | -0.77 | 218 | 218 |
| AP-1/NFAT1-c-4 | -0.3 | 0.37 | -10000 | 0 | -0.87 | 97 | 97 |
| FASLG | -0.37 | 0.4 | -10000 | 0 | -0.77 | 222 | 222 |
| NFAT1-c-4/ICER1 | -0.064 | 0.11 | -10000 | 0 | -0.47 | 3 | 3 |
| IL2RA | -0.3 | 0.35 | 0.42 | 1 | -0.82 | 109 | 110 |
| FKBP12/FK506 | 0.022 | 0.004 | -10000 | 0 | -10000 | 0 | 0 |
| CSF2 | -0.25 | 0.3 | -10000 | 0 | -0.73 | 90 | 90 |
| JunB/Fra1/NFAT1-c-4 | -0.069 | 0.13 | -10000 | 0 | -0.47 | 8 | 8 |
| IL4 | -0.24 | 0.29 | -10000 | 0 | -0.7 | 88 | 88 |
| IL2 | -0.007 | 0.12 | -10000 | 0 | -0.86 | 7 | 7 |
| IL3 | -0.014 | 0.075 | -10000 | 0 | -0.69 | 1 | 1 |
| FKBP1A | 0.029 | 0.006 | -10000 | 0 | -10000 | 0 | 0 |
| BATF3 | -0.024 | 0.17 | -10000 | 0 | -0.59 | 44 | 44 |
| mol:FK506 | 0 | 0 | -10000 | 0 | -10000 | 0 | 0 |
| POU2F1 | 0.029 | 0.007 | -10000 | 0 | -10000 | 0 | 0 |
Figure S29. Get High-res Image This plot shows pathway concept perturbations across all samples against a permutation model. The concepts along the x-axis are sorted by lowest to highest mean activity for the real patient samples. Mean inferred activities are plotted along the y-axis as a colored band showing the average level and one standard deviation range. Real samples are shown in red and permuted samples in black.
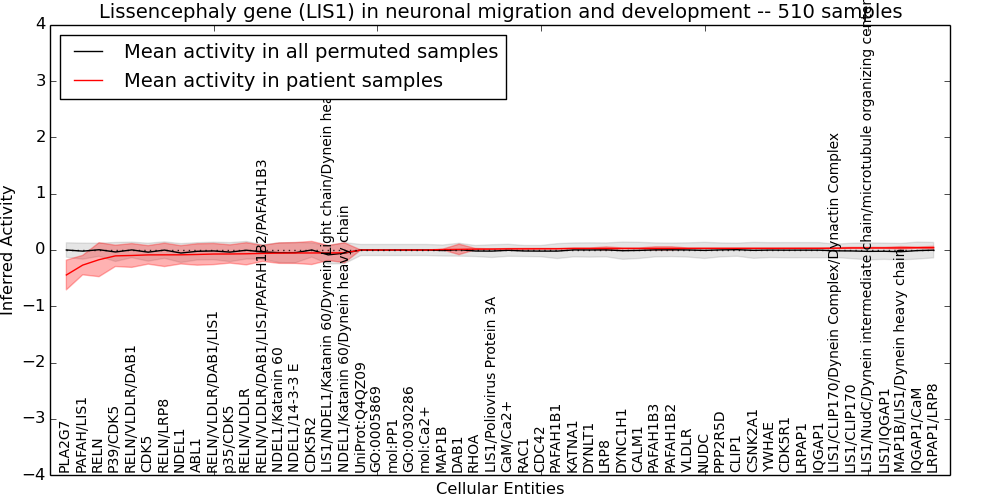
Table S29. Get Full Table This table displays mean, standard deviation, and perturbation statistics for Inferred Pathway Levels (IPLs). A mean perturbation of -9999 implies that the IPLs across all the real samples did not differ enough from the IPLs generated by a background model of permuted samples (> 1 Std.Dev from the permuted sample IPLs).
| Entity | Mean | Std.Dev | Mean.of.Up.Perturbations | Number.of.Up.Perturbations | Mean.of.Down.Perturbations | Number.of.Down.Perturbations | Number.of.Total.Perturbations |
|---|---|---|---|---|---|---|---|
| DYNC1H1 | 0.028 | 0.008 | -10000 | 0 | -10000 | 0 | 0 |
| VLDLR | 0.029 | 0.007 | -10000 | 0 | -10000 | 0 | 0 |
| LRPAP1 | 0.03 | 0.004 | -10000 | 0 | -10000 | 0 | 0 |
| NUDC | 0.029 | 0.006 | -10000 | 0 | -10000 | 0 | 0 |
| RELN/LRP8 | -0.086 | 0.21 | -10000 | 0 | -0.4 | 154 | 154 |
| CaM/Ca2+ | 0.021 | 0.006 | -10000 | 0 | -10000 | 0 | 0 |
| KATNA1 | 0.028 | 0.008 | -10000 | 0 | -10000 | 0 | 0 |
| GO:0030286 | 0 | 0 | -10000 | 0 | -10000 | 0 | 0 |
| ABL1 | -0.08 | 0.19 | -10000 | 0 | -0.36 | 152 | 152 |
| IQGAP1/CaM | 0.041 | 0.012 | -10000 | 0 | -10000 | 0 | 0 |
| DAB1 | 0.011 | 0.093 | -10000 | 0 | -0.59 | 12 | 12 |
| IQGAP1 | 0.03 | 0.004 | -10000 | 0 | -10000 | 0 | 0 |
| PLA2G7 | -0.44 | 0.26 | -10000 | 0 | -0.59 | 389 | 389 |
| CALM1 | 0.028 | 0.008 | -10000 | 0 | -10000 | 0 | 0 |
| DYNLT1 | 0.028 | 0.008 | -10000 | 0 | -10000 | 0 | 0 |
| mol:Ca2+ | 0 | 0 | -10000 | 0 | -10000 | 0 | 0 |
| LRPAP1/LRP8 | 0.042 | 0.023 | -10000 | 0 | -0.43 | 1 | 1 |
| UniProt:Q4QZ09 | 0 | 0 | -10000 | 0 | -10000 | 0 | 0 |
| CLIP1 | 0.029 | 0.006 | -10000 | 0 | -10000 | 0 | 0 |
| CDK5R1 | 0.029 | 0.005 | -10000 | 0 | -10000 | 0 | 0 |
| LIS1/Poliovirus Protein 3A | 0.017 | 0.004 | -10000 | 0 | -10000 | 0 | 0 |
| CDK5R2 | -0.053 | 0.21 | -10000 | 0 | -0.6 | 64 | 64 |
| mol:PP1 | 0 | 0 | -10000 | 0 | -10000 | 0 | 0 |
| RELN/VLDLR/DAB1 | -0.097 | 0.21 | -10000 | 0 | -0.4 | 162 | 162 |
| YWHAE | 0.029 | 0.005 | -10000 | 0 | -10000 | 0 | 0 |
| NDEL1/14-3-3 E | -0.053 | 0.18 | 0.34 | 18 | -0.47 | 13 | 31 |
| MAP1B | 0.008 | 0.008 | -10000 | 0 | -10000 | 0 | 0 |
| RAC1 | 0.021 | 0.008 | -10000 | 0 | -10000 | 0 | 0 |
| p35/CDK5 | -0.071 | 0.16 | -10000 | 0 | -10000 | 0 | 0 |
| RELN | -0.17 | 0.3 | -10000 | 0 | -0.63 | 153 | 153 |
| PAFAH/LIS1 | -0.27 | 0.17 | -10000 | 0 | -0.37 | 376 | 376 |
| LIS1/CLIP170 | 0.037 | 0.011 | -10000 | 0 | -10000 | 0 | 0 |
| LIS1/NDEL1/Katanin 60/Dynein Light chain/Dynein heavy chain | -0.052 | 0.13 | -10000 | 0 | -0.42 | 3 | 3 |
| RELN/VLDLR/DAB1/LIS1/PAFAH1B2/PAFAH1B3 | -0.06 | 0.14 | -10000 | 0 | -0.43 | 12 | 12 |
| GO:0005869 | 0 | 0 | -10000 | 0 | -10000 | 0 | 0 |
| NDEL1 | -0.086 | 0.16 | -10000 | 0 | -0.5 | 14 | 14 |
| LIS1/IQGAP1 | 0.037 | 0.01 | -10000 | 0 | -10000 | 0 | 0 |
| RHOA | 0.016 | 0.011 | -10000 | 0 | -10000 | 0 | 0 |
| PAFAH1B1 | 0.022 | 0.006 | -10000 | 0 | -10000 | 0 | 0 |
| PAFAH1B3 | 0.029 | 0.03 | -10000 | 0 | -0.64 | 1 | 1 |
| PAFAH1B2 | 0.029 | 0.03 | -10000 | 0 | -0.64 | 1 | 1 |
| MAP1B/LIS1/Dynein heavy chain | 0.038 | 0.023 | -10000 | 0 | -10000 | 0 | 0 |
| NDEL1/Katanin 60/Dynein heavy chain | -0.05 | 0.18 | 0.34 | 14 | -0.46 | 9 | 23 |
| LRP8 | 0.028 | 0.028 | -10000 | 0 | -0.59 | 1 | 1 |
| NDEL1/Katanin 60 | -0.056 | 0.18 | 0.33 | 18 | -0.47 | 13 | 31 |
| P39/CDK5 | -0.1 | 0.19 | -10000 | 0 | -0.6 | 16 | 16 |
| LIS1/NudC/Dynein intermediate chain/microtubule organizing center | 0.037 | 0.011 | -10000 | 0 | -10000 | 0 | 0 |
| CDK5 | -0.087 | 0.16 | -10000 | 0 | -10000 | 0 | 0 |
| PPP2R5D | 0.029 | 0.006 | -10000 | 0 | -10000 | 0 | 0 |
| LIS1/CLIP170/Dynein Complex/Dynactin Complex | 0.032 | 0.01 | -10000 | 0 | -10000 | 0 | 0 |
| CSNK2A1 | 0.029 | 0.006 | -10000 | 0 | -10000 | 0 | 0 |
| RELN/VLDLR/DAB1/LIS1 | -0.072 | 0.19 | -10000 | 0 | -0.35 | 141 | 141 |
| RELN/VLDLR | -0.067 | 0.2 | -10000 | 0 | -0.36 | 153 | 153 |
| CDC42 | 0.022 | 0.007 | -10000 | 0 | -10000 | 0 | 0 |
Figure S30. Get High-res Image This plot shows pathway concept perturbations across all samples against a permutation model. The concepts along the x-axis are sorted by lowest to highest mean activity for the real patient samples. Mean inferred activities are plotted along the y-axis as a colored band showing the average level and one standard deviation range. Real samples are shown in red and permuted samples in black.
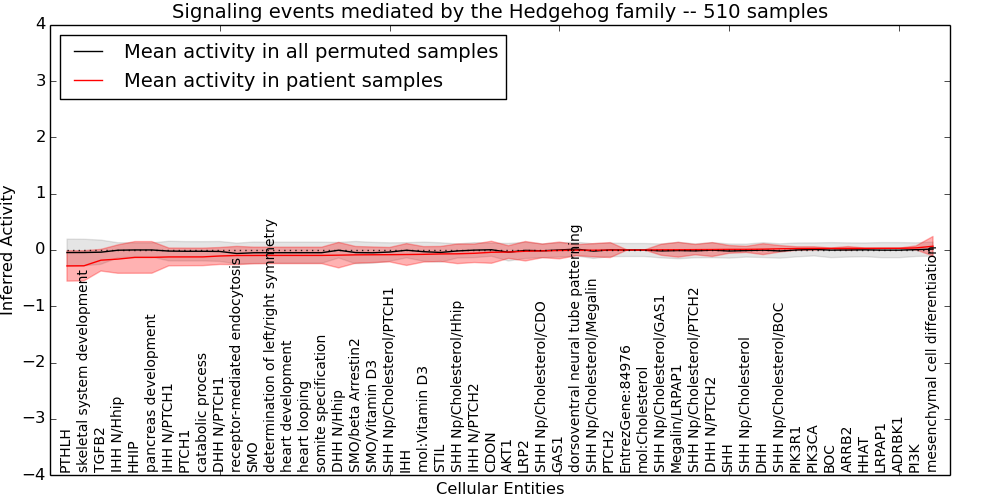
Table S30. Get Full Table This table displays mean, standard deviation, and perturbation statistics for Inferred Pathway Levels (IPLs). A mean perturbation of -9999 implies that the IPLs across all the real samples did not differ enough from the IPLs generated by a background model of permuted samples (> 1 Std.Dev from the permuted sample IPLs).
| Entity | Mean | Std.Dev | Mean.of.Up.Perturbations | Number.of.Up.Perturbations | Mean.of.Down.Perturbations | Number.of.Down.Perturbations | Number.of.Total.Perturbations |
|---|---|---|---|---|---|---|---|
| TGFB2 | -0.18 | 0.19 | -10000 | 0 | -0.58 | 32 | 32 |
| IHH | -0.08 | 0.19 | -10000 | 0 | -0.69 | 44 | 44 |
| SHH Np/Cholesterol/GAS1 | 0.004 | 0.098 | -10000 | 0 | -0.37 | 29 | 29 |
| LRPAP1 | 0.03 | 0.004 | -10000 | 0 | -10000 | 0 | 0 |
| dorsoventral neural tube patterning | -0.004 | 0.097 | 0.37 | 29 | -10000 | 0 | 29 |
| SMO/beta Arrestin2 | -0.086 | 0.15 | -10000 | 0 | -0.52 | 26 | 26 |
| SMO | -0.097 | 0.15 | -10000 | 0 | -0.54 | 25 | 25 |
| AKT1 | -0.037 | 0.11 | -10000 | 0 | -0.51 | 14 | 14 |
| ARRB2 | 0.028 | 0.033 | -10000 | 0 | -0.71 | 1 | 1 |
| BOC | 0.028 | 0.008 | -10000 | 0 | -10000 | 0 | 0 |
| ADRBK1 | 0.03 | 0.003 | -10000 | 0 | -10000 | 0 | 0 |
| heart looping | -0.096 | 0.15 | -10000 | 0 | -0.53 | 25 | 25 |
| STIL | -0.07 | 0.13 | -10000 | 0 | -0.43 | 27 | 27 |
| DHH N/PTCH2 | 0.008 | 0.12 | -10000 | 0 | -0.44 | 35 | 35 |
| DHH N/PTCH1 | -0.11 | 0.15 | -10000 | 0 | -0.49 | 35 | 35 |
| PIK3CA | 0.027 | 0.03 | -10000 | 0 | -0.64 | 1 | 1 |
| DHH | 0.015 | 0.097 | -10000 | 0 | -0.64 | 11 | 11 |
| PTHLH | -0.28 | 0.27 | -10000 | 0 | -0.8 | 39 | 39 |
| determination of left/right symmetry | -0.096 | 0.15 | -10000 | 0 | -0.53 | 25 | 25 |
| PIK3R1 | 0.026 | 0.031 | -10000 | 0 | -0.64 | 1 | 1 |
| skeletal system development | -0.28 | 0.27 | -10000 | 0 | -0.79 | 39 | 39 |
| IHH N/Hhip | -0.16 | 0.25 | -10000 | 0 | -0.53 | 153 | 153 |
| DHH N/Hhip | -0.092 | 0.23 | -10000 | 0 | -0.48 | 129 | 129 |
| mol:Cholesterol | 0 | 0 | -10000 | 0 | -10000 | 0 | 0 |
| heart development | -0.096 | 0.15 | -10000 | 0 | -0.53 | 25 | 25 |
| pancreas development | -0.13 | 0.28 | -10000 | 0 | -0.62 | 126 | 126 |
| HHAT | 0.029 | 0.006 | -10000 | 0 | -10000 | 0 | 0 |
| PI3K | 0.037 | 0.035 | -10000 | 0 | -0.47 | 2 | 2 |
| EntrezGene:84976 | 0 | 0 | -10000 | 0 | -10000 | 0 | 0 |
| GAS1 | -0.008 | 0.15 | -10000 | 0 | -0.58 | 31 | 31 |
| somite specification | -0.096 | 0.15 | -10000 | 0 | -0.53 | 25 | 25 |
| SHH Np/Cholesterol/PTCH1 | -0.083 | 0.13 | -10000 | 0 | -0.44 | 28 | 28 |
| SHH Np/Cholesterol/PTCH2 | 0.007 | 0.092 | -10000 | 0 | -0.34 | 31 | 31 |
| SHH Np/Cholesterol/Megalin | -0.004 | 0.12 | -10000 | 0 | -0.41 | 35 | 35 |
| SHH | 0.011 | 0.069 | -10000 | 0 | -0.47 | 10 | 10 |
| catabolic process | -0.12 | 0.16 | -10000 | 0 | -0.52 | 32 | 32 |
| SMO/Vitamin D3 | -0.085 | 0.14 | -10000 | 0 | -0.48 | 27 | 27 |
| SHH Np/Cholesterol/Hhip | -0.067 | 0.18 | -10000 | 0 | -0.38 | 112 | 112 |
| LRP2 | -0.022 | 0.17 | -10000 | 0 | -0.59 | 42 | 42 |
| receptor-mediated endocytosis | -0.098 | 0.16 | -10000 | 0 | -0.65 | 17 | 17 |
| SHH Np/Cholesterol/BOC | 0.022 | 0.057 | -10000 | 0 | -0.36 | 10 | 10 |
| SHH Np/Cholesterol/CDO | -0.015 | 0.12 | -10000 | 0 | -0.34 | 60 | 60 |
| mesenchymal cell differentiation | 0.067 | 0.17 | 0.38 | 112 | -10000 | 0 | 112 |
| mol:Vitamin D3 | -0.077 | 0.14 | -10000 | 0 | -0.44 | 28 | 28 |
| IHH N/PTCH2 | -0.058 | 0.16 | -10000 | 0 | -0.46 | 67 | 67 |
| CDON | -0.04 | 0.2 | -10000 | 0 | -0.59 | 58 | 58 |
| IHH N/PTCH1 | -0.12 | 0.16 | -10000 | 0 | -0.53 | 32 | 32 |
| Megalin/LRPAP1 | 0.004 | 0.13 | -10000 | 0 | -0.47 | 34 | 34 |
| PTCH2 | -0.001 | 0.13 | -10000 | 0 | -0.59 | 25 | 25 |
| SHH Np/Cholesterol | 0.011 | 0.054 | -10000 | 0 | -0.37 | 10 | 10 |
| PTCH1 | -0.12 | 0.16 | -10000 | 0 | -0.52 | 32 | 32 |
| HHIP | -0.13 | 0.28 | -10000 | 0 | -0.62 | 126 | 126 |
Figure S31. Get High-res Image This plot shows pathway concept perturbations across all samples against a permutation model. The concepts along the x-axis are sorted by lowest to highest mean activity for the real patient samples. Mean inferred activities are plotted along the y-axis as a colored band showing the average level and one standard deviation range. Real samples are shown in red and permuted samples in black.
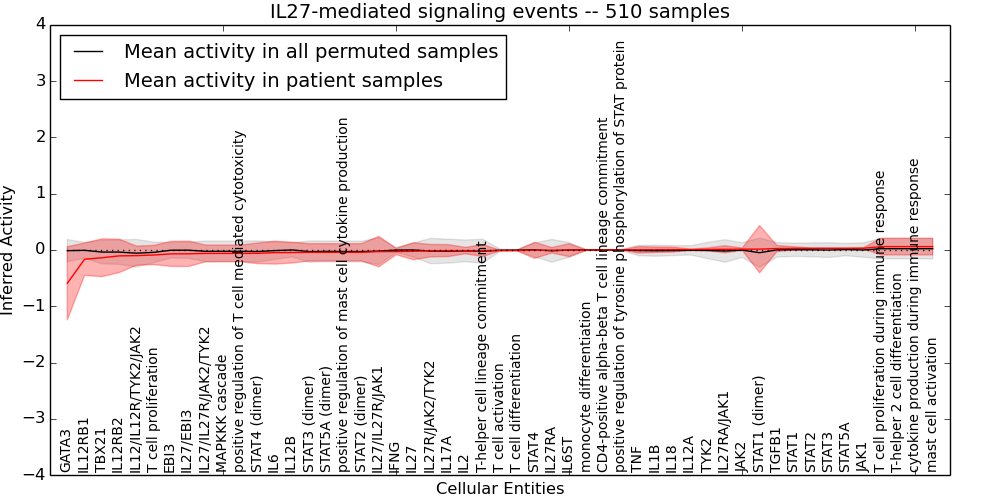
Table S31. Get Full Table This table displays mean, standard deviation, and perturbation statistics for Inferred Pathway Levels (IPLs). A mean perturbation of -9999 implies that the IPLs across all the real samples did not differ enough from the IPLs generated by a background model of permuted samples (> 1 Std.Dev from the permuted sample IPLs).
| Entity | Mean | Std.Dev | Mean.of.Up.Perturbations | Number.of.Up.Perturbations | Mean.of.Down.Perturbations | Number.of.Down.Perturbations | Number.of.Total.Perturbations |
|---|---|---|---|---|---|---|---|
| TGFB1 | 0.026 | 0.055 | -10000 | 0 | -0.59 | 4 | 4 |
| CD4-positive alpha-beta T cell lineage commitment | 0 | 0.001 | -10000 | 0 | -10000 | 0 | 0 |
| cytokine production during immune response | 0.06 | 0.15 | 0.44 | 27 | -0.35 | 1 | 28 |
| IL27/IL27R/JAK1 | -0.028 | 0.27 | 0.67 | 3 | -0.68 | 30 | 33 |
| TBX21 | -0.14 | 0.34 | 0.57 | 9 | -0.63 | 111 | 120 |
| IL12B | -0.045 | 0.18 | -10000 | 0 | -0.59 | 52 | 52 |
| IL12A | 0.007 | 0.01 | 0.17 | 1 | -10000 | 0 | 1 |
| IL6ST | -0.003 | 0.12 | -10000 | 0 | -0.63 | 16 | 16 |
| IL27RA/JAK1 | 0.013 | 0.064 | -10000 | 0 | -0.43 | 1 | 1 |
| IL27 | -0.023 | 0.15 | -10000 | 0 | -0.6 | 32 | 32 |
| TYK2 | 0.011 | 0.026 | -10000 | 0 | -10000 | 0 | 0 |
| T-helper cell lineage commitment | -0.01 | 0.11 | -10000 | 0 | -0.46 | 2 | 2 |
| T-helper 2 cell differentiation | 0.06 | 0.15 | 0.44 | 27 | -0.35 | 1 | 28 |
| T cell proliferation during immune response | 0.06 | 0.15 | 0.44 | 27 | -0.35 | 1 | 28 |
| MAPKKK cascade | -0.06 | 0.15 | 0.35 | 1 | -0.44 | 27 | 28 |
| STAT3 | 0.03 | 0.005 | -10000 | 0 | -10000 | 0 | 0 |
| STAT2 | 0.029 | 0.005 | -10000 | 0 | -10000 | 0 | 0 |
| STAT1 | 0.029 | 0.029 | -10000 | 0 | -0.59 | 1 | 1 |
| IL12RB1 | -0.16 | 0.29 | -10000 | 0 | -0.59 | 158 | 158 |
| positive regulation of tyrosine phosphorylation of STAT protein | 0 | 0 | -10000 | 0 | -10000 | 0 | 0 |
| IL12RB2 | -0.1 | 0.3 | 0.59 | 8 | -0.6 | 65 | 73 |
| IL27/IL27R/JAK2/TYK2 | -0.061 | 0.15 | 0.35 | 1 | -0.45 | 27 | 28 |
| positive regulation of T cell mediated cytotoxicity | -0.06 | 0.15 | 0.35 | 1 | -0.44 | 27 | 28 |
| STAT1 (dimer) | 0.015 | 0.42 | 0.54 | 102 | -0.74 | 57 | 159 |
| JAK2 | 0.015 | 0.021 | -10000 | 0 | -10000 | 0 | 0 |
| JAK1 | 0.031 | 0.009 | -10000 | 0 | -10000 | 0 | 0 |
| STAT2 (dimer) | -0.041 | 0.15 | 0.39 | 2 | -0.44 | 17 | 19 |
| T cell proliferation | -0.089 | 0.17 | -10000 | 0 | -0.52 | 31 | 31 |
| IL12/IL12R/TYK2/JAK2 | -0.1 | 0.17 | -10000 | 0 | -0.8 | 3 | 3 |
| IL17A | -0.011 | 0.11 | -10000 | 0 | -0.47 | 2 | 2 |
| mast cell activation | 0.06 | 0.15 | 0.44 | 27 | -0.35 | 1 | 28 |
| IFNG | -0.028 | 0.056 | 0.14 | 4 | -0.097 | 66 | 70 |
| T cell differentiation | -0.008 | 0.01 | 0.019 | 4 | -0.023 | 128 | 132 |
| STAT3 (dimer) | -0.042 | 0.15 | 0.39 | 2 | -0.47 | 10 | 12 |
| STAT5A (dimer) | -0.042 | 0.15 | 0.39 | 2 | -0.43 | 24 | 26 |
| STAT4 (dimer) | -0.059 | 0.18 | 0.39 | 2 | -0.55 | 29 | 31 |
| STAT4 | -0.006 | 0.14 | -10000 | 0 | -0.59 | 29 | 29 |
| T cell activation | -0.009 | 0.006 | 0.07 | 1 | -10000 | 0 | 1 |
| IL27R/JAK2/TYK2 | -0.012 | 0.11 | -10000 | 0 | -0.48 | 2 | 2 |
| GATA3 | -0.59 | 0.65 | 0.5 | 1 | -1.3 | 245 | 246 |
| IL18 | 0.007 | 0.045 | 0.17 | 1 | -0.43 | 5 | 6 |
| positive regulation of mast cell cytokine production | -0.041 | 0.15 | 0.38 | 2 | -0.46 | 10 | 12 |
| IL27/EBI3 | -0.068 | 0.23 | -10000 | 0 | -0.55 | 85 | 85 |
| IL27RA | -0.004 | 0.049 | -10000 | 0 | -0.47 | 1 | 1 |
| IL6 | -0.047 | 0.2 | -10000 | 0 | -0.6 | 60 | 60 |
| STAT5A | 0.03 | 0.005 | -10000 | 0 | -10000 | 0 | 0 |
| monocyte differentiation | -0.002 | 0.003 | -10000 | 0 | -10000 | 0 | 0 |
| IL2 | -0.01 | 0.057 | -10000 | 0 | -0.4 | 1 | 1 |
| IL1B | 0.005 | 0.049 | -10000 | 0 | -0.44 | 6 | 6 |
| EBI3 | -0.069 | 0.22 | -10000 | 0 | -0.6 | 75 | 75 |
| TNF | 0.003 | 0.058 | -10000 | 0 | -0.46 | 8 | 8 |
Figure S32. Get High-res Image This plot shows pathway concept perturbations across all samples against a permutation model. The concepts along the x-axis are sorted by lowest to highest mean activity for the real patient samples. Mean inferred activities are plotted along the y-axis as a colored band showing the average level and one standard deviation range. Real samples are shown in red and permuted samples in black.
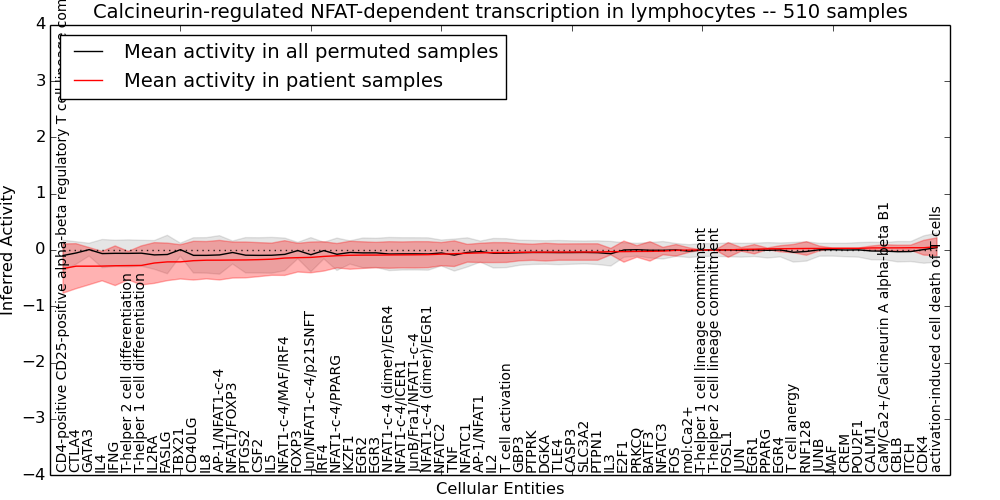
Table S32. Get Full Table This table displays mean, standard deviation, and perturbation statistics for Inferred Pathway Levels (IPLs). A mean perturbation of -9999 implies that the IPLs across all the real samples did not differ enough from the IPLs generated by a background model of permuted samples (> 1 Std.Dev from the permuted sample IPLs).
| Entity | Mean | Std.Dev | Mean.of.Up.Perturbations | Number.of.Up.Perturbations | Mean.of.Down.Perturbations | Number.of.Down.Perturbations | Number.of.Total.Perturbations |
|---|---|---|---|---|---|---|---|
| FOXP3 | -0.14 | 0.26 | -10000 | 0 | -0.73 | 69 | 69 |
| NFATC2 | -0.074 | 0.21 | -10000 | 0 | -0.72 | 11 | 11 |
| NFATC3 | -0.019 | 0.066 | -10000 | 0 | -0.34 | 1 | 1 |
| CD40LG | -0.19 | 0.34 | -10000 | 0 | -0.92 | 52 | 52 |
| ITCH | 0.041 | 0.046 | -10000 | 0 | -10000 | 0 | 0 |
| CBLB | 0.038 | 0.048 | -10000 | 0 | -10000 | 0 | 0 |
| CD4-positive CD25-positive alpha-beta regulatory T cell lineage commitment | -0.33 | 0.44 | -10000 | 0 | -0.98 | 114 | 114 |
| JUNB | 0.027 | 0.042 | -10000 | 0 | -0.64 | 2 | 2 |
| CaM/Ca2+/Calcineurin A alpha-beta B1 | 0.038 | 0.056 | -10000 | 0 | -10000 | 0 | 0 |
| T cell anergy | 0.025 | 0.073 | -10000 | 0 | -0.45 | 5 | 5 |
| TLE4 | -0.037 | 0.14 | -10000 | 0 | -0.57 | 7 | 7 |
| Jun/NFAT1-c-4/p21SNFT | -0.13 | 0.27 | -10000 | 0 | -0.88 | 17 | 17 |
| AP-1/NFAT1-c-4 | -0.18 | 0.35 | -10000 | 0 | -1 | 26 | 26 |
| IKZF1 | -0.093 | 0.25 | -10000 | 0 | -0.62 | 86 | 86 |
| T-helper 2 cell differentiation | -0.28 | 0.25 | 0.5 | 2 | -0.66 | 75 | 77 |
| AP-1/NFAT1 | -0.051 | 0.17 | -10000 | 0 | -0.54 | 14 | 14 |
| CALM1 | 0.037 | 0.035 | -10000 | 0 | -10000 | 0 | 0 |
| EGR2 | -0.091 | 0.24 | -10000 | 0 | -1.3 | 8 | 8 |
| EGR3 | -0.09 | 0.23 | -10000 | 0 | -1.2 | 9 | 9 |
| NFAT1/FOXP3 | -0.18 | 0.32 | -10000 | 0 | -0.72 | 99 | 99 |
| EGR1 | 0.014 | 0.083 | -10000 | 0 | -0.63 | 8 | 8 |
| JUN | 0.011 | 0.032 | -10000 | 0 | -10000 | 0 | 0 |
| EGR4 | 0.022 | 0.055 | -10000 | 0 | -0.58 | 4 | 4 |
| mol:Ca2+ | -0.001 | 0.04 | -10000 | 0 | -0.33 | 3 | 3 |
| GBP3 | -0.04 | 0.15 | -10000 | 0 | -0.62 | 9 | 9 |
| FOSL1 | 0.001 | 0.13 | -10000 | 0 | -0.59 | 24 | 24 |
| NFAT1-c-4/MAF/IRF4 | -0.14 | 0.31 | -10000 | 0 | -0.8 | 28 | 28 |
| DGKA | -0.038 | 0.16 | -10000 | 0 | -0.7 | 9 | 9 |
| CREM | 0.029 | 0.004 | -10000 | 0 | -10000 | 0 | 0 |
| NFAT1-c-4/PPARG | -0.1 | 0.22 | -10000 | 0 | -0.9 | 9 | 9 |
| CTLA4 | -0.29 | 0.4 | -10000 | 0 | -0.7 | 226 | 226 |
| NFAT1-c-4 (dimer)/EGR1 | -0.083 | 0.23 | -10000 | 0 | -0.94 | 10 | 10 |
| NFAT1-c-4 (dimer)/EGR4 | -0.088 | 0.24 | -10000 | 0 | -0.94 | 9 | 9 |
| FOS | -0.005 | 0.1 | -10000 | 0 | -0.63 | 12 | 12 |
| IFNG | -0.28 | 0.35 | -10000 | 0 | -0.73 | 153 | 153 |
| T cell activation | -0.045 | 0.18 | 0.47 | 1 | -0.66 | 12 | 13 |
| MAF | 0.029 | 0.006 | -10000 | 0 | -10000 | 0 | 0 |
| T-helper 2 cell lineage commitment | 0 | 0 | -10000 | 0 | -10000 | 0 | 0 |
| activation-induced cell death of T cells | 0.058 | 0.16 | 0.79 | 5 | -10000 | 0 | 5 |
| TNF | -0.066 | 0.23 | -10000 | 0 | -0.99 | 8 | 8 |
| FASLG | -0.21 | 0.33 | -10000 | 0 | -1.2 | 11 | 11 |
| TBX21 | -0.21 | 0.3 | -10000 | 0 | -0.64 | 167 | 167 |
| BATF3 | -0.024 | 0.17 | -10000 | 0 | -0.59 | 44 | 44 |
| PRKCQ | -0.025 | 0.1 | -10000 | 0 | -0.57 | 14 | 14 |
| PTPN1 | -0.036 | 0.15 | -10000 | 0 | -0.57 | 7 | 7 |
| NFAT1-c-4/ICER1 | -0.087 | 0.23 | -10000 | 0 | -0.9 | 9 | 9 |
| GATA3 | -0.29 | 0.33 | -10000 | 0 | -0.63 | 245 | 245 |
| T-helper 1 cell differentiation | -0.28 | 0.35 | -10000 | 0 | -0.72 | 153 | 153 |
| IL2RA | -0.23 | 0.36 | -10000 | 0 | -0.88 | 83 | 83 |
| T-helper 1 cell lineage commitment | 0 | 0 | -10000 | 0 | -10000 | 0 | 0 |
| CASP3 | -0.036 | 0.15 | -10000 | 0 | -0.55 | 9 | 9 |
| E2F1 | -0.029 | 0.19 | -10000 | 0 | -0.58 | 53 | 53 |
| PPARG | 0.021 | 0.014 | -10000 | 0 | -10000 | 0 | 0 |
| SLC3A2 | -0.036 | 0.15 | -10000 | 0 | -0.55 | 9 | 9 |
| IRF4 | -0.11 | 0.26 | -10000 | 0 | -0.59 | 118 | 118 |
| PTGS2 | -0.18 | 0.32 | -10000 | 0 | -0.93 | 31 | 31 |
| CSF2 | -0.17 | 0.3 | -10000 | 0 | -0.98 | 25 | 25 |
| JunB/Fra1/NFAT1-c-4 | -0.085 | 0.23 | -10000 | 0 | -0.9 | 8 | 8 |
| IL4 | -0.29 | 0.26 | 0.5 | 2 | -0.69 | 72 | 74 |
| IL5 | -0.16 | 0.29 | -10000 | 0 | -0.93 | 20 | 20 |
| IL2 | -0.046 | 0.18 | 0.47 | 1 | -0.67 | 12 | 13 |
| IL3 | -0.029 | 0.057 | -10000 | 0 | -0.9 | 1 | 1 |
| RNF128 | 0.027 | 0.12 | -10000 | 0 | -0.63 | 16 | 16 |
| NFATC1 | -0.058 | 0.16 | -10000 | 0 | -0.79 | 5 | 5 |
| CDK4 | 0.041 | 0.13 | 0.53 | 2 | -10000 | 0 | 2 |
| PTPRK | -0.04 | 0.14 | -10000 | 0 | -0.57 | 7 | 7 |
| IL8 | -0.18 | 0.33 | -10000 | 0 | -0.98 | 32 | 32 |
| POU2F1 | 0.029 | 0.007 | -10000 | 0 | -10000 | 0 | 0 |
Figure S33. Get High-res Image This plot shows pathway concept perturbations across all samples against a permutation model. The concepts along the x-axis are sorted by lowest to highest mean activity for the real patient samples. Mean inferred activities are plotted along the y-axis as a colored band showing the average level and one standard deviation range. Real samples are shown in red and permuted samples in black.
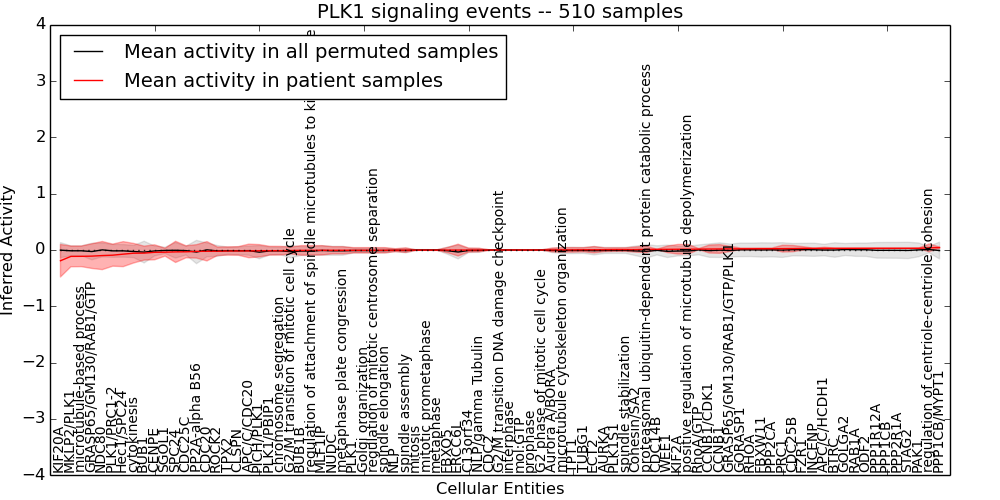
Table S33. Get Full Table This table displays mean, standard deviation, and perturbation statistics for Inferred Pathway Levels (IPLs). A mean perturbation of -9999 implies that the IPLs across all the real samples did not differ enough from the IPLs generated by a background model of permuted samples (> 1 Std.Dev from the permuted sample IPLs).
| Entity | Mean | Std.Dev | Mean.of.Up.Perturbations | Number.of.Up.Perturbations | Mean.of.Down.Perturbations | Number.of.Down.Perturbations | Number.of.Total.Perturbations |
|---|---|---|---|---|---|---|---|
| regulation of centriole-centriole cohesion | 0.039 | 0.07 | 0.14 | 128 | -0.14 | 2 | 130 |
| BUB1B | -0.007 | 0.085 | 0.2 | 8 | -0.3 | 27 | 35 |
| PLK1 | -0.005 | 0.047 | 0.15 | 10 | -0.15 | 10 | 20 |
| PLK1S1 | 0.007 | 0.031 | 0.15 | 9 | -0.2 | 1 | 10 |
| KIF2A | 0.013 | 0.085 | 0.25 | 40 | -0.33 | 4 | 44 |
| regulation of mitotic centrosome separation | -0.005 | 0.047 | 0.15 | 10 | -0.15 | 10 | 20 |
| GOLGA2 | 0.029 | 0.006 | -10000 | 0 | -10000 | 0 | 0 |
| Hec1/SPC24 | -0.074 | 0.22 | -10000 | 0 | -0.45 | 119 | 119 |
| WEE1 | 0.012 | 0.059 | 0.23 | 4 | -0.85 | 1 | 5 |
| cytokinesis | -0.057 | 0.17 | 0.25 | 13 | -0.29 | 147 | 160 |
| PP2A-alpha B56 | -0.025 | 0.12 | -10000 | 0 | -0.6 | 7 | 7 |
| AURKA | 0.005 | 0.033 | 0.14 | 6 | -0.17 | 5 | 11 |
| PICH/PLK1 | -0.014 | 0.11 | -10000 | 0 | -0.53 | 17 | 17 |
| CENPE | -0.041 | 0.13 | 0.27 | 3 | -0.39 | 60 | 63 |
| RhoA/GTP | 0.016 | 0.01 | -10000 | 0 | -10000 | 0 | 0 |
| positive regulation of microtubule depolymerization | 0.013 | 0.085 | 0.25 | 40 | -0.32 | 4 | 44 |
| PPP2CA | 0.023 | 0.013 | -10000 | 0 | -10000 | 0 | 0 |
| FZR1 | 0.029 | 0.03 | -10000 | 0 | -0.64 | 1 | 1 |
| TPX2 | -0.018 | 0.074 | 0.17 | 8 | -0.16 | 90 | 98 |
| PAK1 | 0.03 | 0.003 | -10000 | 0 | -10000 | 0 | 0 |
| SPC24 | -0.034 | 0.19 | -10000 | 0 | -0.59 | 52 | 52 |
| FBXW11 | 0.023 | 0.013 | -10000 | 0 | -10000 | 0 | 0 |
| CLSPN | -0.017 | 0.076 | 0.16 | 1 | -0.2 | 59 | 60 |
| GORASP1 | 0.021 | 0.014 | -10000 | 0 | -10000 | 0 | 0 |
| metaphase | -0.002 | 0.006 | 0.017 | 20 | -0.011 | 101 | 121 |
| mol:GTP | 0 | 0 | -10000 | 0 | -10000 | 0 | 0 |
| NLP | -0.003 | 0.026 | 0.085 | 11 | -0.075 | 11 | 22 |
| G2 phase of mitotic cell cycle | 0 | 0.003 | 0.017 | 4 | -0.011 | 3 | 7 |
| STAG2 | 0.03 | 0.003 | -10000 | 0 | -10000 | 0 | 0 |
| GRASP65/GM130/RAB1/GTP | -0.11 | 0.22 | -10000 | 0 | -0.45 | 143 | 143 |
| spindle elongation | -0.005 | 0.047 | 0.15 | 10 | -0.15 | 10 | 20 |
| ODF2 | 0.029 | 0.006 | -10000 | 0 | -10000 | 0 | 0 |
| BUB1 | -0.055 | 0.12 | -10000 | 0 | -0.66 | 7 | 7 |
| TPT1 | 0.002 | 0.04 | 0.15 | 4 | -0.2 | 11 | 15 |
| CDC25C | -0.032 | 0.11 | 0.17 | 7 | -0.19 | 96 | 103 |
| CDC25B | 0.025 | 0.056 | -10000 | 0 | -0.6 | 4 | 4 |
| SGOL1 | -0.039 | 0.07 | 0.14 | 2 | -0.14 | 128 | 130 |
| RHOA | 0.021 | 0.014 | -10000 | 0 | -10000 | 0 | 0 |
| CCNB1/CDK1 | 0.017 | 0.071 | -10000 | 0 | -0.42 | 8 | 8 |
| CDC14B | 0.011 | 0.003 | -10000 | 0 | -10000 | 0 | 0 |
| CDC20 | -0.022 | 0.17 | -10000 | 0 | -0.6 | 42 | 42 |
| PLK1/PBIP1 | -0.013 | 0.078 | 0.14 | 3 | -0.37 | 17 | 20 |
| mitosis | -0.002 | 0.003 | 0.022 | 4 | -10000 | 0 | 4 |
| FBXO5 | -0.001 | 0.047 | 0.19 | 7 | -0.19 | 5 | 12 |
| CDC2 | 0 | 0.003 | -10000 | 0 | -0.016 | 9 | 9 |
| NDC80 | -0.099 | 0.25 | -10000 | 0 | -0.59 | 106 | 106 |
| metaphase plate congression | -0.005 | 0.063 | 0.16 | 1 | -0.26 | 22 | 23 |
| ERCC6L | -0.001 | 0.1 | -10000 | 0 | -0.51 | 17 | 17 |
| NLP/gamma Tubulin | -0.001 | 0.032 | 0.11 | 8 | -0.11 | 10 | 18 |
| microtubule cytoskeleton organization | 0.002 | 0.04 | 0.14 | 4 | -0.2 | 11 | 15 |
| G2/M transition DNA damage checkpoint | 0 | 0.002 | 0.012 | 2 | -10000 | 0 | 2 |
| PPP1R12A | 0.03 | 0.005 | -10000 | 0 | -10000 | 0 | 0 |
| interphase | 0 | 0.002 | 0.012 | 2 | -10000 | 0 | 2 |
| PLK1/PRC1-2 | -0.092 | 0.2 | -10000 | 0 | -0.35 | 177 | 177 |
| GRASP65/GM130/RAB1/GTP/PLK1 | 0.019 | 0.046 | -10000 | 0 | -10000 | 0 | 0 |
| RAB1A | 0.029 | 0.005 | -10000 | 0 | -10000 | 0 | 0 |
| prophase | 0 | 0 | -10000 | 0 | -10000 | 0 | 0 |
| Aurora A/BORA | 0.001 | 0.034 | 0.12 | 13 | -0.12 | 8 | 21 |
| mitotic prometaphase | -0.002 | 0.005 | 0.017 | 15 | -10000 | 0 | 15 |
| proteasomal ubiquitin-dependent protein catabolic process | 0.01 | 0.058 | -10000 | 0 | -0.49 | 3 | 3 |
| microtubule-based process | -0.11 | 0.18 | 0.21 | 1 | -0.36 | 177 | 178 |
| Golgi organization | -0.005 | 0.047 | 0.15 | 10 | -0.15 | 10 | 20 |
| Cohesin/SA2 | 0.008 | 0.047 | 0.17 | 2 | -10000 | 0 | 2 |
| PPP1CB/MYPT1 | 0.043 | 0.011 | -10000 | 0 | -10000 | 0 | 0 |
| KIF20A | -0.19 | 0.29 | -10000 | 0 | -0.59 | 177 | 177 |
| APC/C/CDC20 | -0.016 | 0.12 | 0.19 | 3 | -0.39 | 42 | 45 |
| PPP2R1A | 0.03 | 0.003 | -10000 | 0 | -10000 | 0 | 0 |
| chromosome segregation | -0.012 | 0.077 | 0.14 | 3 | -0.35 | 18 | 21 |
| PRC1 | 0.024 | 0.061 | -10000 | 0 | -0.59 | 5 | 5 |
| ECT2 | 0.004 | 0.057 | 0.24 | 15 | -0.17 | 1 | 16 |
| C13orf34 | -0.001 | 0.036 | 0.12 | 11 | -0.12 | 9 | 20 |
| NUDC | -0.005 | 0.063 | 0.16 | 1 | -0.26 | 22 | 23 |
| regulation of attachment of spindle microtubules to kinetochore | -0.007 | 0.084 | 0.2 | 8 | -0.3 | 27 | 35 |
| spindle assembly | -0.002 | 0.041 | 0.13 | 11 | -0.13 | 8 | 19 |
| spindle stabilization | 0.007 | 0.032 | 0.15 | 9 | -0.2 | 1 | 10 |
| APC/C/HCDH1 | 0.029 | 0.021 | -10000 | 0 | -0.41 | 1 | 1 |
| MKLP2/PLK1 | -0.11 | 0.18 | 0.21 | 1 | -0.36 | 177 | 178 |
| CCNB1 | 0.018 | 0.078 | -10000 | 0 | -0.59 | 8 | 8 |
| PPP1CB | 0.03 | 0.005 | -10000 | 0 | -10000 | 0 | 0 |
| BTRC | 0.029 | 0.006 | -10000 | 0 | -10000 | 0 | 0 |
| ROCK2 | -0.022 | 0.075 | 0.19 | 2 | -0.37 | 9 | 11 |
| TUBG1 | 0.004 | 0.037 | 0.15 | 4 | -0.23 | 6 | 10 |
| G2/M transition of mitotic cell cycle | -0.009 | 0.061 | -10000 | 0 | -0.41 | 8 | 8 |
| MLF1IP | -0.005 | 0.083 | -10000 | 0 | -0.45 | 17 | 17 |
| INCENP | 0.029 | 0.003 | -10000 | 0 | -10000 | 0 | 0 |
Figure S34. Get High-res Image This plot shows pathway concept perturbations across all samples against a permutation model. The concepts along the x-axis are sorted by lowest to highest mean activity for the real patient samples. Mean inferred activities are plotted along the y-axis as a colored band showing the average level and one standard deviation range. Real samples are shown in red and permuted samples in black.
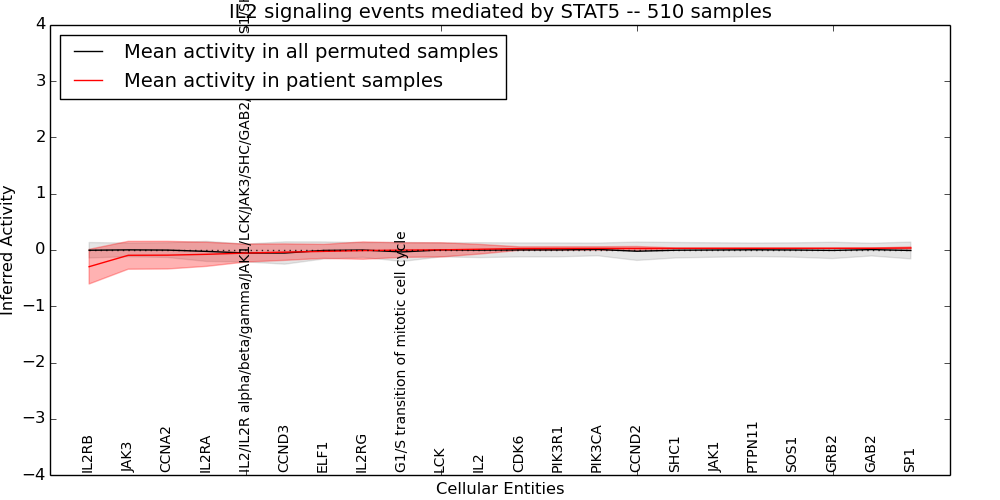
Table S34. Get Full Table This table displays mean, standard deviation, and perturbation statistics for Inferred Pathway Levels (IPLs). A mean perturbation of -9999 implies that the IPLs across all the real samples did not differ enough from the IPLs generated by a background model of permuted samples (> 1 Std.Dev from the permuted sample IPLs).
| Entity | Mean | Std.Dev | Mean.of.Up.Perturbations | Number.of.Up.Perturbations | Mean.of.Down.Perturbations | Number.of.Down.Perturbations | Number.of.Total.Perturbations |
|---|---|---|---|---|---|---|---|
| GAB2 | 0.031 | 0.003 | -10000 | 0 | -10000 | 0 | 0 |
| ELF1 | -0.024 | 0.12 | -10000 | 0 | -0.53 | 4 | 4 |
| CCNA2 | -0.092 | 0.25 | -10000 | 0 | -0.59 | 100 | 100 |
| PIK3CA | 0.028 | 0.03 | -10000 | 0 | -0.63 | 1 | 1 |
| JAK3 | -0.094 | 0.25 | -10000 | 0 | -0.59 | 103 | 103 |
| PIK3R1 | 0.027 | 0.031 | -10000 | 0 | -0.63 | 1 | 1 |
| JAK1 | 0.03 | 0.006 | -10000 | 0 | -10000 | 0 | 0 |
| IL2/IL2R alpha/beta/gamma/JAK1/LCK/JAK3/SHC/GAB2/GRB2/SOS1/SHP2/PI3K | -0.054 | 0.16 | -10000 | 0 | -0.47 | 37 | 37 |
| SHC1 | 0.029 | 0.007 | -10000 | 0 | -10000 | 0 | 0 |
| SP1 | 0.036 | 0.019 | -10000 | 0 | -10000 | 0 | 0 |
| IL2RA | -0.077 | 0.21 | -10000 | 0 | -0.51 | 101 | 101 |
| IL2RB | -0.3 | 0.31 | -10000 | 0 | -0.59 | 270 | 270 |
| SOS1 | 0.03 | 0.005 | -10000 | 0 | -10000 | 0 | 0 |
| IL2RG | -0.01 | 0.15 | -10000 | 0 | -0.59 | 34 | 34 |
| G1/S transition of mitotic cell cycle | -0.002 | 0.13 | 0.4 | 8 | -0.51 | 5 | 13 |
| PTPN11 | 0.03 | 0.006 | -10000 | 0 | -10000 | 0 | 0 |
| CCND2 | 0.028 | 0.034 | -10000 | 0 | -0.51 | 2 | 2 |
| LCK | 0.003 | 0.13 | -10000 | 0 | -0.59 | 22 | 22 |
| GRB2 | 0.03 | 0.005 | -10000 | 0 | -10000 | 0 | 0 |
| IL2 | 0.014 | 0.085 | -10000 | 0 | -0.59 | 10 | 10 |
| CDK6 | 0.025 | 0.031 | -10000 | 0 | -0.64 | 1 | 1 |
| CCND3 | -0.038 | 0.15 | 0.42 | 2 | -0.48 | 11 | 13 |
Figure S35. Get High-res Image This plot shows pathway concept perturbations across all samples against a permutation model. The concepts along the x-axis are sorted by lowest to highest mean activity for the real patient samples. Mean inferred activities are plotted along the y-axis as a colored band showing the average level and one standard deviation range. Real samples are shown in red and permuted samples in black.
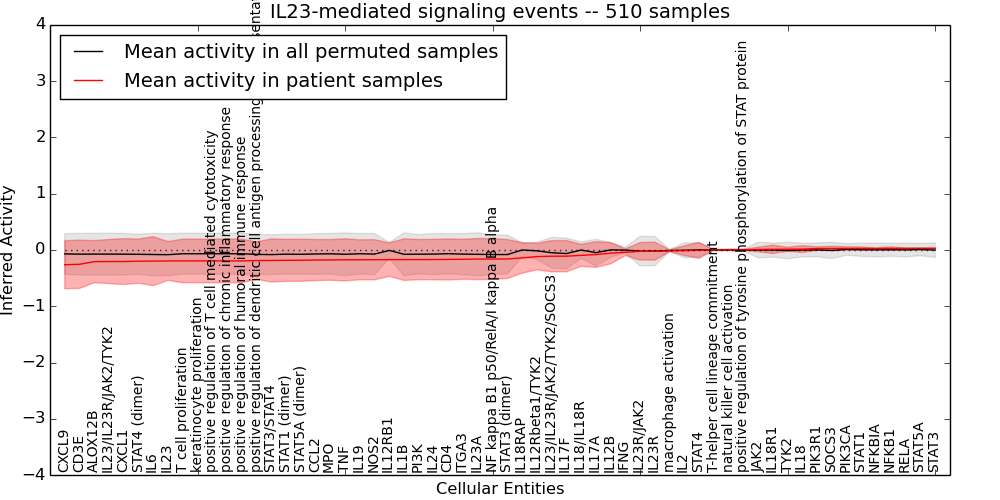
Table S35. Get Full Table This table displays mean, standard deviation, and perturbation statistics for Inferred Pathway Levels (IPLs). A mean perturbation of -9999 implies that the IPLs across all the real samples did not differ enough from the IPLs generated by a background model of permuted samples (> 1 Std.Dev from the permuted sample IPLs).
| Entity | Mean | Std.Dev | Mean.of.Up.Perturbations | Number.of.Up.Perturbations | Mean.of.Down.Perturbations | Number.of.Down.Perturbations | Number.of.Total.Perturbations |
|---|---|---|---|---|---|---|---|
| CCL2 | -0.18 | 0.36 | -10000 | 0 | -0.97 | 30 | 30 |
| IL23A | -0.16 | 0.37 | -10000 | 0 | -1 | 17 | 17 |
| NF kappa B1 p50/RelA/I kappa B alpha | -0.16 | 0.36 | -10000 | 0 | -0.96 | 30 | 30 |
| positive regulation of T cell mediated cytotoxicity | -0.19 | 0.39 | -10000 | 0 | -0.99 | 41 | 41 |
| ITGA3 | -0.16 | 0.36 | -10000 | 0 | -0.96 | 25 | 25 |
| IL17F | -0.11 | 0.28 | 0.62 | 3 | -0.7 | 15 | 18 |
| IL12B | -0.057 | 0.19 | -10000 | 0 | -0.61 | 52 | 52 |
| STAT1 (dimer) | -0.18 | 0.37 | -10000 | 0 | -0.98 | 37 | 37 |
| CD4 | -0.17 | 0.36 | -10000 | 0 | -0.94 | 36 | 36 |
| IL23 | -0.2 | 0.34 | -10000 | 0 | -1 | 25 | 25 |
| IL23R | -0.02 | 0.16 | -10000 | 0 | -0.72 | 13 | 13 |
| IL1B | -0.17 | 0.37 | -10000 | 0 | -1 | 22 | 22 |
| T-helper cell lineage commitment | 0 | 0 | -10000 | 0 | -10000 | 0 | 0 |
| IL24 | -0.17 | 0.36 | -10000 | 0 | -0.97 | 26 | 26 |
| TYK2 | 0.014 | 0.035 | -10000 | 0 | -10000 | 0 | 0 |
| STAT4 | -0.006 | 0.14 | -10000 | 0 | -0.59 | 29 | 29 |
| STAT3 | 0.03 | 0.005 | -10000 | 0 | -10000 | 0 | 0 |
| IL18RAP | -0.14 | 0.27 | -10000 | 0 | -0.6 | 132 | 132 |
| IL12RB1 | -0.17 | 0.3 | -10000 | 0 | -0.61 | 158 | 158 |
| PIK3CA | 0.027 | 0.03 | -10000 | 0 | -0.64 | 1 | 1 |
| IL12Rbeta1/TYK2 | -0.12 | 0.24 | -10000 | 0 | -0.46 | 158 | 158 |
| IL23R/JAK2 | -0.024 | 0.16 | -10000 | 0 | -0.76 | 8 | 8 |
| positive regulation of chronic inflammatory response | -0.19 | 0.39 | -10000 | 0 | -0.99 | 41 | 41 |
| natural killer cell activation | 0.002 | 0.01 | 0.049 | 10 | -10000 | 0 | 10 |
| JAK2 | 0.009 | 0.042 | -10000 | 0 | -10000 | 0 | 0 |
| PIK3R1 | 0.026 | 0.031 | -10000 | 0 | -0.64 | 1 | 1 |
| NFKB1 | 0.028 | 0.03 | -10000 | 0 | -0.63 | 1 | 1 |
| RELA | 0.03 | 0.005 | -10000 | 0 | -10000 | 0 | 0 |
| positive regulation of dendritic cell antigen processing and presentation | -0.19 | 0.33 | -10000 | 0 | -0.97 | 25 | 25 |
| ALOX12B | -0.21 | 0.38 | -10000 | 0 | -0.99 | 34 | 34 |
| CXCL1 | -0.2 | 0.41 | -10000 | 0 | -1.1 | 41 | 41 |
| T cell proliferation | -0.19 | 0.39 | -10000 | 0 | -0.99 | 41 | 41 |
| NFKBIA | 0.028 | 0.008 | -10000 | 0 | -10000 | 0 | 0 |
| IL17A | -0.081 | 0.23 | -10000 | 0 | -0.57 | 7 | 7 |
| PI3K | -0.17 | 0.36 | -10000 | 0 | -0.96 | 34 | 34 |
| IFNG | -0.04 | 0.059 | 0.12 | 7 | -0.11 | 78 | 85 |
| STAT3 (dimer) | -0.16 | 0.35 | -10000 | 0 | -0.93 | 30 | 30 |
| IL18R1 | 0.012 | 0.075 | -10000 | 0 | -0.61 | 7 | 7 |
| IL23/IL23R/JAK2/TYK2/SOCS3 | -0.11 | 0.28 | -10000 | 0 | -0.73 | 21 | 21 |
| IL18/IL18R | -0.095 | 0.2 | -10000 | 0 | -0.4 | 141 | 141 |
| macrophage activation | -0.014 | 0.015 | -10000 | 0 | -0.045 | 6 | 6 |
| TNF | -0.18 | 0.37 | -10000 | 0 | -1 | 26 | 26 |
| STAT3/STAT4 | -0.19 | 0.38 | -10000 | 0 | -0.99 | 40 | 40 |
| STAT4 (dimer) | -0.2 | 0.39 | -10000 | 0 | -1 | 45 | 45 |
| IL18 | 0.016 | 0.062 | -10000 | 0 | -0.59 | 5 | 5 |
| IL19 | -0.17 | 0.36 | -10000 | 0 | -0.93 | 31 | 31 |
| STAT5A (dimer) | -0.18 | 0.38 | -10000 | 0 | -0.98 | 37 | 37 |
| STAT1 | 0.028 | 0.028 | -10000 | 0 | -0.59 | 1 | 1 |
| SOCS3 | 0.027 | 0.039 | -10000 | 0 | -0.59 | 2 | 2 |
| CXCL9 | -0.26 | 0.43 | -10000 | 0 | -0.97 | 67 | 67 |
| MPO | -0.18 | 0.36 | -10000 | 0 | -0.95 | 31 | 31 |
| positive regulation of humoral immune response | -0.19 | 0.39 | -10000 | 0 | -0.99 | 41 | 41 |
| IL23/IL23R/JAK2/TYK2 | -0.2 | 0.39 | -10000 | 0 | -1 | 38 | 38 |
| IL6 | -0.2 | 0.44 | -10000 | 0 | -1.1 | 44 | 44 |
| STAT5A | 0.03 | 0.005 | -10000 | 0 | -10000 | 0 | 0 |
| IL2 | -0.011 | 0.086 | -10000 | 0 | -0.59 | 10 | 10 |
| positive regulation of tyrosine phosphorylation of STAT protein | 0.002 | 0.01 | 0.049 | 10 | -10000 | 0 | 10 |
| CD3E | -0.25 | 0.43 | -10000 | 0 | -0.97 | 64 | 64 |
| keratinocyte proliferation | -0.19 | 0.39 | -10000 | 0 | -0.99 | 41 | 41 |
| NOS2 | -0.17 | 0.36 | -10000 | 0 | -0.96 | 26 | 26 |
Figure S36. Get High-res Image This plot shows pathway concept perturbations across all samples against a permutation model. The concepts along the x-axis are sorted by lowest to highest mean activity for the real patient samples. Mean inferred activities are plotted along the y-axis as a colored band showing the average level and one standard deviation range. Real samples are shown in red and permuted samples in black.
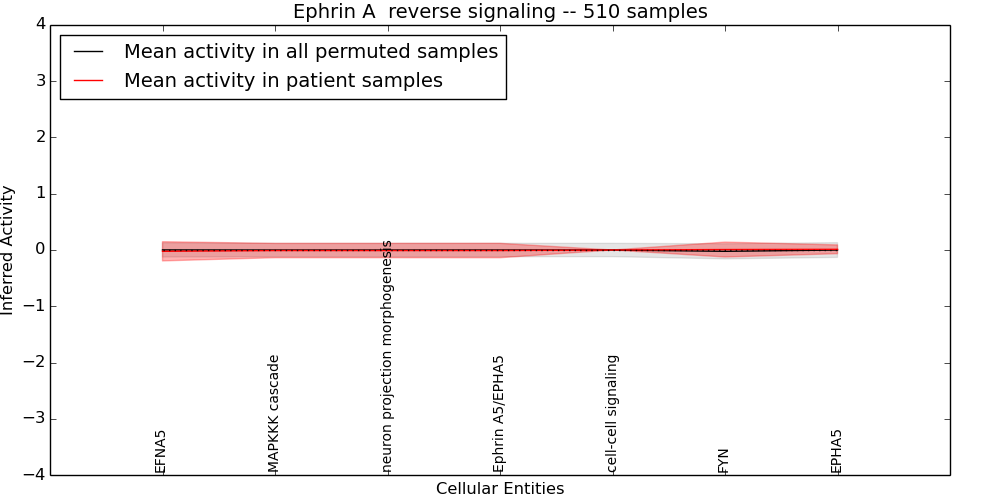
Table S36. Get Full Table This table displays mean, standard deviation, and perturbation statistics for Inferred Pathway Levels (IPLs). A mean perturbation of -9999 implies that the IPLs across all the real samples did not differ enough from the IPLs generated by a background model of permuted samples (> 1 Std.Dev from the permuted sample IPLs).
| Entity | Mean | Std.Dev | Mean.of.Up.Perturbations | Number.of.Up.Perturbations | Mean.of.Down.Perturbations | Number.of.Down.Perturbations | Number.of.Total.Perturbations |
|---|---|---|---|---|---|---|---|
| MAPKKK cascade | -0.01 | 0.13 | -9999 | 0 | -0.42 | 43 | 43 |
| EFNA5 | -0.023 | 0.17 | -9999 | 0 | -0.63 | 37 | 37 |
| FYN | 0.008 | 0.13 | -9999 | 0 | -0.38 | 43 | 43 |
| neuron projection morphogenesis | -0.01 | 0.13 | -9999 | 0 | -0.42 | 43 | 43 |
| cell-cell signaling | 0 | 0 | -9999 | 0 | -10000 | 0 | 0 |
| Ephrin A5/EPHA5 | -0.01 | 0.13 | -9999 | 0 | -0.42 | 43 | 43 |
| EPHA5 | 0.012 | 0.078 | -9999 | 0 | -0.6 | 8 | 8 |
Figure S37. Get High-res Image This plot shows pathway concept perturbations across all samples against a permutation model. The concepts along the x-axis are sorted by lowest to highest mean activity for the real patient samples. Mean inferred activities are plotted along the y-axis as a colored band showing the average level and one standard deviation range. Real samples are shown in red and permuted samples in black.
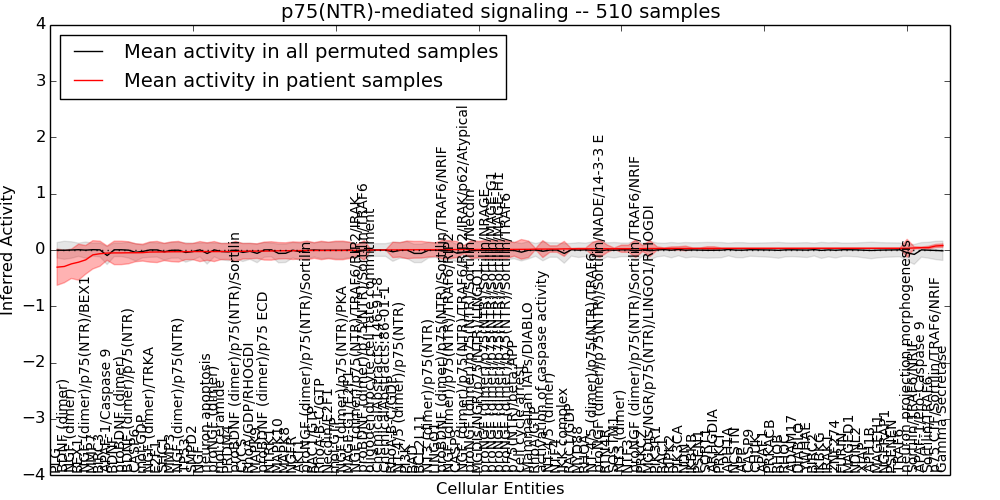
Table S37. Get Full Table This table displays mean, standard deviation, and perturbation statistics for Inferred Pathway Levels (IPLs). A mean perturbation of -9999 implies that the IPLs across all the real samples did not differ enough from the IPLs generated by a background model of permuted samples (> 1 Std.Dev from the permuted sample IPLs).
| Entity | Mean | Std.Dev | Mean.of.Up.Perturbations | Number.of.Up.Perturbations | Mean.of.Down.Perturbations | Number.of.Down.Perturbations | Number.of.Total.Perturbations |
|---|---|---|---|---|---|---|---|
| Sortilin/TRAF6 | 0.042 | 0.024 | -10000 | 0 | -0.47 | 1 | 1 |
| Necdin/E2F1 | -0.008 | 0.15 | -10000 | 0 | -0.43 | 55 | 55 |
| proNGF (dimer)/p75(NTR)/Sortilin/NADE/14-3-3 E | 0.022 | 0.16 | -10000 | 0 | -0.61 | 7 | 7 |
| NGF (dimer)/p75(NTR)/BEX1 | -0.18 | 0.26 | -10000 | 0 | -0.43 | 241 | 241 |
| NT-4/5 (dimer)/p75(NTR) | 0.002 | 0.13 | -10000 | 0 | -0.45 | 38 | 38 |
| IKBKB | 0.028 | 0.008 | -10000 | 0 | -10000 | 0 | 0 |
| AKT1 | -0.011 | 0.15 | 0.41 | 4 | -0.55 | 11 | 15 |
| IKBKG | 0.03 | 0.004 | -10000 | 0 | -10000 | 0 | 0 |
| BDNF | -0.051 | 0.21 | -10000 | 0 | -0.59 | 67 | 67 |
| MGDIs/NGR/p75(NTR)/LINGO1 | 0.009 | 0.14 | -10000 | 0 | -0.4 | 56 | 56 |
| FURIN | 0.03 | 0.003 | -10000 | 0 | -10000 | 0 | 0 |
| proBDNF (dimer)/p75(NTR)/Sortilin | -0.025 | 0.18 | -10000 | 0 | -0.39 | 94 | 94 |
| LINGO1 | 0.006 | 0.12 | -10000 | 0 | -0.59 | 20 | 20 |
| Sortilin/TRAF6/NRIF | 0.037 | 0.021 | -10000 | 0 | -10000 | 0 | 0 |
| proBDNF (dimer) | -0.051 | 0.21 | -10000 | 0 | -0.59 | 67 | 67 |
| NTRK1 | -0.017 | 0.16 | -10000 | 0 | -0.61 | 36 | 36 |
| RTN4R | 0.022 | 0.068 | -10000 | 0 | -0.6 | 6 | 6 |
| neuron apoptosis | -0.028 | 0.16 | 0.45 | 6 | -0.56 | 11 | 17 |
| IRAK1 | 0.03 | 0.004 | -10000 | 0 | -10000 | 0 | 0 |
| SHC1 | -0.034 | 0.15 | -10000 | 0 | -0.4 | 73 | 73 |
| ARHGDIA | 0.028 | 0.03 | -10000 | 0 | -0.64 | 1 | 1 |
| RhoA/GTP | 0.016 | 0.01 | -10000 | 0 | -10000 | 0 | 0 |
| Gamma Secretase | 0.079 | 0.03 | -10000 | 0 | -10000 | 0 | 0 |
| proNGF (dimer)/p75(NTR)/Sortilin/MAGE-H1 | 0.01 | 0.16 | -10000 | 0 | -0.55 | 11 | 11 |
| MAGEH1 | 0.03 | 0.003 | -10000 | 0 | -10000 | 0 | 0 |
| proNGF (dimer)/p75(NTR)/Sortilin/Necdin | 0.008 | 0.16 | -10000 | 0 | -0.52 | 13 | 13 |
| Mammalian IAPs/DIABLO | 0.012 | 0.15 | -10000 | 0 | -0.33 | 76 | 76 |
| proNGF (dimer) | -0.028 | 0.18 | -10000 | 0 | -0.59 | 47 | 47 |
| MAGED1 | 0.03 | 0.003 | -10000 | 0 | -10000 | 0 | 0 |
| APP | 0.029 | 0.006 | -10000 | 0 | -10000 | 0 | 0 |
| NT-4/5 (dimer) | 0.017 | 0.057 | -10000 | 0 | -0.62 | 4 | 4 |
| ZNF274 | 0.03 | 0.004 | -10000 | 0 | -10000 | 0 | 0 |
| RhoA/GDP/RHOGDI | -0.02 | 0.14 | -10000 | 0 | -0.35 | 59 | 59 |
| NGF | -0.028 | 0.18 | -10000 | 0 | -0.59 | 47 | 47 |
| cell cycle arrest | 0.011 | 0.18 | 0.36 | 10 | -0.65 | 7 | 17 |
| NGF (dimer)/p75(NTR)/TRAF6/RIP2/IRAK | -0.006 | 0.098 | -10000 | 0 | -0.39 | 16 | 16 |
| NT-4/5 (dimer)/p75(NTR)/TRAF6 | 0.022 | 0.12 | -10000 | 0 | -0.38 | 38 | 38 |
| NCSTN | 0.029 | 0.007 | -10000 | 0 | -10000 | 0 | 0 |
| mol:GTP | -0.008 | 0.16 | -10000 | 0 | -0.4 | 73 | 73 |
| PSENEN | 0.03 | 0.003 | -10000 | 0 | -10000 | 0 | 0 |
| mol:ceramide | -0.027 | 0.14 | -10000 | 0 | -0.36 | 73 | 73 |
| NGF (dimer)/p75(NTR)/TRAF6/RIP2/IRAK/p62/Atypical PKCs | 0.008 | 0.069 | -10000 | 0 | -0.45 | 3 | 3 |
| p75(NTR)/beta APP | 0.011 | 0.12 | -10000 | 0 | -0.44 | 33 | 33 |
| BEX1 | -0.22 | 0.32 | -10000 | 0 | -0.63 | 189 | 189 |
| mol:GDP | -0.047 | 0.15 | -10000 | 0 | -0.4 | 73 | 73 |
| NGF (dimer) | -0.25 | 0.26 | -10000 | 0 | -0.44 | 309 | 309 |
| MGDIs/NGR/p75(NTR)/LINGO1/RHOGDI | 0.026 | 0.14 | -10000 | 0 | -0.56 | 8 | 8 |
| PIK3R1 | 0.026 | 0.031 | -10000 | 0 | -0.64 | 1 | 1 |
| RAC1/GTP | -0.008 | 0.14 | -10000 | 0 | -0.35 | 67 | 67 |
| MYD88 | 0.021 | 0.014 | -10000 | 0 | -10000 | 0 | 0 |
| CHUK | 0.029 | 0.006 | -10000 | 0 | -10000 | 0 | 0 |
| NGF (dimer)/p75(NTR)/PKA | -0.008 | 0.16 | -10000 | 0 | -0.4 | 73 | 73 |
| RHOB | 0.029 | 0.006 | -10000 | 0 | -10000 | 0 | 0 |
| RHOA | 0.021 | 0.014 | -10000 | 0 | -10000 | 0 | 0 |
| MAGE-G1/E2F1 | -0.007 | 0.14 | -10000 | 0 | -0.43 | 53 | 53 |
| NT3 (dimer) | 0.023 | 0.064 | -10000 | 0 | -0.62 | 5 | 5 |
| TP53 | -0.029 | 0.14 | 0.34 | 3 | -0.59 | 6 | 9 |
| PRDM4 | -0.026 | 0.14 | -10000 | 0 | -0.56 | 10 | 10 |
| BDNF (dimer) | -0.29 | 0.29 | -10000 | 0 | -0.48 | 329 | 329 |
| PIK3CA | 0.027 | 0.03 | -10000 | 0 | -0.64 | 1 | 1 |
| SORT1 | 0.028 | 0.03 | -10000 | 0 | -0.64 | 1 | 1 |
| activation of caspase activity | 0.016 | 0.15 | -10000 | 0 | -0.6 | 7 | 7 |
| proNGF (dimer)/p75(NTR)/Sortilin/TRAF6 | 0.01 | 0.16 | -10000 | 0 | -0.55 | 11 | 11 |
| RHOC | 0.029 | 0.006 | -10000 | 0 | -10000 | 0 | 0 |
| XIAP | 0.03 | 0.003 | -10000 | 0 | -10000 | 0 | 0 |
| MAPK10 | -0.014 | 0.15 | 0.46 | 7 | -0.43 | 18 | 25 |
| DIABLO | 0.029 | 0.005 | -10000 | 0 | -10000 | 0 | 0 |
| SMPD2 | -0.028 | 0.14 | -10000 | 0 | -0.36 | 73 | 73 |
| APH1B | 0.03 | 0.003 | -10000 | 0 | -10000 | 0 | 0 |
| APH1A | 0.029 | 0.007 | -10000 | 0 | -10000 | 0 | 0 |
| proNGF (dimer)/p75(NTR)/Sortilin | -0.008 | 0.17 | -10000 | 0 | -0.4 | 74 | 74 |
| PSEN1 | 0.028 | 0.008 | -10000 | 0 | -10000 | 0 | 0 |
| APAF-1/Pro-Caspase 9 | 0.041 | 0.012 | -10000 | 0 | -10000 | 0 | 0 |
| NT3 (dimer)/p75(NTR) | 0.006 | 0.13 | -10000 | 0 | -0.45 | 38 | 38 |
| MAPK8 | -0.014 | 0.14 | 0.43 | 7 | -0.42 | 17 | 24 |
| MAPK9 | -0.019 | 0.13 | 0.45 | 6 | -0.42 | 16 | 22 |
| APAF1 | 0.029 | 0.006 | -10000 | 0 | -10000 | 0 | 0 |
| NTF3 | 0.023 | 0.064 | -10000 | 0 | -0.62 | 5 | 5 |
| NTF4 | 0.017 | 0.057 | -10000 | 0 | -0.62 | 4 | 4 |
| NDN | 0.027 | 0.042 | -10000 | 0 | -0.64 | 2 | 2 |
| RAC1/GDP | 0.02 | 0.007 | -10000 | 0 | -10000 | 0 | 0 |
| RhoA-B-C/GDP | 0.001 | 0.14 | -10000 | 0 | -0.57 | 7 | 7 |
| p75 CTF/Sortilin/TRAF6/NRIF | 0.072 | 0.028 | -10000 | 0 | -0.37 | 1 | 1 |
| RhoA-B-C/GTP | -0.008 | 0.16 | -10000 | 0 | -0.4 | 73 | 73 |
| proBDNF (dimer)/p75(NTR)/Sortilin/TRAF6/NRIF | 0.007 | 0.17 | -10000 | 0 | -0.54 | 9 | 9 |
| proBDNF (dimer)/p75(NTR)/Sortilin/TRAF6 | -0.006 | 0.17 | -10000 | 0 | -0.55 | 10 | 10 |
| PRKACB | 0.029 | 0.006 | -10000 | 0 | -10000 | 0 | 0 |
| proBDNF (dimer)/p75 ECD | -0.019 | 0.16 | -10000 | 0 | -0.43 | 66 | 66 |
| ChemicalAbstracts:86-01-1 | 0 | 0 | -10000 | 0 | -10000 | 0 | 0 |
| BIRC3 | -0.066 | 0.22 | -10000 | 0 | -0.59 | 79 | 79 |
| BIRC2 | 0.03 | 0.004 | -10000 | 0 | -10000 | 0 | 0 |
| neuron projection morphogenesis | 0.031 | 0.16 | 0.33 | 5 | -0.52 | 7 | 12 |
| BAD | 0.004 | 0.15 | 0.48 | 10 | -0.47 | 5 | 15 |
| RIPK2 | 0.027 | 0.028 | -10000 | 0 | -0.59 | 1 | 1 |
| NGFR | -0.012 | 0.16 | -10000 | 0 | -0.6 | 34 | 34 |
| CYCS | -0.022 | 0.14 | 0.43 | 2 | -0.61 | 8 | 10 |
| ADAM17 | 0.029 | 0.005 | -10000 | 0 | -10000 | 0 | 0 |
| NGF (dimer)/p75(NTR)/TRAF6/RIP2 | 0.007 | 0.16 | -10000 | 0 | -0.57 | 10 | 10 |
| BCL2L11 | 0.005 | 0.15 | 0.46 | 10 | -0.48 | 5 | 15 |
| BDNF (dimer)/p75(NTR) | -0.049 | 0.2 | -10000 | 0 | -0.45 | 95 | 95 |
| PI3K | 0.003 | 0.16 | -10000 | 0 | -0.37 | 69 | 69 |
| proNGF (dimer)/p75(NTR)/Sortilin/MAGE-G1 | 0.01 | 0.16 | -10000 | 0 | -0.55 | 11 | 11 |
| NDNL2 | 0.03 | 0.003 | -10000 | 0 | -10000 | 0 | 0 |
| YWHAE | 0.029 | 0.005 | -10000 | 0 | -10000 | 0 | 0 |
| PRKCI | 0.029 | 0.007 | -10000 | 0 | -10000 | 0 | 0 |
| NGF (dimer)/p75(NTR) | -0.031 | 0.18 | -10000 | 0 | -0.46 | 74 | 74 |
| ChemicalAbstracts:146-91-8 | 0 | 0 | -10000 | 0 | -10000 | 0 | 0 |
| proNGF (dimer)/p75(NTR)/Sortilin/NRAGE | 0.01 | 0.16 | -10000 | 0 | -0.55 | 11 | 11 |
| TRAF6 | 0.03 | 0.003 | -10000 | 0 | -10000 | 0 | 0 |
| RAC1 | 0.027 | 0.009 | -10000 | 0 | -10000 | 0 | 0 |
| PRKCZ | 0.025 | 0.051 | -10000 | 0 | -0.64 | 3 | 3 |
| PLG | -0.3 | 0.32 | -10000 | 0 | -0.61 | 265 | 265 |
| oligodendrocyte cell fate commitment | 0 | 0 | -10000 | 0 | -10000 | 0 | 0 |
| CASP6 | -0.049 | 0.16 | -10000 | 0 | -0.51 | 23 | 23 |
| SQSTM1 | 0.023 | 0.013 | -10000 | 0 | -10000 | 0 | 0 |
| NGFRAP1 | 0.03 | 0.003 | -10000 | 0 | -10000 | 0 | 0 |
| CASP3 | 0.008 | 0.14 | 0.46 | 10 | -0.44 | 5 | 15 |
| E2F1 | -0.035 | 0.19 | -10000 | 0 | -0.59 | 53 | 53 |
| CASP9 | 0.029 | 0.006 | -10000 | 0 | -10000 | 0 | 0 |
| IKK complex | 0.02 | 0.13 | -10000 | 0 | -0.52 | 1 | 1 |
| NGF (dimer)/TRKA | -0.036 | 0.18 | -10000 | 0 | -0.45 | 79 | 79 |
| MMP7 | -0.086 | 0.25 | -10000 | 0 | -0.63 | 89 | 89 |
| proNGF (dimer)/p75(NTR)/Sortilin/TRAF6/NRIF | 0.023 | 0.16 | -10000 | 0 | -0.61 | 7 | 7 |
| MMP3 | -0.031 | 0.18 | -10000 | 0 | -0.59 | 46 | 46 |
| APAF-1/Caspase 9 | -0.055 | 0.13 | -10000 | 0 | -0.48 | 9 | 9 |
Figure S38. Get High-res Image This plot shows pathway concept perturbations across all samples against a permutation model. The concepts along the x-axis are sorted by lowest to highest mean activity for the real patient samples. Mean inferred activities are plotted along the y-axis as a colored band showing the average level and one standard deviation range. Real samples are shown in red and permuted samples in black.
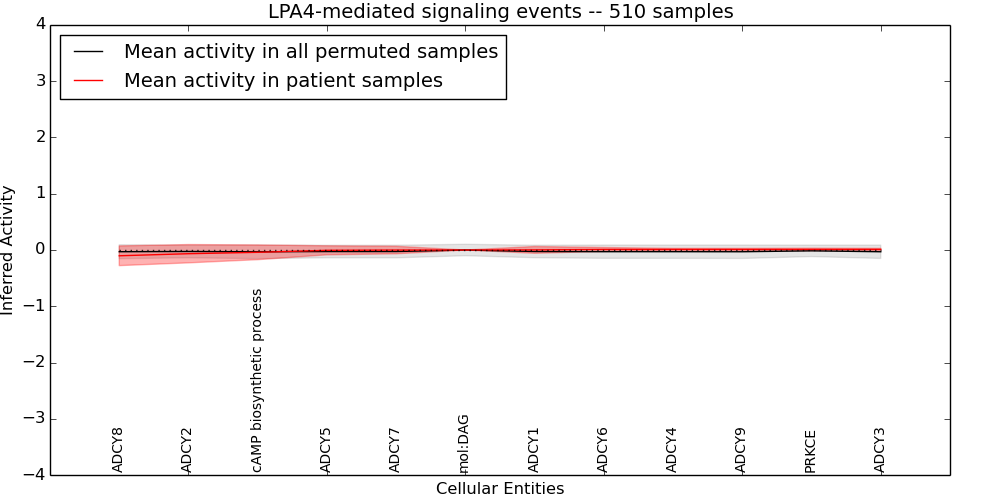
Table S38. Get Full Table This table displays mean, standard deviation, and perturbation statistics for Inferred Pathway Levels (IPLs). A mean perturbation of -9999 implies that the IPLs across all the real samples did not differ enough from the IPLs generated by a background model of permuted samples (> 1 Std.Dev from the permuted sample IPLs).
| Entity | Mean | Std.Dev | Mean.of.Up.Perturbations | Number.of.Up.Perturbations | Mean.of.Down.Perturbations | Number.of.Down.Perturbations | Number.of.Total.Perturbations |
|---|---|---|---|---|---|---|---|
| ADCY4 | 0.01 | 0.019 | -10000 | 0 | -0.41 | 1 | 1 |
| ADCY5 | -0.006 | 0.08 | -10000 | 0 | -0.41 | 19 | 19 |
| ADCY6 | 0.01 | 0.034 | -10000 | 0 | -0.76 | 1 | 1 |
| ADCY7 | -0.001 | 0.067 | -10000 | 0 | -0.37 | 16 | 16 |
| ADCY1 | 0.002 | 0.06 | -10000 | 0 | -0.4 | 11 | 11 |
| ADCY2 | -0.066 | 0.16 | -10000 | 0 | -0.37 | 109 | 109 |
| ADCY3 | 0.011 | 0.019 | -10000 | 0 | -0.41 | 1 | 1 |
| ADCY8 | -0.1 | 0.18 | -10000 | 0 | -0.37 | 151 | 151 |
| PRKCE | 0.011 | 0.022 | -10000 | 0 | -0.48 | 1 | 1 |
| ADCY9 | 0.01 | 0.019 | -10000 | 0 | -0.41 | 1 | 1 |
| mol:DAG | 0 | 0 | -10000 | 0 | -10000 | 0 | 0 |
| cAMP biosynthetic process | -0.041 | 0.13 | 0.29 | 19 | -0.33 | 36 | 55 |
Figure S39. Get High-res Image This plot shows pathway concept perturbations across all samples against a permutation model. The concepts along the x-axis are sorted by lowest to highest mean activity for the real patient samples. Mean inferred activities are plotted along the y-axis as a colored band showing the average level and one standard deviation range. Real samples are shown in red and permuted samples in black.
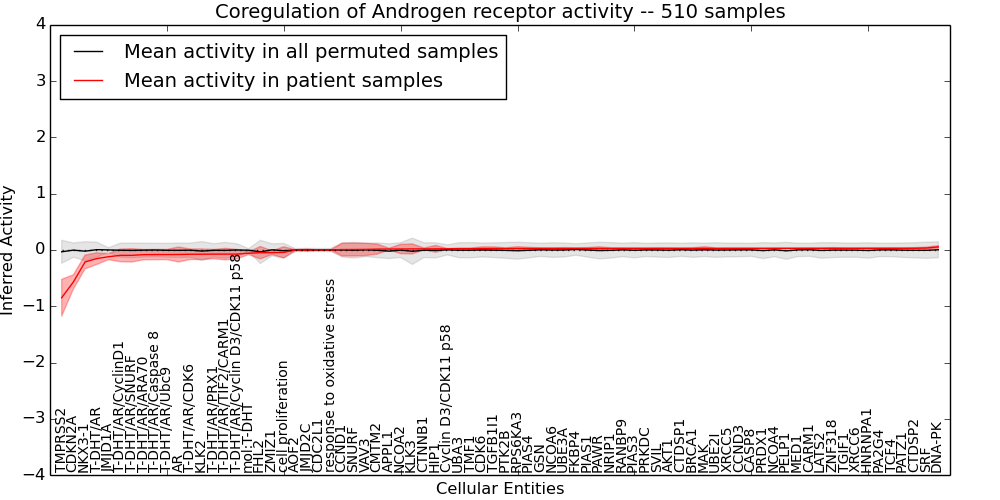
Table S39. Get Full Table This table displays mean, standard deviation, and perturbation statistics for Inferred Pathway Levels (IPLs). A mean perturbation of -9999 implies that the IPLs across all the real samples did not differ enough from the IPLs generated by a background model of permuted samples (> 1 Std.Dev from the permuted sample IPLs).
| Entity | Mean | Std.Dev | Mean.of.Up.Perturbations | Number.of.Up.Perturbations | Mean.of.Down.Perturbations | Number.of.Down.Perturbations | Number.of.Total.Perturbations |
|---|---|---|---|---|---|---|---|
| NRIP1 | 0.028 | 0.011 | -9999 | 0 | -10000 | 0 | 0 |
| SVIL | 0.028 | 0.01 | -9999 | 0 | -10000 | 0 | 0 |
| ZNF318 | 0.03 | 0.013 | -9999 | 0 | -10000 | 0 | 0 |
| JMJD2C | -0.001 | 0.017 | -9999 | 0 | -0.086 | 17 | 17 |
| T-DHT/AR/Ubc9 | -0.08 | 0.091 | -9999 | 0 | -0.47 | 21 | 21 |
| CARM1 | 0.03 | 0.003 | -9999 | 0 | -10000 | 0 | 0 |
| PRDX1 | 0.029 | 0.006 | -9999 | 0 | -10000 | 0 | 0 |
| PELP1 | 0.03 | 0.005 | -9999 | 0 | -10000 | 0 | 0 |
| CTNNB1 | 0.02 | 0.016 | -9999 | 0 | -10000 | 0 | 0 |
| AKT1 | 0.028 | 0.009 | -9999 | 0 | -10000 | 0 | 0 |
| PTK2B | 0.027 | 0.011 | -9999 | 0 | -10000 | 0 | 0 |
| MED1 | 0.03 | 0.006 | -9999 | 0 | -10000 | 0 | 0 |
| MAK | 0.029 | 0.03 | -9999 | 0 | -0.59 | 1 | 1 |
| response to oxidative stress | 0 | 0.001 | -9999 | 0 | -10000 | 0 | 0 |
| HIP1 | 0.02 | 0.061 | -9999 | 0 | -0.65 | 4 | 4 |
| GSN | 0.027 | 0.013 | -9999 | 0 | -10000 | 0 | 0 |
| NCOA2 | 0.018 | 0.083 | -9999 | 0 | -0.64 | 8 | 8 |
| NCOA6 | 0.028 | 0.012 | -9999 | 0 | -10000 | 0 | 0 |
| DNA-PK | 0.055 | 0.023 | -9999 | 0 | -10000 | 0 | 0 |
| NCOA4 | 0.029 | 0.005 | -9999 | 0 | -10000 | 0 | 0 |
| PIAS3 | 0.028 | 0.009 | -9999 | 0 | -10000 | 0 | 0 |
| cell proliferation | -0.042 | 0.1 | -9999 | 0 | -0.54 | 18 | 18 |
| XRCC5 | 0.029 | 0.007 | -9999 | 0 | -10000 | 0 | 0 |
| UBE3A | 0.028 | 0.015 | -9999 | 0 | -10000 | 0 | 0 |
| T-DHT/AR/SNURF | -0.095 | 0.12 | -9999 | 0 | -0.49 | 36 | 36 |
| FHL2 | -0.048 | 0.11 | -9999 | 0 | -0.73 | 9 | 9 |
| RANBP9 | 0.028 | 0.011 | -9999 | 0 | -10000 | 0 | 0 |
| JMJD1A | -0.12 | 0.052 | -9999 | 0 | -0.14 | 441 | 441 |
| CDK6 | 0.026 | 0.031 | -9999 | 0 | -0.63 | 1 | 1 |
| TGFB1I1 | 0.026 | 0.029 | -9999 | 0 | -0.59 | 1 | 1 |
| T-DHT/AR/CyclinD1 | -0.096 | 0.11 | -9999 | 0 | -0.45 | 40 | 40 |
| XRCC6 | 0.03 | 0.005 | -9999 | 0 | -10000 | 0 | 0 |
| T-DHT/AR | -0.15 | 0.1 | -9999 | 0 | -0.44 | 31 | 31 |
| CTDSP1 | 0.029 | 0.007 | -9999 | 0 | -10000 | 0 | 0 |
| CTDSP2 | 0.031 | 0.012 | -9999 | 0 | -10000 | 0 | 0 |
| BRCA1 | 0.029 | 0.01 | -9999 | 0 | -10000 | 0 | 0 |
| TCF4 | 0.03 | 0.009 | -9999 | 0 | -10000 | 0 | 0 |
| CDKN2A | -0.57 | 0.13 | -9999 | 0 | -0.59 | 489 | 489 |
| SRF | 0.036 | 0.016 | -9999 | 0 | -10000 | 0 | 0 |
| NKX3-1 | -0.21 | 0.12 | -9999 | 0 | -0.51 | 45 | 45 |
| KLK3 | 0.02 | 0.089 | -9999 | 0 | -0.53 | 2 | 2 |
| TMF1 | 0.024 | 0.012 | -9999 | 0 | -10000 | 0 | 0 |
| HNRNPA1 | 0.03 | 0.007 | -9999 | 0 | -10000 | 0 | 0 |
| AOF2 | -0.001 | 0.006 | -9999 | 0 | -10000 | 0 | 0 |
| APPL1 | 0.017 | 0.014 | -9999 | 0 | -10000 | 0 | 0 |
| T-DHT/AR/Caspase 8 | -0.081 | 0.091 | -9999 | 0 | -0.46 | 22 | 22 |
| AR | -0.08 | 0.13 | -9999 | 0 | -0.66 | 24 | 24 |
| UBA3 | 0.023 | 0.012 | -9999 | 0 | -10000 | 0 | 0 |
| PATZ1 | 0.03 | 0.007 | -9999 | 0 | -10000 | 0 | 0 |
| PAWR | 0.028 | 0.03 | -9999 | 0 | -0.64 | 1 | 1 |
| PRKDC | 0.028 | 0.008 | -9999 | 0 | -10000 | 0 | 0 |
| PA2G4 | 0.03 | 0.008 | -9999 | 0 | -10000 | 0 | 0 |
| UBE2I | 0.029 | 0.006 | -9999 | 0 | -10000 | 0 | 0 |
| T-DHT/AR/Cyclin D3/CDK11 p58 | -0.073 | 0.084 | -9999 | 0 | -0.42 | 23 | 23 |
| RPS6KA3 | 0.027 | 0.033 | -9999 | 0 | -0.66 | 1 | 1 |
| T-DHT/AR/ARA70 | -0.082 | 0.091 | -9999 | 0 | -0.46 | 22 | 22 |
| LATS2 | 0.03 | 0.007 | -9999 | 0 | -10000 | 0 | 0 |
| T-DHT/AR/PRX1 | -0.073 | 0.083 | -9999 | 0 | -0.42 | 23 | 23 |
| Cyclin D3/CDK11 p58 | 0.021 | 0.005 | -9999 | 0 | -10000 | 0 | 0 |
| VAV3 | 0.01 | 0.11 | -9999 | 0 | -0.64 | 14 | 14 |
| KLK2 | -0.075 | 0.094 | -9999 | 0 | -0.52 | 18 | 18 |
| CASP8 | 0.029 | 0.006 | -9999 | 0 | -10000 | 0 | 0 |
| T-DHT/AR/TIF2/CARM1 | -0.073 | 0.1 | -9999 | 0 | -0.46 | 24 | 24 |
| TMPRSS2 | -0.85 | 0.33 | -9999 | 0 | -0.97 | 446 | 446 |
| CCND1 | 0.008 | 0.11 | -9999 | 0 | -0.59 | 18 | 18 |
| PIAS1 | 0.028 | 0.015 | -9999 | 0 | -10000 | 0 | 0 |
| mol:T-DHT | -0.058 | 0.025 | -9999 | 0 | -0.067 | 432 | 432 |
| CDC2L1 | 0 | 0 | -9999 | 0 | -10000 | 0 | 0 |
| PIAS4 | 0.027 | 0.02 | -9999 | 0 | -10000 | 0 | 0 |
| T-DHT/AR/CDK6 | -0.075 | 0.094 | -9999 | 0 | -0.47 | 20 | 20 |
| CMTM2 | 0.016 | 0.09 | -9999 | 0 | -0.59 | 11 | 11 |
| SNURF | 0.009 | 0.12 | -9999 | 0 | -0.64 | 16 | 16 |
| ZMIZ1 | -0.047 | 0.032 | -9999 | 0 | -10000 | 0 | 0 |
| CCND3 | 0.029 | 0.006 | -9999 | 0 | -10000 | 0 | 0 |
| TGIF1 | 0.03 | 0.007 | -9999 | 0 | -10000 | 0 | 0 |
| FKBP4 | 0.028 | 0.011 | -9999 | 0 | -10000 | 0 | 0 |
Figure S40. Get High-res Image This plot shows pathway concept perturbations across all samples against a permutation model. The concepts along the x-axis are sorted by lowest to highest mean activity for the real patient samples. Mean inferred activities are plotted along the y-axis as a colored band showing the average level and one standard deviation range. Real samples are shown in red and permuted samples in black.
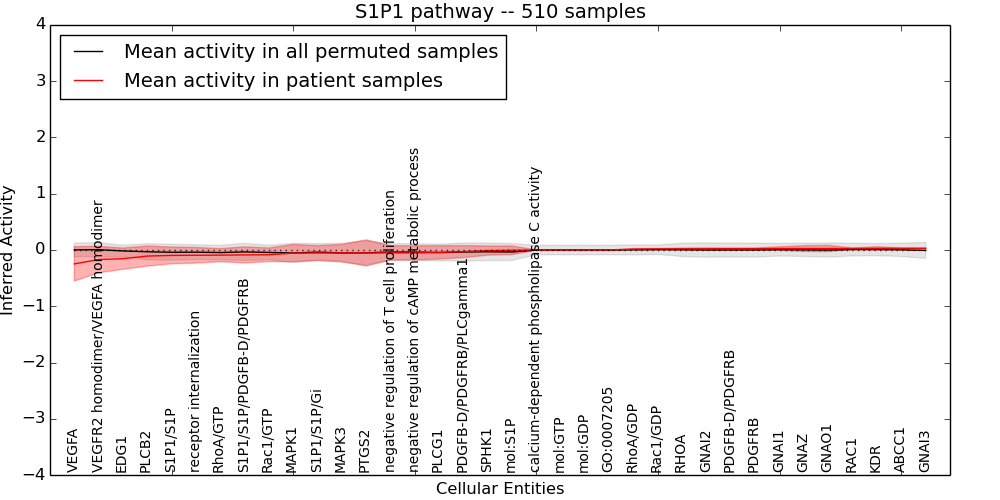
Table S40. Get Full Table This table displays mean, standard deviation, and perturbation statistics for Inferred Pathway Levels (IPLs). A mean perturbation of -9999 implies that the IPLs across all the real samples did not differ enough from the IPLs generated by a background model of permuted samples (> 1 Std.Dev from the permuted sample IPLs).
| Entity | Mean | Std.Dev | Mean.of.Up.Perturbations | Number.of.Up.Perturbations | Mean.of.Down.Perturbations | Number.of.Down.Perturbations | Number.of.Total.Perturbations |
|---|---|---|---|---|---|---|---|
| VEGFR2 homodimer/VEGFA homodimer | -0.17 | 0.24 | -10000 | 0 | -0.43 | 228 | 228 |
| PDGFRB | 0.023 | 0.013 | -10000 | 0 | -10000 | 0 | 0 |
| SPHK1 | -0.01 | 0.082 | -10000 | 0 | -0.59 | 6 | 6 |
| mol:S1P | -0.005 | 0.076 | -10000 | 0 | -0.5 | 6 | 6 |
| S1P1/S1P/Gi | -0.053 | 0.13 | 0.32 | 1 | -0.49 | 18 | 19 |
| GNAO1 | 0.027 | 0.056 | -10000 | 0 | -0.59 | 4 | 4 |
| PDGFB-D/PDGFRB/PLCgamma1 | -0.029 | 0.11 | 0.33 | 1 | -0.45 | 11 | 12 |
| PLCG1 | -0.042 | 0.12 | 0.32 | 2 | -0.45 | 17 | 19 |
| mol:GTP | 0 | 0 | -10000 | 0 | -10000 | 0 | 0 |
| PDGFB-D/PDGFRB | 0.023 | 0.013 | -10000 | 0 | -10000 | 0 | 0 |
| GNAI2 | 0.022 | 0.016 | -10000 | 0 | -10000 | 0 | 0 |
| GNAI3 | 0.03 | 0.008 | -10000 | 0 | -10000 | 0 | 0 |
| GNAI1 | 0.026 | 0.032 | -10000 | 0 | -0.65 | 1 | 1 |
| mol:GDP | 0 | 0 | -10000 | 0 | -10000 | 0 | 0 |
| EDG1 | -0.15 | 0.19 | -10000 | 0 | -0.36 | 228 | 228 |
| S1P1/S1P | -0.096 | 0.15 | 0.25 | 1 | -0.39 | 22 | 23 |
| negative regulation of cAMP metabolic process | -0.052 | 0.13 | 0.32 | 1 | -0.47 | 18 | 19 |
| MAPK3 | -0.053 | 0.15 | 0.42 | 2 | -0.59 | 23 | 25 |
| calcium-dependent phospholipase C activity | 0 | 0.002 | -10000 | 0 | -10000 | 0 | 0 |
| Rac1/GDP | 0.02 | 0.007 | -10000 | 0 | -10000 | 0 | 0 |
| RhoA/GDP | 0.016 | 0.01 | -10000 | 0 | -10000 | 0 | 0 |
| KDR | 0.029 | 0.03 | -10000 | 0 | -0.64 | 1 | 1 |
| PLCB2 | -0.11 | 0.18 | 0.34 | 7 | -0.44 | 52 | 59 |
| RAC1 | 0.027 | 0.009 | -10000 | 0 | -10000 | 0 | 0 |
| RhoA/GTP | -0.091 | 0.12 | -10000 | 0 | -0.34 | 15 | 15 |
| receptor internalization | -0.094 | 0.14 | -10000 | 0 | -0.35 | 26 | 26 |
| PTGS2 | -0.052 | 0.23 | 0.49 | 6 | -0.92 | 26 | 32 |
| Rac1/GTP | -0.085 | 0.12 | -10000 | 0 | -0.34 | 16 | 16 |
| RHOA | 0.021 | 0.014 | -10000 | 0 | -10000 | 0 | 0 |
| VEGFA | -0.25 | 0.31 | -10000 | 0 | -0.59 | 228 | 228 |
| negative regulation of T cell proliferation | -0.052 | 0.13 | 0.32 | 1 | -0.47 | 18 | 19 |
| GO:0007205 | 0 | 0 | -10000 | 0 | -10000 | 0 | 0 |
| GNAZ | 0.026 | 0.051 | -10000 | 0 | -0.64 | 3 | 3 |
| MAPK1 | -0.055 | 0.15 | 0.32 | 1 | -0.6 | 25 | 26 |
| S1P1/S1P/PDGFB-D/PDGFRB | -0.087 | 0.14 | 0.3 | 1 | -0.4 | 16 | 17 |
| ABCC1 | 0.029 | 0.007 | -10000 | 0 | -10000 | 0 | 0 |
Figure S41. Get High-res Image This plot shows pathway concept perturbations across all samples against a permutation model. The concepts along the x-axis are sorted by lowest to highest mean activity for the real patient samples. Mean inferred activities are plotted along the y-axis as a colored band showing the average level and one standard deviation range. Real samples are shown in red and permuted samples in black.
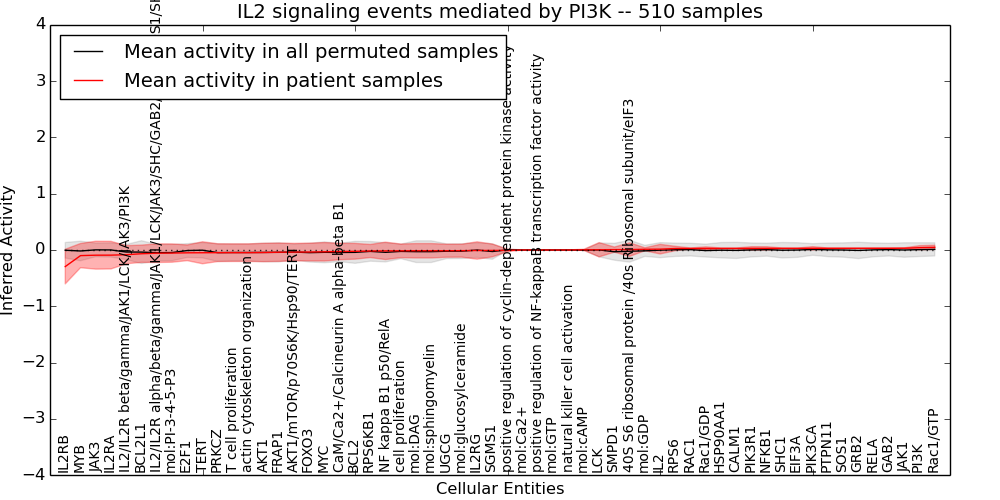
Table S41. Get Full Table This table displays mean, standard deviation, and perturbation statistics for Inferred Pathway Levels (IPLs). A mean perturbation of -9999 implies that the IPLs across all the real samples did not differ enough from the IPLs generated by a background model of permuted samples (> 1 Std.Dev from the permuted sample IPLs).
| Entity | Mean | Std.Dev | Mean.of.Up.Perturbations | Number.of.Up.Perturbations | Mean.of.Down.Perturbations | Number.of.Down.Perturbations | Number.of.Total.Perturbations |
|---|---|---|---|---|---|---|---|
| BCL2L1 | -0.066 | 0.15 | -10000 | 0 | -0.52 | 20 | 20 |
| UGCG | -0.013 | 0.12 | -10000 | 0 | -0.57 | 19 | 19 |
| AKT1/mTOR/p70S6K/Hsp90/TERT | -0.037 | 0.16 | 0.35 | 3 | -0.4 | 34 | 37 |
| mol:GTP | 0 | 0 | -10000 | 0 | -10000 | 0 | 0 |
| mol:glucosylceramide | -0.012 | 0.12 | -10000 | 0 | -0.56 | 19 | 19 |
| mol:DAG | -0.013 | 0.13 | -10000 | 0 | -0.84 | 12 | 12 |
| CaM/Ca2+/Calcineurin A alpha-beta B1 | -0.027 | 0.15 | 0.29 | 1 | -0.43 | 19 | 20 |
| FRAP1 | -0.04 | 0.16 | 0.36 | 3 | -0.47 | 25 | 28 |
| FOXO3 | -0.036 | 0.16 | 0.36 | 4 | -0.46 | 24 | 28 |
| AKT1 | -0.044 | 0.16 | 0.31 | 1 | -0.46 | 35 | 36 |
| GAB2 | 0.03 | 0.003 | -10000 | 0 | -10000 | 0 | 0 |
| SMPD1 | 0.007 | 0.046 | -10000 | 0 | -0.74 | 1 | 1 |
| SGMS1 | -0.008 | 0.11 | -10000 | 0 | -0.7 | 12 | 12 |
| positive regulation of NF-kappaB transcription factor activity | 0 | 0 | -10000 | 0 | -10000 | 0 | 0 |
| mol:Ca2+ | 0 | 0 | -10000 | 0 | -10000 | 0 | 0 |
| mol:GDP | 0.013 | 0.027 | -10000 | 0 | -0.4 | 2 | 2 |
| CALM1 | 0.028 | 0.008 | -10000 | 0 | -10000 | 0 | 0 |
| cell proliferation | -0.015 | 0.12 | 0.3 | 4 | -0.48 | 17 | 21 |
| EIF3A | 0.029 | 0.006 | -10000 | 0 | -10000 | 0 | 0 |
| PI3K | 0.041 | 0.036 | -10000 | 0 | -0.47 | 2 | 2 |
| RPS6KB1 | -0.018 | 0.12 | -10000 | 0 | -0.9 | 6 | 6 |
| mol:sphingomyelin | -0.013 | 0.13 | -10000 | 0 | -0.84 | 12 | 12 |
| natural killer cell activation | 0 | 0.002 | -10000 | 0 | -0.01 | 1 | 1 |
| JAK3 | -0.092 | 0.25 | -10000 | 0 | -0.58 | 103 | 103 |
| PIK3R1 | 0.028 | 0.031 | -10000 | 0 | -0.63 | 1 | 1 |
| JAK1 | 0.031 | 0.007 | -10000 | 0 | -10000 | 0 | 0 |
| NFKB1 | 0.028 | 0.03 | -10000 | 0 | -0.64 | 1 | 1 |
| MYC | -0.032 | 0.16 | 0.43 | 4 | -0.49 | 15 | 19 |
| MYB | -0.1 | 0.22 | -10000 | 0 | -0.44 | 138 | 138 |
| IL2/IL2R alpha/beta/gamma/JAK1/LCK/JAK3/SHC/GAB2/GRB2/SOS1/SHP2/PI3K | -0.056 | 0.17 | 0.26 | 1 | -0.49 | 37 | 38 |
| 40S S6 ribosomal protein /40s Ribosomal subunit/eIF3 | 0.007 | 0.12 | -10000 | 0 | -0.86 | 6 | 6 |
| mol:PI-3-4-5-P3 | -0.054 | 0.16 | 0.26 | 1 | -0.48 | 37 | 38 |
| Rac1/GDP | 0.028 | 0.028 | -10000 | 0 | -0.36 | 2 | 2 |
| T cell proliferation | -0.047 | 0.16 | 0.3 | 1 | -0.45 | 36 | 37 |
| SHC1 | 0.029 | 0.007 | -10000 | 0 | -10000 | 0 | 0 |
| RAC1 | 0.027 | 0.009 | -10000 | 0 | -10000 | 0 | 0 |
| positive regulation of cyclin-dependent protein kinase activity | -0.007 | 0.021 | -10000 | 0 | -0.04 | 139 | 139 |
| PRKCZ | -0.047 | 0.16 | -10000 | 0 | -0.48 | 33 | 33 |
| NF kappa B1 p50/RelA | -0.015 | 0.16 | 0.31 | 1 | -0.44 | 18 | 19 |
| IL2/IL2R beta/gamma/JAK1/LCK/JAK3/PI3K | -0.084 | 0.16 | -10000 | 0 | -0.48 | 46 | 46 |
| HSP90AA1 | 0.028 | 0.008 | -10000 | 0 | -10000 | 0 | 0 |
| RELA | 0.03 | 0.003 | -10000 | 0 | -10000 | 0 | 0 |
| IL2RA | -0.091 | 0.24 | -10000 | 0 | -0.59 | 100 | 100 |
| IL2RB | -0.3 | 0.31 | -10000 | 0 | -0.58 | 270 | 270 |
| TERT | -0.049 | 0.2 | -10000 | 0 | -0.59 | 59 | 59 |
| E2F1 | -0.05 | 0.14 | -10000 | 0 | -0.41 | 27 | 27 |
| SOS1 | 0.03 | 0.006 | -10000 | 0 | -10000 | 0 | 0 |
| RPS6 | 0.027 | 0.039 | -10000 | 0 | -0.59 | 2 | 2 |
| mol:cAMP | 0.003 | 0.01 | 0.019 | 137 | -10000 | 0 | 137 |
| PTPN11 | 0.03 | 0.006 | -10000 | 0 | -10000 | 0 | 0 |
| IL2RG | -0.009 | 0.16 | -10000 | 0 | -0.59 | 34 | 34 |
| actin cytoskeleton organization | -0.047 | 0.16 | 0.3 | 1 | -0.45 | 36 | 37 |
| GRB2 | 0.03 | 0.005 | -10000 | 0 | -10000 | 0 | 0 |
| IL2 | 0.015 | 0.085 | -10000 | 0 | -0.59 | 10 | 10 |
| PIK3CA | 0.029 | 0.03 | -10000 | 0 | -0.63 | 1 | 1 |
| Rac1/GTP | 0.047 | 0.037 | -10000 | 0 | -0.34 | 2 | 2 |
| LCK | 0.005 | 0.13 | -10000 | 0 | -0.59 | 22 | 22 |
| BCL2 | -0.023 | 0.14 | 0.45 | 2 | -0.49 | 2 | 4 |
Figure S42. Get High-res Image This plot shows pathway concept perturbations across all samples against a permutation model. The concepts along the x-axis are sorted by lowest to highest mean activity for the real patient samples. Mean inferred activities are plotted along the y-axis as a colored band showing the average level and one standard deviation range. Real samples are shown in red and permuted samples in black.
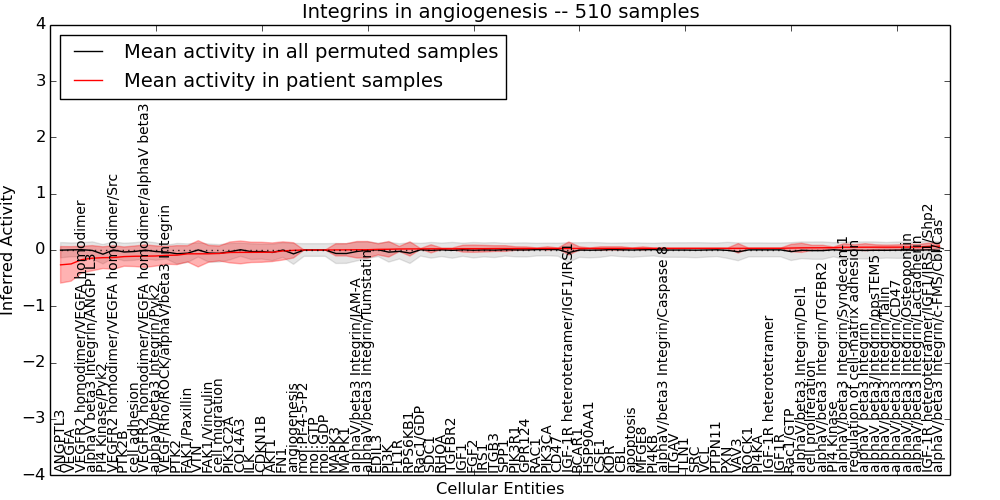
Table S42. Get Full Table This table displays mean, standard deviation, and perturbation statistics for Inferred Pathway Levels (IPLs). A mean perturbation of -9999 implies that the IPLs across all the real samples did not differ enough from the IPLs generated by a background model of permuted samples (> 1 Std.Dev from the permuted sample IPLs).
| Entity | Mean | Std.Dev | Mean.of.Up.Perturbations | Number.of.Up.Perturbations | Mean.of.Down.Perturbations | Number.of.Down.Perturbations | Number.of.Total.Perturbations |
|---|---|---|---|---|---|---|---|
| VEGFR2 homodimer/VEGFA homodimer | -0.17 | 0.24 | -10000 | 0 | -0.43 | 228 | 228 |
| alphaV beta3 Integrin | 0.05 | 0.063 | -10000 | 0 | -0.45 | 7 | 7 |
| PTK2 | -0.091 | 0.17 | 0.57 | 4 | -0.53 | 9 | 13 |
| IGF1R | 0.03 | 0.003 | -10000 | 0 | -10000 | 0 | 0 |
| PI4KB | 0.029 | 0.007 | -10000 | 0 | -10000 | 0 | 0 |
| MFGE8 | 0.029 | 0.027 | -10000 | 0 | -0.59 | 1 | 1 |
| SRC | 0.029 | 0.006 | -10000 | 0 | -10000 | 0 | 0 |
| CDKN1B | -0.041 | 0.18 | -10000 | 0 | -0.48 | 69 | 69 |
| VEGFA | -0.25 | 0.31 | -10000 | 0 | -0.59 | 228 | 228 |
| ILK | -0.042 | 0.18 | -10000 | 0 | -0.48 | 71 | 71 |
| ROCK1 | 0.03 | 0.004 | -10000 | 0 | -10000 | 0 | 0 |
| AKT1 | -0.04 | 0.16 | -10000 | 0 | -0.45 | 68 | 68 |
| PTK2B | -0.12 | 0.17 | 0.36 | 2 | -0.5 | 2 | 4 |
| alphaV/beta3 Integrin/JAM-A | 0.005 | 0.15 | -10000 | 0 | -0.68 | 1 | 1 |
| CBL | 0.029 | 0.03 | -10000 | 0 | -0.64 | 1 | 1 |
| mol:GTP | 0 | 0 | -10000 | 0 | -10000 | 0 | 0 |
| alphaV beta3 Integrin/ANGPTL3 | -0.15 | 0.22 | -10000 | 0 | -0.4 | 213 | 213 |
| IGF-1R heterotetramer/IGF1/IRS1/Shp2 | 0.064 | 0.059 | -10000 | 0 | -0.34 | 9 | 9 |
| VEGF/Rho/ROCK/alphaV/beta3 Integrin | -0.095 | 0.16 | -10000 | 0 | -0.41 | 65 | 65 |
| alphaV/beta3 Integrin/Syndecan-1 | 0.049 | 0.063 | -10000 | 0 | -0.4 | 9 | 9 |
| PI4KA | 0.03 | 0.004 | -10000 | 0 | -10000 | 0 | 0 |
| IGF-1R heterotetramer/IGF1/IRS1 | 0.028 | 0.12 | -10000 | 0 | -0.62 | 4 | 4 |
| PI4 Kinase | 0.042 | 0.011 | -10000 | 0 | -10000 | 0 | 0 |
| PIK3CA | 0.027 | 0.03 | -10000 | 0 | -0.64 | 1 | 1 |
| alphaV/beta3 Integrin/Osteopontin | 0.052 | 0.05 | -10000 | 0 | -0.4 | 5 | 5 |
| RPS6KB1 | 0.019 | 0.13 | 0.47 | 12 | -0.57 | 4 | 16 |
| TLN1 | 0.029 | 0.006 | -10000 | 0 | -10000 | 0 | 0 |
| MAPK3 | 0.002 | 0.11 | -10000 | 0 | -0.64 | 7 | 7 |
| GPR124 | 0.026 | 0.028 | -10000 | 0 | -0.59 | 1 | 1 |
| MAPK1 | 0.003 | 0.11 | -10000 | 0 | -0.64 | 7 | 7 |
| PXN | 0.029 | 0.006 | -10000 | 0 | -10000 | 0 | 0 |
| PIK3R1 | 0.026 | 0.031 | -10000 | 0 | -0.64 | 1 | 1 |
| alphaV/beta3 Integrin/Tumstatin | 0.005 | 0.15 | -10000 | 0 | -0.41 | 54 | 54 |
| cell adhesion | -0.11 | 0.18 | -10000 | 0 | -0.37 | 23 | 23 |
| ANGPTL3 | -0.26 | 0.32 | -10000 | 0 | -0.62 | 232 | 232 |
| VEGFR2 homodimer/VEGFA homodimer/Src | -0.13 | 0.21 | -10000 | 0 | -0.37 | 224 | 224 |
| IGF-1R heterotetramer | 0.03 | 0.003 | -10000 | 0 | -10000 | 0 | 0 |
| Rac1/GDP | 0.02 | 0.007 | -10000 | 0 | -10000 | 0 | 0 |
| TGFBR2 | 0.022 | 0.014 | -10000 | 0 | -10000 | 0 | 0 |
| ITGB3 | 0.025 | 0.051 | -10000 | 0 | -0.64 | 3 | 3 |
| IGF1 | 0.023 | 0.061 | -10000 | 0 | -0.59 | 5 | 5 |
| RAC1 | 0.027 | 0.009 | -10000 | 0 | -10000 | 0 | 0 |
| regulation of cell-matrix adhesion | 0.049 | 0.042 | -10000 | 0 | -0.4 | 3 | 3 |
| apoptosis | 0.029 | 0.007 | -10000 | 0 | -10000 | 0 | 0 |
| CD47 | 0.028 | 0.009 | -10000 | 0 | -10000 | 0 | 0 |
| alphaV/beta3 Integrin/CD47 | 0.05 | 0.041 | -10000 | 0 | -0.4 | 3 | 3 |
| VCL | 0.029 | 0.006 | -10000 | 0 | -10000 | 0 | 0 |
| alphaV/beta3 Integrin/Del1 | 0.038 | 0.081 | -10000 | 0 | -0.41 | 14 | 14 |
| CSF1 | 0.028 | 0.03 | -10000 | 0 | -0.64 | 1 | 1 |
| PIK3C2A | -0.044 | 0.19 | -10000 | 0 | -0.49 | 72 | 72 |
| PI4 Kinase/Pyk2 | -0.14 | 0.19 | -10000 | 0 | -0.55 | 42 | 42 |
| VEGFR2 homodimer/VEGFA homodimer/alphaV beta3 Integrin | -0.11 | 0.2 | -10000 | 0 | -0.33 | 219 | 219 |
| FAK1/Vinculin | -0.067 | 0.15 | 0.59 | 3 | -0.47 | 4 | 7 |
| alphaV beta3/Integrin/ppsTEM5 | 0.05 | 0.042 | -10000 | 0 | -0.4 | 3 | 3 |
| RHOA | 0.021 | 0.014 | -10000 | 0 | -10000 | 0 | 0 |
| VTN | -0.068 | 0.23 | -10000 | 0 | -0.62 | 76 | 76 |
| BCAR1 | 0.028 | 0.03 | -10000 | 0 | -0.64 | 1 | 1 |
| FGF2 | 0.023 | 0.065 | -10000 | 0 | -0.62 | 5 | 5 |
| F11R | 0.018 | 0.045 | -10000 | 0 | -0.47 | 4 | 4 |
| alphaV/beta3 Integrin/Lactadherin | 0.053 | 0.043 | -10000 | 0 | -0.39 | 4 | 4 |
| alphaV/beta3 Integrin/TGFBR2 | 0.04 | 0.044 | -10000 | 0 | -0.4 | 3 | 3 |
| alphaV/beta3 Integrin/c-FMS/Cbl/Cas | 0.068 | 0.046 | -10000 | 0 | -0.54 | 2 | 2 |
| HSP90AA1 | 0.028 | 0.008 | -10000 | 0 | -10000 | 0 | 0 |
| alphaV/beta3 Integrin/Talin | 0.05 | 0.037 | -10000 | 0 | -0.37 | 3 | 3 |
| mol:GDP | 0 | 0 | -10000 | 0 | -10000 | 0 | 0 |
| FN1 | -0.017 | 0.16 | -10000 | 0 | -0.59 | 37 | 37 |
| alphaV/beta3 Integrin/Pyk2 | -0.11 | 0.18 | -10000 | 0 | -0.41 | 5 | 5 |
| SDC1 | 0.021 | 0.072 | -10000 | 0 | -0.64 | 6 | 6 |
| VAV3 | 0.029 | 0.085 | 0.36 | 7 | -0.67 | 1 | 8 |
| PTPN11 | 0.029 | 0.006 | -10000 | 0 | -10000 | 0 | 0 |
| IRS1 | 0.023 | 0.059 | -10000 | 0 | -0.64 | 4 | 4 |
| FAK1/Paxillin | -0.068 | 0.14 | 0.53 | 2 | -0.5 | 3 | 5 |
| cell migration | -0.061 | 0.13 | 0.52 | 2 | -0.45 | 3 | 5 |
| ITGAV | 0.029 | 0.007 | -10000 | 0 | -10000 | 0 | 0 |
| PI3K | 0.013 | 0.14 | -10000 | 0 | -0.92 | 1 | 1 |
| SPP1 | 0.026 | 0.051 | -10000 | 0 | -0.64 | 3 | 3 |
| KDR | 0.028 | 0.03 | -10000 | 0 | -0.64 | 1 | 1 |
| mol:PI-4-5-P2 | 0 | 0 | -10000 | 0 | -10000 | 0 | 0 |
| alphaV/beta3 Integrin/Caspase 8 | 0.029 | 0.007 | -10000 | 0 | -10000 | 0 | 0 |
| COL4A3 | -0.042 | 0.2 | -10000 | 0 | -0.61 | 57 | 57 |
| angiogenesis | -0.006 | 0.14 | 0.32 | 4 | -0.66 | 7 | 11 |
| Rac1/GTP | 0.035 | 0.066 | -10000 | 0 | -0.62 | 1 | 1 |
| EDIL3 | 0.011 | 0.099 | -10000 | 0 | -0.59 | 13 | 13 |
| cell proliferation | 0.039 | 0.044 | -10000 | 0 | -0.4 | 3 | 3 |
Figure S43. Get High-res Image This plot shows pathway concept perturbations across all samples against a permutation model. The concepts along the x-axis are sorted by lowest to highest mean activity for the real patient samples. Mean inferred activities are plotted along the y-axis as a colored band showing the average level and one standard deviation range. Real samples are shown in red and permuted samples in black.
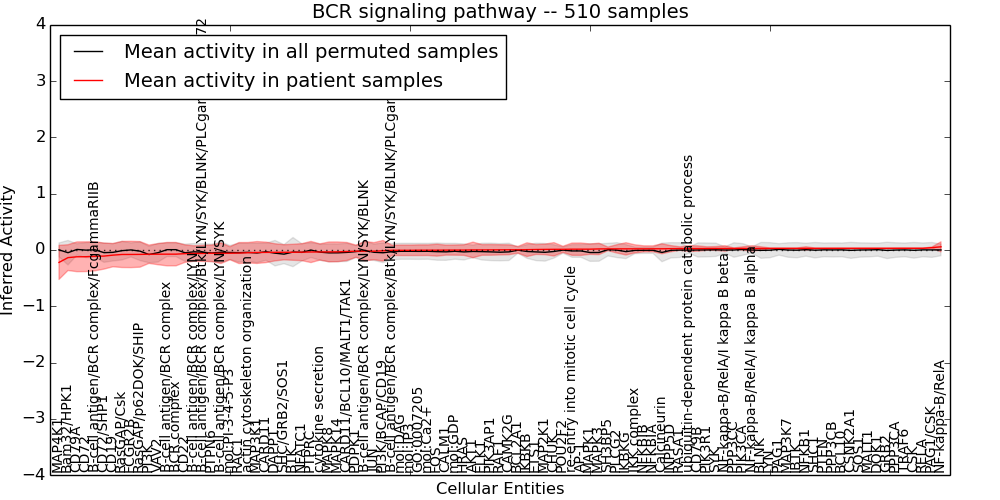
Table S43. Get Full Table This table displays mean, standard deviation, and perturbation statistics for Inferred Pathway Levels (IPLs). A mean perturbation of -9999 implies that the IPLs across all the real samples did not differ enough from the IPLs generated by a background model of permuted samples (> 1 Std.Dev from the permuted sample IPLs).
| Entity | Mean | Std.Dev | Mean.of.Up.Perturbations | Number.of.Up.Perturbations | Mean.of.Down.Perturbations | Number.of.Down.Perturbations | Number.of.Total.Perturbations |
|---|---|---|---|---|---|---|---|
| JUN | -0.021 | 0.15 | 0.37 | 13 | -0.43 | 13 | 26 |
| IKBKB | 0.006 | 0.12 | 0.32 | 20 | -0.3 | 6 | 26 |
| AKT1 | 0.001 | 0.14 | 0.39 | 26 | -0.27 | 9 | 35 |
| IKBKG | 0.02 | 0.11 | 0.32 | 16 | -0.29 | 1 | 17 |
| CALM1 | -0.002 | 0.089 | 0.36 | 1 | -10000 | 0 | 1 |
| PIK3CA | 0.027 | 0.03 | -10000 | 0 | -0.64 | 1 | 1 |
| MAP3K1 | -0.045 | 0.2 | 0.39 | 19 | -0.46 | 33 | 52 |
| MAP3K7 | 0.028 | 0.007 | -10000 | 0 | -10000 | 0 | 0 |
| mol:Ca2+ | -0.003 | 0.094 | 0.28 | 1 | -0.32 | 6 | 7 |
| DOK1 | 0.029 | 0.005 | -10000 | 0 | -10000 | 0 | 0 |
| AP-1 | 0.015 | 0.11 | 0.29 | 23 | -0.27 | 8 | 31 |
| LYN | 0.028 | 0.007 | -10000 | 0 | -10000 | 0 | 0 |
| BLNK | 0.028 | 0.03 | -10000 | 0 | -0.64 | 1 | 1 |
| SHC1 | 0.029 | 0.007 | -10000 | 0 | -10000 | 0 | 0 |
| BCR complex | -0.074 | 0.21 | -10000 | 0 | -0.44 | 122 | 122 |
| CD22 | -0.064 | 0.16 | -10000 | 0 | -0.5 | 28 | 28 |
| CAMK2G | 0.004 | 0.088 | 0.35 | 1 | -10000 | 0 | 1 |
| CSNK2A1 | 0.029 | 0.006 | -10000 | 0 | -10000 | 0 | 0 |
| INPP5D | 0.024 | 0.055 | -10000 | 0 | -0.59 | 4 | 4 |
| SHC/GRB2/SOS1 | -0.041 | 0.14 | -10000 | 0 | -0.55 | 3 | 3 |
| GO:0007205 | -0.004 | 0.095 | 0.28 | 1 | -0.33 | 6 | 7 |
| SYK | 0.027 | 0.034 | -10000 | 0 | -0.48 | 2 | 2 |
| ELK1 | 0.001 | 0.095 | 0.28 | 2 | -10000 | 0 | 2 |
| NFATC1 | -0.039 | 0.15 | 0.39 | 6 | -0.39 | 27 | 33 |
| B-cell antigen/BCR complex | -0.074 | 0.21 | -10000 | 0 | -0.44 | 122 | 122 |
| PAG1/CSK | 0.042 | 0.011 | -10000 | 0 | -10000 | 0 | 0 |
| NFKBIB | 0.021 | 0.053 | 0.15 | 25 | -0.13 | 7 | 32 |
| HRAS | -0.001 | 0.094 | 0.31 | 2 | -0.33 | 3 | 5 |
| NFKBIA | 0.021 | 0.052 | 0.15 | 25 | -0.12 | 5 | 30 |
| NF-kappa-B/RelA/I kappa B beta | 0.027 | 0.049 | 0.16 | 18 | -0.17 | 1 | 19 |
| RasGAP/Csk | -0.079 | 0.23 | -10000 | 0 | -0.61 | 46 | 46 |
| mol:GDP | -0.002 | 0.091 | 0.28 | 2 | -0.33 | 4 | 6 |
| PTEN | 0.029 | 0.006 | -10000 | 0 | -10000 | 0 | 0 |
| CD79B | 0.026 | 0.047 | -10000 | 0 | -0.59 | 3 | 3 |
| NF-kappa-B/RelA/I kappa B alpha | 0.027 | 0.049 | 0.16 | 18 | -0.17 | 1 | 19 |
| GRB2 | 0.029 | 0.005 | -10000 | 0 | -10000 | 0 | 0 |
| PI3K/BCAP/CD19 | -0.014 | 0.18 | 0.4 | 14 | -0.43 | 27 | 41 |
| PIK3R1 | 0.026 | 0.031 | -10000 | 0 | -0.64 | 1 | 1 |
| mol:IP3 | -0.006 | 0.093 | 0.28 | 1 | -0.33 | 6 | 7 |
| CSK | 0.03 | 0.003 | -10000 | 0 | -10000 | 0 | 0 |
| FOS | -0.003 | 0.11 | 0.34 | 4 | -0.48 | 4 | 8 |
| CHUK | 0.012 | 0.12 | 0.3 | 19 | -0.32 | 8 | 27 |
| IBTK | 0.028 | 0.007 | -10000 | 0 | -10000 | 0 | 0 |
| CARD11/BCL10/MALT1/TAK1 | -0.027 | 0.16 | 0.39 | 1 | -0.38 | 33 | 34 |
| PTPN6 | -0.058 | 0.15 | -10000 | 0 | -0.48 | 26 | 26 |
| RELA | 0.03 | 0.003 | -10000 | 0 | -10000 | 0 | 0 |
| BCL2A1 | 0.004 | 0.06 | 0.15 | 12 | -0.13 | 3 | 15 |
| VAV2 | -0.074 | 0.19 | -10000 | 0 | -0.5 | 61 | 61 |
| ubiquitin-dependent protein catabolic process | 0.025 | 0.052 | 0.15 | 25 | -0.12 | 5 | 30 |
| BTK | -0.04 | 0.14 | -10000 | 0 | -0.88 | 10 | 10 |
| CD19 | -0.091 | 0.21 | -10000 | 0 | -0.56 | 65 | 65 |
| MAP4K1 | -0.22 | 0.3 | -10000 | 0 | -0.59 | 207 | 207 |
| CD72 | -0.12 | 0.26 | -10000 | 0 | -0.59 | 122 | 122 |
| PAG1 | 0.028 | 0.007 | -10000 | 0 | -10000 | 0 | 0 |
| MAPK14 | -0.032 | 0.18 | 0.37 | 21 | -0.4 | 28 | 49 |
| SH3BP5 | 0.02 | 0.032 | -10000 | 0 | -0.63 | 1 | 1 |
| PIK3AP1 | 0.002 | 0.095 | 0.3 | 1 | -0.45 | 3 | 4 |
| B-cell antigen/BCR complex/Btk/LYN/SYK/BLNK/PLCgamma2/CD72 | -0.061 | 0.14 | -10000 | 0 | -0.45 | 13 | 13 |
| RAF1 | 0.003 | 0.091 | 0.31 | 3 | -10000 | 0 | 3 |
| RasGAP/p62DOK/SHIP | -0.078 | 0.23 | -10000 | 0 | -0.61 | 46 | 46 |
| CD79A | -0.12 | 0.26 | -10000 | 0 | -0.59 | 124 | 124 |
| re-entry into mitotic cell cycle | 0.014 | 0.11 | 0.29 | 22 | -0.28 | 6 | 28 |
| RASA1 | 0.025 | 0.031 | -10000 | 0 | -0.64 | 1 | 1 |
| MAPK3 | 0.019 | 0.1 | 0.37 | 11 | -10000 | 0 | 11 |
| MAPK1 | 0.015 | 0.092 | 0.38 | 5 | -10000 | 0 | 5 |
| CD72/SHP1 | -0.11 | 0.23 | 0.34 | 1 | -0.54 | 86 | 87 |
| NFKB1 | 0.029 | 0.03 | -10000 | 0 | -0.64 | 1 | 1 |
| MAPK8 | -0.034 | 0.18 | 0.37 | 22 | -0.4 | 28 | 50 |
| actin cytoskeleton organization | -0.048 | 0.18 | 0.36 | 5 | -0.44 | 57 | 62 |
| NF-kappa-B/RelA | 0.057 | 0.089 | 0.27 | 25 | -10000 | 0 | 25 |
| Calcineurin | 0.022 | 0.088 | -10000 | 0 | -10000 | 0 | 0 |
| PI3K | -0.075 | 0.16 | -10000 | 0 | -0.47 | 45 | 45 |
| B-cell antigen/BCR complex/Btk/LYN/SYK/BLNK/PLCgamma2 | -0.006 | 0.09 | 0.31 | 1 | -0.38 | 6 | 7 |
| SOS1 | 0.029 | 0.005 | -10000 | 0 | -10000 | 0 | 0 |
| Bam32/HPK1 | -0.14 | 0.23 | -10000 | 0 | -0.58 | 42 | 42 |
| DAPP1 | -0.041 | 0.15 | -10000 | 0 | -0.69 | 11 | 11 |
| cytokine secretion | -0.035 | 0.14 | 0.37 | 7 | -0.36 | 27 | 34 |
| mol:DAG | -0.006 | 0.093 | 0.28 | 1 | -0.33 | 6 | 7 |
| PLCG2 | 0.02 | 0.074 | -10000 | 0 | -0.61 | 7 | 7 |
| MAP2K1 | 0.011 | 0.094 | 0.35 | 5 | -10000 | 0 | 5 |
| B-cell antigen/BCR complex/FcgammaRIIB | -0.11 | 0.26 | -10000 | 0 | -0.46 | 161 | 161 |
| mol:PI-3-4-5-P3 | -0.057 | 0.12 | -10000 | 0 | -0.34 | 37 | 37 |
| ETS1 | 0.009 | 0.088 | 0.43 | 2 | -10000 | 0 | 2 |
| B-cell antigen/BCR complex/LYN/SYK/BLNK | -0.021 | 0.17 | -10000 | 0 | -0.61 | 3 | 3 |
| B-cell antigen/BCR complex/LYN | -0.062 | 0.14 | -10000 | 0 | -0.4 | 34 | 34 |
| MALT1 | 0.029 | 0.005 | -10000 | 0 | -10000 | 0 | 0 |
| TRAF6 | 0.03 | 0.003 | -10000 | 0 | -10000 | 0 | 0 |
| RAC1 | -0.054 | 0.19 | 0.33 | 2 | -0.47 | 57 | 59 |
| B-cell antigen/BCR complex/LYN/SYK | -0.058 | 0.18 | -10000 | 0 | -0.53 | 27 | 27 |
| CARD11 | -0.042 | 0.18 | 0.36 | 8 | -0.42 | 54 | 62 |
| FCGR2B | -0.079 | 0.23 | -10000 | 0 | -0.59 | 89 | 89 |
| PPP3CA | 0.03 | 0.004 | -10000 | 0 | -10000 | 0 | 0 |
| BCL10 | 0.029 | 0.006 | -10000 | 0 | -10000 | 0 | 0 |
| IKK complex | 0.021 | 0.072 | 0.19 | 37 | -10000 | 0 | 37 |
| PTPRC | -0.035 | 0.19 | -10000 | 0 | -0.59 | 53 | 53 |
| PDPK1 | -0.021 | 0.11 | 0.33 | 10 | -0.28 | 9 | 19 |
| PPP3CB | 0.029 | 0.006 | -10000 | 0 | -10000 | 0 | 0 |
| PPP3CC | 0.027 | 0.009 | -10000 | 0 | -10000 | 0 | 0 |
| POU2F2 | 0.012 | 0.054 | 0.15 | 12 | -0.12 | 2 | 14 |
Figure S44. Get High-res Image This plot shows pathway concept perturbations across all samples against a permutation model. The concepts along the x-axis are sorted by lowest to highest mean activity for the real patient samples. Mean inferred activities are plotted along the y-axis as a colored band showing the average level and one standard deviation range. Real samples are shown in red and permuted samples in black.
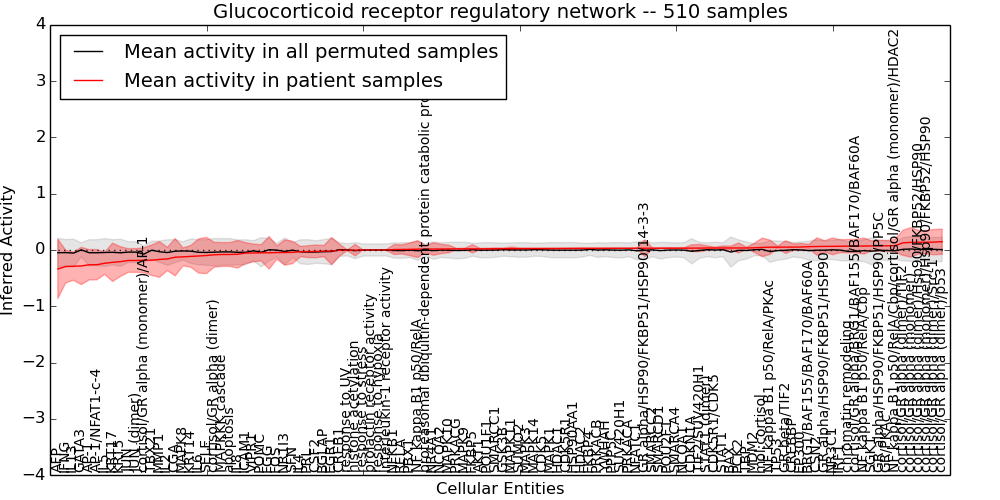
Table S44. Get Full Table This table displays mean, standard deviation, and perturbation statistics for Inferred Pathway Levels (IPLs). A mean perturbation of -9999 implies that the IPLs across all the real samples did not differ enough from the IPLs generated by a background model of permuted samples (> 1 Std.Dev from the permuted sample IPLs).
| Entity | Mean | Std.Dev | Mean.of.Up.Perturbations | Number.of.Up.Perturbations | Mean.of.Down.Perturbations | Number.of.Down.Perturbations | Number.of.Total.Perturbations |
|---|---|---|---|---|---|---|---|
| PCK2 | 0.036 | 0.089 | -10000 | 0 | -1.2 | 1 | 1 |
| SMARCC2 | 0.031 | 0.005 | -10000 | 0 | -10000 | 0 | 0 |
| SMARCC1 | 0.023 | 0.015 | -10000 | 0 | -10000 | 0 | 0 |
| TBX21 | -0.18 | 0.27 | 0.42 | 3 | -0.55 | 170 | 173 |
| SUMO2 | 0.024 | 0.011 | -10000 | 0 | -10000 | 0 | 0 |
| STAT1 (dimer) | 0.036 | 0.038 | -10000 | 0 | -0.8 | 1 | 1 |
| FKBP4 | 0.029 | 0.006 | -10000 | 0 | -10000 | 0 | 0 |
| FKBP5 | 0.02 | 0.073 | -10000 | 0 | -0.59 | 7 | 7 |
| GR alpha/HSP90/FKBP51/HSP90 | 0.064 | 0.1 | 0.36 | 5 | -0.42 | 2 | 7 |
| PRL | -0.029 | 0.11 | -10000 | 0 | -0.62 | 5 | 5 |
| cortisol/GR alpha (dimer)/TIF2 | 0.13 | 0.22 | 0.54 | 54 | -0.43 | 2 | 56 |
| RELA | 0.01 | 0.082 | -10000 | 0 | -0.31 | 1 | 1 |
| FGG | -0.05 | 0.29 | 0.49 | 15 | -0.5 | 85 | 100 |
| GR beta/TIF2 | 0.051 | 0.11 | 0.36 | 7 | -0.44 | 5 | 12 |
| IFNG | -0.29 | 0.29 | -10000 | 0 | -0.67 | 137 | 137 |
| apoptosis | -0.08 | 0.21 | -10000 | 0 | -0.6 | 27 | 27 |
| CREB1 | -0.003 | 0.11 | -10000 | 0 | -0.34 | 42 | 42 |
| histone acetylation | -0.003 | 0.1 | 0.31 | 3 | -0.39 | 7 | 10 |
| BGLAP | -0.019 | 0.099 | -10000 | 0 | -0.63 | 2 | 2 |
| GR/PKAc | 0.075 | 0.094 | 0.38 | 3 | -0.36 | 1 | 4 |
| NF kappa B1 p50/RelA | 0.016 | 0.15 | -10000 | 0 | -0.46 | 22 | 22 |
| SMARCD1 | 0.031 | 0.005 | -10000 | 0 | -10000 | 0 | 0 |
| MDM2 | 0.039 | 0.08 | 0.27 | 12 | -10000 | 0 | 12 |
| GATA3 | -0.28 | 0.33 | -10000 | 0 | -0.63 | 245 | 245 |
| AKT1 | 0.021 | 0.008 | -10000 | 0 | -10000 | 0 | 0 |
| CSF2 | -0.025 | 0.11 | -10000 | 0 | -0.58 | 6 | 6 |
| GSK3B | 0.023 | 0.012 | -10000 | 0 | -10000 | 0 | 0 |
| NR1I3 | -0.045 | 0.22 | -10000 | 0 | -0.7 | 17 | 17 |
| CSN2 | 0.062 | 0.16 | 0.42 | 11 | -0.38 | 1 | 12 |
| BRG1/BAF155/BAF170/BAF60A | 0.06 | 0.04 | -10000 | 0 | -10000 | 0 | 0 |
| NFATC1 | 0.031 | 0.007 | -10000 | 0 | -10000 | 0 | 0 |
| POU2F1 | 0.032 | 0.008 | -10000 | 0 | -10000 | 0 | 0 |
| CDKN1A | 0.033 | 0.059 | 0.85 | 1 | -10000 | 0 | 1 |
| response to stress | 0 | 0 | -10000 | 0 | -10000 | 0 | 0 |
| response to UV | -0.003 | 0.006 | -10000 | 0 | -10000 | 0 | 0 |
| SFN | -0.043 | 0.2 | -10000 | 0 | -0.59 | 59 | 59 |
| GR alpha/HSP90/FKBP51/HSP90/14-3-3 | 0.031 | 0.15 | 0.37 | 2 | -0.43 | 10 | 12 |
| prolactin receptor activity | 0 | 0 | -10000 | 0 | -10000 | 0 | 0 |
| EGR1 | -0.019 | 0.24 | -10000 | 0 | -0.72 | 15 | 15 |
| JUN | -0.19 | 0.21 | -10000 | 0 | -0.56 | 80 | 80 |
| IL4 | -0.029 | 0.093 | -10000 | 0 | -0.53 | 1 | 1 |
| CDK5R1 | 0.028 | 0.006 | -10000 | 0 | -10000 | 0 | 0 |
| PRKACA | 0.03 | 0.002 | -10000 | 0 | -10000 | 0 | 0 |
| cortisol/GR alpha (monomer)/AP-1 | -0.18 | 0.22 | 0.26 | 9 | -0.49 | 116 | 125 |
| GR alpha/HSP90/FKBP51/HSP90/PP5C | 0.074 | 0.1 | 0.38 | 3 | -0.39 | 2 | 5 |
| cortisol/GR alpha (monomer) | 0.14 | 0.26 | 0.62 | 59 | -0.48 | 1 | 60 |
| NCOA2 | 0.018 | 0.083 | -10000 | 0 | -0.64 | 8 | 8 |
| response to hypoxia | 0 | 0 | -10000 | 0 | -10000 | 0 | 0 |
| FOS | -0.046 | 0.12 | -10000 | 0 | -0.69 | 12 | 12 |
| AP-1/NFAT1-c-4 | -0.26 | 0.27 | -10000 | 0 | -0.68 | 93 | 93 |
| AFP | -0.34 | 0.53 | -10000 | 0 | -1.3 | 106 | 106 |
| SUV420H1 | 0.03 | 0.003 | -10000 | 0 | -10000 | 0 | 0 |
| IRF1 | 0.067 | 0.11 | 0.45 | 8 | -10000 | 0 | 8 |
| TP53 | 0.051 | 0.018 | -10000 | 0 | -10000 | 0 | 0 |
| PPP5C | 0.03 | 0.003 | -10000 | 0 | -10000 | 0 | 0 |
| KRT17 | -0.22 | 0.34 | -10000 | 0 | -0.96 | 65 | 65 |
| KRT14 | -0.11 | 0.19 | -10000 | 0 | -0.57 | 64 | 64 |
| TBP | 0.036 | 0.014 | -10000 | 0 | -10000 | 0 | 0 |
| CREBBP | 0.052 | 0.056 | -10000 | 0 | -10000 | 0 | 0 |
| HDAC1 | 0.027 | 0.006 | -10000 | 0 | -10000 | 0 | 0 |
| HDAC2 | 0.028 | 0.011 | -10000 | 0 | -10000 | 0 | 0 |
| AP-1 | -0.26 | 0.27 | -10000 | 0 | -0.68 | 94 | 94 |
| MAPK14 | 0.025 | 0.01 | -10000 | 0 | -10000 | 0 | 0 |
| MAPK10 | 0.019 | 0.067 | -10000 | 0 | -0.64 | 5 | 5 |
| MAPK11 | 0.024 | 0.03 | -10000 | 0 | -0.6 | 1 | 1 |
| KRT5 | -0.21 | 0.26 | -10000 | 0 | -0.71 | 70 | 70 |
| interleukin-1 receptor activity | 0 | 0.007 | -10000 | 0 | -10000 | 0 | 0 |
| NCOA1 | 0.032 | 0.007 | -10000 | 0 | -10000 | 0 | 0 |
| STAT1 | 0.036 | 0.038 | -10000 | 0 | -0.8 | 1 | 1 |
| CGA | -0.13 | 0.33 | -10000 | 0 | -1.1 | 49 | 49 |
| NF kappa B1 p50/RelA/Cbp/cortisol/GR alpha (monomer)/HDAC2 | 0.078 | 0.12 | 0.39 | 21 | -10000 | 0 | 21 |
| MAPK3 | 0.025 | 0.01 | -10000 | 0 | -10000 | 0 | 0 |
| MAPK1 | 0.026 | 0.009 | -10000 | 0 | -10000 | 0 | 0 |
| ICAM1 | -0.054 | 0.18 | -10000 | 0 | -0.64 | 26 | 26 |
| NFKB1 | 0.009 | 0.089 | -10000 | 0 | -0.55 | 2 | 2 |
| MAPK8 | -0.12 | 0.16 | -10000 | 0 | -0.45 | 40 | 40 |
| MAPK9 | 0.02 | 0.013 | -10000 | 0 | -10000 | 0 | 0 |
| cortisol/GR alpha (dimer) | -0.085 | 0.22 | -10000 | 0 | -0.63 | 27 | 27 |
| BAX | 0.036 | 0.033 | -10000 | 0 | -10000 | 0 | 0 |
| POMC | -0.05 | 0.14 | 0.49 | 1 | -0.76 | 6 | 7 |
| EP300 | 0.053 | 0.063 | -10000 | 0 | -0.53 | 1 | 1 |
| cortisol/GR alpha (dimer)/p53 | 0.15 | 0.22 | 0.55 | 56 | -10000 | 0 | 56 |
| proteasomal ubiquitin-dependent protein catabolic process | 0.016 | 0.061 | 0.24 | 3 | -10000 | 0 | 3 |
| SGK1 | 0.073 | 0.089 | -10000 | 0 | -10000 | 0 | 0 |
| IL13 | -0.29 | 0.25 | -10000 | 0 | -0.69 | 86 | 86 |
| IL6 | -0.11 | 0.3 | -10000 | 0 | -0.86 | 56 | 56 |
| PRKACG | 0.02 | 0.006 | -10000 | 0 | -10000 | 0 | 0 |
| IL5 | -0.24 | 0.2 | -10000 | 0 | -0.63 | 38 | 38 |
| IL2 | -0.16 | 0.21 | -10000 | 0 | -0.66 | 32 | 32 |
| CDK5 | 0.025 | 0.009 | -10000 | 0 | -10000 | 0 | 0 |
| PRKACB | 0.029 | 0.006 | -10000 | 0 | -10000 | 0 | 0 |
| HSP90AA1 | 0.028 | 0.008 | -10000 | 0 | -10000 | 0 | 0 |
| IL8 | -0.076 | 0.24 | -10000 | 0 | -0.75 | 40 | 40 |
| CDK5R1/CDK5 | 0.036 | 0.015 | -10000 | 0 | -10000 | 0 | 0 |
| NF kappa B1 p50/RelA/PKAc | 0.05 | 0.13 | -10000 | 0 | -0.54 | 2 | 2 |
| cortisol/GR alpha (dimer)/Hsp90/FKBP52/HSP90 | 0.14 | 0.21 | 0.53 | 52 | -10000 | 0 | 52 |
| SMARCA4 | 0.032 | 0.003 | -10000 | 0 | -10000 | 0 | 0 |
| chromatin remodeling | 0.069 | 0.12 | 0.39 | 18 | -10000 | 0 | 18 |
| NF kappa B1 p50/RelA/Cbp | 0.07 | 0.14 | -10000 | 0 | -0.54 | 4 | 4 |
| JUN (dimer) | -0.19 | 0.21 | -10000 | 0 | -0.56 | 80 | 80 |
| YWHAH | 0.03 | 0.004 | -10000 | 0 | -10000 | 0 | 0 |
| VIPR1 | -0.053 | 0.16 | -10000 | 0 | -0.73 | 17 | 17 |
| NR3C1 | 0.065 | 0.15 | 0.46 | 20 | -0.62 | 1 | 21 |
| NR4A1 | 0.017 | 0.11 | -10000 | 0 | -0.62 | 15 | 15 |
| TIF2/SUV420H1 | 0.034 | 0.065 | -10000 | 0 | -0.47 | 8 | 8 |
| MAPKKK cascade | -0.08 | 0.21 | -10000 | 0 | -0.6 | 27 | 27 |
| cortisol/GR alpha (dimer)/Src-1 | 0.14 | 0.22 | 0.55 | 56 | -0.5 | 1 | 57 |
| PBX1 | 0.012 | 0.11 | -10000 | 0 | -0.63 | 15 | 15 |
| POU1F1 | 0.021 | 0.011 | -10000 | 0 | -10000 | 0 | 0 |
| SELE | -0.098 | 0.32 | -10000 | 0 | -1.2 | 37 | 37 |
| cortisol/GR alpha/BRG1/BAF155/BAF170/BAF60A | 0.069 | 0.12 | 0.39 | 18 | -10000 | 0 | 18 |
| cortisol/GR alpha (monomer)/Hsp90/FKBP52/HSP90 | 0.14 | 0.21 | 0.53 | 52 | -10000 | 0 | 52 |
| mol:cortisol | 0.046 | 0.17 | 0.33 | 60 | -0.28 | 28 | 88 |
| MMP1 | -0.17 | 0.32 | -10000 | 0 | -0.74 | 94 | 94 |
Figure S45. Get High-res Image This plot shows pathway concept perturbations across all samples against a permutation model. The concepts along the x-axis are sorted by lowest to highest mean activity for the real patient samples. Mean inferred activities are plotted along the y-axis as a colored band showing the average level and one standard deviation range. Real samples are shown in red and permuted samples in black.
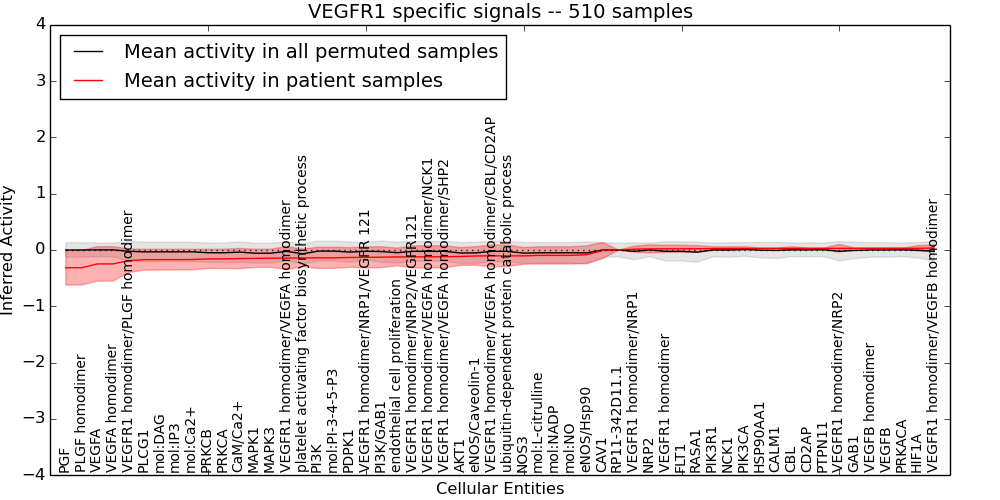
Table S45. Get Full Table This table displays mean, standard deviation, and perturbation statistics for Inferred Pathway Levels (IPLs). A mean perturbation of -9999 implies that the IPLs across all the real samples did not differ enough from the IPLs generated by a background model of permuted samples (> 1 Std.Dev from the permuted sample IPLs).
| Entity | Mean | Std.Dev | Mean.of.Up.Perturbations | Number.of.Up.Perturbations | Mean.of.Down.Perturbations | Number.of.Down.Perturbations | Number.of.Total.Perturbations |
|---|---|---|---|---|---|---|---|
| VEGFR1 homodimer/VEGFB homodimer | 0.035 | 0.056 | -10000 | 0 | -0.43 | 7 | 7 |
| VEGFR1 homodimer/NRP1 | 0.015 | 0.053 | -10000 | 0 | -0.43 | 7 | 7 |
| mol:DAG | -0.17 | 0.18 | -10000 | 0 | -0.51 | 16 | 16 |
| VEGFR1 homodimer/NRP1/VEGFR 121 | -0.13 | 0.19 | -10000 | 0 | -0.53 | 9 | 9 |
| CaM/Ca2+ | -0.15 | 0.18 | -10000 | 0 | -0.66 | 6 | 6 |
| HIF1A | 0.03 | 0.049 | -10000 | 0 | -0.62 | 2 | 2 |
| GAB1 | 0.03 | 0.004 | -10000 | 0 | -10000 | 0 | 0 |
| AKT1 | -0.12 | 0.16 | -10000 | 0 | -0.67 | 6 | 6 |
| PLCG1 | -0.17 | 0.19 | -10000 | 0 | -0.51 | 16 | 16 |
| NOS3 | -0.1 | 0.15 | -10000 | 0 | -0.54 | 10 | 10 |
| CBL | 0.029 | 0.03 | -10000 | 0 | -0.64 | 1 | 1 |
| mol:NO | -0.096 | 0.15 | 0.72 | 1 | -0.52 | 10 | 11 |
| FLT1 | 0.021 | 0.062 | -10000 | 0 | -0.5 | 7 | 7 |
| PGF | -0.32 | 0.31 | -10000 | 0 | -0.59 | 282 | 282 |
| VEGFR1 homodimer/NRP2/VEGFR121 | -0.12 | 0.2 | -10000 | 0 | -0.59 | 9 | 9 |
| CALM1 | 0.028 | 0.008 | -10000 | 0 | -10000 | 0 | 0 |
| PIK3CA | 0.027 | 0.03 | -10000 | 0 | -0.64 | 1 | 1 |
| eNOS/Hsp90 | -0.083 | 0.16 | 0.56 | 1 | -0.54 | 6 | 7 |
| endothelial cell proliferation | -0.12 | 0.16 | 0.59 | 1 | -0.57 | 8 | 9 |
| mol:Ca2+ | -0.17 | 0.18 | -10000 | 0 | -0.49 | 18 | 18 |
| MAPK3 | -0.15 | 0.16 | 0.46 | 2 | -0.59 | 6 | 8 |
| MAPK1 | -0.15 | 0.16 | 0.46 | 2 | -0.62 | 6 | 8 |
| PIK3R1 | 0.026 | 0.031 | -10000 | 0 | -0.64 | 1 | 1 |
| PLGF homodimer | -0.32 | 0.31 | -10000 | 0 | -0.59 | 282 | 282 |
| PRKACA | 0.03 | 0.002 | -10000 | 0 | -10000 | 0 | 0 |
| RP11-342D11.1 | 0 | 0 | -10000 | 0 | -10000 | 0 | 0 |
| CAV1 | -0.009 | 0.14 | -10000 | 0 | -0.59 | 30 | 30 |
| VEGFA homodimer | -0.25 | 0.31 | -10000 | 0 | -0.59 | 228 | 228 |
| VEGFR1 homodimer/VEGFA homodimer | -0.14 | 0.21 | -10000 | 0 | -0.57 | 9 | 9 |
| platelet activating factor biosynthetic process | -0.14 | 0.16 | 0.44 | 2 | -0.57 | 6 | 8 |
| PI3K | -0.14 | 0.19 | -10000 | 0 | -0.72 | 6 | 6 |
| PRKCA | -0.16 | 0.17 | 0.58 | 1 | -0.65 | 6 | 7 |
| PRKCB | -0.16 | 0.17 | 0.58 | 1 | -0.62 | 8 | 9 |
| VEGFR1 homodimer/PLGF homodimer | -0.19 | 0.21 | -10000 | 0 | -0.54 | 18 | 18 |
| VEGFA | -0.25 | 0.31 | -10000 | 0 | -0.59 | 228 | 228 |
| VEGFB | 0.03 | 0.003 | -10000 | 0 | -10000 | 0 | 0 |
| mol:IP3 | -0.17 | 0.18 | -10000 | 0 | -0.51 | 16 | 16 |
| RASA1 | 0.022 | 0.056 | -10000 | 0 | -0.46 | 5 | 5 |
| NRP2 | 0.02 | 0.072 | -10000 | 0 | -0.59 | 7 | 7 |
| VEGFR1 homodimer | 0.021 | 0.062 | -10000 | 0 | -0.5 | 7 | 7 |
| VEGFB homodimer | 0.03 | 0.003 | -10000 | 0 | -10000 | 0 | 0 |
| NCK1 | 0.027 | 0.03 | -10000 | 0 | -0.64 | 1 | 1 |
| eNOS/Caveolin-1 | -0.11 | 0.16 | -10000 | 0 | -0.52 | 26 | 26 |
| PTPN11 | 0.029 | 0.006 | -10000 | 0 | -10000 | 0 | 0 |
| mol:PI-3-4-5-P3 | -0.14 | 0.19 | -10000 | 0 | -0.71 | 6 | 6 |
| mol:L-citrulline | -0.096 | 0.15 | 0.72 | 1 | -0.52 | 10 | 11 |
| VEGFR1 homodimer/VEGFA homodimer/CBL/CD2AP | -0.1 | 0.19 | -10000 | 0 | -0.68 | 5 | 5 |
| VEGFR1 homodimer/VEGFA homodimer/NCK1 | -0.12 | 0.2 | -10000 | 0 | -0.6 | 8 | 8 |
| CD2AP | 0.029 | 0.006 | -10000 | 0 | -10000 | 0 | 0 |
| PI3K/GAB1 | -0.13 | 0.18 | -10000 | 0 | -0.69 | 6 | 6 |
| PDPK1 | -0.13 | 0.18 | 0.35 | 1 | -0.7 | 6 | 7 |
| VEGFR1 homodimer/VEGFA homodimer/SHP2 | -0.12 | 0.2 | -10000 | 0 | -0.58 | 7 | 7 |
| mol:NADP | -0.096 | 0.15 | 0.72 | 1 | -0.52 | 10 | 11 |
| HSP90AA1 | 0.028 | 0.008 | -10000 | 0 | -10000 | 0 | 0 |
| ubiquitin-dependent protein catabolic process | -0.1 | 0.19 | -10000 | 0 | -0.67 | 5 | 5 |
| VEGFR1 homodimer/NRP2 | 0.029 | 0.07 | -10000 | 0 | -0.43 | 7 | 7 |
Figure S46. Get High-res Image This plot shows pathway concept perturbations across all samples against a permutation model. The concepts along the x-axis are sorted by lowest to highest mean activity for the real patient samples. Mean inferred activities are plotted along the y-axis as a colored band showing the average level and one standard deviation range. Real samples are shown in red and permuted samples in black.
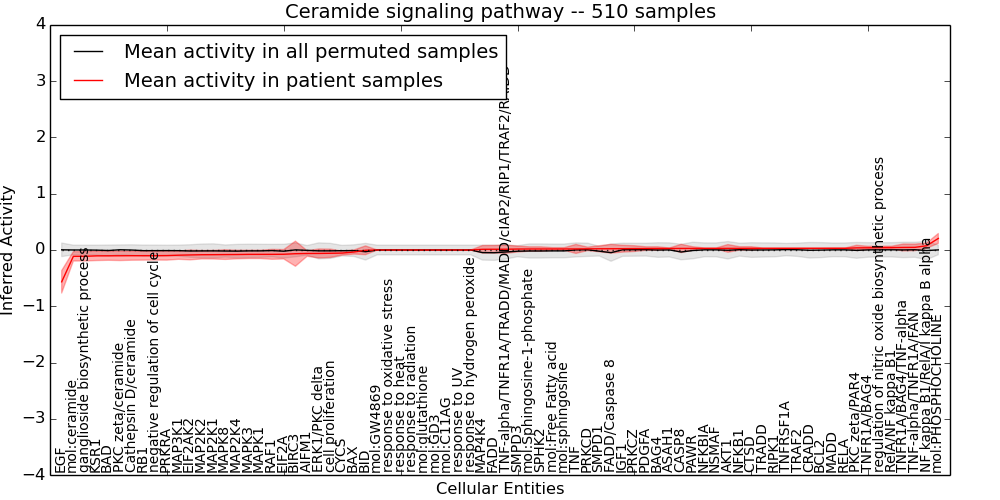
Table S46. Get Full Table This table displays mean, standard deviation, and perturbation statistics for Inferred Pathway Levels (IPLs). A mean perturbation of -9999 implies that the IPLs across all the real samples did not differ enough from the IPLs generated by a background model of permuted samples (> 1 Std.Dev from the permuted sample IPLs).
| Entity | Mean | Std.Dev | Mean.of.Up.Perturbations | Number.of.Up.Perturbations | Mean.of.Down.Perturbations | Number.of.Down.Perturbations | Number.of.Total.Perturbations |
|---|---|---|---|---|---|---|---|
| SPHK2 | 0.018 | 0.038 | -10000 | 0 | -0.47 | 3 | 3 |
| MAP4K4 | 0.013 | 0.067 | -10000 | 0 | -0.5 | 2 | 2 |
| BAG4 | 0.026 | 0.031 | -10000 | 0 | -0.64 | 1 | 1 |
| PKC zeta/ceramide | -0.1 | 0.085 | -10000 | 0 | -0.3 | 54 | 54 |
| NFKBIA | 0.028 | 0.008 | -10000 | 0 | -10000 | 0 | 0 |
| BIRC3 | -0.066 | 0.22 | -10000 | 0 | -0.59 | 79 | 79 |
| BAX | -0.036 | 0.036 | -10000 | 0 | -0.3 | 4 | 4 |
| RIPK1 | 0.029 | 0.006 | -10000 | 0 | -10000 | 0 | 0 |
| AKT1 | 0.028 | 0.069 | 0.89 | 3 | -10000 | 0 | 3 |
| BAD | -0.1 | 0.08 | -10000 | 0 | -0.3 | 48 | 48 |
| SMPD1 | 0.022 | 0.054 | 0.28 | 9 | -0.2 | 5 | 14 |
| RB1 | -0.1 | 0.079 | -10000 | 0 | -0.3 | 47 | 47 |
| FADD/Caspase 8 | 0.022 | 0.077 | -10000 | 0 | -0.48 | 3 | 3 |
| MAP2K4 | -0.08 | 0.076 | -10000 | 0 | -0.43 | 5 | 5 |
| NSMAF | 0.028 | 0.007 | -10000 | 0 | -10000 | 0 | 0 |
| response to UV | 0 | 0 | -10000 | 0 | -10000 | 0 | 0 |
| RAF1 | -0.077 | 0.088 | -10000 | 0 | -0.28 | 51 | 51 |
| EGF | -0.57 | 0.2 | -10000 | 0 | -0.63 | 460 | 460 |
| mol:ceramide | -0.11 | 0.084 | 0.18 | 2 | -0.3 | 56 | 58 |
| MADD | 0.03 | 0.003 | -10000 | 0 | -10000 | 0 | 0 |
| response to oxidative stress | 0 | 0 | -10000 | 0 | -10000 | 0 | 0 |
| mol:Free Fatty acid | 0.018 | 0.024 | -10000 | 0 | -0.47 | 1 | 1 |
| ASAH1 | 0.027 | 0.009 | -10000 | 0 | -10000 | 0 | 0 |
| negative regulation of cell cycle | -0.1 | 0.078 | -10000 | 0 | -0.3 | 47 | 47 |
| cell proliferation | -0.058 | 0.074 | -10000 | 0 | -0.4 | 8 | 8 |
| BID | -0.005 | 0.078 | -10000 | 0 | -0.57 | 5 | 5 |
| MAP3K1 | -0.092 | 0.073 | -10000 | 0 | -0.3 | 37 | 37 |
| EIF2A | -0.076 | 0.083 | 0.29 | 6 | -0.6 | 3 | 9 |
| TRADD | 0.029 | 0.006 | -10000 | 0 | -10000 | 0 | 0 |
| CRADD | 0.029 | 0.005 | -10000 | 0 | -10000 | 0 | 0 |
| MAPK3 | -0.078 | 0.074 | -10000 | 0 | -0.41 | 9 | 9 |
| response to heat | 0 | 0 | -10000 | 0 | -10000 | 0 | 0 |
| MAPK1 | -0.078 | 0.074 | -10000 | 0 | -0.46 | 7 | 7 |
| Cathepsin D/ceramide | -0.1 | 0.08 | -10000 | 0 | -0.3 | 48 | 48 |
| FADD | 0.013 | 0.067 | -10000 | 0 | -0.5 | 2 | 2 |
| KSR1 | -0.1 | 0.083 | 0.19 | 1 | -0.3 | 56 | 57 |
| MAPK8 | -0.081 | 0.086 | -10000 | 0 | -0.3 | 41 | 41 |
| PRKRA | -0.099 | 0.081 | 0.18 | 2 | -0.3 | 46 | 48 |
| PDGFA | 0.026 | 0.031 | -10000 | 0 | -0.64 | 1 | 1 |
| TRAF2 | 0.029 | 0.006 | -10000 | 0 | -10000 | 0 | 0 |
| IGF1 | 0.023 | 0.061 | -10000 | 0 | -0.59 | 5 | 5 |
| mol:GD3 | 0 | 0 | -10000 | 0 | -10000 | 0 | 0 |
| ganglioside biosynthetic process | -0.11 | 0.083 | 0.18 | 2 | -0.3 | 56 | 58 |
| CTSD | 0.029 | 0.03 | -10000 | 0 | -0.64 | 1 | 1 |
| regulation of nitric oxide biosynthetic process | 0.043 | 0.024 | -10000 | 0 | -0.47 | 1 | 1 |
| response to radiation | 0 | 0 | -10000 | 0 | -10000 | 0 | 0 |
| ERK1/PKC delta | -0.061 | 0.08 | -10000 | 0 | -0.44 | 8 | 8 |
| PRKCD | 0.02 | 0.03 | -10000 | 0 | -0.59 | 1 | 1 |
| PRKCZ | 0.025 | 0.051 | -10000 | 0 | -0.64 | 3 | 3 |
| mol:GW4869 | 0 | 0 | -10000 | 0 | -10000 | 0 | 0 |
| mol:sphingosine | 0.018 | 0.024 | -10000 | 0 | -0.47 | 1 | 1 |
| RelA/NF kappa B1 | 0.043 | 0.024 | -10000 | 0 | -0.47 | 1 | 1 |
| mol:glutathione | 0 | 0 | -10000 | 0 | -10000 | 0 | 0 |
| PAWR | 0.028 | 0.03 | -10000 | 0 | -0.64 | 1 | 1 |
| TNF-alpha/TNFR1A/TRADD/MADD/cIAP2/RIP1/TRAF2/RAIDD | 0.014 | 0.072 | -10000 | 0 | -0.53 | 2 | 2 |
| TNFR1A/BAG4/TNF-alpha | 0.045 | 0.062 | -10000 | 0 | -0.39 | 9 | 9 |
| mol:Sphingosine-1-phosphate | 0.018 | 0.038 | -10000 | 0 | -0.47 | 3 | 3 |
| MAP2K1 | -0.083 | 0.077 | -10000 | 0 | -0.48 | 7 | 7 |
| mol:C11AG | 0 | 0 | -10000 | 0 | -10000 | 0 | 0 |
| RELA | 0.03 | 0.003 | -10000 | 0 | -10000 | 0 | 0 |
| CYCS | -0.055 | 0.035 | -10000 | 0 | -0.31 | 4 | 4 |
| TNFRSF1A | 0.029 | 0.006 | -10000 | 0 | -10000 | 0 | 0 |
| NFKB1 | 0.028 | 0.03 | -10000 | 0 | -0.64 | 1 | 1 |
| TNFR1A/BAG4 | 0.039 | 0.027 | -10000 | 0 | -0.47 | 1 | 1 |
| EIF2AK2 | -0.088 | 0.087 | 0.27 | 6 | -0.28 | 46 | 52 |
| TNF-alpha/TNFR1A/FAN | 0.047 | 0.058 | -10000 | 0 | -0.38 | 8 | 8 |
| response to hydrogen peroxide | 0 | 0 | -10000 | 0 | -10000 | 0 | 0 |
| CASP8 | 0.028 | 0.073 | -10000 | 0 | -0.4 | 7 | 7 |
| MAP2K2 | -0.084 | 0.074 | -10000 | 0 | -0.46 | 7 | 7 |
| SMPD3 | 0.017 | 0.053 | 0.21 | 2 | -0.41 | 2 | 4 |
| TNF | 0.019 | 0.08 | -10000 | 0 | -0.61 | 8 | 8 |
| PKC zeta/PAR4 | 0.038 | 0.047 | -10000 | 0 | -0.47 | 4 | 4 |
| mol:PHOSPHOCHOLINE | 0.21 | 0.088 | 0.24 | 411 | -10000 | 0 | 411 |
| NF kappa B1/RelA/I kappa B alpha | 0.075 | 0.047 | -10000 | 0 | -0.34 | 3 | 3 |
| AIFM1 | -0.062 | 0.05 | -10000 | 0 | -0.35 | 4 | 4 |
| BCL2 | 0.029 | 0.005 | -10000 | 0 | -10000 | 0 | 0 |
Figure S47. Get High-res Image This plot shows pathway concept perturbations across all samples against a permutation model. The concepts along the x-axis are sorted by lowest to highest mean activity for the real patient samples. Mean inferred activities are plotted along the y-axis as a colored band showing the average level and one standard deviation range. Real samples are shown in red and permuted samples in black.
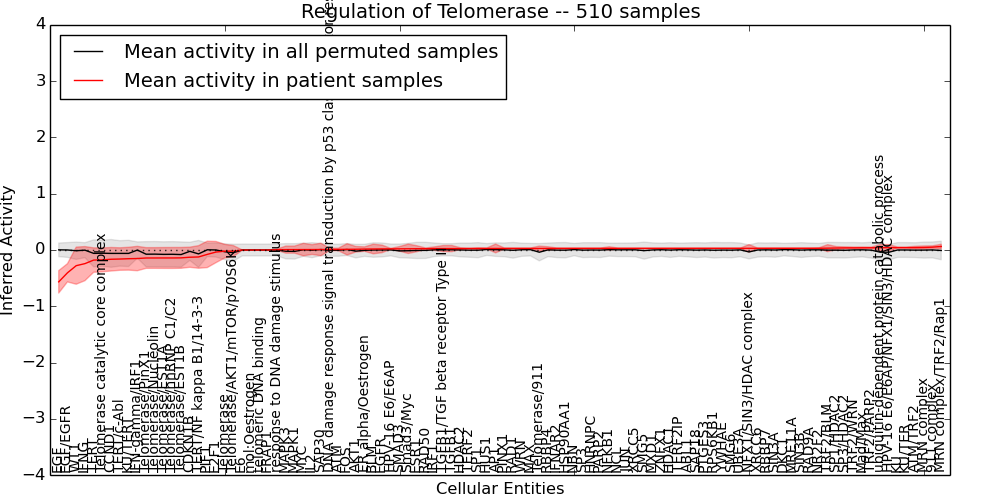
Table S47. Get Full Table This table displays mean, standard deviation, and perturbation statistics for Inferred Pathway Levels (IPLs). A mean perturbation of -9999 implies that the IPLs across all the real samples did not differ enough from the IPLs generated by a background model of permuted samples (> 1 Std.Dev from the permuted sample IPLs).
| Entity | Mean | Std.Dev | Mean.of.Up.Perturbations | Number.of.Up.Perturbations | Mean.of.Down.Perturbations | Number.of.Down.Perturbations | Number.of.Total.Perturbations |
|---|---|---|---|---|---|---|---|
| Telomerase catalytic core complex | -0.18 | 0.21 | 0.49 | 1 | -0.67 | 46 | 47 |
| RAD9A | 0.03 | 0.003 | -10000 | 0 | -10000 | 0 | 0 |
| AP1 | 0.027 | 0.078 | -10000 | 0 | -0.47 | 12 | 12 |
| IFNAR2 | 0.028 | 0.009 | -10000 | 0 | -10000 | 0 | 0 |
| AKT1 | 0.013 | 0.05 | -10000 | 0 | -0.36 | 3 | 3 |
| ER alpha/Oestrogen | 0.017 | 0.039 | -10000 | 0 | -0.4 | 4 | 4 |
| NFX1/SIN3/HDAC complex | 0.03 | 0.067 | -10000 | 0 | -0.37 | 6 | 6 |
| EGF | -0.57 | 0.2 | -10000 | 0 | -0.63 | 460 | 460 |
| SMG5 | 0.029 | 0.007 | -10000 | 0 | -10000 | 0 | 0 |
| SMG6 | 0.029 | 0.005 | -10000 | 0 | -10000 | 0 | 0 |
| SP3/HDAC2 | 0.038 | 0.019 | -10000 | 0 | -10000 | 0 | 0 |
| TERT/c-Abl | -0.16 | 0.2 | -10000 | 0 | -0.63 | 43 | 43 |
| SAP18 | 0.029 | 0.005 | -10000 | 0 | -10000 | 0 | 0 |
| MRN complex | 0.045 | 0.027 | -10000 | 0 | -10000 | 0 | 0 |
| WT1 | -0.28 | 0.33 | -10000 | 0 | -0.64 | 235 | 235 |
| WRN | 0.027 | 0.009 | -10000 | 0 | -10000 | 0 | 0 |
| SP1 | 0.026 | 0.014 | -10000 | 0 | -10000 | 0 | 0 |
| SP3 | 0.028 | 0.007 | -10000 | 0 | -10000 | 0 | 0 |
| TERF2IP | 0.029 | 0.006 | -10000 | 0 | -10000 | 0 | 0 |
| Telomerase/Nucleolin | -0.14 | 0.18 | -10000 | 0 | -0.61 | 31 | 31 |
| Mad/Max | 0.039 | 0.015 | -10000 | 0 | -10000 | 0 | 0 |
| TERT | -0.18 | 0.22 | 0.49 | 1 | -0.68 | 46 | 47 |
| CCND1 | -0.16 | 0.21 | 0.65 | 1 | -0.67 | 35 | 36 |
| MAX | 0.027 | 0.008 | -10000 | 0 | -10000 | 0 | 0 |
| RBBP7 | 0.03 | 0.003 | -10000 | 0 | -10000 | 0 | 0 |
| RBBP4 | 0.028 | 0.03 | -10000 | 0 | -0.64 | 1 | 1 |
| TERF2 | 0.026 | 0.007 | -10000 | 0 | -10000 | 0 | 0 |
| PTGES3 | 0.029 | 0.005 | -10000 | 0 | -10000 | 0 | 0 |
| SIN3A | 0.03 | 0.003 | -10000 | 0 | -10000 | 0 | 0 |
| Telomerase/911 | 0.027 | 0.042 | -10000 | 0 | -10000 | 0 | 0 |
| CDKN1B | -0.13 | 0.18 | -10000 | 0 | -0.35 | 134 | 134 |
| RAD1 | 0.027 | 0.009 | -10000 | 0 | -10000 | 0 | 0 |
| XRCC5 | 0.029 | 0.007 | -10000 | 0 | -10000 | 0 | 0 |
| XRCC6 | 0.03 | 0.004 | -10000 | 0 | -10000 | 0 | 0 |
| SAP30 | 0.009 | 0.11 | -10000 | 0 | -0.59 | 17 | 17 |
| TRF2/PARP2 | 0.04 | 0.013 | -10000 | 0 | -10000 | 0 | 0 |
| UBE3A | 0.029 | 0.004 | -10000 | 0 | -10000 | 0 | 0 |
| JUN | 0.029 | 0.006 | -10000 | 0 | -10000 | 0 | 0 |
| E6 | -0.001 | 0.003 | -10000 | 0 | -10000 | 0 | 0 |
| HPV-16 E6/E6AP | 0.02 | 0.009 | -10000 | 0 | -10000 | 0 | 0 |
| FOS | 0.012 | 0.1 | -10000 | 0 | -0.63 | 12 | 12 |
| IFN-gamma/IRF1 | -0.15 | 0.22 | -10000 | 0 | -0.42 | 191 | 191 |
| PARP2 | 0.028 | 0.007 | -10000 | 0 | -10000 | 0 | 0 |
| BLM | 0.018 | 0.086 | -10000 | 0 | -0.59 | 10 | 10 |
| Telomerase | -0.02 | 0.12 | -10000 | 0 | -0.43 | 9 | 9 |
| IRF1 | 0.025 | 0.031 | -10000 | 0 | -0.58 | 1 | 1 |
| ESR1 | 0.023 | 0.053 | -10000 | 0 | -0.55 | 4 | 4 |
| KU/TER | 0.042 | 0.011 | -10000 | 0 | -10000 | 0 | 0 |
| ATM/TRF2 | 0.043 | 0.023 | -10000 | 0 | -0.42 | 1 | 1 |
| ubiquitin-dependent protein catabolic process | 0.041 | 0.054 | -10000 | 0 | -0.43 | 1 | 1 |
| HPV-16 E6/E6AP/NFX1/SIN3/HDAC complex | 0.041 | 0.055 | -10000 | 0 | -0.44 | 1 | 1 |
| HDAC1 | 0.029 | 0.006 | -10000 | 0 | -10000 | 0 | 0 |
| HDAC2 | 0.025 | 0.014 | -10000 | 0 | -10000 | 0 | 0 |
| ATM | 0.01 | 0.022 | -10000 | 0 | -0.46 | 1 | 1 |
| SMAD3 | 0.021 | 0.041 | -10000 | 0 | -0.43 | 4 | 4 |
| ABL1 | 0.029 | 0.006 | -10000 | 0 | -10000 | 0 | 0 |
| MXD1 | 0.029 | 0.006 | -10000 | 0 | -10000 | 0 | 0 |
| MRE11A | 0.03 | 0.004 | -10000 | 0 | -10000 | 0 | 0 |
| HUS1 | 0.027 | 0.009 | -10000 | 0 | -10000 | 0 | 0 |
| RPS6KB1 | 0.029 | 0.005 | -10000 | 0 | -10000 | 0 | 0 |
| TERT/NF kappa B1/14-3-3 | -0.12 | 0.2 | -10000 | 0 | -0.68 | 23 | 23 |
| NR2F2 | 0.031 | 0.007 | -10000 | 0 | -10000 | 0 | 0 |
| MAPK3 | 0.007 | 0.063 | -10000 | 0 | -0.43 | 10 | 10 |
| MAPK1 | 0.007 | 0.063 | -10000 | 0 | -0.43 | 10 | 10 |
| TGFB1/TGF beta receptor Type II | 0.025 | 0.054 | -10000 | 0 | -0.58 | 4 | 4 |
| NFKB1 | 0.028 | 0.03 | -10000 | 0 | -0.64 | 1 | 1 |
| HNRNPC | 0.028 | 0.007 | -10000 | 0 | -10000 | 0 | 0 |
| DNA damage response signal transduction by p53 class mediator resulting in induction of apoptosis | 0.01 | 0.022 | -10000 | 0 | -0.46 | 1 | 1 |
| NBN | 0.028 | 0.007 | -10000 | 0 | -10000 | 0 | 0 |
| EGFR | 0.02 | 0.068 | -10000 | 0 | -0.6 | 6 | 6 |
| mol:Oestrogen | 0 | 0.002 | -10000 | 0 | -10000 | 0 | 0 |
| EGF/EGFR | -0.4 | 0.16 | -10000 | 0 | -0.47 | 418 | 418 |
| MYC | 0.008 | 0.11 | -10000 | 0 | -0.59 | 17 | 17 |
| IL2 | 0.008 | 0.087 | -10000 | 0 | -0.59 | 10 | 10 |
| KU | 0.042 | 0.011 | -10000 | 0 | -10000 | 0 | 0 |
| RAD50 | 0.023 | 0.013 | -10000 | 0 | -10000 | 0 | 0 |
| HSP90AA1 | 0.028 | 0.008 | -10000 | 0 | -10000 | 0 | 0 |
| TGFB1 | 0.025 | 0.054 | -10000 | 0 | -0.58 | 4 | 4 |
| TRF2/BLM | 0.033 | 0.063 | -10000 | 0 | -0.4 | 10 | 10 |
| FRAP1 | 0 | 0 | -10000 | 0 | -10000 | 0 | 0 |
| KU/TERT | -0.16 | 0.2 | -10000 | 0 | -0.64 | 42 | 42 |
| SP1/HDAC2 | 0.035 | 0.025 | -10000 | 0 | -10000 | 0 | 0 |
| PINX1 | 0.027 | 0.009 | -10000 | 0 | -10000 | 0 | 0 |
| Telomerase/EST1A | -0.14 | 0.19 | -10000 | 0 | -0.61 | 29 | 29 |
| Smad3/Myc | 0.022 | 0.084 | -10000 | 0 | -0.38 | 20 | 20 |
| 911 complex | 0.051 | 0.023 | -10000 | 0 | -10000 | 0 | 0 |
| IFNG | -0.24 | 0.3 | -10000 | 0 | -0.58 | 230 | 230 |
| Telomerase/PinX1 | -0.14 | 0.18 | -10000 | 0 | -0.6 | 31 | 31 |
| Telomerase/AKT1/mTOR/p70S6K | -0.02 | 0.098 | -10000 | 0 | -0.44 | 7 | 7 |
| SIN3B | 0.03 | 0.003 | -10000 | 0 | -10000 | 0 | 0 |
| YWHAE | 0.029 | 0.005 | -10000 | 0 | -10000 | 0 | 0 |
| Telomerase/EST1B | -0.14 | 0.18 | -10000 | 0 | -0.61 | 28 | 28 |
| response to DNA damage stimulus | 0.006 | 0.012 | -10000 | 0 | -10000 | 0 | 0 |
| MRN complex/TRF2/Rap1 | 0.062 | 0.039 | -10000 | 0 | -10000 | 0 | 0 |
| TRF2/WRN | 0.038 | 0.015 | -10000 | 0 | -10000 | 0 | 0 |
| Telomerase/hnRNP C1/C2 | -0.14 | 0.19 | -10000 | 0 | -0.61 | 28 | 28 |
| E2F1 | -0.036 | 0.19 | -10000 | 0 | -0.59 | 53 | 53 |
| ZNFX1 | 0.029 | 0.006 | -10000 | 0 | -10000 | 0 | 0 |
| PIF1 | -0.078 | 0.24 | -10000 | 0 | -0.59 | 89 | 89 |
| NCL | 0.029 | 0.007 | -10000 | 0 | -10000 | 0 | 0 |
| DKC1 | 0.03 | 0.004 | -10000 | 0 | -10000 | 0 | 0 |
| telomeric DNA binding | 0 | 0 | -10000 | 0 | -10000 | 0 | 0 |
Figure S48. Get High-res Image This plot shows pathway concept perturbations across all samples against a permutation model. The concepts along the x-axis are sorted by lowest to highest mean activity for the real patient samples. Mean inferred activities are plotted along the y-axis as a colored band showing the average level and one standard deviation range. Real samples are shown in red and permuted samples in black.
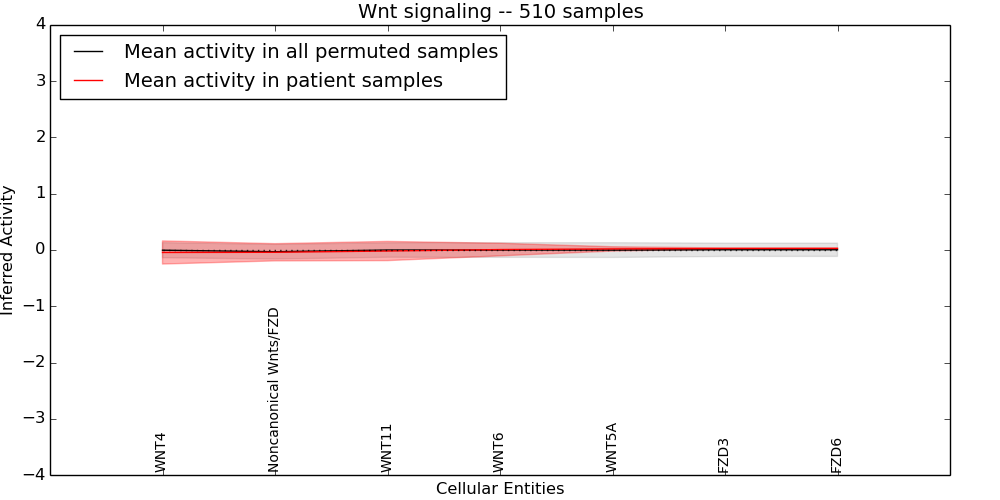
Table S48. Get Full Table This table displays mean, standard deviation, and perturbation statistics for Inferred Pathway Levels (IPLs). A mean perturbation of -9999 implies that the IPLs across all the real samples did not differ enough from the IPLs generated by a background model of permuted samples (> 1 Std.Dev from the permuted sample IPLs).
| Entity | Mean | Std.Dev | Mean.of.Up.Perturbations | Number.of.Up.Perturbations | Mean.of.Down.Perturbations | Number.of.Down.Perturbations | Number.of.Total.Perturbations |
|---|---|---|---|---|---|---|---|
| Noncanonical Wnts/FZD | -0.04 | 0.15 | -9999 | 0 | -0.43 | 46 | 46 |
| FZD6 | 0.028 | 0.007 | -9999 | 0 | -10000 | 0 | 0 |
| WNT6 | 0.008 | 0.11 | -9999 | 0 | -0.59 | 17 | 17 |
| WNT4 | -0.044 | 0.21 | -9999 | 0 | -0.62 | 57 | 57 |
| FZD3 | 0.027 | 0.009 | -9999 | 0 | -10000 | 0 | 0 |
| WNT5A | 0.019 | 0.039 | -9999 | 0 | -0.43 | 3 | 3 |
| WNT11 | -0.018 | 0.17 | -9999 | 0 | -0.63 | 37 | 37 |
Figure S49. Get High-res Image This plot shows pathway concept perturbations across all samples against a permutation model. The concepts along the x-axis are sorted by lowest to highest mean activity for the real patient samples. Mean inferred activities are plotted along the y-axis as a colored band showing the average level and one standard deviation range. Real samples are shown in red and permuted samples in black.
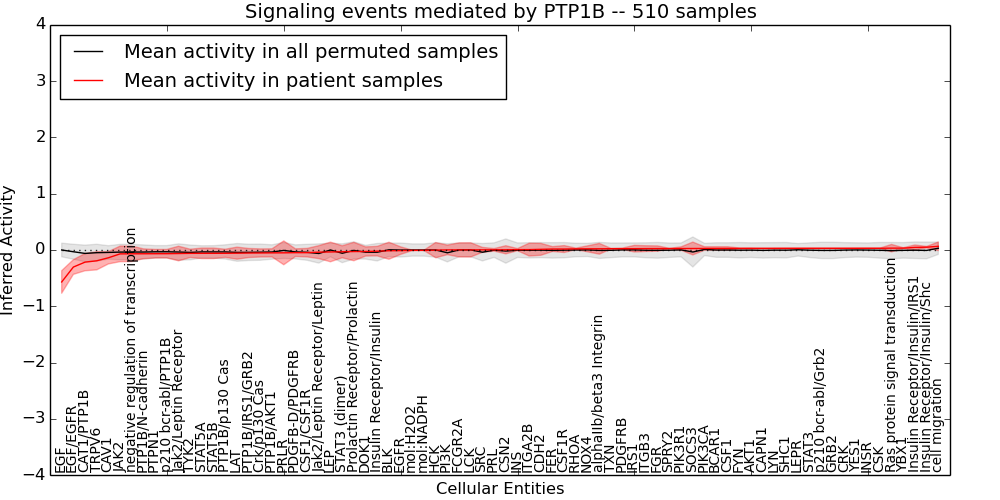
Table S49. Get Full Table This table displays mean, standard deviation, and perturbation statistics for Inferred Pathway Levels (IPLs). A mean perturbation of -9999 implies that the IPLs across all the real samples did not differ enough from the IPLs generated by a background model of permuted samples (> 1 Std.Dev from the permuted sample IPLs).
| Entity | Mean | Std.Dev | Mean.of.Up.Perturbations | Number.of.Up.Perturbations | Mean.of.Down.Perturbations | Number.of.Down.Perturbations | Number.of.Total.Perturbations |
|---|---|---|---|---|---|---|---|
| PDGFRB | 0.023 | 0.013 | -10000 | 0 | -10000 | 0 | 0 |
| Jak2/Leptin Receptor | -0.063 | 0.13 | -10000 | 0 | -0.44 | 26 | 26 |
| PTP1B/AKT1 | -0.051 | 0.072 | -10000 | 0 | -0.33 | 5 | 5 |
| FYN | 0.028 | 0.008 | -10000 | 0 | -10000 | 0 | 0 |
| p210 bcr-abl/PTP1B | -0.066 | 0.076 | 0.37 | 1 | -0.31 | 10 | 11 |
| EGFR | -0.011 | 0.067 | -10000 | 0 | -0.61 | 6 | 6 |
| EGF/EGFR | -0.3 | 0.13 | -10000 | 0 | -0.36 | 388 | 388 |
| CSF1 | 0.028 | 0.03 | -10000 | 0 | -0.64 | 1 | 1 |
| AKT1 | 0.028 | 0.008 | -10000 | 0 | -10000 | 0 | 0 |
| INSR | 0.03 | 0.004 | -10000 | 0 | -10000 | 0 | 0 |
| PTP1B/N-cadherin | -0.067 | 0.087 | -10000 | 0 | -0.38 | 15 | 15 |
| Insulin Receptor/Insulin | -0.02 | 0.085 | 0.3 | 1 | -10000 | 0 | 1 |
| HCK | -0.002 | 0.14 | -10000 | 0 | -0.59 | 26 | 26 |
| CRK | 0.029 | 0.005 | -10000 | 0 | -10000 | 0 | 0 |
| TYK2 | -0.059 | 0.074 | 0.34 | 1 | -0.36 | 4 | 5 |
| EGF | -0.57 | 0.2 | -10000 | 0 | -0.63 | 460 | 460 |
| YES1 | 0.03 | 0.004 | -10000 | 0 | -10000 | 0 | 0 |
| CAV1 | -0.14 | 0.11 | 0.32 | 5 | -0.32 | 47 | 52 |
| TXN | 0.023 | 0.006 | -10000 | 0 | -10000 | 0 | 0 |
| PTP1B/IRS1/GRB2 | -0.053 | 0.081 | 0.34 | 1 | -0.41 | 6 | 7 |
| cell migration | 0.066 | 0.076 | 0.31 | 10 | -0.37 | 1 | 11 |
| STAT3 | 0.029 | 0.005 | -10000 | 0 | -10000 | 0 | 0 |
| PRLR | -0.05 | 0.21 | -10000 | 0 | -0.64 | 59 | 59 |
| ITGA2B | 0.007 | 0.11 | -10000 | 0 | -0.59 | 18 | 18 |
| CSF1R | 0.017 | 0.061 | -10000 | 0 | -0.59 | 5 | 5 |
| Prolactin Receptor/Prolactin | -0.027 | 0.16 | -10000 | 0 | -0.48 | 59 | 59 |
| FGR | 0.025 | 0.048 | -10000 | 0 | -0.59 | 3 | 3 |
| PTP1B/p130 Cas | -0.058 | 0.072 | -10000 | 0 | -0.34 | 6 | 6 |
| Crk/p130 Cas | -0.052 | 0.072 | -10000 | 0 | -0.37 | 2 | 2 |
| DOK1 | -0.026 | 0.082 | 0.28 | 5 | -0.32 | 4 | 9 |
| JAK2 | -0.069 | 0.14 | 0.32 | 1 | -0.42 | 40 | 41 |
| Jak2/Leptin Receptor/Leptin | -0.038 | 0.12 | -10000 | 0 | -0.47 | 2 | 2 |
| PIK3R1 | 0.026 | 0.031 | -10000 | 0 | -0.64 | 1 | 1 |
| PTPN1 | -0.066 | 0.077 | 0.37 | 1 | -0.32 | 10 | 11 |
| LYN | 0.028 | 0.007 | -10000 | 0 | -10000 | 0 | 0 |
| CDH2 | 0.012 | 0.11 | -10000 | 0 | -0.61 | 14 | 14 |
| SRC | 0.003 | 0.044 | 0.34 | 1 | -0.66 | 1 | 2 |
| ITGB3 | 0.025 | 0.051 | -10000 | 0 | -0.64 | 3 | 3 |
| CAT1/PTP1B | -0.22 | 0.15 | 0.4 | 5 | -0.45 | 68 | 73 |
| CAPN1 | 0.028 | 0.003 | -10000 | 0 | -10000 | 0 | 0 |
| CSK | 0.03 | 0.003 | -10000 | 0 | -10000 | 0 | 0 |
| PI3K | 0.002 | 0.085 | -10000 | 0 | -0.56 | 1 | 1 |
| mol:H2O2 | -0.006 | 0.003 | -10000 | 0 | -10000 | 0 | 0 |
| STAT3 (dimer) | -0.031 | 0.11 | -10000 | 0 | -0.46 | 2 | 2 |
| negative regulation of transcription | -0.068 | 0.14 | 0.32 | 1 | -0.42 | 40 | 41 |
| FCGR2A | 0.002 | 0.12 | -10000 | 0 | -0.59 | 22 | 22 |
| FER | 0.017 | 0.043 | -10000 | 0 | -0.65 | 2 | 2 |
| alphaIIb/beta3 Integrin | 0.022 | 0.096 | -10000 | 0 | -0.44 | 21 | 21 |
| BLK | -0.013 | 0.15 | -10000 | 0 | -0.59 | 33 | 33 |
| Insulin Receptor/Insulin/Shc | 0.05 | 0.013 | -10000 | 0 | -10000 | 0 | 0 |
| RHOA | 0.02 | 0.013 | -10000 | 0 | -10000 | 0 | 0 |
| LEPR | 0.029 | 0.006 | -10000 | 0 | -10000 | 0 | 0 |
| BCAR1 | 0.028 | 0.03 | -10000 | 0 | -0.64 | 1 | 1 |
| p210 bcr-abl/Grb2 | 0.029 | 0.005 | -10000 | 0 | -10000 | 0 | 0 |
| mol:NADPH | -0.006 | 0.003 | -10000 | 0 | -10000 | 0 | 0 |
| TRPV6 | -0.19 | 0.16 | 0.36 | 4 | -0.5 | 55 | 59 |
| PRL | 0.003 | 0.022 | -10000 | 0 | -10000 | 0 | 0 |
| SOCS3 | 0.027 | 0.11 | -10000 | 0 | -0.98 | 6 | 6 |
| SPRY2 | 0.025 | 0.004 | -10000 | 0 | -10000 | 0 | 0 |
| Insulin Receptor/Insulin/IRS1 | 0.046 | 0.044 | -10000 | 0 | -0.42 | 4 | 4 |
| CSF1/CSF1R | -0.047 | 0.076 | 0.34 | 1 | -0.38 | 8 | 9 |
| Ras protein signal transduction | 0.033 | 0.066 | 0.49 | 9 | -10000 | 0 | 9 |
| IRS1 | 0.023 | 0.059 | -10000 | 0 | -0.64 | 4 | 4 |
| INS | 0.006 | 0.019 | -10000 | 0 | -10000 | 0 | 0 |
| LEP | -0.035 | 0.18 | -10000 | 0 | -0.59 | 46 | 46 |
| STAT5B | -0.059 | 0.094 | 0.37 | 1 | -0.34 | 23 | 24 |
| STAT5A | -0.059 | 0.094 | 0.37 | 1 | -0.34 | 24 | 25 |
| GRB2 | 0.029 | 0.005 | -10000 | 0 | -10000 | 0 | 0 |
| PDGFB-D/PDGFRB | -0.047 | 0.068 | 0.34 | 1 | -0.37 | 3 | 4 |
| CSN2 | 0.004 | 0.072 | -10000 | 0 | -0.62 | 1 | 1 |
| PIK3CA | 0.027 | 0.03 | -10000 | 0 | -0.64 | 1 | 1 |
| LAT | -0.056 | 0.11 | -10000 | 0 | -0.52 | 5 | 5 |
| YBX1 | 0.033 | 0.007 | -10000 | 0 | -10000 | 0 | 0 |
| LCK | 0.002 | 0.13 | -10000 | 0 | -0.59 | 22 | 22 |
| SHC1 | 0.029 | 0.007 | -10000 | 0 | -10000 | 0 | 0 |
| NOX4 | 0.021 | 0.053 | -10000 | 0 | -0.56 | 4 | 4 |
Figure S50. Get High-res Image This plot shows pathway concept perturbations across all samples against a permutation model. The concepts along the x-axis are sorted by lowest to highest mean activity for the real patient samples. Mean inferred activities are plotted along the y-axis as a colored band showing the average level and one standard deviation range. Real samples are shown in red and permuted samples in black.
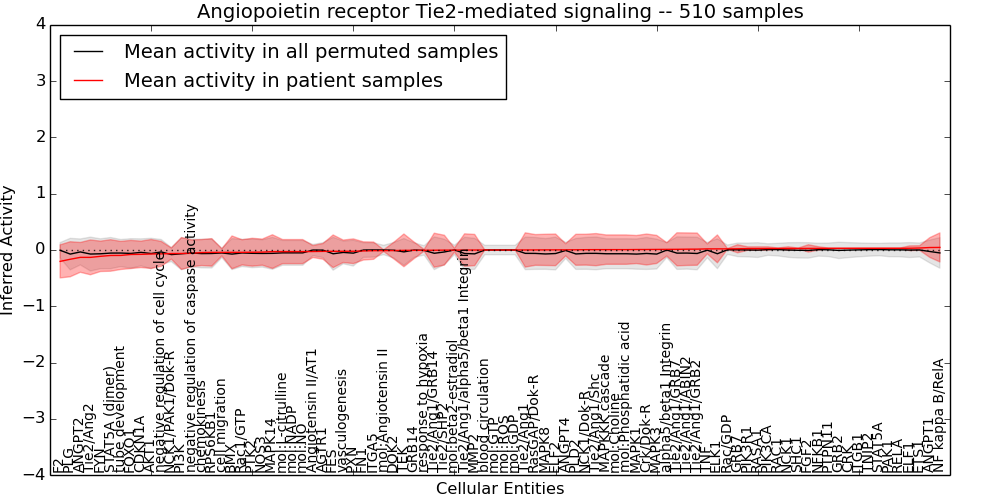
Table S50. Get Full Table This table displays mean, standard deviation, and perturbation statistics for Inferred Pathway Levels (IPLs). A mean perturbation of -9999 implies that the IPLs across all the real samples did not differ enough from the IPLs generated by a background model of permuted samples (> 1 Std.Dev from the permuted sample IPLs).
| Entity | Mean | Std.Dev | Mean.of.Up.Perturbations | Number.of.Up.Perturbations | Mean.of.Down.Perturbations | Number.of.Down.Perturbations | Number.of.Total.Perturbations |
|---|---|---|---|---|---|---|---|
| AKT1 | -0.071 | 0.26 | -10000 | 0 | -0.89 | 28 | 28 |
| NCK1/PAK1/Dok-R | -0.063 | 0.099 | -10000 | 0 | -0.42 | 26 | 26 |
| NCK1/Dok-R | 0.006 | 0.27 | -10000 | 0 | -1 | 29 | 29 |
| PIK3CA | 0.026 | 0.03 | -10000 | 0 | -0.63 | 1 | 1 |
| mol:beta2-estradiol | -0.002 | 0.036 | 0.27 | 8 | -10000 | 0 | 8 |
| RELA | 0.03 | 0.003 | -10000 | 0 | -10000 | 0 | 0 |
| SHC1 | 0.028 | 0.007 | -10000 | 0 | -10000 | 0 | 0 |
| Rac/GDP | 0.02 | 0.007 | -10000 | 0 | -10000 | 0 | 0 |
| F2 | -0.2 | 0.29 | 0.27 | 2 | -0.58 | 187 | 189 |
| TNIP2 | 0.03 | 0.004 | -10000 | 0 | -10000 | 0 | 0 |
| NF kappa B/RelA | 0.046 | 0.26 | -10000 | 0 | -0.96 | 29 | 29 |
| FN1 | -0.017 | 0.16 | -10000 | 0 | -0.59 | 37 | 37 |
| PLD2 | 0.004 | 0.28 | -10000 | 0 | -1.1 | 29 | 29 |
| PTPN11 | 0.029 | 0.006 | -10000 | 0 | -10000 | 0 | 0 |
| GRB14 | -0.006 | 0.15 | -10000 | 0 | -0.64 | 27 | 27 |
| ELK1 | 0.02 | 0.25 | -10000 | 0 | -0.94 | 29 | 29 |
| GRB7 | 0.022 | 0.072 | -10000 | 0 | -0.64 | 6 | 6 |
| PAK1 | 0.03 | 0.003 | -10000 | 0 | -10000 | 0 | 0 |
| Tie2/Ang1/alpha5/beta1 Integrin | -0.001 | 0.29 | -10000 | 0 | -1 | 28 | 28 |
| CDKN1A | -0.077 | 0.24 | -10000 | 0 | -0.62 | 28 | 28 |
| ITGA5 | -0.012 | 0.15 | -10000 | 0 | -0.59 | 34 | 34 |
| mol:GTP | 0 | 0 | -10000 | 0 | -10000 | 0 | 0 |
| RasGAP/Dok-R | 0.001 | 0.27 | -10000 | 0 | -1 | 29 | 29 |
| CRK | 0.029 | 0.005 | -10000 | 0 | -10000 | 0 | 0 |
| mol:NO | -0.028 | 0.21 | 0.45 | 5 | -0.63 | 28 | 33 |
| PLG | -0.16 | 0.31 | -10000 | 0 | -1.2 | 29 | 29 |
| mol:GDP | 0 | 0 | -10000 | 0 | -10000 | 0 | 0 |
| chemokinesis | -0.045 | 0.23 | -10000 | 0 | -0.83 | 28 | 28 |
| GRB2 | 0.029 | 0.005 | -10000 | 0 | -10000 | 0 | 0 |
| PIK3R1 | 0.025 | 0.031 | -10000 | 0 | -0.64 | 1 | 1 |
| ANGPT2 | -0.13 | 0.26 | -10000 | 0 | -0.63 | 28 | 28 |
| BMX | -0.042 | 0.29 | -10000 | 0 | -1.1 | 29 | 29 |
| ANGPT1 | 0.044 | 0.18 | -10000 | 0 | -1.2 | 8 | 8 |
| tube development | -0.097 | 0.25 | -10000 | 0 | -0.71 | 26 | 26 |
| ANGPT4 | 0.003 | 0.11 | -10000 | 0 | -0.59 | 16 | 16 |
| response to hypoxia | -0.005 | 0.015 | -10000 | 0 | -10000 | 0 | 0 |
| Tie2/Ang1/GRB14 | -0.004 | 0.3 | -10000 | 0 | -1.1 | 29 | 29 |
| alpha5/beta1 Integrin | 0.011 | 0.12 | -10000 | 0 | -0.43 | 34 | 34 |
| FGF2 | 0.028 | 0.065 | -10000 | 0 | -0.62 | 5 | 5 |
| STAT5A (dimer) | -0.097 | 0.28 | -10000 | 0 | -0.8 | 26 | 26 |
| mol:L-citrulline | -0.028 | 0.21 | 0.45 | 5 | -0.63 | 28 | 33 |
| AGTR1 | -0.024 | 0.14 | -10000 | 0 | -0.63 | 25 | 25 |
| MAPK14 | -0.028 | 0.3 | -10000 | 0 | -1.1 | 30 | 30 |
| Tie2/SHP2 | -0.002 | 0.26 | -10000 | 0 | -1.1 | 27 | 27 |
| TEK | -0.006 | 0.29 | -10000 | 0 | -1.2 | 27 | 27 |
| RPS6KB1 | -0.042 | 0.24 | -10000 | 0 | -0.83 | 29 | 29 |
| Angiotensin II/AT1 | -0.027 | 0.11 | -10000 | 0 | -0.47 | 25 | 25 |
| Tie2/Ang1/GRB2 | 0.015 | 0.29 | -10000 | 0 | -1.1 | 29 | 29 |
| MAPK3 | 0.01 | 0.25 | -10000 | 0 | -0.95 | 29 | 29 |
| MAPK1 | 0.008 | 0.25 | -10000 | 0 | -0.96 | 29 | 29 |
| Tie2/Ang1/GRB7 | 0.012 | 0.29 | -10000 | 0 | -1.1 | 29 | 29 |
| NFKB1 | 0.028 | 0.03 | -10000 | 0 | -0.64 | 1 | 1 |
| MAPK8 | 0.002 | 0.28 | -10000 | 0 | -1.1 | 29 | 29 |
| PI3K | -0.062 | 0.28 | -10000 | 0 | -1 | 29 | 29 |
| FES | -0.023 | 0.29 | -10000 | 0 | -1.1 | 29 | 29 |
| Crk/Dok-R | 0.009 | 0.28 | -10000 | 0 | -1 | 28 | 28 |
| Tie2/Ang1/ABIN2 | 0.014 | 0.29 | -10000 | 0 | -1.1 | 29 | 29 |
| blood circulation | 0 | 0 | -10000 | 0 | -10000 | 0 | 0 |
| negative regulation of caspase activity | -0.059 | 0.24 | -10000 | 0 | -0.79 | 28 | 28 |
| STAT5A | 0.03 | 0.005 | -10000 | 0 | -10000 | 0 | 0 |
| mol:ROS | 0 | 0 | -10000 | 0 | -10000 | 0 | 0 |
| PTK2 | -0.04 | 0.25 | 0.51 | 1 | -0.84 | 28 | 29 |
| Tie2/Ang2 | -0.13 | 0.31 | -10000 | 0 | -0.99 | 26 | 26 |
| Tie2/Ang1 | 0.001 | 0.3 | -10000 | 0 | -1.2 | 29 | 29 |
| FOXO1 | -0.079 | 0.25 | -10000 | 0 | -0.81 | 27 | 27 |
| ELF1 | 0.031 | 0.042 | -10000 | 0 | -0.63 | 1 | 1 |
| ELF2 | 0.003 | 0.28 | -10000 | 0 | -1.1 | 29 | 29 |
| mol:Choline | 0.007 | 0.26 | -10000 | 0 | -1 | 29 | 29 |
| cell migration | -0.042 | 0.064 | -10000 | 0 | -0.24 | 18 | 18 |
| FYN | -0.11 | 0.27 | -10000 | 0 | -0.82 | 26 | 26 |
| DOK2 | -0.01 | 0.15 | -10000 | 0 | -0.59 | 31 | 31 |
| negative regulation of cell cycle | -0.069 | 0.22 | -10000 | 0 | -0.56 | 28 | 28 |
| ETS1 | 0.035 | 0.041 | -10000 | 0 | -0.29 | 5 | 5 |
| PXN | -0.022 | 0.22 | 0.5 | 7 | -0.69 | 28 | 35 |
| ITGB1 | 0.03 | 0.004 | -10000 | 0 | -10000 | 0 | 0 |
| NOS3 | -0.038 | 0.23 | 0.49 | 3 | -0.73 | 27 | 30 |
| RAC1 | 0.027 | 0.009 | -10000 | 0 | -10000 | 0 | 0 |
| TNF | 0.02 | 0.089 | -10000 | 0 | -0.5 | 12 | 12 |
| MAPKKK cascade | 0.007 | 0.26 | -10000 | 0 | -1 | 29 | 29 |
| RASA1 | 0.025 | 0.031 | -10000 | 0 | -0.64 | 1 | 1 |
| Tie2/Ang1/Shc | 0.007 | 0.29 | -10000 | 0 | -1.1 | 29 | 29 |
| NCK1 | 0.027 | 0.03 | -10000 | 0 | -0.64 | 1 | 1 |
| vasculogenesis | -0.023 | 0.2 | 0.41 | 9 | -0.56 | 28 | 37 |
| mol:Phosphatidic acid | 0.007 | 0.26 | -10000 | 0 | -1 | 29 | 29 |
| mol:Angiotensin II | -0.011 | 0.015 | -10000 | 0 | -10000 | 0 | 0 |
| mol:NADP | -0.028 | 0.21 | 0.45 | 5 | -0.63 | 28 | 33 |
| Rac1/GTP | -0.042 | 0.22 | -10000 | 0 | -0.78 | 28 | 28 |
| MMP2 | -0.001 | 0.28 | -10000 | 0 | -1.1 | 29 | 29 |
Figure S51. Get High-res Image This plot shows pathway concept perturbations across all samples against a permutation model. The concepts along the x-axis are sorted by lowest to highest mean activity for the real patient samples. Mean inferred activities are plotted along the y-axis as a colored band showing the average level and one standard deviation range. Real samples are shown in red and permuted samples in black.
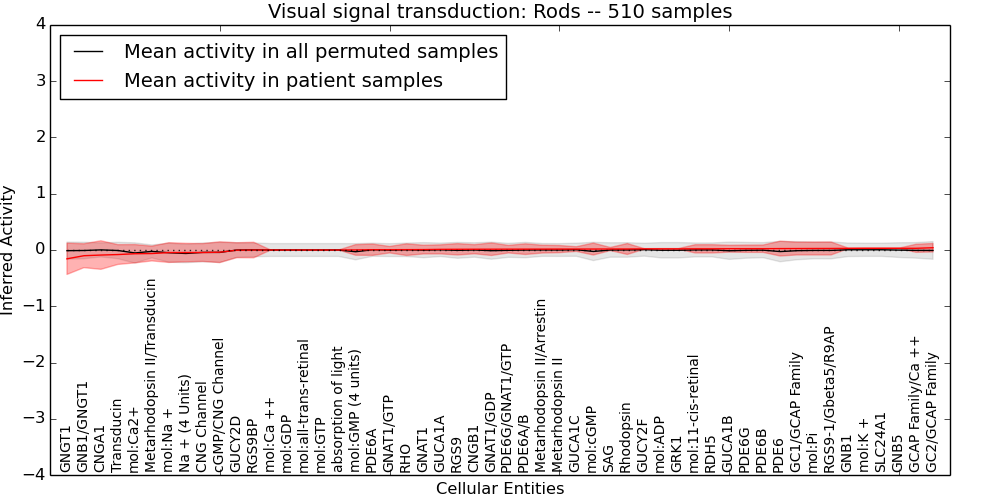
Table S51. Get Full Table This table displays mean, standard deviation, and perturbation statistics for Inferred Pathway Levels (IPLs). A mean perturbation of -9999 implies that the IPLs across all the real samples did not differ enough from the IPLs generated by a background model of permuted samples (> 1 Std.Dev from the permuted sample IPLs).
| Entity | Mean | Std.Dev | Mean.of.Up.Perturbations | Number.of.Up.Perturbations | Mean.of.Down.Perturbations | Number.of.Down.Perturbations | Number.of.Total.Perturbations |
|---|---|---|---|---|---|---|---|
| mol:K + | 0.03 | 0.003 | -10000 | 0 | -10000 | 0 | 0 |
| GNAT1/GTP | 0.005 | 0.058 | -10000 | 0 | -0.48 | 7 | 7 |
| Metarhodopsin II/Arrestin | 0.016 | 0.069 | -10000 | 0 | -0.38 | 15 | 15 |
| PDE6G/GNAT1/GTP | 0.015 | 0.067 | -10000 | 0 | -0.4 | 12 | 12 |
| mol:GTP | 0 | 0 | -10000 | 0 | -10000 | 0 | 0 |
| absorption of light | 0 | 0 | -10000 | 0 | -10000 | 0 | 0 |
| GNAT1 | 0.007 | 0.077 | -10000 | 0 | -0.64 | 7 | 7 |
| GRK1 | 0.02 | 0.005 | -10000 | 0 | -10000 | 0 | 0 |
| CNG Channel | -0.045 | 0.16 | -10000 | 0 | -0.69 | 8 | 8 |
| mol:Na + | -0.046 | 0.18 | -10000 | 0 | -0.56 | 20 | 20 |
| mol:ADP | 0.02 | 0.005 | -10000 | 0 | -10000 | 0 | 0 |
| RGS9-1/Gbeta5/R9AP | 0.027 | 0.12 | -10000 | 0 | -0.39 | 34 | 34 |
| mol:GDP | 0 | 0 | -10000 | 0 | -10000 | 0 | 0 |
| cGMP/CNG Channel | -0.039 | 0.18 | -10000 | 0 | -0.58 | 19 | 19 |
| CNGB1 | 0.014 | 0.081 | -10000 | 0 | -0.59 | 9 | 9 |
| RDH5 | 0.021 | 0.074 | -10000 | 0 | -0.6 | 7 | 7 |
| SAG | 0.018 | 0.028 | -10000 | 0 | -0.59 | 1 | 1 |
| mol:Ca2+ | -0.066 | 0.16 | 0.38 | 3 | -0.56 | 18 | 21 |
| Na + (4 Units) | -0.045 | 0.16 | -10000 | 0 | -0.54 | 18 | 18 |
| RGS9 | 0.013 | 0.1 | -10000 | 0 | -0.58 | 14 | 14 |
| GNB1/GNGT1 | -0.1 | 0.21 | -10000 | 0 | -0.43 | 150 | 150 |
| GNAT1/GDP | 0.014 | 0.11 | -10000 | 0 | -0.36 | 29 | 29 |
| GUCY2D | -0.004 | 0.13 | -10000 | 0 | -0.59 | 25 | 25 |
| GNGT1 | -0.16 | 0.28 | -10000 | 0 | -0.59 | 150 | 150 |
| GUCY2F | 0.019 | 0.005 | -10000 | 0 | -10000 | 0 | 0 |
| GNB5 | 0.03 | 0.003 | -10000 | 0 | -10000 | 0 | 0 |
| mol:GMP (4 units) | 0.001 | 0.094 | -10000 | 0 | -0.42 | 15 | 15 |
| mol:11-cis-retinal | 0.021 | 0.073 | -10000 | 0 | -0.6 | 7 | 7 |
| mol:cGMP | 0.017 | 0.11 | -10000 | 0 | -0.5 | 4 | 4 |
| GNB1 | 0.029 | 0.006 | -10000 | 0 | -10000 | 0 | 0 |
| Rhodopsin | 0.018 | 0.097 | -10000 | 0 | -0.44 | 22 | 22 |
| SLC24A1 | 0.03 | 0.003 | -10000 | 0 | -10000 | 0 | 0 |
| CNGA1 | -0.09 | 0.25 | -10000 | 0 | -0.62 | 93 | 93 |
| Metarhodopsin II | 0.016 | 0.063 | -10000 | 0 | -0.34 | 15 | 15 |
| mol:Ca ++ | 0 | 0 | -10000 | 0 | -10000 | 0 | 0 |
| GC1/GCAP Family | 0.026 | 0.11 | -10000 | 0 | -0.36 | 32 | 32 |
| RGS9BP | 0 | 0.14 | -10000 | 0 | -0.64 | 23 | 23 |
| Metarhodopsin II/Transducin | -0.063 | 0.13 | -10000 | 0 | -0.38 | 47 | 47 |
| GCAP Family/Ca ++ | 0.03 | 0.072 | -10000 | 0 | -0.36 | 15 | 15 |
| PDE6A/B | 0.015 | 0.095 | -10000 | 0 | -0.46 | 18 | 18 |
| mol:Pi | 0.027 | 0.11 | -10000 | 0 | -0.39 | 34 | 34 |
| mol:all-trans-retinal | 0 | 0 | -10000 | 0 | -10000 | 0 | 0 |
| Transducin | -0.081 | 0.18 | -10000 | 0 | -0.34 | 151 | 151 |
| PDE6B | 0.023 | 0.066 | -10000 | 0 | -0.64 | 5 | 5 |
| PDE6A | 0.005 | 0.1 | -10000 | 0 | -0.59 | 14 | 14 |
| PDE6G | 0.023 | 0.065 | -10000 | 0 | -0.62 | 5 | 5 |
| RHO | 0.006 | 0.1 | -10000 | 0 | -0.59 | 15 | 15 |
| PDE6 | 0.025 | 0.13 | -10000 | 0 | -0.64 | 5 | 5 |
| GUCA1A | 0.011 | 0.081 | -10000 | 0 | -0.59 | 9 | 9 |
| GC2/GCAP Family | 0.04 | 0.076 | -10000 | 0 | -0.37 | 15 | 15 |
| GUCA1C | 0.017 | 0.042 | -10000 | 0 | -0.64 | 2 | 2 |
| GUCA1B | 0.023 | 0.061 | -10000 | 0 | -0.59 | 5 | 5 |
Figure S52. Get High-res Image This plot shows pathway concept perturbations across all samples against a permutation model. The concepts along the x-axis are sorted by lowest to highest mean activity for the real patient samples. Mean inferred activities are plotted along the y-axis as a colored band showing the average level and one standard deviation range. Real samples are shown in red and permuted samples in black.
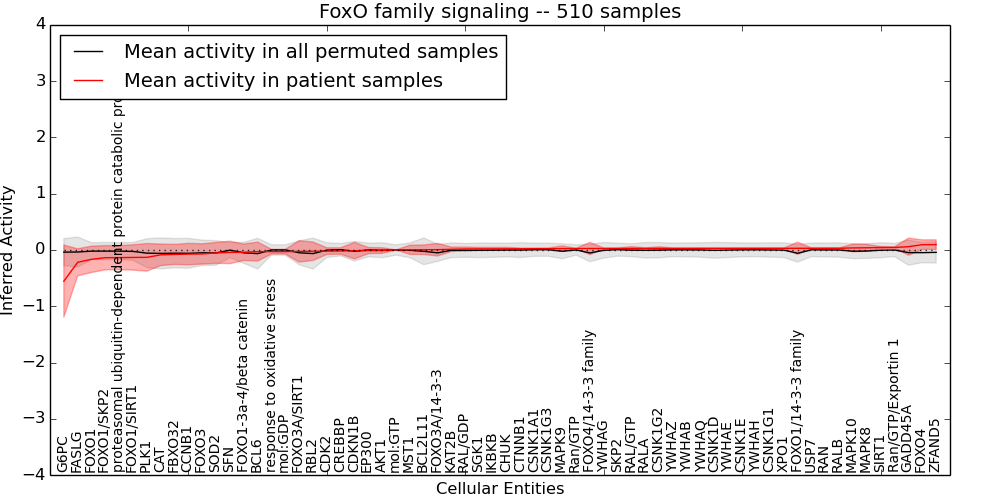
Table S52. Get Full Table This table displays mean, standard deviation, and perturbation statistics for Inferred Pathway Levels (IPLs). A mean perturbation of -9999 implies that the IPLs across all the real samples did not differ enough from the IPLs generated by a background model of permuted samples (> 1 Std.Dev from the permuted sample IPLs).
| Entity | Mean | Std.Dev | Mean.of.Up.Perturbations | Number.of.Up.Perturbations | Mean.of.Down.Perturbations | Number.of.Down.Perturbations | Number.of.Total.Perturbations |
|---|---|---|---|---|---|---|---|
| G6PC | -0.55 | 0.64 | -10000 | 0 | -1.2 | 237 | 237 |
| PLK1 | -0.13 | 0.25 | 0.48 | 1 | -0.7 | 25 | 26 |
| CDKN1B | -0.012 | 0.15 | 0.54 | 1 | -0.38 | 1 | 2 |
| FOXO3 | -0.07 | 0.18 | -10000 | 0 | -0.6 | 16 | 16 |
| KAT2B | 0.012 | 0.039 | -10000 | 0 | -0.67 | 1 | 1 |
| FOXO1/SIRT1 | -0.13 | 0.22 | -10000 | 0 | -0.38 | 208 | 208 |
| CAT | -0.086 | 0.19 | -10000 | 0 | -1.2 | 3 | 3 |
| CTNNB1 | 0.021 | 0.014 | -10000 | 0 | -10000 | 0 | 0 |
| AKT1 | -0.01 | 0.05 | -10000 | 0 | -0.29 | 1 | 1 |
| FOXO1 | -0.17 | 0.23 | 0.3 | 1 | -0.42 | 219 | 220 |
| MAPK10 | 0.037 | 0.069 | 0.34 | 3 | -0.36 | 4 | 7 |
| mol:GTP | 0.002 | 0.001 | -10000 | 0 | -10000 | 0 | 0 |
| FOXO4 | 0.095 | 0.086 | 0.37 | 16 | -10000 | 0 | 16 |
| response to oxidative stress | -0.029 | 0.042 | -10000 | 0 | -0.29 | 1 | 1 |
| FOXO3A/SIRT1 | -0.025 | 0.19 | -10000 | 0 | -0.6 | 11 | 11 |
| XPO1 | 0.03 | 0.005 | -10000 | 0 | -10000 | 0 | 0 |
| EP300 | -0.01 | 0.055 | -10000 | 0 | -0.48 | 2 | 2 |
| BCL2L11 | 0.005 | 0.085 | -10000 | 0 | -0.72 | 6 | 6 |
| FOXO1/SKP2 | -0.14 | 0.22 | -10000 | 0 | -0.39 | 195 | 195 |
| mol:GDP | -0.028 | 0.042 | -10000 | 0 | -0.29 | 1 | 1 |
| RAN | 0.031 | 0.006 | -10000 | 0 | -10000 | 0 | 0 |
| GADD45A | 0.059 | 0.15 | -10000 | 0 | -0.64 | 12 | 12 |
| YWHAQ | 0.029 | 0.005 | -10000 | 0 | -10000 | 0 | 0 |
| FOXO1/14-3-3 family | 0.03 | 0.11 | -10000 | 0 | -0.55 | 8 | 8 |
| MST1 | 0.004 | 0.083 | -10000 | 0 | -0.62 | 8 | 8 |
| CSNK1D | 0.029 | 0.005 | -10000 | 0 | -10000 | 0 | 0 |
| CSNK1E | 0.03 | 0.004 | -10000 | 0 | -10000 | 0 | 0 |
| FOXO4/14-3-3 family | 0.027 | 0.11 | -10000 | 0 | -0.61 | 7 | 7 |
| YWHAB | 0.029 | 0.006 | -10000 | 0 | -10000 | 0 | 0 |
| MAPK8 | 0.04 | 0.06 | 0.34 | 2 | -0.36 | 1 | 3 |
| MAPK9 | 0.025 | 0.048 | 0.35 | 2 | -10000 | 0 | 2 |
| YWHAG | 0.027 | 0.009 | -10000 | 0 | -10000 | 0 | 0 |
| YWHAE | 0.029 | 0.005 | -10000 | 0 | -10000 | 0 | 0 |
| YWHAZ | 0.029 | 0.007 | -10000 | 0 | -10000 | 0 | 0 |
| SIRT1 | 0.044 | 0.018 | -10000 | 0 | -10000 | 0 | 0 |
| SOD2 | -0.051 | 0.19 | 0.47 | 1 | -0.57 | 9 | 10 |
| RBL2 | -0.022 | 0.16 | -10000 | 0 | -0.96 | 6 | 6 |
| RAL/GDP | 0.018 | 0.034 | -10000 | 0 | -10000 | 0 | 0 |
| CHUK | 0.021 | 0.026 | -10000 | 0 | -10000 | 0 | 0 |
| Ran/GTP | 0.026 | 0.005 | -10000 | 0 | -10000 | 0 | 0 |
| CSNK1G2 | 0.028 | 0.03 | -10000 | 0 | -0.64 | 1 | 1 |
| RAL/GTP | 0.028 | 0.033 | -10000 | 0 | -10000 | 0 | 0 |
| CSNK1G1 | 0.03 | 0.003 | -10000 | 0 | -10000 | 0 | 0 |
| FASLG | -0.22 | 0.24 | -10000 | 0 | -0.69 | 8 | 8 |
| SKP2 | 0.027 | 0.009 | -10000 | 0 | -10000 | 0 | 0 |
| USP7 | 0.03 | 0.007 | -10000 | 0 | -10000 | 0 | 0 |
| IKBKB | 0.02 | 0.026 | -10000 | 0 | -10000 | 0 | 0 |
| CCNB1 | -0.073 | 0.19 | -10000 | 0 | -0.73 | 10 | 10 |
| FOXO1-3a-4/beta catenin | -0.04 | 0.15 | 0.4 | 4 | -0.43 | 1 | 5 |
| proteasomal ubiquitin-dependent protein catabolic process | -0.14 | 0.21 | -10000 | 0 | -0.38 | 195 | 195 |
| CSNK1A1 | 0.023 | 0.013 | -10000 | 0 | -10000 | 0 | 0 |
| SGK1 | 0.02 | 0.026 | -10000 | 0 | -10000 | 0 | 0 |
| CSNK1G3 | 0.024 | 0.012 | -10000 | 0 | -10000 | 0 | 0 |
| Ran/GTP/Exportin 1 | 0.045 | 0.012 | -10000 | 0 | -10000 | 0 | 0 |
| ZFAND5 | 0.096 | 0.086 | 0.42 | 12 | -10000 | 0 | 12 |
| SFN | -0.043 | 0.2 | -10000 | 0 | -0.59 | 59 | 59 |
| CDK2 | -0.019 | 0.059 | -10000 | 0 | -10000 | 0 | 0 |
| FOXO3A/14-3-3 | 0.006 | 0.11 | -10000 | 0 | -0.53 | 12 | 12 |
| CREBBP | -0.018 | 0.057 | -10000 | 0 | -10000 | 0 | 0 |
| FBXO32 | -0.079 | 0.18 | 0.48 | 1 | -0.69 | 6 | 7 |
| BCL6 | -0.029 | 0.17 | -10000 | 0 | -0.83 | 7 | 7 |
| RALB | 0.031 | 0.006 | -10000 | 0 | -10000 | 0 | 0 |
| RALA | 0.028 | 0.01 | -10000 | 0 | -10000 | 0 | 0 |
| YWHAH | 0.03 | 0.004 | -10000 | 0 | -10000 | 0 | 0 |
Figure S53. Get High-res Image This plot shows pathway concept perturbations across all samples against a permutation model. The concepts along the x-axis are sorted by lowest to highest mean activity for the real patient samples. Mean inferred activities are plotted along the y-axis as a colored band showing the average level and one standard deviation range. Real samples are shown in red and permuted samples in black.
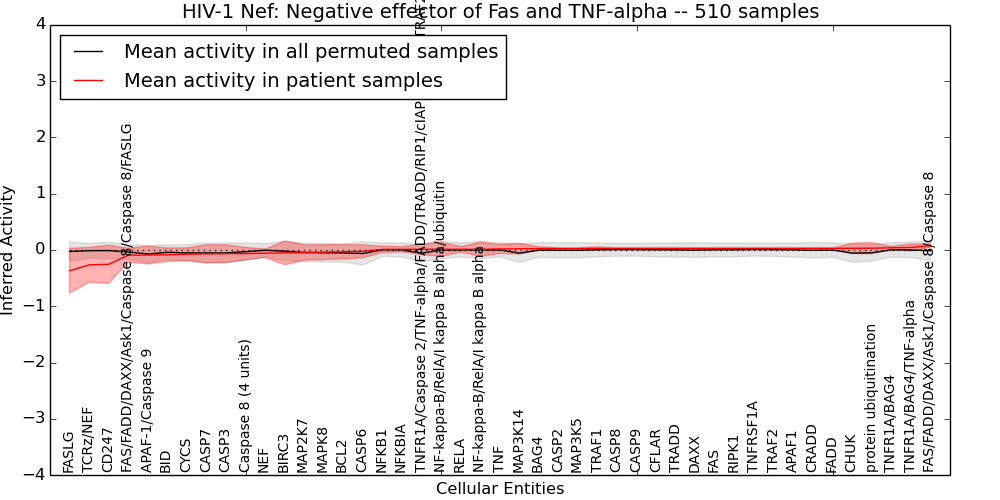
Table S53. Get Full Table This table displays mean, standard deviation, and perturbation statistics for Inferred Pathway Levels (IPLs). A mean perturbation of -9999 implies that the IPLs across all the real samples did not differ enough from the IPLs generated by a background model of permuted samples (> 1 Std.Dev from the permuted sample IPLs).
| Entity | Mean | Std.Dev | Mean.of.Up.Perturbations | Number.of.Up.Perturbations | Mean.of.Down.Perturbations | Number.of.Down.Perturbations | Number.of.Total.Perturbations |
|---|---|---|---|---|---|---|---|
| BAG4 | 0.026 | 0.031 | -10000 | 0 | -0.64 | 1 | 1 |
| Caspase 8 (4 units) | -0.064 | 0.11 | -10000 | 0 | -0.38 | 1 | 1 |
| NEF | -0.057 | 0.076 | -10000 | 0 | -0.45 | 5 | 5 |
| NFKBIA | 0.012 | 0.047 | -10000 | 0 | -10000 | 0 | 0 |
| BIRC3 | -0.052 | 0.21 | -10000 | 0 | -0.54 | 80 | 80 |
| CYCS | -0.075 | 0.11 | -10000 | 0 | -0.4 | 2 | 2 |
| RIPK1 | 0.029 | 0.006 | -10000 | 0 | -10000 | 0 | 0 |
| CD247 | -0.25 | 0.34 | -10000 | 0 | -0.73 | 166 | 166 |
| MAP2K7 | -0.045 | 0.14 | 0.38 | 2 | -0.58 | 15 | 17 |
| protein ubiquitination | 0.032 | 0.1 | 0.4 | 8 | -0.55 | 3 | 11 |
| CRADD | 0.029 | 0.005 | -10000 | 0 | -10000 | 0 | 0 |
| DAXX | 0.029 | 0.006 | -10000 | 0 | -10000 | 0 | 0 |
| FAS | 0.029 | 0.006 | -10000 | 0 | -10000 | 0 | 0 |
| BID | -0.085 | 0.12 | -10000 | 0 | -0.36 | 2 | 2 |
| NF-kappa-B/RelA/I kappa B alpha | 0.013 | 0.13 | -10000 | 0 | -0.47 | 2 | 2 |
| TRADD | 0.029 | 0.006 | -10000 | 0 | -10000 | 0 | 0 |
| MAP3K5 | 0.028 | 0.008 | -10000 | 0 | -10000 | 0 | 0 |
| CFLAR | 0.029 | 0.006 | -10000 | 0 | -10000 | 0 | 0 |
| FADD | 0.03 | 0.004 | -10000 | 0 | -10000 | 0 | 0 |
| NF-kappa-B/RelA/I kappa B alpha/ubiquitin | 0.013 | 0.13 | -10000 | 0 | -0.47 | 2 | 2 |
| MAPK8 | -0.038 | 0.13 | 0.43 | 3 | -0.54 | 15 | 18 |
| APAF1 | 0.029 | 0.006 | -10000 | 0 | -10000 | 0 | 0 |
| TRAF1 | 0.028 | 0.028 | -10000 | 0 | -0.59 | 1 | 1 |
| TRAF2 | 0.029 | 0.006 | -10000 | 0 | -10000 | 0 | 0 |
| FAS/FADD/DAXX/Ask1/Caspase 8/Caspase 8/FASLG | -0.092 | 0.12 | -10000 | 0 | -0.33 | 6 | 6 |
| TNFR1A/Caspase 2/TNF-alpha/FADD/TRADD/RIP1/cIAP2/TRAF1/TRAF2/Ask1/RAIDD | 0.013 | 0.097 | -10000 | 0 | -0.56 | 6 | 6 |
| CHUK | 0.031 | 0.093 | 0.3 | 6 | -0.62 | 3 | 9 |
| FAS/FADD/DAXX/Ask1/Caspase 8/Caspase 8 | 0.078 | 0.031 | -10000 | 0 | -10000 | 0 | 0 |
| TCRz/NEF | -0.26 | 0.31 | -10000 | 0 | -0.67 | 169 | 169 |
| TNF | 0.019 | 0.08 | -10000 | 0 | -0.61 | 8 | 8 |
| FASLG | -0.37 | 0.4 | -10000 | 0 | -0.74 | 255 | 255 |
| NFKB1 | 0.011 | 0.056 | -10000 | 0 | -0.63 | 1 | 1 |
| TNFR1A/BAG4/TNF-alpha | 0.045 | 0.062 | -10000 | 0 | -0.39 | 9 | 9 |
| CASP6 | -0.023 | 0.12 | -10000 | 0 | -0.56 | 11 | 11 |
| CASP7 | -0.068 | 0.16 | 0.38 | 1 | -0.42 | 36 | 37 |
| RELA | 0.013 | 0.048 | -10000 | 0 | -10000 | 0 | 0 |
| CASP2 | 0.027 | 0.009 | -10000 | 0 | -10000 | 0 | 0 |
| CASP3 | -0.065 | 0.16 | 0.38 | 1 | -0.42 | 37 | 38 |
| TNFRSF1A | 0.029 | 0.006 | -10000 | 0 | -10000 | 0 | 0 |
| TNFR1A/BAG4 | 0.039 | 0.027 | -10000 | 0 | -0.47 | 1 | 1 |
| CASP8 | 0.029 | 0.006 | -10000 | 0 | -10000 | 0 | 0 |
| CASP9 | 0.029 | 0.006 | -10000 | 0 | -10000 | 0 | 0 |
| MAP3K14 | 0.022 | 0.097 | -10000 | 0 | -0.64 | 4 | 4 |
| APAF-1/Caspase 9 | -0.09 | 0.16 | -10000 | 0 | -0.45 | 52 | 52 |
| BCL2 | -0.031 | 0.13 | 0.47 | 3 | -0.53 | 11 | 14 |
Figure S54. Get High-res Image This plot shows pathway concept perturbations across all samples against a permutation model. The concepts along the x-axis are sorted by lowest to highest mean activity for the real patient samples. Mean inferred activities are plotted along the y-axis as a colored band showing the average level and one standard deviation range. Real samples are shown in red and permuted samples in black.
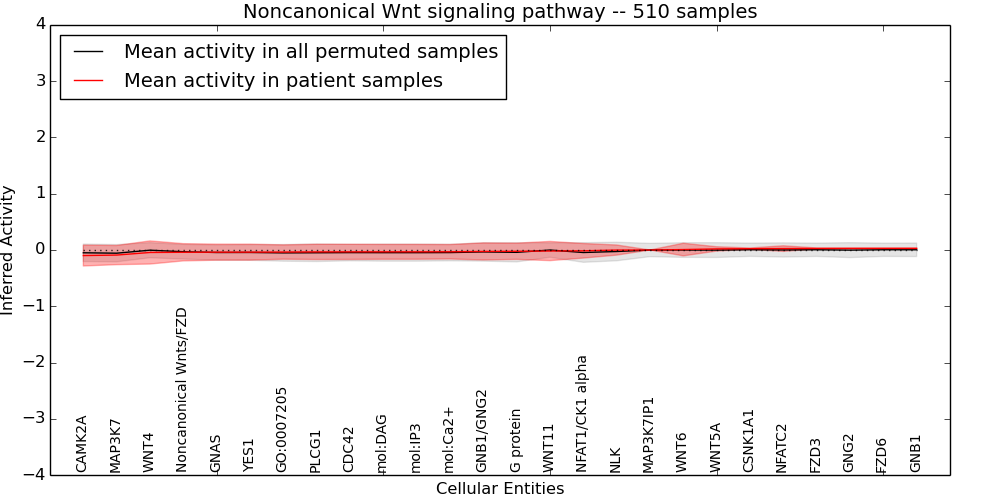
Table S54. Get Full Table This table displays mean, standard deviation, and perturbation statistics for Inferred Pathway Levels (IPLs). A mean perturbation of -9999 implies that the IPLs across all the real samples did not differ enough from the IPLs generated by a background model of permuted samples (> 1 Std.Dev from the permuted sample IPLs).
| Entity | Mean | Std.Dev | Mean.of.Up.Perturbations | Number.of.Up.Perturbations | Mean.of.Down.Perturbations | Number.of.Down.Perturbations | Number.of.Total.Perturbations |
|---|---|---|---|---|---|---|---|
| NFATC2 | 0.025 | 0.05 | -9999 | 0 | -0.62 | 3 | 3 |
| GNB1/GNG2 | -0.026 | 0.15 | -9999 | 0 | -0.47 | 22 | 22 |
| mol:DAG | -0.033 | 0.13 | -9999 | 0 | -0.43 | 22 | 22 |
| PLCG1 | -0.034 | 0.14 | -9999 | 0 | -0.45 | 20 | 20 |
| YES1 | -0.038 | 0.14 | -9999 | 0 | -0.45 | 30 | 30 |
| FZD3 | 0.027 | 0.009 | -9999 | 0 | -10000 | 0 | 0 |
| FZD6 | 0.028 | 0.007 | -9999 | 0 | -10000 | 0 | 0 |
| G protein | -0.022 | 0.14 | -9999 | 0 | -0.48 | 15 | 15 |
| MAP3K7 | -0.09 | 0.17 | -9999 | 0 | -0.49 | 37 | 37 |
| mol:Ca2+ | -0.031 | 0.13 | -9999 | 0 | -0.42 | 22 | 22 |
| mol:IP3 | -0.033 | 0.13 | -9999 | 0 | -0.43 | 22 | 22 |
| NLK | -0.001 | 0.09 | -9999 | 0 | -0.81 | 6 | 6 |
| GNB1 | 0.029 | 0.006 | -9999 | 0 | -10000 | 0 | 0 |
| CAMK2A | -0.099 | 0.18 | -9999 | 0 | -0.52 | 44 | 44 |
| MAP3K7IP1 | 0 | 0 | -9999 | 0 | -10000 | 0 | 0 |
| Noncanonical Wnts/FZD | -0.04 | 0.15 | -9999 | 0 | -0.43 | 46 | 46 |
| CSNK1A1 | 0.023 | 0.013 | -9999 | 0 | -10000 | 0 | 0 |
| GNAS | -0.038 | 0.14 | -9999 | 0 | -0.41 | 45 | 45 |
| GO:0007205 | -0.036 | 0.13 | -9999 | 0 | -0.42 | 22 | 22 |
| WNT6 | 0.008 | 0.11 | -9999 | 0 | -0.59 | 17 | 17 |
| WNT4 | -0.044 | 0.21 | -9999 | 0 | -0.62 | 57 | 57 |
| NFAT1/CK1 alpha | -0.014 | 0.13 | -9999 | 0 | -0.46 | 13 | 13 |
| GNG2 | 0.028 | 0.008 | -9999 | 0 | -10000 | 0 | 0 |
| WNT5A | 0.019 | 0.039 | -9999 | 0 | -0.43 | 3 | 3 |
| WNT11 | -0.018 | 0.17 | -9999 | 0 | -0.63 | 37 | 37 |
| CDC42 | -0.033 | 0.14 | -9999 | 0 | -0.46 | 23 | 23 |
Figure S55. Get High-res Image This plot shows pathway concept perturbations across all samples against a permutation model. The concepts along the x-axis are sorted by lowest to highest mean activity for the real patient samples. Mean inferred activities are plotted along the y-axis as a colored band showing the average level and one standard deviation range. Real samples are shown in red and permuted samples in black.
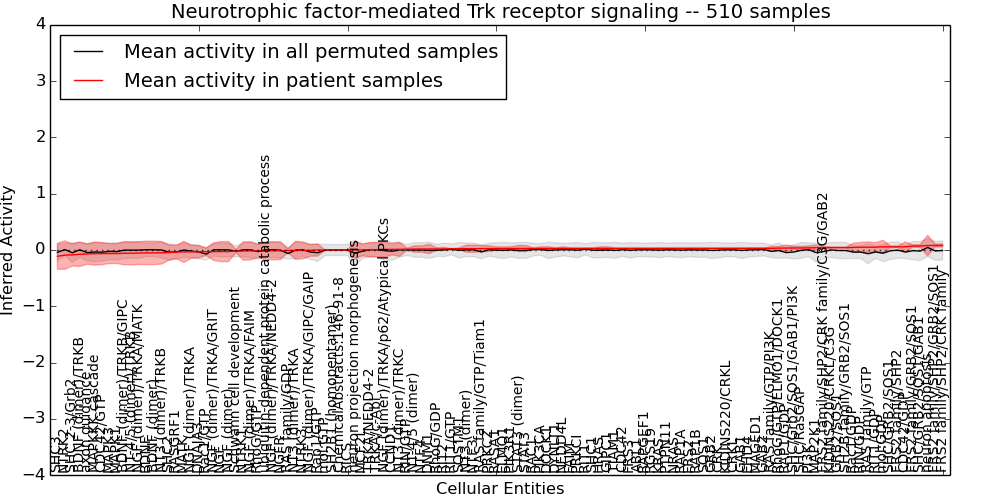
Table S55. Get Full Table This table displays mean, standard deviation, and perturbation statistics for Inferred Pathway Levels (IPLs). A mean perturbation of -9999 implies that the IPLs across all the real samples did not differ enough from the IPLs generated by a background model of permuted samples (> 1 Std.Dev from the permuted sample IPLs).
| Entity | Mean | Std.Dev | Mean.of.Up.Perturbations | Number.of.Up.Perturbations | Mean.of.Down.Perturbations | Number.of.Down.Perturbations | Number.of.Total.Perturbations |
|---|---|---|---|---|---|---|---|
| CRKL | 0.03 | 0.004 | -10000 | 0 | -10000 | 0 | 0 |
| RAS family/GTP/Tiam1 | 0.025 | 0.054 | -10000 | 0 | -0.36 | 2 | 2 |
| NT3 (dimer)/TRKC | 0.012 | 0.13 | -10000 | 0 | -0.49 | 28 | 28 |
| NT3 (dimer)/TRKB | -0.05 | 0.2 | -10000 | 0 | -0.42 | 105 | 105 |
| SHC/Grb2/SOS1/GAB1/PI3K | 0.036 | 0.032 | -10000 | 0 | -0.45 | 1 | 1 |
| RAPGEF1 | 0.029 | 0.006 | -10000 | 0 | -10000 | 0 | 0 |
| BDNF | -0.051 | 0.21 | -10000 | 0 | -0.59 | 67 | 67 |
| PIK3CA | 0.027 | 0.03 | -10000 | 0 | -0.64 | 1 | 1 |
| DYNLT1 | 0.028 | 0.008 | -10000 | 0 | -10000 | 0 | 0 |
| NTRK1 | -0.017 | 0.16 | -10000 | 0 | -0.61 | 36 | 36 |
| NTRK2 | -0.091 | 0.25 | -10000 | 0 | -0.62 | 95 | 95 |
| NTRK3 | -0.007 | 0.15 | -10000 | 0 | -0.64 | 28 | 28 |
| NT-4/5 (dimer)/TRKB | -0.058 | 0.2 | -10000 | 0 | -0.43 | 111 | 111 |
| neuron apoptosis | 0.079 | 0.18 | 0.52 | 39 | -10000 | 0 | 39 |
| SHC 2-3/Grb2 | -0.086 | 0.2 | -10000 | 0 | -0.58 | 39 | 39 |
| SHC1 | 0.029 | 0.007 | -10000 | 0 | -10000 | 0 | 0 |
| SHC2 | -0.045 | 0.14 | -10000 | 0 | -0.5 | 24 | 24 |
| SHC3 | -0.11 | 0.23 | -10000 | 0 | -0.6 | 76 | 76 |
| STAT3 (dimer) | 0.027 | 0.054 | -10000 | 0 | -10000 | 0 | 0 |
| NT3 (dimer)/TRKA | -0.008 | 0.16 | -10000 | 0 | -0.4 | 68 | 68 |
| RIN/GDP | 0.049 | 0.085 | 0.3 | 14 | -0.31 | 5 | 19 |
| GIPC1 | 0.029 | 0.03 | -10000 | 0 | -0.64 | 1 | 1 |
| KRAS | 0.029 | 0.006 | -10000 | 0 | -10000 | 0 | 0 |
| DNAJA3 | -0.031 | 0.11 | -10000 | 0 | -0.42 | 16 | 16 |
| RIN/GTP | 0.014 | 0.02 | -10000 | 0 | -0.43 | 1 | 1 |
| CCND1 | 0.011 | 0.099 | -10000 | 0 | -0.51 | 18 | 18 |
| MAGED1 | 0.03 | 0.003 | -10000 | 0 | -10000 | 0 | 0 |
| PTPN11 | 0.029 | 0.006 | -10000 | 0 | -10000 | 0 | 0 |
| RICS | 0 | 0 | -10000 | 0 | -10000 | 0 | 0 |
| NT-4/5 (dimer) | 0.017 | 0.057 | -10000 | 0 | -0.62 | 4 | 4 |
| SHC/GRB2/SOS1 | 0.056 | 0.017 | -10000 | 0 | -10000 | 0 | 0 |
| GRB2 | 0.029 | 0.005 | -10000 | 0 | -10000 | 0 | 0 |
| NGF (dimer)/TRKA/MATK | -0.054 | 0.2 | -10000 | 0 | -0.41 | 120 | 120 |
| TRKA/NEDD4-2 | 0.006 | 0.13 | -10000 | 0 | -0.46 | 34 | 34 |
| ELMO1 | 0.026 | 0.029 | -10000 | 0 | -0.59 | 1 | 1 |
| RhoG/GTP/ELMO1/DOCK1 | 0.034 | 0.03 | -10000 | 0 | -0.39 | 2 | 2 |
| NGF | -0.028 | 0.18 | -10000 | 0 | -0.59 | 47 | 47 |
| HRAS | 0.029 | 0.027 | -10000 | 0 | -0.59 | 1 | 1 |
| DOCK1 | 0.028 | 0.03 | -10000 | 0 | -0.64 | 1 | 1 |
| GAB2 | 0.03 | 0.003 | -10000 | 0 | -10000 | 0 | 0 |
| RIT2 | 0.019 | 0.028 | -10000 | 0 | -0.59 | 1 | 1 |
| RIT1 | 0.029 | 0.007 | -10000 | 0 | -10000 | 0 | 0 |
| FRS2 | 0.029 | 0.005 | -10000 | 0 | -10000 | 0 | 0 |
| DNM1 | 0.018 | 0.083 | -10000 | 0 | -0.6 | 9 | 9 |
| mol:GTP | 0 | 0 | -10000 | 0 | -10000 | 0 | 0 |
| CRK | 0.029 | 0.005 | -10000 | 0 | -10000 | 0 | 0 |
| SH2B1 (homopentamer) | 0 | 0 | -10000 | 0 | -10000 | 0 | 0 |
| RhoG/GTP | -0.014 | 0.11 | -10000 | 0 | -0.42 | 15 | 15 |
| mol:GDP | 0.056 | 0.12 | 0.4 | 15 | -0.45 | 8 | 23 |
| NGF (dimer) | -0.028 | 0.18 | -10000 | 0 | -0.59 | 47 | 47 |
| RhoG/GDP | 0.019 | 0.021 | -10000 | 0 | -0.43 | 1 | 1 |
| RIT1/GDP | 0.05 | 0.08 | 0.31 | 11 | -0.3 | 5 | 16 |
| TIAM1 | 0.029 | 0.006 | -10000 | 0 | -10000 | 0 | 0 |
| PIK3R1 | 0.026 | 0.031 | -10000 | 0 | -0.64 | 1 | 1 |
| BDNF (dimer)/TRKB | -0.077 | 0.22 | -10000 | 0 | -0.41 | 143 | 143 |
| KIDINS220/CRKL/C3G | 0.043 | 0.01 | -10000 | 0 | -10000 | 0 | 0 |
| SHC/RasGAP | 0.037 | 0.028 | -10000 | 0 | -0.47 | 1 | 1 |
| FRS2 family/SHP2 | 0.057 | 0.017 | -10000 | 0 | -10000 | 0 | 0 |
| SHC/GRB2/SOS1/GAB1 | 0.071 | 0.023 | -10000 | 0 | -10000 | 0 | 0 |
| RIT1/GTP | 0.021 | 0.005 | -10000 | 0 | -10000 | 0 | 0 |
| NT3 (dimer) | 0.023 | 0.064 | -10000 | 0 | -0.62 | 5 | 5 |
| RAP1/GDP | 0.034 | 0.057 | -10000 | 0 | -0.26 | 4 | 4 |
| KIDINS220/CRKL | 0.03 | 0.004 | -10000 | 0 | -10000 | 0 | 0 |
| BDNF (dimer) | -0.051 | 0.21 | -10000 | 0 | -0.59 | 67 | 67 |
| ubiquitin-dependent protein catabolic process | -0.014 | 0.16 | -10000 | 0 | -0.38 | 79 | 79 |
| Schwann cell development | -0.02 | 0.027 | -10000 | 0 | -10000 | 0 | 0 |
| EHD4 | 0.03 | 0.003 | -10000 | 0 | -10000 | 0 | 0 |
| FRS2 family/GRB2/SOS1 | 0.07 | 0.023 | -10000 | 0 | -10000 | 0 | 0 |
| FRS2 family/SHP2/CRK family/C3G/GAB2 | 0.042 | 0.024 | -10000 | 0 | -10000 | 0 | 0 |
| RAP1B | 0.029 | 0.005 | -10000 | 0 | -10000 | 0 | 0 |
| RAP1A | 0.029 | 0.005 | -10000 | 0 | -10000 | 0 | 0 |
| CDC42/GTP | -0.064 | 0.2 | -10000 | 0 | -0.62 | 25 | 25 |
| ABL1 | 0.029 | 0.006 | -10000 | 0 | -10000 | 0 | 0 |
| SH2B family/GRB2/SOS1 | 0.043 | 0.01 | -10000 | 0 | -10000 | 0 | 0 |
| Rap1/GTP | 0 | 0.11 | -10000 | 0 | -0.47 | 8 | 8 |
| STAT3 | 0.027 | 0.054 | -10000 | 0 | -10000 | 0 | 0 |
| axon guidance | -0.07 | 0.18 | -10000 | 0 | -0.59 | 25 | 25 |
| MAPK3 | -0.063 | 0.18 | -10000 | 0 | -0.37 | 117 | 117 |
| MAPK1 | -0.062 | 0.18 | -10000 | 0 | -0.43 | 43 | 43 |
| CDC42/GDP | 0.057 | 0.087 | 0.33 | 16 | -0.31 | 4 | 20 |
| NTF3 | 0.023 | 0.064 | -10000 | 0 | -0.62 | 5 | 5 |
| NTF4 | 0.017 | 0.057 | -10000 | 0 | -0.62 | 4 | 4 |
| NGF (dimer)/TRKA/FAIM | -0.015 | 0.16 | -10000 | 0 | -0.38 | 78 | 78 |
| PI3K | 0.037 | 0.035 | -10000 | 0 | -0.47 | 2 | 2 |
| FRS3 | 0.029 | 0.006 | -10000 | 0 | -10000 | 0 | 0 |
| FAIM | 0.029 | 0.007 | -10000 | 0 | -10000 | 0 | 0 |
| GAB1 | 0.03 | 0.004 | -10000 | 0 | -10000 | 0 | 0 |
| RASGRF1 | -0.036 | 0.12 | -10000 | 0 | -0.42 | 23 | 23 |
| SOS1 | 0.029 | 0.005 | -10000 | 0 | -10000 | 0 | 0 |
| MCF2L | 0.002 | 0.1 | -10000 | 0 | -0.43 | 27 | 27 |
| RGS19 | 0.029 | 0.006 | -10000 | 0 | -10000 | 0 | 0 |
| CDC42 | 0.029 | 0.006 | -10000 | 0 | -10000 | 0 | 0 |
| RAS family/GTP | 0.05 | 0.095 | 0.33 | 2 | -0.57 | 6 | 8 |
| Rac1/GDP | 0.046 | 0.074 | 0.28 | 7 | -0.31 | 5 | 12 |
| NGF (dimer)/TRKA/GRIT | -0.029 | 0.16 | -10000 | 0 | -0.39 | 79 | 79 |
| neuron projection morphogenesis | 0.001 | 0.16 | 0.41 | 1 | -1.1 | 6 | 7 |
| NGF (dimer)/TRKA/NEDD4-2 | -0.014 | 0.16 | -10000 | 0 | -0.38 | 79 | 79 |
| MAP2K1 | 0.041 | 0.048 | 0.43 | 3 | -10000 | 0 | 3 |
| NGFR | -0.012 | 0.16 | -10000 | 0 | -0.6 | 34 | 34 |
| NGF (dimer)/TRKA/GIPC/GAIP | -0.006 | 0.1 | -10000 | 0 | -0.42 | 10 | 10 |
| RAS family/GTP/PI3K | 0.03 | 0.033 | -10000 | 0 | -0.44 | 2 | 2 |
| FRS2 family/SHP2/GRB2/SOS1 | 0.081 | 0.028 | -10000 | 0 | -10000 | 0 | 0 |
| NRAS | 0.029 | 0.005 | -10000 | 0 | -10000 | 0 | 0 |
| GRB2/SOS1 | 0.043 | 0.01 | -10000 | 0 | -10000 | 0 | 0 |
| PRKCI | 0.029 | 0.007 | -10000 | 0 | -10000 | 0 | 0 |
| ChemicalAbstracts:146-91-8 | 0 | 0 | -10000 | 0 | -10000 | 0 | 0 |
| RAC1 | 0.027 | 0.009 | -10000 | 0 | -10000 | 0 | 0 |
| PRKCZ | 0.025 | 0.051 | -10000 | 0 | -0.64 | 3 | 3 |
| MAPKKK cascade | -0.065 | 0.2 | -10000 | 0 | -0.61 | 53 | 53 |
| RASA1 | 0.025 | 0.031 | -10000 | 0 | -0.64 | 1 | 1 |
| TRKA/c-Abl | 0.006 | 0.13 | -10000 | 0 | -0.47 | 33 | 33 |
| SQSTM1 | 0.023 | 0.013 | -10000 | 0 | -10000 | 0 | 0 |
| BDNF (dimer)/TRKB/GIPC | -0.059 | 0.2 | -10000 | 0 | -0.37 | 143 | 143 |
| NGF (dimer)/TRKA/p62/Atypical PKCs | 0.007 | 0.13 | -10000 | 0 | -0.65 | 1 | 1 |
| MATK | -0.033 | 0.19 | -10000 | 0 | -0.59 | 52 | 52 |
| NEDD4L | 0.028 | 0.03 | -10000 | 0 | -0.64 | 1 | 1 |
| RAS family/GDP | -0.009 | 0.034 | -10000 | 0 | -10000 | 0 | 0 |
| NGF (dimer)/TRKA | -0.032 | 0.12 | -10000 | 0 | -0.34 | 39 | 39 |
| Rac1/GTP | -0.03 | 0.067 | -10000 | 0 | -0.35 | 5 | 5 |
| FRS2 family/SHP2/CRK family | 0.081 | 0.027 | -10000 | 0 | -10000 | 0 | 0 |
Figure S56. Get High-res Image This plot shows pathway concept perturbations across all samples against a permutation model. The concepts along the x-axis are sorted by lowest to highest mean activity for the real patient samples. Mean inferred activities are plotted along the y-axis as a colored band showing the average level and one standard deviation range. Real samples are shown in red and permuted samples in black.
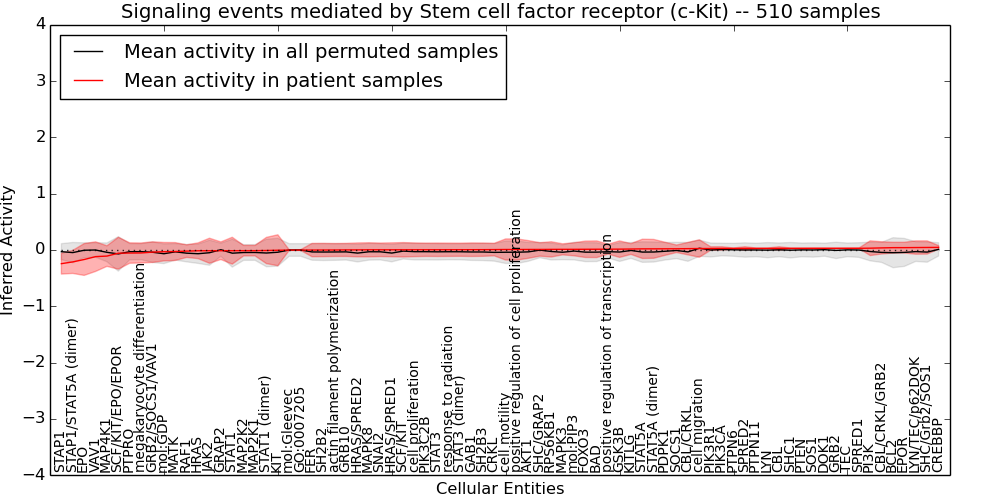
Table S56. Get Full Table This table displays mean, standard deviation, and perturbation statistics for Inferred Pathway Levels (IPLs). A mean perturbation of -9999 implies that the IPLs across all the real samples did not differ enough from the IPLs generated by a background model of permuted samples (> 1 Std.Dev from the permuted sample IPLs).
| Entity | Mean | Std.Dev | Mean.of.Up.Perturbations | Number.of.Up.Perturbations | Mean.of.Down.Perturbations | Number.of.Down.Perturbations | Number.of.Total.Perturbations |
|---|---|---|---|---|---|---|---|
| MAP4K1 | -0.11 | 0.18 | -10000 | 0 | -0.65 | 18 | 18 |
| CRKL | 0.007 | 0.11 | -10000 | 0 | -0.49 | 18 | 18 |
| HRAS | -0.013 | 0.14 | -10000 | 0 | -0.53 | 10 | 10 |
| mol:PIP3 | 0.012 | 0.12 | -10000 | 0 | -0.46 | 19 | 19 |
| SPRED1 | 0.03 | 0.003 | -10000 | 0 | -10000 | 0 | 0 |
| SPRED2 | 0.028 | 0.03 | -10000 | 0 | -0.64 | 1 | 1 |
| GAB1 | 0.005 | 0.12 | -10000 | 0 | -0.51 | 21 | 21 |
| FOXO3 | 0.013 | 0.15 | 0.46 | 1 | -0.62 | 12 | 13 |
| AKT1 | 0.01 | 0.16 | -10000 | 0 | -0.56 | 21 | 21 |
| BAD | 0.014 | 0.15 | 0.38 | 2 | -0.63 | 12 | 14 |
| megakaryocyte differentiation | -0.053 | 0.18 | -10000 | 0 | -0.45 | 53 | 53 |
| GSK3B | 0.015 | 0.15 | 0.34 | 3 | -0.62 | 12 | 15 |
| RAF1 | -0.02 | 0.11 | 0.31 | 2 | -0.45 | 6 | 8 |
| SHC1 | 0.029 | 0.007 | -10000 | 0 | -10000 | 0 | 0 |
| STAT3 | 0.004 | 0.12 | -10000 | 0 | -0.5 | 21 | 21 |
| STAT1 | -0.013 | 0.24 | -10000 | 0 | -1.1 | 21 | 21 |
| HRAS/SPRED1 | 0.004 | 0.12 | -10000 | 0 | -0.46 | 6 | 6 |
| cell proliferation | 0.004 | 0.12 | -10000 | 0 | -0.51 | 21 | 21 |
| PIK3CA | 0.027 | 0.03 | -10000 | 0 | -0.64 | 1 | 1 |
| TEC | 0.03 | 0.004 | -10000 | 0 | -10000 | 0 | 0 |
| RPS6KB1 | 0.011 | 0.14 | -10000 | 0 | -0.51 | 24 | 24 |
| HRAS/SPRED2 | 0.002 | 0.12 | -10000 | 0 | -0.45 | 7 | 7 |
| LYN/TEC/p62DOK | 0.044 | 0.12 | -10000 | 0 | -0.48 | 17 | 17 |
| MAPK3 | 0.012 | 0.099 | 0.31 | 9 | -0.34 | 3 | 12 |
| STAP1 | -0.24 | 0.18 | -10000 | 0 | -0.4 | 158 | 158 |
| GRAP2 | -0.013 | 0.16 | -10000 | 0 | -0.59 | 35 | 35 |
| JAK2 | -0.013 | 0.22 | -10000 | 0 | -1 | 21 | 21 |
| STAT1 (dimer) | -0.009 | 0.23 | -10000 | 0 | -1.1 | 21 | 21 |
| mol:Gleevec | -0.002 | 0.006 | -10000 | 0 | -10000 | 0 | 0 |
| GRB2/SOCS1/VAV1 | -0.038 | 0.18 | -10000 | 0 | -0.61 | 15 | 15 |
| actin filament polymerization | 0 | 0.12 | -10000 | 0 | -0.49 | 20 | 20 |
| LYN | 0.028 | 0.007 | -10000 | 0 | -10000 | 0 | 0 |
| STAP1/STAT5A (dimer) | -0.21 | 0.2 | -10000 | 0 | -0.75 | 30 | 30 |
| PIK3R1 | 0.026 | 0.031 | -10000 | 0 | -0.63 | 1 | 1 |
| CBL/CRKL/GRB2 | 0.037 | 0.11 | -10000 | 0 | -0.54 | 7 | 7 |
| PI3K | 0.032 | 0.13 | -10000 | 0 | -0.5 | 19 | 19 |
| PTEN | 0.029 | 0.006 | -10000 | 0 | -10000 | 0 | 0 |
| SCF/KIT/EPO/EPOR | -0.057 | 0.28 | -10000 | 0 | -1.2 | 21 | 21 |
| MAPK8 | 0.004 | 0.12 | -10000 | 0 | -0.52 | 21 | 21 |
| STAT3 (dimer) | 0.005 | 0.12 | -10000 | 0 | -0.49 | 21 | 21 |
| positive regulation of transcription | 0.015 | 0.088 | 0.29 | 11 | -0.29 | 2 | 13 |
| mol:GDP | -0.03 | 0.16 | -10000 | 0 | -0.59 | 10 | 10 |
| PIK3C2B | 0.004 | 0.12 | -10000 | 0 | -0.5 | 21 | 21 |
| CBL/CRKL | 0.024 | 0.11 | -10000 | 0 | -0.48 | 15 | 15 |
| FER | -0.001 | 0.12 | -10000 | 0 | -0.5 | 21 | 21 |
| SH2B3 | 0.006 | 0.12 | -10000 | 0 | -0.5 | 21 | 21 |
| PDPK1 | 0.021 | 0.12 | 0.34 | 6 | -0.42 | 18 | 24 |
| SNAI2 | 0.004 | 0.12 | -10000 | 0 | -0.51 | 21 | 21 |
| positive regulation of cell proliferation | 0.009 | 0.19 | -10000 | 0 | -0.81 | 21 | 21 |
| KITLG | 0.017 | 0.096 | -10000 | 0 | -0.65 | 10 | 10 |
| cell motility | 0.009 | 0.19 | -10000 | 0 | -0.81 | 21 | 21 |
| PTPN6 | 0.028 | 0.008 | -10000 | 0 | -10000 | 0 | 0 |
| EPOR | 0.042 | 0.095 | -10000 | 0 | -1.1 | 2 | 2 |
| STAT5A (dimer) | 0.021 | 0.17 | -10000 | 0 | -0.64 | 24 | 24 |
| SOCS1 | 0.022 | 0.067 | -10000 | 0 | -0.59 | 6 | 6 |
| cell migration | 0.026 | 0.16 | 0.53 | 27 | -10000 | 0 | 27 |
| SOS1 | 0.029 | 0.005 | -10000 | 0 | -10000 | 0 | 0 |
| EPO | -0.17 | 0.28 | -10000 | 0 | -0.58 | 163 | 163 |
| VAV1 | -0.12 | 0.26 | -10000 | 0 | -0.59 | 122 | 122 |
| GRB10 | 0.002 | 0.12 | -10000 | 0 | -0.5 | 20 | 20 |
| PTPN11 | 0.028 | 0.007 | -10000 | 0 | -10000 | 0 | 0 |
| SCF/KIT | 0.004 | 0.13 | -10000 | 0 | -0.52 | 23 | 23 |
| GO:0007205 | -0.001 | 0.006 | -10000 | 0 | -10000 | 0 | 0 |
| MAP2K1 | -0.012 | 0.093 | 0.31 | 3 | -0.39 | 3 | 6 |
| CBL | 0.029 | 0.03 | -10000 | 0 | -0.64 | 1 | 1 |
| KIT | -0.004 | 0.28 | -10000 | 0 | -1.3 | 21 | 21 |
| MAP2K2 | -0.012 | 0.093 | 0.35 | 3 | -0.39 | 3 | 6 |
| SHC/Grb2/SOS1 | 0.045 | 0.12 | -10000 | 0 | -0.57 | 8 | 8 |
| STAT5A | 0.02 | 0.17 | -10000 | 0 | -0.66 | 24 | 24 |
| GRB2 | 0.029 | 0.005 | -10000 | 0 | -10000 | 0 | 0 |
| response to radiation | 0.005 | 0.12 | 0.28 | 1 | -0.5 | 21 | 22 |
| SHC/GRAP2 | 0.01 | 0.12 | -10000 | 0 | -0.43 | 34 | 34 |
| PTPRO | -0.054 | 0.18 | -10000 | 0 | -0.47 | 52 | 52 |
| SH2B2 | 0 | 0.12 | -10000 | 0 | -0.51 | 20 | 20 |
| DOK1 | 0.029 | 0.005 | -10000 | 0 | -10000 | 0 | 0 |
| MATK | -0.027 | 0.16 | -10000 | 0 | -0.54 | 27 | 27 |
| CREBBP | 0.046 | 0.031 | -10000 | 0 | -10000 | 0 | 0 |
| BCL2 | 0.042 | 0.096 | -10000 | 0 | -0.88 | 2 | 2 |
Figure S57. Get High-res Image This plot shows pathway concept perturbations across all samples against a permutation model. The concepts along the x-axis are sorted by lowest to highest mean activity for the real patient samples. Mean inferred activities are plotted along the y-axis as a colored band showing the average level and one standard deviation range. Real samples are shown in red and permuted samples in black.
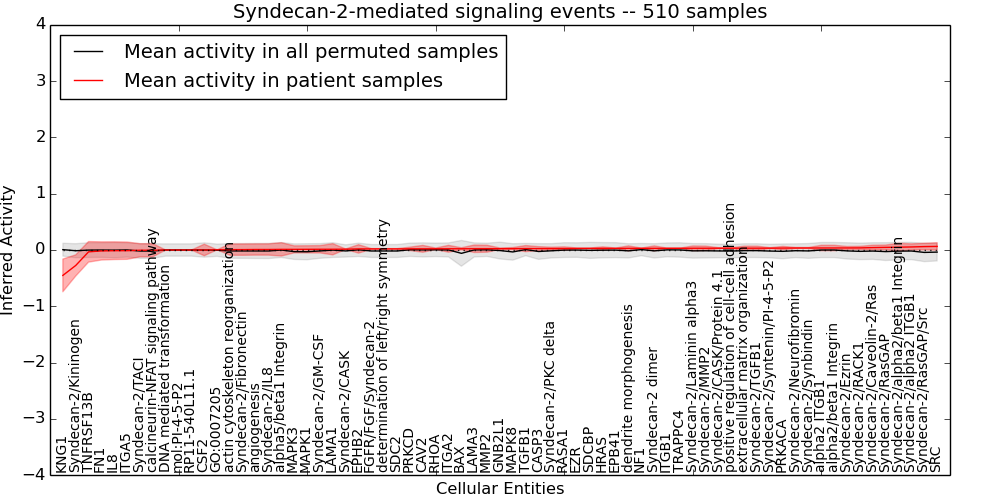
Table S57. Get Full Table This table displays mean, standard deviation, and perturbation statistics for Inferred Pathway Levels (IPLs). A mean perturbation of -9999 implies that the IPLs across all the real samples did not differ enough from the IPLs generated by a background model of permuted samples (> 1 Std.Dev from the permuted sample IPLs).
| Entity | Mean | Std.Dev | Mean.of.Up.Perturbations | Number.of.Up.Perturbations | Mean.of.Down.Perturbations | Number.of.Down.Perturbations | Number.of.Total.Perturbations |
|---|---|---|---|---|---|---|---|
| Syndecan-2/Fibronectin | 0.007 | 0.1 | -10000 | 0 | -0.37 | 33 | 33 |
| EPHB2 | 0.019 | 0.075 | -10000 | 0 | -0.52 | 9 | 9 |
| Syndecan-2/TACI | -0.004 | 0.12 | -10000 | 0 | -0.36 | 49 | 49 |
| LAMA1 | 0.013 | 0.099 | -10000 | 0 | -0.56 | 14 | 14 |
| Syndecan-2/alpha2 ITGB1 | 0.054 | 0.055 | -10000 | 0 | -0.34 | 3 | 3 |
| HRAS | 0.029 | 0.027 | -10000 | 0 | -0.59 | 1 | 1 |
| Syndecan-2/CASK | 0.015 | 0.004 | -10000 | 0 | -10000 | 0 | 0 |
| ITGA5 | -0.012 | 0.15 | -10000 | 0 | -0.59 | 34 | 34 |
| BAX | 0.022 | 0.018 | -10000 | 0 | -10000 | 0 | 0 |
| EPB41 | 0.029 | 0.006 | -10000 | 0 | -10000 | 0 | 0 |
| positive regulation of cell-cell adhesion | 0.032 | 0.009 | -10000 | 0 | -10000 | 0 | 0 |
| LAMA3 | 0.022 | 0.067 | -10000 | 0 | -0.59 | 6 | 6 |
| EZR | 0.028 | 0.008 | -10000 | 0 | -10000 | 0 | 0 |
| mol:PI-4-5-P2 | 0 | 0 | -10000 | 0 | -10000 | 0 | 0 |
| CAV2 | 0.021 | 0.061 | -10000 | 0 | -0.59 | 5 | 5 |
| Syndecan-2/MMP2 | 0.031 | 0.038 | -10000 | 0 | -0.37 | 4 | 4 |
| RP11-540L11.1 | 0 | 0 | -10000 | 0 | -10000 | 0 | 0 |
| alpha2 ITGB1 | 0.036 | 0.049 | -10000 | 0 | -0.47 | 4 | 4 |
| dendrite morphogenesis | 0.029 | 0.044 | -10000 | 0 | -0.4 | 4 | 4 |
| Syndecan-2/GM-CSF | 0.013 | 0.065 | -10000 | 0 | -0.36 | 14 | 14 |
| determination of left/right symmetry | 0.02 | 0.005 | -10000 | 0 | -10000 | 0 | 0 |
| Syndecan-2/PKC delta | 0.025 | 0.025 | -10000 | 0 | -0.36 | 1 | 1 |
| GNB2L1 | 0.023 | 0.013 | -10000 | 0 | -10000 | 0 | 0 |
| MAPK3 | 0.011 | 0.062 | -10000 | 0 | -0.33 | 14 | 14 |
| MAPK1 | 0.012 | 0.063 | -10000 | 0 | -0.33 | 14 | 14 |
| Syndecan-2/RACK1 | 0.037 | 0.028 | -10000 | 0 | -10000 | 0 | 0 |
| NF1 | 0.03 | 0.005 | -10000 | 0 | -10000 | 0 | 0 |
| FGFR/FGF/Syndecan-2 | 0.02 | 0.005 | -10000 | 0 | -10000 | 0 | 0 |
| ITGA2 | 0.022 | 0.061 | -10000 | 0 | -0.57 | 5 | 5 |
| MAPK8 | 0.024 | 0.02 | -10000 | 0 | -0.39 | 1 | 1 |
| Syndecan-2/alpha2/beta1 Integrin | 0.05 | 0.069 | -10000 | 0 | -0.34 | 9 | 9 |
| Syndecan-2/Kininogen | -0.28 | 0.19 | -10000 | 0 | -0.4 | 351 | 351 |
| ITGB1 | 0.03 | 0.004 | -10000 | 0 | -10000 | 0 | 0 |
| SRC | 0.064 | 0.066 | 0.35 | 1 | -10000 | 0 | 1 |
| Syndecan-2/CASK/Protein 4.1 | 0.032 | 0.01 | -10000 | 0 | -10000 | 0 | 0 |
| extracellular matrix organization | 0.032 | 0.036 | -10000 | 0 | -0.36 | 4 | 4 |
| actin cytoskeleton reorganization | 0.007 | 0.1 | -10000 | 0 | -0.37 | 33 | 33 |
| Syndecan-2/Caveolin-2/Ras | 0.043 | 0.043 | -10000 | 0 | -0.33 | 5 | 5 |
| Syndecan-2/Laminin alpha3 | 0.031 | 0.041 | -10000 | 0 | -0.36 | 5 | 5 |
| Syndecan-2/RasGAP | 0.046 | 0.042 | -10000 | 0 | -0.62 | 1 | 1 |
| alpha5/beta1 Integrin | 0.011 | 0.12 | -10000 | 0 | -0.43 | 34 | 34 |
| PRKCD | 0.02 | 0.03 | -10000 | 0 | -0.59 | 1 | 1 |
| Syndecan-2 dimer | 0.03 | 0.044 | -10000 | 0 | -0.4 | 4 | 4 |
| GO:0007205 | 0.004 | 0 | -10000 | 0 | -10000 | 0 | 0 |
| DNA mediated transformation | 0 | 0 | -10000 | 0 | -10000 | 0 | 0 |
| Syndecan-2/RasGAP/Src | 0.061 | 0.059 | -10000 | 0 | -0.6 | 1 | 1 |
| RHOA | 0.021 | 0.014 | -10000 | 0 | -10000 | 0 | 0 |
| SDCBP | 0.028 | 0.007 | -10000 | 0 | -10000 | 0 | 0 |
| TNFRSF13B | -0.033 | 0.18 | -10000 | 0 | -0.59 | 50 | 50 |
| RASA1 | 0.025 | 0.031 | -10000 | 0 | -0.64 | 1 | 1 |
| alpha2/beta1 Integrin | 0.036 | 0.049 | -10000 | 0 | -0.47 | 4 | 4 |
| Syndecan-2/Synbindin | 0.036 | 0.009 | -10000 | 0 | -10000 | 0 | 0 |
| TGFB1 | 0.025 | 0.055 | -10000 | 0 | -0.59 | 4 | 4 |
| CASP3 | 0.025 | 0.035 | -10000 | 0 | -0.33 | 1 | 1 |
| FN1 | -0.017 | 0.16 | -10000 | 0 | -0.59 | 37 | 37 |
| Syndecan-2/IL8 | 0.009 | 0.1 | -10000 | 0 | -0.37 | 32 | 32 |
| SDC2 | 0.02 | 0.005 | -10000 | 0 | -10000 | 0 | 0 |
| KNG1 | -0.45 | 0.29 | -10000 | 0 | -0.63 | 370 | 370 |
| Syndecan-2/Neurofibromin | 0.035 | 0.01 | -10000 | 0 | -10000 | 0 | 0 |
| TRAPPC4 | 0.03 | 0.004 | -10000 | 0 | -10000 | 0 | 0 |
| CSF2 | 0 | 0.1 | -10000 | 0 | -0.59 | 15 | 15 |
| Syndecan-2/TGFB1 | 0.032 | 0.036 | -10000 | 0 | -0.36 | 4 | 4 |
| Syndecan-2/Syntenin/PI-4-5-P2 | 0.032 | 0.009 | -10000 | 0 | -10000 | 0 | 0 |
| Syndecan-2/Ezrin | 0.036 | 0.026 | -10000 | 0 | -10000 | 0 | 0 |
| PRKACA | 0.034 | 0.03 | -10000 | 0 | -10000 | 0 | 0 |
| angiogenesis | 0.009 | 0.1 | -10000 | 0 | -0.37 | 32 | 32 |
| MMP2 | 0.023 | 0.062 | -10000 | 0 | -0.6 | 5 | 5 |
| IL8 | -0.012 | 0.16 | -10000 | 0 | -0.6 | 34 | 34 |
| calcineurin-NFAT signaling pathway | -0.004 | 0.12 | -10000 | 0 | -0.36 | 49 | 49 |
Figure S58. Get High-res Image This plot shows pathway concept perturbations across all samples against a permutation model. The concepts along the x-axis are sorted by lowest to highest mean activity for the real patient samples. Mean inferred activities are plotted along the y-axis as a colored band showing the average level and one standard deviation range. Real samples are shown in red and permuted samples in black.
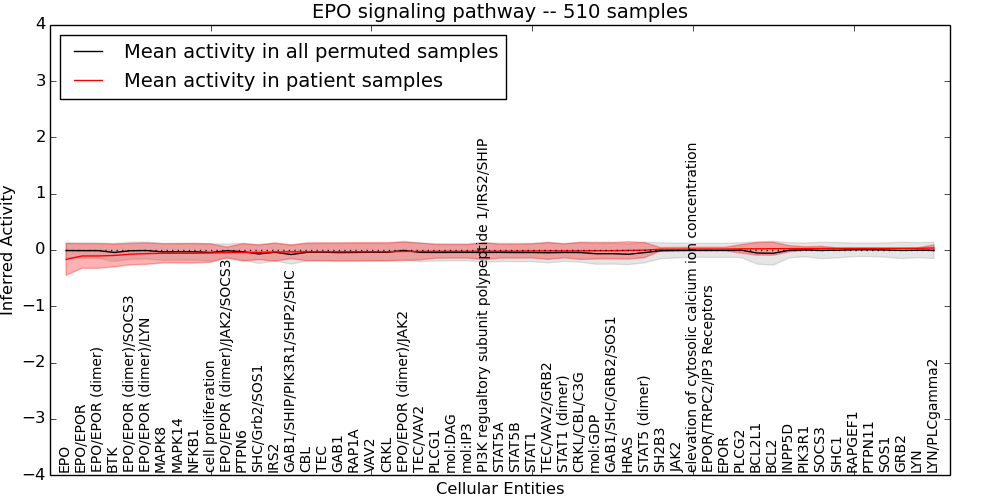
Table S58. Get Full Table This table displays mean, standard deviation, and perturbation statistics for Inferred Pathway Levels (IPLs). A mean perturbation of -9999 implies that the IPLs across all the real samples did not differ enough from the IPLs generated by a background model of permuted samples (> 1 Std.Dev from the permuted sample IPLs).
| Entity | Mean | Std.Dev | Mean.of.Up.Perturbations | Number.of.Up.Perturbations | Mean.of.Down.Perturbations | Number.of.Down.Perturbations | Number.of.Total.Perturbations |
|---|---|---|---|---|---|---|---|
| BCL2L1 | 0.021 | 0.11 | 0.46 | 3 | -10000 | 0 | 3 |
| CRKL | -0.03 | 0.16 | 0.38 | 14 | -10000 | 0 | 14 |
| mol:DAG | -0.024 | 0.12 | -10000 | 0 | -10000 | 0 | 0 |
| HRAS | -0.008 | 0.16 | 0.42 | 15 | -0.45 | 1 | 16 |
| MAPK8 | -0.059 | 0.17 | 0.36 | 1 | -0.37 | 1 | 2 |
| RAP1A | -0.031 | 0.16 | 0.38 | 15 | -10000 | 0 | 15 |
| GAB1 | -0.031 | 0.16 | 0.36 | 13 | -10000 | 0 | 13 |
| MAPK14 | -0.058 | 0.17 | 0.36 | 1 | -10000 | 0 | 1 |
| EPO | -0.17 | 0.28 | -10000 | 0 | -0.58 | 163 | 163 |
| PLCG1 | -0.024 | 0.12 | -10000 | 0 | -10000 | 0 | 0 |
| EPOR/TRPC2/IP3 Receptors | 0.016 | 0.032 | -10000 | 0 | -10000 | 0 | 0 |
| RAPGEF1 | 0.029 | 0.006 | -10000 | 0 | -10000 | 0 | 0 |
| EPO/EPOR (dimer)/SOCS3 | -0.074 | 0.19 | -10000 | 0 | -0.35 | 161 | 161 |
| GAB1/SHC/GRB2/SOS1 | -0.012 | 0.15 | -10000 | 0 | -10000 | 0 | 0 |
| EPO/EPOR (dimer) | -0.11 | 0.22 | -10000 | 0 | -0.42 | 163 | 163 |
| IRS2 | -0.036 | 0.16 | 0.37 | 13 | -0.47 | 2 | 15 |
| STAT1 | -0.016 | 0.13 | -10000 | 0 | -10000 | 0 | 0 |
| STAT5B | -0.021 | 0.12 | -10000 | 0 | -10000 | 0 | 0 |
| cell proliferation | -0.053 | 0.16 | 0.38 | 6 | -10000 | 0 | 6 |
| GAB1/SHIP/PIK3R1/SHP2/SHC | -0.033 | 0.12 | -10000 | 0 | -0.47 | 1 | 1 |
| TEC | -0.032 | 0.16 | 0.36 | 13 | -10000 | 0 | 13 |
| SOCS3 | 0.027 | 0.039 | -10000 | 0 | -0.59 | 2 | 2 |
| STAT1 (dimer) | -0.016 | 0.12 | -10000 | 0 | -10000 | 0 | 0 |
| JAK2 | 0.014 | 0.031 | -10000 | 0 | -10000 | 0 | 0 |
| PIK3R1 | 0.026 | 0.031 | -10000 | 0 | -0.64 | 1 | 1 |
| EPO/EPOR (dimer)/JAK2 | -0.025 | 0.16 | -10000 | 0 | -10000 | 0 | 0 |
| EPO/EPOR | -0.11 | 0.22 | -10000 | 0 | -0.42 | 163 | 163 |
| LYN | 0.03 | 0.008 | -10000 | 0 | -10000 | 0 | 0 |
| TEC/VAV2 | -0.025 | 0.15 | 0.3 | 4 | -10000 | 0 | 4 |
| elevation of cytosolic calcium ion concentration | 0.016 | 0.032 | -10000 | 0 | -10000 | 0 | 0 |
| SHC1 | 0.029 | 0.007 | -10000 | 0 | -10000 | 0 | 0 |
| EPO/EPOR (dimer)/LYN | -0.065 | 0.19 | -10000 | 0 | -0.34 | 159 | 159 |
| mol:IP3 | -0.024 | 0.12 | -10000 | 0 | -10000 | 0 | 0 |
| PI3K regualtory subunit polypeptide 1/IRS2/SHIP | -0.021 | 0.15 | 0.35 | 5 | -0.5 | 2 | 7 |
| SH2B3 | 0.014 | 0.03 | -10000 | 0 | -10000 | 0 | 0 |
| NFKB1 | -0.058 | 0.17 | 0.36 | 1 | -0.66 | 1 | 2 |
| EPO/EPOR (dimer)/JAK2/SOCS3 | -0.047 | 0.099 | -10000 | 0 | -0.34 | 5 | 5 |
| PTPN6 | -0.043 | 0.16 | 0.3 | 4 | -10000 | 0 | 4 |
| TEC/VAV2/GRB2 | -0.016 | 0.15 | -10000 | 0 | -10000 | 0 | 0 |
| EPOR | 0.016 | 0.032 | -10000 | 0 | -10000 | 0 | 0 |
| INPP5D | 0.024 | 0.055 | -10000 | 0 | -0.59 | 4 | 4 |
| mol:GDP | -0.013 | 0.15 | -10000 | 0 | -10000 | 0 | 0 |
| SOS1 | 0.029 | 0.005 | -10000 | 0 | -10000 | 0 | 0 |
| PLCG2 | 0.02 | 0.074 | -10000 | 0 | -0.61 | 7 | 7 |
| CRKL/CBL/C3G | -0.015 | 0.15 | -10000 | 0 | -0.54 | 1 | 1 |
| VAV2 | -0.031 | 0.16 | 0.37 | 14 | -10000 | 0 | 14 |
| CBL | -0.033 | 0.16 | 0.36 | 12 | -0.57 | 1 | 13 |
| SHC/Grb2/SOS1 | -0.041 | 0.13 | -10000 | 0 | -10000 | 0 | 0 |
| STAT5A | -0.021 | 0.12 | -10000 | 0 | -10000 | 0 | 0 |
| GRB2 | 0.029 | 0.005 | -10000 | 0 | -10000 | 0 | 0 |
| STAT5 (dimer) | -0.002 | 0.13 | -10000 | 0 | -10000 | 0 | 0 |
| LYN/PLCgamma2 | 0.036 | 0.056 | -10000 | 0 | -0.44 | 6 | 6 |
| PTPN11 | 0.029 | 0.006 | -10000 | 0 | -10000 | 0 | 0 |
| BTK | -0.097 | 0.2 | 0.38 | 13 | -0.54 | 28 | 41 |
| BCL2 | 0.023 | 0.12 | 0.42 | 4 | -10000 | 0 | 4 |
Figure S59. Get High-res Image This plot shows pathway concept perturbations across all samples against a permutation model. The concepts along the x-axis are sorted by lowest to highest mean activity for the real patient samples. Mean inferred activities are plotted along the y-axis as a colored band showing the average level and one standard deviation range. Real samples are shown in red and permuted samples in black.
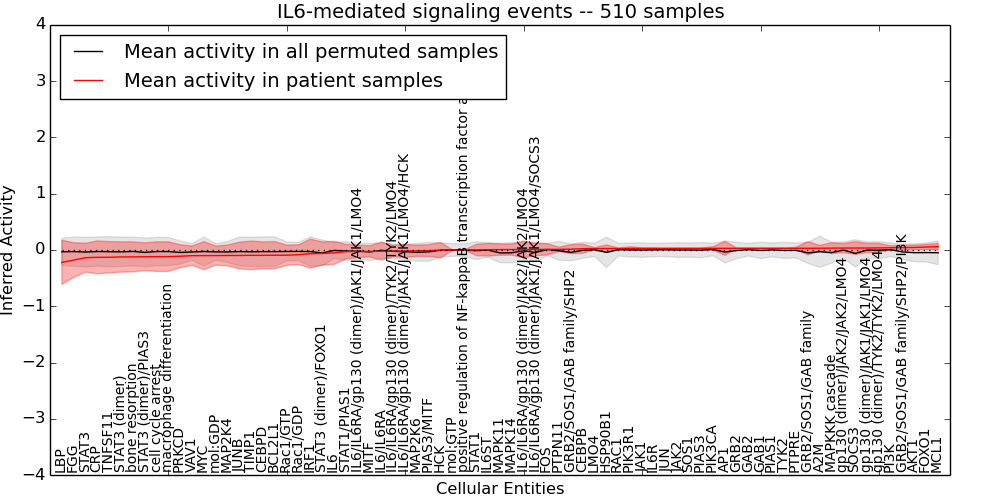
Table S59. Get Full Table This table displays mean, standard deviation, and perturbation statistics for Inferred Pathway Levels (IPLs). A mean perturbation of -9999 implies that the IPLs across all the real samples did not differ enough from the IPLs generated by a background model of permuted samples (> 1 Std.Dev from the permuted sample IPLs).
| Entity | Mean | Std.Dev | Mean.of.Up.Perturbations | Number.of.Up.Perturbations | Mean.of.Down.Perturbations | Number.of.Down.Perturbations | Number.of.Total.Perturbations |
|---|---|---|---|---|---|---|---|
| BCL2L1 | -0.093 | 0.24 | 0.55 | 4 | -0.62 | 24 | 28 |
| CRP | -0.13 | 0.29 | 0.55 | 1 | -0.69 | 61 | 62 |
| cell cycle arrest | -0.12 | 0.26 | -10000 | 0 | -0.67 | 41 | 41 |
| TIMP1 | -0.095 | 0.26 | -10000 | 0 | -0.66 | 35 | 35 |
| IL6ST | 0.005 | 0.11 | -10000 | 0 | -0.61 | 16 | 16 |
| Rac1/GDP | -0.084 | 0.18 | -10000 | 0 | -0.45 | 46 | 46 |
| AP1 | 0.029 | 0.12 | 0.46 | 1 | -0.75 | 4 | 5 |
| GAB2 | 0.03 | 0.003 | -10000 | 0 | -10000 | 0 | 0 |
| TNFSF11 | -0.13 | 0.28 | 0.61 | 1 | -0.74 | 36 | 37 |
| HSP90B1 | 0.026 | 0.065 | -10000 | 0 | -10000 | 0 | 0 |
| GAB1 | 0.03 | 0.004 | -10000 | 0 | -10000 | 0 | 0 |
| MAPK14 | 0.007 | 0.099 | -10000 | 0 | -0.6 | 3 | 3 |
| AKT1 | 0.045 | 0.041 | -10000 | 0 | -0.5 | 1 | 1 |
| FOXO1 | 0.053 | 0.045 | -10000 | 0 | -0.48 | 1 | 1 |
| MAP2K6 | -0.014 | 0.1 | -10000 | 0 | -0.61 | 4 | 4 |
| mol:GTP | -0.001 | 0.003 | -10000 | 0 | -10000 | 0 | 0 |
| MAP2K4 | -0.098 | 0.19 | -10000 | 0 | -0.48 | 44 | 44 |
| MITF | -0.024 | 0.1 | -10000 | 0 | -0.62 | 3 | 3 |
| positive regulation of NF-kappaB transcription factor activity | 0 | 0 | -10000 | 0 | -10000 | 0 | 0 |
| TYK2 | 0.03 | 0.003 | -10000 | 0 | -10000 | 0 | 0 |
| A2M | 0.031 | 0.051 | -10000 | 0 | -1.1 | 1 | 1 |
| CEBPB | 0.023 | 0.082 | -10000 | 0 | -0.58 | 9 | 9 |
| GRB2/SOS1/GAB family/SHP2 | 0.015 | 0.081 | -10000 | 0 | -0.66 | 4 | 4 |
| STAT3 | -0.14 | 0.26 | -10000 | 0 | -0.71 | 39 | 39 |
| STAT1 | 0.001 | 0.1 | -10000 | 0 | -0.82 | 7 | 7 |
| CEBPD | -0.095 | 0.24 | 0.54 | 2 | -0.62 | 23 | 25 |
| PIK3CA | 0.029 | 0.03 | -10000 | 0 | -0.63 | 1 | 1 |
| PI3K | 0.04 | 0.036 | -10000 | 0 | -0.47 | 2 | 2 |
| JUN | 0.028 | 0.006 | -10000 | 0 | -10000 | 0 | 0 |
| PIAS3/MITF | -0.01 | 0.11 | -10000 | 0 | -0.59 | 3 | 3 |
| MAPK11 | 0.007 | 0.1 | -10000 | 0 | -0.55 | 5 | 5 |
| STAT3 (dimer)/FOXO1 | -0.062 | 0.21 | 0.43 | 1 | -0.63 | 6 | 7 |
| GRB2/SOS1/GAB family | 0.031 | 0.12 | -10000 | 0 | -0.72 | 1 | 1 |
| IL6/IL6RA/gp130 (dimer)/JAK1/JAK1/LMO4/HCK | -0.017 | 0.12 | -10000 | 0 | -0.43 | 14 | 14 |
| GRB2 | 0.03 | 0.005 | -10000 | 0 | -10000 | 0 | 0 |
| JAK2 | 0.029 | 0.007 | -10000 | 0 | -10000 | 0 | 0 |
| LBP | -0.22 | 0.39 | 0.54 | 4 | -0.79 | 137 | 141 |
| PIK3R1 | 0.027 | 0.031 | -10000 | 0 | -0.63 | 1 | 1 |
| JAK1 | 0.028 | 0.011 | -10000 | 0 | -10000 | 0 | 0 |
| MYC | -0.1 | 0.25 | 0.54 | 3 | -0.64 | 30 | 33 |
| FGG | -0.18 | 0.31 | 0.52 | 1 | -0.7 | 71 | 72 |
| macrophage differentiation | -0.12 | 0.26 | -10000 | 0 | -0.67 | 41 | 41 |
| IL6/IL6RA/gp130 (dimer)/JAK2/JAK2/LMO4 | 0.008 | 0.15 | -10000 | 0 | -0.41 | 13 | 13 |
| JUNB | -0.097 | 0.24 | -10000 | 0 | -0.66 | 21 | 21 |
| FOS | 0.012 | 0.1 | -10000 | 0 | -0.63 | 12 | 12 |
| IL6/IL6RA/gp130 (dimer)/JAK1/JAK1/LMO4 | -0.025 | 0.11 | -10000 | 0 | -0.46 | 8 | 8 |
| STAT1/PIAS1 | -0.029 | 0.13 | -10000 | 0 | -0.51 | 6 | 6 |
| GRB2/SOS1/GAB family/SHP2/PI3K | 0.042 | 0.044 | -10000 | 0 | -0.54 | 1 | 1 |
| STAT3 (dimer) | -0.12 | 0.27 | -10000 | 0 | -0.7 | 40 | 40 |
| PRKCD | -0.11 | 0.2 | 0.42 | 7 | -0.55 | 36 | 43 |
| IL6R | 0.028 | 0.009 | -10000 | 0 | -10000 | 0 | 0 |
| SOCS3 | 0.035 | 0.11 | 0.45 | 1 | -0.84 | 1 | 2 |
| gp130 (dimer)/JAK1/JAK1/LMO4 | 0.035 | 0.083 | -10000 | 0 | -0.4 | 15 | 15 |
| Rac1/GTP | -0.092 | 0.18 | -10000 | 0 | -0.46 | 52 | 52 |
| HCK | -0.003 | 0.14 | -10000 | 0 | -0.59 | 26 | 26 |
| MAPKKK cascade | 0.033 | 0.097 | -10000 | 0 | -0.6 | 6 | 6 |
| bone resorption | -0.12 | 0.27 | 0.61 | 1 | -0.7 | 36 | 37 |
| IRF1 | -0.065 | 0.26 | 0.56 | 6 | -0.63 | 22 | 28 |
| mol:GDP | -0.099 | 0.17 | -10000 | 0 | -0.43 | 59 | 59 |
| SOS1 | 0.029 | 0.005 | -10000 | 0 | -10000 | 0 | 0 |
| VAV1 | -0.1 | 0.17 | -10000 | 0 | -0.44 | 59 | 59 |
| IL6/IL6RA/gp130 (dimer)/JAK1/JAK1/LMO4/SOCS3 | 0.009 | 0.11 | -10000 | 0 | -0.62 | 5 | 5 |
| PTPN11 | 0.012 | 0.039 | -10000 | 0 | -0.7 | 1 | 1 |
| IL6/IL6RA | -0.021 | 0.16 | -10000 | 0 | -0.45 | 59 | 59 |
| gp130 (dimer)/TYK2/TYK2/LMO4 | 0.037 | 0.081 | -10000 | 0 | -0.4 | 15 | 15 |
| gp130 (dimer)/JAK2/JAK2/LMO4 | 0.035 | 0.081 | -10000 | 0 | -0.4 | 15 | 15 |
| IL6 | -0.051 | 0.2 | -10000 | 0 | -0.61 | 60 | 60 |
| PIAS3 | 0.029 | 0.006 | -10000 | 0 | -10000 | 0 | 0 |
| PTPRE | 0.031 | 0.018 | -10000 | 0 | -10000 | 0 | 0 |
| PIAS1 | 0.03 | 0.003 | -10000 | 0 | -10000 | 0 | 0 |
| RAC1 | 0.027 | 0.009 | -10000 | 0 | -10000 | 0 | 0 |
| IL6/IL6RA/gp130 (dimer)/TYK2/TYK2/LMO4 | -0.018 | 0.1 | -10000 | 0 | -0.44 | 7 | 7 |
| LMO4 | 0.026 | 0.016 | -10000 | 0 | -10000 | 0 | 0 |
| STAT3 (dimer)/PIAS3 | -0.12 | 0.25 | -10000 | 0 | -0.68 | 32 | 32 |
| MCL1 | 0.059 | 0.058 | 0.38 | 1 | -10000 | 0 | 1 |
Figure S60. Get High-res Image This plot shows pathway concept perturbations across all samples against a permutation model. The concepts along the x-axis are sorted by lowest to highest mean activity for the real patient samples. Mean inferred activities are plotted along the y-axis as a colored band showing the average level and one standard deviation range. Real samples are shown in red and permuted samples in black.
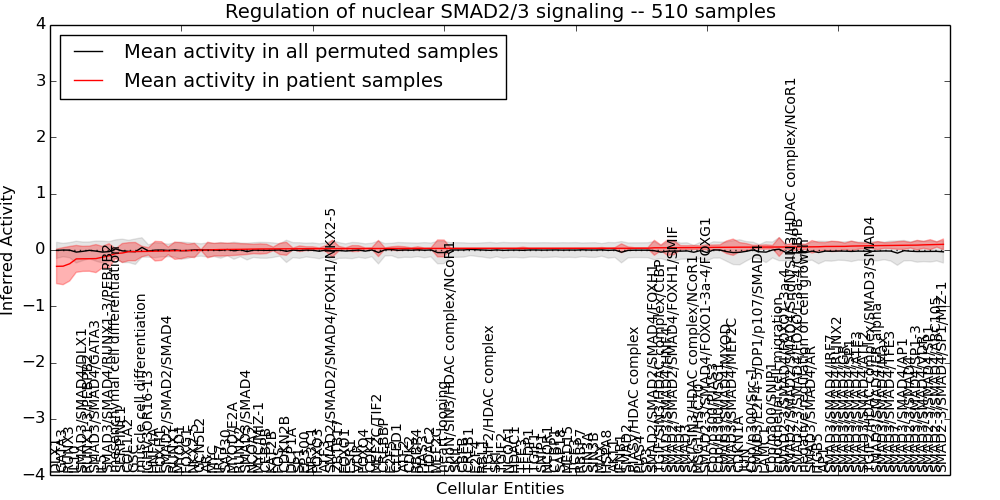
Table S60. Get Full Table This table displays mean, standard deviation, and perturbation statistics for Inferred Pathway Levels (IPLs). A mean perturbation of -9999 implies that the IPLs across all the real samples did not differ enough from the IPLs generated by a background model of permuted samples (> 1 Std.Dev from the permuted sample IPLs).
| Entity | Mean | Std.Dev | Mean.of.Up.Perturbations | Number.of.Up.Perturbations | Mean.of.Down.Perturbations | Number.of.Down.Perturbations | Number.of.Total.Perturbations |
|---|---|---|---|---|---|---|---|
| EP300 | 0.023 | 0.034 | -10000 | 0 | -0.62 | 1 | 1 |
| HSPA8 | 0.03 | 0.004 | -10000 | 0 | -10000 | 0 | 0 |
| SMAD3/SMAD4/ER alpha | 0.078 | 0.072 | 0.36 | 1 | -0.4 | 3 | 4 |
| AKT1 | 0.03 | 0.011 | -10000 | 0 | -10000 | 0 | 0 |
| GSC | -0.028 | 0.16 | -10000 | 0 | -0.56 | 13 | 13 |
| NKX2-5 | -0.009 | 0.13 | -10000 | 0 | -0.59 | 23 | 23 |
| muscle cell differentiation | -0.027 | 0.093 | 0.52 | 2 | -10000 | 0 | 2 |
| SMAD2-3/SMAD4/SP1 | 0.094 | 0.09 | -10000 | 0 | -10000 | 0 | 0 |
| SMAD4 | 0.041 | 0.036 | -10000 | 0 | -10000 | 0 | 0 |
| CBFB | 0.029 | 0.006 | -10000 | 0 | -10000 | 0 | 0 |
| SAP18 | 0.03 | 0.005 | -10000 | 0 | -10000 | 0 | 0 |
| Cbp/p300/MSG1 | 0.047 | 0.045 | -10000 | 0 | -0.37 | 3 | 3 |
| SMAD3/SMAD4/VDR | 0.092 | 0.062 | -10000 | 0 | -10000 | 0 | 0 |
| MYC | 0.005 | 0.11 | -10000 | 0 | -0.59 | 17 | 17 |
| CDKN2B | 0.021 | 0.12 | -10000 | 0 | -0.52 | 6 | 6 |
| AP1 | 0.063 | 0.068 | -10000 | 0 | -0.39 | 1 | 1 |
| SMAD2/SMAD2/SMAD4/SnoN/SIN3/HDAC complex/NCoR1 | 0.054 | 0.065 | -10000 | 0 | -0.38 | 4 | 4 |
| SMAD2-3/SMAD4/FOXO1-3a-4/FOXG1 | 0.045 | 0.043 | -10000 | 0 | -0.34 | 1 | 1 |
| SP3 | 0.032 | 0.007 | -10000 | 0 | -10000 | 0 | 0 |
| CREB1 | 0.029 | 0.006 | -10000 | 0 | -10000 | 0 | 0 |
| FOXH1 | -0.019 | 0.17 | -10000 | 0 | -0.6 | 38 | 38 |
| SMAD3/SMAD4/GR | 0.064 | 0.057 | -10000 | 0 | -0.39 | 1 | 1 |
| GATA3 | -0.29 | 0.33 | -10000 | 0 | -0.62 | 246 | 246 |
| SKI/SIN3/HDAC complex/NCoR1 | 0.043 | 0.036 | -10000 | 0 | -0.36 | 1 | 1 |
| MEF2C/TIF2 | 0.027 | 0.14 | -10000 | 0 | -0.57 | 9 | 9 |
| endothelial cell migration | 0.053 | 0.17 | 0.46 | 54 | -10000 | 0 | 54 |
| MAX | 0.03 | 0.014 | -10000 | 0 | -10000 | 0 | 0 |
| RBBP7 | 0.03 | 0.003 | -10000 | 0 | -10000 | 0 | 0 |
| RBBP4 | 0.028 | 0.03 | -10000 | 0 | -0.64 | 1 | 1 |
| RUNX2 | 0.012 | 0.1 | -10000 | 0 | -0.59 | 14 | 14 |
| RUNX3 | -0.24 | 0.31 | -10000 | 0 | -0.59 | 225 | 225 |
| RUNX1 | -0.012 | 0.15 | -10000 | 0 | -0.59 | 34 | 34 |
| CTBP1 | 0.03 | 0.004 | -10000 | 0 | -10000 | 0 | 0 |
| NR3C1 | 0.024 | 0.032 | -10000 | 0 | -0.59 | 1 | 1 |
| VDR | 0.025 | 0.051 | -10000 | 0 | -0.64 | 3 | 3 |
| CDKN1A | 0.05 | 0.082 | -10000 | 0 | -10000 | 0 | 0 |
| KAT2B | 0.019 | 0.032 | -10000 | 0 | -0.63 | 1 | 1 |
| SMAD2/SMAD2/SMAD4/FOXH1 | 0.039 | 0.13 | -10000 | 0 | -0.41 | 26 | 26 |
| DCP1A | 0.022 | 0.014 | -10000 | 0 | -10000 | 0 | 0 |
| SKI | 0.029 | 0.007 | -10000 | 0 | -10000 | 0 | 0 |
| SERPINE1 | -0.054 | 0.17 | -10000 | 0 | -0.47 | 50 | 50 |
| SMAD3/SMAD4/ATF2 | 0.074 | 0.05 | -10000 | 0 | -0.41 | 1 | 1 |
| SMAD3/SMAD4/ATF3 | 0.072 | 0.058 | -10000 | 0 | -0.42 | 3 | 3 |
| SAP30 | 0.009 | 0.11 | -10000 | 0 | -0.59 | 17 | 17 |
| Cbp/p300/PIAS3 | 0.047 | 0.042 | -10000 | 0 | -0.38 | 1 | 1 |
| JUN | 0.05 | 0.064 | -10000 | 0 | -0.38 | 1 | 1 |
| SMAD3/SMAD4/IRF7 | 0.063 | 0.093 | -10000 | 0 | -0.39 | 4 | 4 |
| TFE3 | 0.029 | 0.021 | -10000 | 0 | -10000 | 0 | 0 |
| COL1A2 | -0.03 | 0.16 | -10000 | 0 | -0.47 | 56 | 56 |
| mesenchymal cell differentiation | -0.063 | 0.085 | 0.39 | 10 | -10000 | 0 | 10 |
| DLX1 | -0.29 | 0.31 | -10000 | 0 | -0.59 | 264 | 264 |
| TCF3 | 0.03 | 0.003 | -10000 | 0 | -10000 | 0 | 0 |
| FOS | 0.02 | 0.1 | -10000 | 0 | -0.62 | 12 | 12 |
| SMAD3/SMAD4/Max | 0.079 | 0.05 | -10000 | 0 | -10000 | 0 | 0 |
| Cbp/p300/SNIP1 | 0.053 | 0.028 | -10000 | 0 | -0.39 | 1 | 1 |
| ZBTB17 | 0.025 | 0.041 | -10000 | 0 | -0.61 | 2 | 2 |
| LAMC1 | 0.053 | 0.038 | -10000 | 0 | -10000 | 0 | 0 |
| TGIF2/HDAC complex/SMAD3/SMAD4 | 0.076 | 0.044 | -10000 | 0 | -10000 | 0 | 0 |
| IRF7 | 0.008 | 0.12 | -10000 | 0 | -0.58 | 19 | 19 |
| ESR1 | 0.025 | 0.053 | -10000 | 0 | -0.54 | 4 | 4 |
| HNF4A | -0.021 | 0.17 | -10000 | 0 | -0.64 | 38 | 38 |
| MEF2C | 0.028 | 0.15 | 0.48 | 7 | -0.57 | 7 | 14 |
| SMAD2-3/SMAD4 | 0.083 | 0.049 | -10000 | 0 | -10000 | 0 | 0 |
| Cbp/p300/Src-1 | 0.051 | 0.031 | -10000 | 0 | -0.39 | 1 | 1 |
| IGHV3OR16-13 | -0.025 | 0.066 | -10000 | 0 | -0.49 | 5 | 5 |
| TGIF2/HDAC complex | 0.029 | 0.006 | -10000 | 0 | -10000 | 0 | 0 |
| CREBBP | 0.027 | 0.011 | -10000 | 0 | -10000 | 0 | 0 |
| SKIL | 0.029 | 0.007 | -10000 | 0 | -10000 | 0 | 0 |
| HDAC1 | 0.029 | 0.006 | -10000 | 0 | -10000 | 0 | 0 |
| HDAC2 | 0.028 | 0.008 | -10000 | 0 | -10000 | 0 | 0 |
| SNIP1 | 0.029 | 0.006 | -10000 | 0 | -10000 | 0 | 0 |
| GCN5L2 | -0.002 | 0.008 | -10000 | 0 | -10000 | 0 | 0 |
| SMAD3/SMAD4/TFE3 | 0.079 | 0.054 | -10000 | 0 | -10000 | 0 | 0 |
| MSG1/HSC70 | 0.043 | 0.031 | -10000 | 0 | -0.43 | 2 | 2 |
| SMAD2 | 0.031 | 0.024 | -10000 | 0 | -10000 | 0 | 0 |
| SMAD3 | 0.042 | 0.034 | -10000 | 0 | -10000 | 0 | 0 |
| SMAD3/E2F4-5/DP1/p107/SMAD4 | 0.052 | 0.033 | -10000 | 0 | -10000 | 0 | 0 |
| SMAD2/SMAD2/SMAD4 | -0.015 | 0.068 | -10000 | 0 | -0.45 | 4 | 4 |
| NCOR1 | 0.03 | 0.005 | -10000 | 0 | -10000 | 0 | 0 |
| NCOA2 | 0.018 | 0.083 | -10000 | 0 | -0.64 | 8 | 8 |
| NCOA1 | 0.029 | 0.005 | -10000 | 0 | -10000 | 0 | 0 |
| MYOD/E2A | 0.012 | 0.11 | -10000 | 0 | -0.43 | 29 | 29 |
| SMAD2-3/SMAD4/SP1/MIZ-1 | 0.1 | 0.095 | -10000 | 0 | -10000 | 0 | 0 |
| IFNB1 | 0.031 | 0.079 | -10000 | 0 | -10000 | 0 | 0 |
| SMAD3/SMAD4/MEF2C | 0.05 | 0.14 | -10000 | 0 | -0.54 | 7 | 7 |
| CITED1 | 0.027 | 0.039 | -10000 | 0 | -0.59 | 2 | 2 |
| SMAD2-3/SMAD4/ARC105 | 0.098 | 0.047 | -10000 | 0 | -10000 | 0 | 0 |
| RBL1 | 0.029 | 0.006 | -10000 | 0 | -10000 | 0 | 0 |
| SMAD2-3/SMAD4/FOXO1-3a-4/CEBPB | 0.055 | 0.053 | -10000 | 0 | -0.6 | 1 | 1 |
| RUNX1-3/PEBPB2 | -0.16 | 0.22 | -10000 | 0 | -0.38 | 237 | 237 |
| SMAD7 | 0.08 | 0.068 | -10000 | 0 | -10000 | 0 | 0 |
| MYC/MIZ-1 | 0.019 | 0.091 | -10000 | 0 | -0.44 | 19 | 19 |
| SMAD3/SMAD4 | 0.015 | 0.095 | -10000 | 0 | -0.48 | 1 | 1 |
| IL10 | -0.16 | 0.24 | -10000 | 0 | -0.69 | 31 | 31 |
| PIASy/HDAC complex | 0.032 | 0.009 | -10000 | 0 | -10000 | 0 | 0 |
| PIAS3 | 0.028 | 0.007 | -10000 | 0 | -10000 | 0 | 0 |
| CDK2 | 0.028 | 0.01 | -10000 | 0 | -10000 | 0 | 0 |
| IL5 | -0.13 | 0.19 | -10000 | 0 | -0.57 | 15 | 15 |
| CDK4 | 0.026 | 0.014 | -10000 | 0 | -10000 | 0 | 0 |
| PIAS4 | 0.032 | 0.009 | -10000 | 0 | -10000 | 0 | 0 |
| ATF3 | 0.024 | 0.053 | -10000 | 0 | -0.56 | 4 | 4 |
| SMAD3/SMAD4/SP1 | 0.07 | 0.088 | -10000 | 0 | -10000 | 0 | 0 |
| FOXG1 | -0.01 | 0.11 | -10000 | 0 | -0.59 | 18 | 18 |
| FOXO3 | 0.024 | 0.012 | -10000 | 0 | -10000 | 0 | 0 |
| FOXO1 | 0.025 | 0.011 | -10000 | 0 | -10000 | 0 | 0 |
| FOXO4 | 0.026 | 0.011 | -10000 | 0 | -10000 | 0 | 0 |
| heart looping | 0.028 | 0.15 | 0.48 | 7 | -0.56 | 7 | 14 |
| CEBPB | 0.019 | 0.082 | -10000 | 0 | -0.59 | 9 | 9 |
| SMAD3/SMAD4/DLX1 | -0.16 | 0.22 | -10000 | 0 | -0.38 | 222 | 222 |
| MYOD1 | -0.012 | 0.14 | -10000 | 0 | -0.59 | 29 | 29 |
| SMAD3/SMAD4/HNF4 | 0.04 | 0.14 | -10000 | 0 | -0.42 | 38 | 38 |
| SMAD3/SMAD4/GATA3 | -0.15 | 0.25 | -10000 | 0 | -0.42 | 167 | 167 |
| SnoN/SIN3/HDAC complex/NCoR1 | 0.028 | 0.007 | -10000 | 0 | -10000 | 0 | 0 |
| SMAD3/SMAD4/RUNX1-3/PEBPB2 | -0.1 | 0.21 | -10000 | 0 | -0.6 | 16 | 16 |
| SMAD3/SMAD4/SP1-3 | 0.087 | 0.085 | -10000 | 0 | -10000 | 0 | 0 |
| MED15 | 0.03 | 0.004 | -10000 | 0 | -10000 | 0 | 0 |
| SP1 | 0.023 | 0.05 | -10000 | 0 | -10000 | 0 | 0 |
| SIN3B | 0.03 | 0.003 | -10000 | 0 | -10000 | 0 | 0 |
| SIN3A | 0.03 | 0.003 | -10000 | 0 | -10000 | 0 | 0 |
| SMAD2/SMAD2/SMAD4/FOXH1/NKX2-5 | 0.024 | 0.15 | -10000 | 0 | -0.53 | 16 | 16 |
| ITGB5 | 0.058 | 0.077 | 0.43 | 2 | -10000 | 0 | 2 |
| TGIF/SIN3/HDAC complex/CtBP | 0.04 | 0.051 | -10000 | 0 | -0.47 | 3 | 3 |
| SMAD3/SMAD4/AR | 0.057 | 0.11 | -10000 | 0 | -0.42 | 23 | 23 |
| AR | -0.001 | 0.14 | -10000 | 0 | -0.62 | 24 | 24 |
| negative regulation of cell growth | 0.055 | 0.046 | -10000 | 0 | -10000 | 0 | 0 |
| SMAD3/SMAD4/MYOD | 0.048 | 0.11 | -10000 | 0 | -0.47 | 6 | 6 |
| E2F5 | 0.027 | 0.03 | -10000 | 0 | -0.64 | 1 | 1 |
| E2F4 | 0.029 | 0.006 | -10000 | 0 | -10000 | 0 | 0 |
| SMAD2/SMAD2/SMAD4/FOXH1/SMIF | 0.04 | 0.12 | -10000 | 0 | -0.44 | 9 | 9 |
| SMAD2-3/SMAD4/FOXO1-3a-4 | 0.054 | 0.035 | -10000 | 0 | -10000 | 0 | 0 |
| TFDP1 | 0.029 | 0.005 | -10000 | 0 | -10000 | 0 | 0 |
| SMAD3/SMAD4/AP1 | 0.082 | 0.072 | -10000 | 0 | -0.39 | 1 | 1 |
| SMAD3/SMAD4/RUNX2 | 0.064 | 0.085 | -10000 | 0 | -0.39 | 10 | 10 |
| TGIF2 | 0.029 | 0.006 | -10000 | 0 | -10000 | 0 | 0 |
| TGIF1 | 0.029 | 0.005 | -10000 | 0 | -10000 | 0 | 0 |
| ATF2 | 0.028 | 0.03 | -10000 | 0 | -0.64 | 1 | 1 |
Figure S61. Get High-res Image This plot shows pathway concept perturbations across all samples against a permutation model. The concepts along the x-axis are sorted by lowest to highest mean activity for the real patient samples. Mean inferred activities are plotted along the y-axis as a colored band showing the average level and one standard deviation range. Real samples are shown in red and permuted samples in black.
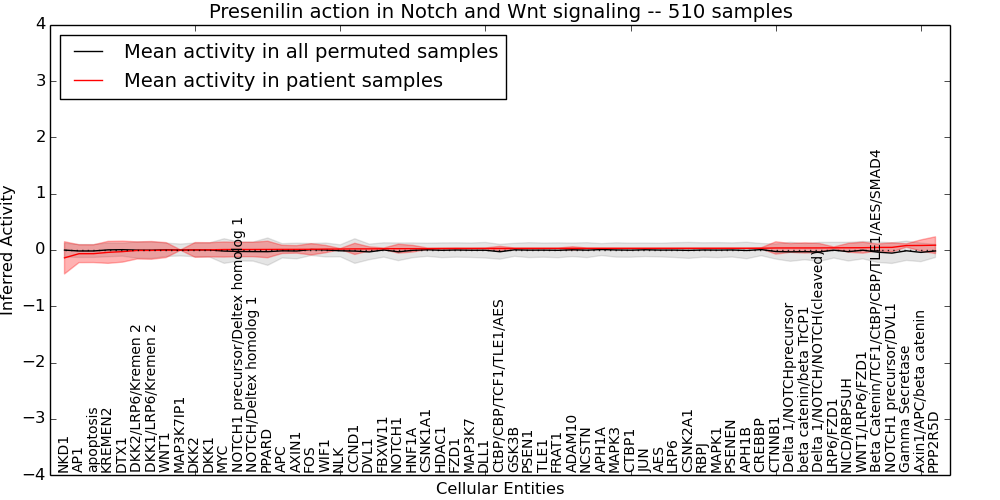
Table S61. Get Full Table This table displays mean, standard deviation, and perturbation statistics for Inferred Pathway Levels (IPLs). A mean perturbation of -9999 implies that the IPLs across all the real samples did not differ enough from the IPLs generated by a background model of permuted samples (> 1 Std.Dev from the permuted sample IPLs).
| Entity | Mean | Std.Dev | Mean.of.Up.Perturbations | Number.of.Up.Perturbations | Mean.of.Down.Perturbations | Number.of.Down.Perturbations | Number.of.Total.Perturbations |
|---|---|---|---|---|---|---|---|
| Delta 1/NOTCH/NOTCH(cleaved) | 0.037 | 0.079 | -10000 | 0 | -0.63 | 1 | 1 |
| HDAC1 | 0.026 | 0.008 | -10000 | 0 | -10000 | 0 | 0 |
| AES | 0.029 | 0.004 | -10000 | 0 | -10000 | 0 | 0 |
| FBXW11 | 0.023 | 0.013 | -10000 | 0 | -10000 | 0 | 0 |
| DTX1 | -0.029 | 0.19 | -10000 | 0 | -0.63 | 45 | 45 |
| LRP6/FZD1 | 0.039 | 0.015 | -10000 | 0 | -10000 | 0 | 0 |
| TLE1 | 0.028 | 0.006 | -10000 | 0 | -10000 | 0 | 0 |
| AP1 | -0.066 | 0.16 | -10000 | 0 | -0.32 | 132 | 132 |
| NCSTN | 0.029 | 0.007 | -10000 | 0 | -10000 | 0 | 0 |
| ADAM10 | 0.029 | 0.03 | -10000 | 0 | -0.63 | 1 | 1 |
| Beta Catenin/TCF1/CtBP/CBP/TLE1/AES/SMAD4 | 0.045 | 0.062 | -10000 | 0 | -0.74 | 1 | 1 |
| NICD/RBPSUH | 0.039 | 0.078 | -10000 | 0 | -0.61 | 1 | 1 |
| WIF1 | 0.016 | 0.065 | -10000 | 0 | -0.62 | 5 | 5 |
| NOTCH1 | 0.023 | 0.079 | -10000 | 0 | -0.37 | 18 | 18 |
| PSENEN | 0.03 | 0.003 | -10000 | 0 | -10000 | 0 | 0 |
| KREMEN2 | -0.042 | 0.2 | -10000 | 0 | -0.59 | 58 | 58 |
| DKK1 | 0.003 | 0.13 | -10000 | 0 | -0.61 | 21 | 21 |
| beta catenin/beta TrCP1 | 0.037 | 0.091 | 0.3 | 4 | -10000 | 0 | 4 |
| APH1B | 0.03 | 0.003 | -10000 | 0 | -10000 | 0 | 0 |
| APH1A | 0.029 | 0.007 | -10000 | 0 | -10000 | 0 | 0 |
| AXIN1 | 0.011 | 0.067 | 0.28 | 3 | -0.32 | 1 | 4 |
| CtBP/CBP/TCF1/TLE1/AES | 0.028 | 0.038 | -10000 | 0 | -0.36 | 2 | 2 |
| PSEN1 | 0.028 | 0.008 | -10000 | 0 | -10000 | 0 | 0 |
| FOS | 0.012 | 0.1 | -10000 | 0 | -0.63 | 12 | 12 |
| JUN | 0.029 | 0.006 | -10000 | 0 | -10000 | 0 | 0 |
| MAP3K7 | 0.027 | 0.008 | -10000 | 0 | -10000 | 0 | 0 |
| CTNNB1 | 0.036 | 0.11 | 0.28 | 14 | -0.33 | 3 | 17 |
| MAPK3 | 0.029 | 0.006 | -10000 | 0 | -10000 | 0 | 0 |
| DKK2/LRP6/Kremen 2 | -0.008 | 0.15 | -10000 | 0 | -0.37 | 72 | 72 |
| HNF1A | 0.023 | 0.059 | -10000 | 0 | -0.64 | 4 | 4 |
| CTBP1 | 0.029 | 0.005 | -10000 | 0 | -10000 | 0 | 0 |
| MYC | 0.008 | 0.13 | -10000 | 0 | -0.67 | 12 | 12 |
| NKD1 | -0.14 | 0.29 | -10000 | 0 | -0.63 | 130 | 130 |
| FZD1 | 0.027 | 0.01 | -10000 | 0 | -10000 | 0 | 0 |
| NOTCH1 precursor/Deltex homolog 1 | 0.008 | 0.13 | -10000 | 0 | -0.6 | 4 | 4 |
| apoptosis | -0.065 | 0.16 | -10000 | 0 | -0.32 | 132 | 132 |
| Delta 1/NOTCHprecursor | 0.036 | 0.078 | -10000 | 0 | -0.61 | 1 | 1 |
| DLL1 | 0.028 | 0.008 | -10000 | 0 | -10000 | 0 | 0 |
| PPARD | 0.01 | 0.15 | -10000 | 0 | -0.75 | 18 | 18 |
| Gamma Secretase | 0.079 | 0.03 | -10000 | 0 | -10000 | 0 | 0 |
| APC | 0.011 | 0.073 | 0.28 | 6 | -0.4 | 3 | 9 |
| DVL1 | 0.02 | 0.036 | -10000 | 0 | -0.43 | 2 | 2 |
| CSNK2A1 | 0.03 | 0.006 | -10000 | 0 | -10000 | 0 | 0 |
| MAP3K7IP1 | -0.002 | 0.003 | -10000 | 0 | -10000 | 0 | 0 |
| DKK1/LRP6/Kremen 2 | -0.007 | 0.16 | -10000 | 0 | -0.4 | 66 | 66 |
| LRP6 | 0.029 | 0.006 | -10000 | 0 | -10000 | 0 | 0 |
| CSNK1A1 | 0.023 | 0.013 | -10000 | 0 | -10000 | 0 | 0 |
| NLK | 0.017 | 0.008 | -10000 | 0 | -10000 | 0 | 0 |
| CCND1 | 0.02 | 0.099 | -10000 | 0 | -0.64 | 3 | 3 |
| WNT1 | -0.002 | 0.13 | -10000 | 0 | -0.59 | 25 | 25 |
| Axin1/APC/beta catenin | 0.081 | 0.099 | 0.4 | 16 | -10000 | 0 | 16 |
| DKK2 | 0.001 | 0.13 | -10000 | 0 | -0.6 | 23 | 23 |
| NOTCH1 precursor/DVL1 | 0.046 | 0.081 | -10000 | 0 | -0.49 | 2 | 2 |
| GSK3B | 0.028 | 0.008 | -10000 | 0 | -10000 | 0 | 0 |
| FRAT1 | 0.029 | 0.006 | -10000 | 0 | -10000 | 0 | 0 |
| NOTCH/Deltex homolog 1 | 0.009 | 0.13 | -10000 | 0 | -0.61 | 4 | 4 |
| PPP2R5D | 0.085 | 0.15 | 0.34 | 118 | -0.37 | 9 | 127 |
| MAPK1 | 0.03 | 0.004 | -10000 | 0 | -10000 | 0 | 0 |
| WNT1/LRP6/FZD1 | 0.041 | 0.097 | -10000 | 0 | -0.34 | 29 | 29 |
| RBPJ | 0.03 | 0.004 | -10000 | 0 | -10000 | 0 | 0 |
| CREBBP | 0.031 | 0.009 | -10000 | 0 | -10000 | 0 | 0 |
Figure S62. Get High-res Image This plot shows pathway concept perturbations across all samples against a permutation model. The concepts along the x-axis are sorted by lowest to highest mean activity for the real patient samples. Mean inferred activities are plotted along the y-axis as a colored band showing the average level and one standard deviation range. Real samples are shown in red and permuted samples in black.
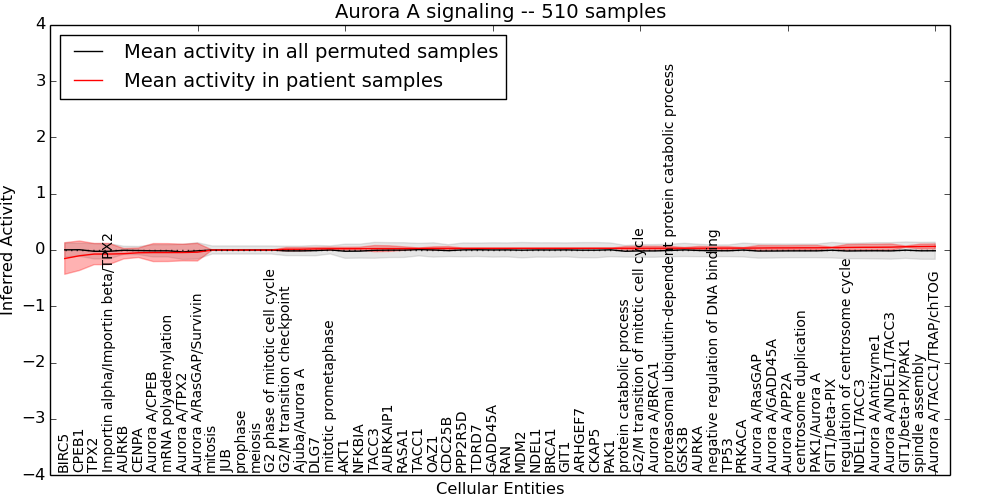
Table S62. Get Full Table This table displays mean, standard deviation, and perturbation statistics for Inferred Pathway Levels (IPLs). A mean perturbation of -9999 implies that the IPLs across all the real samples did not differ enough from the IPLs generated by a background model of permuted samples (> 1 Std.Dev from the permuted sample IPLs).
| Entity | Mean | Std.Dev | Mean.of.Up.Perturbations | Number.of.Up.Perturbations | Mean.of.Down.Perturbations | Number.of.Down.Perturbations | Number.of.Total.Perturbations |
|---|---|---|---|---|---|---|---|
| Aurora A/GADD45A | 0.037 | 0.041 | -10000 | 0 | -10000 | 0 | 0 |
| BIRC5 | -0.15 | 0.28 | -10000 | 0 | -0.59 | 149 | 149 |
| NFKBIA | 0.024 | 0.027 | 0.26 | 1 | -10000 | 0 | 1 |
| CPEB1 | -0.1 | 0.26 | -10000 | 0 | -0.63 | 101 | 101 |
| AKT1 | 0.023 | 0.025 | -10000 | 0 | -10000 | 0 | 0 |
| NDEL1 | 0.029 | 0.005 | -10000 | 0 | -10000 | 0 | 0 |
| Aurora A/BRCA1 | 0.031 | 0.035 | -10000 | 0 | -10000 | 0 | 0 |
| NDEL1/TACC3 | 0.048 | 0.053 | -10000 | 0 | -0.45 | 3 | 3 |
| GADD45A | 0.029 | 0.006 | -10000 | 0 | -10000 | 0 | 0 |
| GSK3B | 0.031 | 0.013 | -10000 | 0 | -10000 | 0 | 0 |
| PAK1/Aurora A | 0.039 | 0.042 | -10000 | 0 | -10000 | 0 | 0 |
| MDM2 | 0.029 | 0.005 | -10000 | 0 | -10000 | 0 | 0 |
| JUB | 0 | 0 | -10000 | 0 | -10000 | 0 | 0 |
| TPX2 | -0.072 | 0.19 | -10000 | 0 | -0.43 | 108 | 108 |
| TP53 | 0.033 | 0.026 | -10000 | 0 | -0.34 | 1 | 1 |
| DLG7 | 0.021 | 0.025 | -10000 | 0 | -10000 | 0 | 0 |
| AURKAIP1 | 0.025 | 0.05 | -10000 | 0 | -0.62 | 3 | 3 |
| ARHGEF7 | 0.03 | 0.004 | -10000 | 0 | -10000 | 0 | 0 |
| G2 phase of mitotic cell cycle | 0 | 0 | -10000 | 0 | -10000 | 0 | 0 |
| Aurora A/NDEL1/TACC3 | 0.051 | 0.056 | -10000 | 0 | -0.48 | 3 | 3 |
| G2/M transition of mitotic cell cycle | 0.031 | 0.035 | -10000 | 0 | -10000 | 0 | 0 |
| AURKA | 0.031 | 0.033 | -10000 | 0 | -10000 | 0 | 0 |
| AURKB | -0.066 | 0.093 | -10000 | 0 | -0.18 | 158 | 158 |
| CDC25B | 0.029 | 0.032 | -10000 | 0 | -0.34 | 1 | 1 |
| G2/M transition checkpoint | 0.013 | 0.03 | -10000 | 0 | -10000 | 0 | 0 |
| mRNA polyadenylation | -0.046 | 0.16 | -10000 | 0 | -0.36 | 101 | 101 |
| Aurora A/CPEB | -0.046 | 0.16 | -10000 | 0 | -0.36 | 101 | 101 |
| Aurora A/TACC1/TRAP/chTOG | 0.063 | 0.045 | -10000 | 0 | -10000 | 0 | 0 |
| BRCA1 | 0.03 | 0.005 | -10000 | 0 | -10000 | 0 | 0 |
| centrosome duplication | 0.039 | 0.042 | -10000 | 0 | -10000 | 0 | 0 |
| regulation of centrosome cycle | 0.045 | 0.052 | -10000 | 0 | -0.45 | 3 | 3 |
| spindle assembly | 0.061 | 0.044 | -10000 | 0 | -10000 | 0 | 0 |
| TDRD7 | 0.029 | 0.006 | -10000 | 0 | -10000 | 0 | 0 |
| Aurora A/RasGAP/Survivin | -0.039 | 0.16 | -10000 | 0 | -0.4 | 14 | 14 |
| CENPA | -0.049 | 0.084 | -10000 | 0 | -0.25 | 14 | 14 |
| Aurora A/PP2A | 0.038 | 0.04 | -10000 | 0 | -10000 | 0 | 0 |
| meiosis | 0 | 0 | -10000 | 0 | -10000 | 0 | 0 |
| protein catabolic process | 0.03 | 0.031 | 0.19 | 1 | -10000 | 0 | 1 |
| negative regulation of DNA binding | 0.033 | 0.027 | -10000 | 0 | -0.34 | 1 | 1 |
| prophase | 0 | 0 | -10000 | 0 | -10000 | 0 | 0 |
| GIT1/beta-PIX | 0.043 | 0.008 | -10000 | 0 | -10000 | 0 | 0 |
| RASA1 | 0.025 | 0.031 | -10000 | 0 | -0.64 | 1 | 1 |
| Ajuba/Aurora A | 0.013 | 0.03 | -10000 | 0 | -10000 | 0 | 0 |
| mitotic prometaphase | 0.023 | 0.028 | -10000 | 0 | -10000 | 0 | 0 |
| proteasomal ubiquitin-dependent protein catabolic process | 0.031 | 0.033 | -10000 | 0 | -10000 | 0 | 0 |
| TACC1 | 0.028 | 0.009 | -10000 | 0 | -10000 | 0 | 0 |
| TACC3 | 0.025 | 0.055 | -10000 | 0 | -0.59 | 4 | 4 |
| Aurora A/Antizyme1 | 0.049 | 0.052 | -10000 | 0 | -0.34 | 3 | 3 |
| Aurora A/RasGAP | 0.035 | 0.044 | -10000 | 0 | -0.4 | 1 | 1 |
| OAZ1 | 0.029 | 0.028 | -10000 | 0 | -0.59 | 1 | 1 |
| RAN | 0.029 | 0.006 | -10000 | 0 | -10000 | 0 | 0 |
| mitosis | 0 | 0 | -10000 | 0 | -10000 | 0 | 0 |
| PRKACA | 0.033 | 0.01 | -10000 | 0 | -10000 | 0 | 0 |
| GIT1 | 0.03 | 0.005 | -10000 | 0 | -10000 | 0 | 0 |
| GIT1/beta-PIX/PAK1 | 0.059 | 0.012 | -10000 | 0 | -10000 | 0 | 0 |
| Importin alpha/Importin beta/TPX2 | -0.072 | 0.19 | -10000 | 0 | -0.43 | 108 | 108 |
| PPP2R5D | 0.029 | 0.006 | -10000 | 0 | -10000 | 0 | 0 |
| Aurora A/TPX2 | -0.045 | 0.15 | -10000 | 0 | -0.32 | 106 | 106 |
| PAK1 | 0.03 | 0.003 | -10000 | 0 | -10000 | 0 | 0 |
| CKAP5 | 0.03 | 0.003 | -10000 | 0 | -10000 | 0 | 0 |
Figure S63. Get High-res Image This plot shows pathway concept perturbations across all samples against a permutation model. The concepts along the x-axis are sorted by lowest to highest mean activity for the real patient samples. Mean inferred activities are plotted along the y-axis as a colored band showing the average level and one standard deviation range. Real samples are shown in red and permuted samples in black.
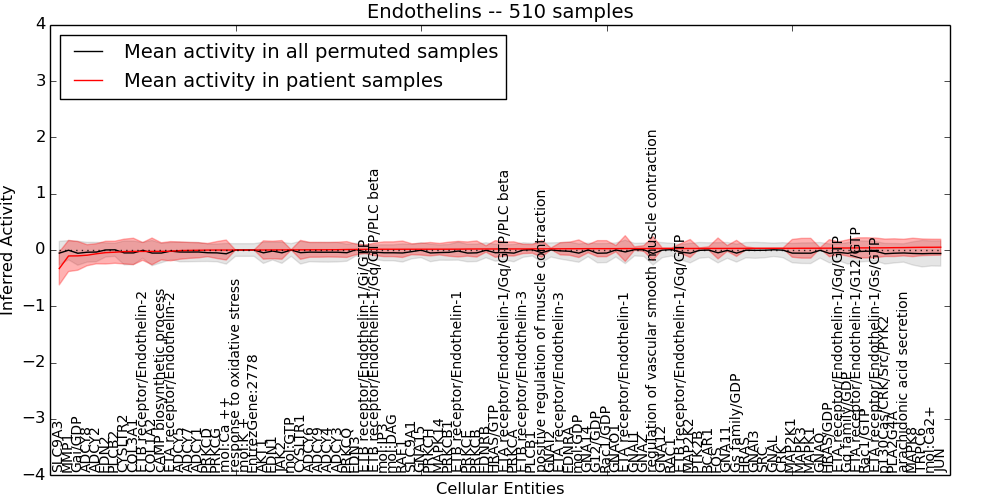
Table S63. Get Full Table This table displays mean, standard deviation, and perturbation statistics for Inferred Pathway Levels (IPLs). A mean perturbation of -9999 implies that the IPLs across all the real samples did not differ enough from the IPLs generated by a background model of permuted samples (> 1 Std.Dev from the permuted sample IPLs).
| Entity | Mean | Std.Dev | Mean.of.Up.Perturbations | Number.of.Up.Perturbations | Mean.of.Down.Perturbations | Number.of.Down.Perturbations | Number.of.Total.Perturbations |
|---|---|---|---|---|---|---|---|
| AKT1 | 0 | 0.16 | 0.38 | 2 | -0.51 | 5 | 7 |
| PTK2B | 0.028 | 0.009 | -10000 | 0 | -10000 | 0 | 0 |
| mol:Ca2+ | 0.048 | 0.14 | 0.48 | 2 | -0.7 | 5 | 7 |
| EDN1 | 0.001 | 0.16 | 0.42 | 1 | -0.54 | 18 | 19 |
| EDN3 | 0.01 | 0.093 | -10000 | 0 | -0.59 | 12 | 12 |
| EDN2 | -0.047 | 0.2 | -10000 | 0 | -0.57 | 64 | 64 |
| HRAS/GDP | 0.032 | 0.15 | 0.32 | 5 | -0.6 | 11 | 16 |
| ETA receptor/Endothelin-1/Gq/GTP/PLC beta | 0.018 | 0.12 | 0.25 | 2 | -0.54 | 10 | 12 |
| ADCY4 | 0.004 | 0.13 | 0.34 | 1 | -0.44 | 4 | 5 |
| ADCY5 | -0.011 | 0.15 | 0.35 | 2 | -0.53 | 14 | 16 |
| ADCY6 | 0.003 | 0.13 | 0.34 | 1 | -0.48 | 4 | 5 |
| ADCY7 | -0.007 | 0.14 | 0.34 | 1 | -0.48 | 8 | 9 |
| ADCY1 | -0.005 | 0.14 | 0.34 | 1 | -0.51 | 5 | 6 |
| ADCY2 | -0.067 | 0.18 | 0.36 | 1 | -0.47 | 27 | 28 |
| ADCY3 | 0.005 | 0.13 | 0.35 | 2 | -0.48 | 4 | 6 |
| ADCY8 | -0.093 | 0.19 | 0.34 | 1 | -0.52 | 26 | 27 |
| ADCY9 | 0.003 | 0.13 | 0.35 | 2 | -0.48 | 4 | 6 |
| arachidonic acid secretion | 0.043 | 0.15 | 0.38 | 7 | -0.56 | 12 | 19 |
| ETB receptor/Endothelin-1/Gq/GTP | 0.027 | 0.087 | -10000 | 0 | -0.52 | 5 | 5 |
| GNAO1 | 0.024 | 0.056 | -10000 | 0 | -0.6 | 4 | 4 |
| HRAS | 0.029 | 0.027 | -10000 | 0 | -0.59 | 1 | 1 |
| ETA receptor/Endothelin-1/G12/GTP | 0.037 | 0.18 | 0.41 | 19 | -0.53 | 4 | 23 |
| ETA receptor/Endothelin-1/Gs/GTP | 0.038 | 0.18 | 0.38 | 22 | -0.47 | 6 | 28 |
| mol:GTP | 0.002 | 0.002 | -10000 | 0 | -10000 | 0 | 0 |
| COL3A1 | -0.025 | 0.23 | 0.41 | 1 | -0.65 | 48 | 49 |
| EDNRB | 0.018 | 0.057 | -10000 | 0 | -0.51 | 3 | 3 |
| response to oxidative stress | 0 | 0 | -10000 | 0 | -10000 | 0 | 0 |
| CYSLTR2 | -0.028 | 0.22 | 0.6 | 1 | -0.56 | 38 | 39 |
| CYSLTR1 | 0.003 | 0.17 | 0.41 | 1 | -0.55 | 6 | 7 |
| SLC9A1 | 0.014 | 0.097 | 0.28 | 2 | -0.32 | 4 | 6 |
| mol:GDP | 0.023 | 0.16 | 0.32 | 8 | -0.62 | 12 | 20 |
| SLC9A3 | -0.33 | 0.29 | -10000 | 0 | -0.67 | 124 | 124 |
| RAF1 | 0.013 | 0.15 | 0.32 | 5 | -0.6 | 13 | 18 |
| JUN | 0.049 | 0.14 | -10000 | 0 | -0.64 | 6 | 6 |
| JAK2 | 0.002 | 0.17 | 0.38 | 2 | -0.55 | 5 | 7 |
| mol:IP3 | 0.013 | 0.13 | 0.26 | 1 | -0.6 | 10 | 11 |
| ETA receptor/Endothelin-1 | 0.026 | 0.23 | 0.48 | 23 | -0.61 | 6 | 29 |
| PLCB1 | 0.021 | 0.078 | -10000 | 0 | -0.64 | 7 | 7 |
| PLCB2 | -0.039 | 0.2 | -10000 | 0 | -0.59 | 58 | 58 |
| ETA receptor/Endothelin-3 | 0.022 | 0.11 | -10000 | 0 | -0.44 | 12 | 12 |
| FOS | 0.028 | 0.19 | 0.38 | 5 | -0.79 | 17 | 22 |
| Gai/GDP | -0.1 | 0.26 | -10000 | 0 | -0.63 | 46 | 46 |
| CRK | 0.03 | 0.005 | -10000 | 0 | -10000 | 0 | 0 |
| mol:Ca ++ | -0.001 | 0.18 | 0.33 | 1 | -0.64 | 11 | 12 |
| BCAR1 | 0.028 | 0.03 | -10000 | 0 | -0.63 | 1 | 1 |
| PRKCB1 | 0.014 | 0.12 | 0.24 | 1 | -0.57 | 10 | 11 |
| GNAQ | 0.032 | 0.007 | -10000 | 0 | -10000 | 0 | 0 |
| GNAZ | 0.026 | 0.051 | -10000 | 0 | -0.64 | 3 | 3 |
| GNAL | 0.03 | 0.005 | -10000 | 0 | -10000 | 0 | 0 |
| Gs family/GDP | 0.028 | 0.14 | 0.3 | 5 | -0.57 | 11 | 16 |
| ETA receptor/Endothelin-1/Gq/GTP | 0.035 | 0.11 | 0.26 | 1 | -0.59 | 3 | 4 |
| MAPK14 | 0.014 | 0.1 | 0.35 | 1 | -0.51 | 9 | 10 |
| TRPC6 | 0.048 | 0.15 | 0.49 | 2 | -0.75 | 5 | 7 |
| GNAI2 | 0.021 | 0.014 | -10000 | 0 | -10000 | 0 | 0 |
| GNAI3 | 0.029 | 0.005 | -10000 | 0 | -10000 | 0 | 0 |
| GNAI1 | 0.026 | 0.031 | -10000 | 0 | -0.64 | 1 | 1 |
| ETB receptor/Endothelin-1/Gq/GTP/PLC beta | 0.013 | 0.11 | -10000 | 0 | -0.52 | 11 | 11 |
| ETB receptor/Endothelin-2 | -0.025 | 0.16 | -10000 | 0 | -0.44 | 60 | 60 |
| ETB receptor/Endothelin-3 | 0.019 | 0.083 | -10000 | 0 | -0.44 | 14 | 14 |
| ETB receptor/Endothelin-1 | 0.015 | 0.14 | -10000 | 0 | -0.42 | 16 | 16 |
| MAPK3 | 0.031 | 0.18 | 0.39 | 5 | -0.73 | 16 | 21 |
| MAPK1 | 0.031 | 0.18 | 0.4 | 5 | -0.71 | 17 | 22 |
| Rac1/GDP | 0.024 | 0.14 | 0.31 | 2 | -0.6 | 10 | 12 |
| cAMP biosynthetic process | -0.024 | 0.15 | 0.41 | 6 | -0.53 | 7 | 13 |
| MAPK8 | 0.046 | 0.16 | 0.4 | 1 | -0.69 | 11 | 12 |
| SRC | 0.029 | 0.006 | -10000 | 0 | -10000 | 0 | 0 |
| ETB receptor/Endothelin-1/Gi/GTP | 0.012 | 0.076 | -10000 | 0 | -0.5 | 4 | 4 |
| p130Cas/CRK/Src/PYK2 | 0.039 | 0.16 | 0.41 | 10 | -0.62 | 10 | 20 |
| mol:K + | 0 | 0 | -10000 | 0 | -10000 | 0 | 0 |
| G12/GDP | 0.024 | 0.14 | 0.31 | 2 | -0.6 | 10 | 12 |
| COL1A2 | -0.025 | 0.24 | 0.64 | 1 | -0.63 | 50 | 51 |
| EntrezGene:2778 | 0 | 0 | -10000 | 0 | -10000 | 0 | 0 |
| ETA receptor/Endothelin-2 | -0.022 | 0.17 | 0.29 | 1 | -0.44 | 58 | 59 |
| mol:DAG | 0.013 | 0.13 | 0.26 | 1 | -0.6 | 10 | 11 |
| MAP2K2 | 0.027 | 0.16 | 0.46 | 3 | -0.6 | 17 | 20 |
| MAP2K1 | 0.03 | 0.16 | 0.38 | 5 | -0.61 | 15 | 20 |
| EDNRA | 0.023 | 0.12 | 0.41 | 1 | -0.55 | 1 | 2 |
| positive regulation of muscle contraction | 0.021 | 0.15 | 0.42 | 7 | -0.46 | 4 | 11 |
| Gq family/GDP | 0.036 | 0.15 | -10000 | 0 | -0.63 | 10 | 10 |
| HRAS/GTP | 0.018 | 0.15 | 0.32 | 5 | -0.62 | 12 | 17 |
| PRKCH | 0.014 | 0.12 | -10000 | 0 | -0.58 | 8 | 8 |
| RAC1 | 0.027 | 0.009 | -10000 | 0 | -10000 | 0 | 0 |
| PRKCA | 0.019 | 0.13 | 0.25 | 3 | -0.59 | 9 | 12 |
| PRKCB | 0.018 | 0.14 | 0.33 | 6 | -0.61 | 12 | 18 |
| PRKCE | 0.017 | 0.13 | -10000 | 0 | -0.56 | 10 | 10 |
| PRKCD | -0.001 | 0.12 | -10000 | 0 | -0.59 | 9 | 9 |
| PRKCG | -0.001 | 0.15 | -10000 | 0 | -0.57 | 18 | 18 |
| regulation of vascular smooth muscle contraction | 0.027 | 0.21 | 0.42 | 5 | -0.91 | 17 | 22 |
| PRKCQ | 0.009 | 0.14 | 0.29 | 1 | -0.62 | 12 | 13 |
| PLA2G4A | 0.042 | 0.16 | 0.38 | 7 | -0.62 | 12 | 19 |
| GNA14 | 0.024 | 0.072 | -10000 | 0 | -0.63 | 6 | 6 |
| GNA15 | 0.014 | 0.1 | -10000 | 0 | -0.58 | 15 | 15 |
| GNA12 | 0.027 | 0.009 | -10000 | 0 | -10000 | 0 | 0 |
| GNA11 | 0.028 | 0.051 | -10000 | 0 | -0.63 | 3 | 3 |
| Rac1/GTP | 0.038 | 0.18 | 0.41 | 19 | -0.53 | 4 | 23 |
| MMP1 | -0.11 | 0.28 | 0.7 | 1 | -0.62 | 99 | 100 |
Figure S64. Get High-res Image This plot shows pathway concept perturbations across all samples against a permutation model. The concepts along the x-axis are sorted by lowest to highest mean activity for the real patient samples. Mean inferred activities are plotted along the y-axis as a colored band showing the average level and one standard deviation range. Real samples are shown in red and permuted samples in black.
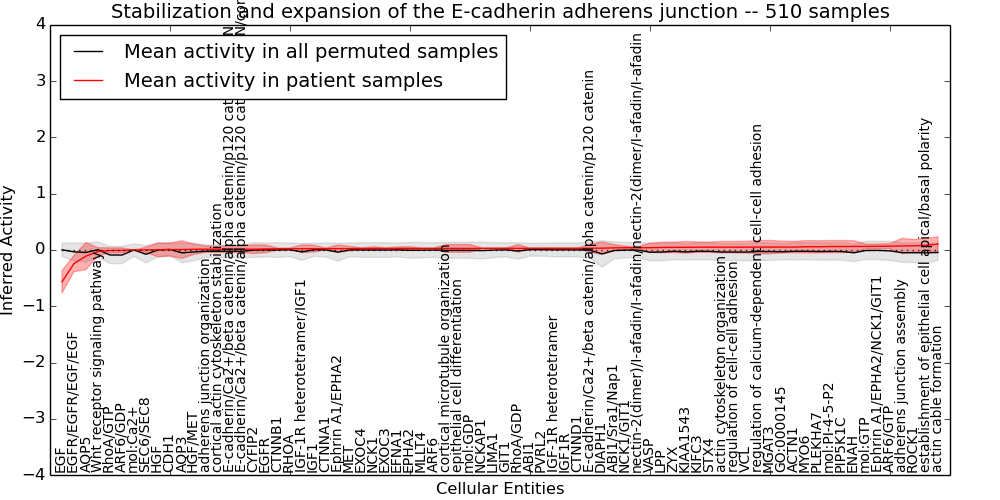
Table S64. Get Full Table This table displays mean, standard deviation, and perturbation statistics for Inferred Pathway Levels (IPLs). A mean perturbation of -9999 implies that the IPLs across all the real samples did not differ enough from the IPLs generated by a background model of permuted samples (> 1 Std.Dev from the permuted sample IPLs).
| Entity | Mean | Std.Dev | Mean.of.Up.Perturbations | Number.of.Up.Perturbations | Mean.of.Down.Perturbations | Number.of.Down.Perturbations | Number.of.Total.Perturbations |
|---|---|---|---|---|---|---|---|
| adherens junction organization | 0.013 | 0.057 | -10000 | 0 | -0.3 | 13 | 13 |
| epithelial cell differentiation | 0.028 | 0.07 | -10000 | 0 | -0.34 | 13 | 13 |
| CYFIP2 | 0.014 | 0.078 | -10000 | 0 | -0.64 | 7 | 7 |
| ENAH | 0.063 | 0.1 | 0.39 | 17 | -10000 | 0 | 17 |
| EGFR | 0.02 | 0.068 | -10000 | 0 | -0.6 | 6 | 6 |
| EPHA2 | 0.028 | 0.03 | -10000 | 0 | -0.64 | 1 | 1 |
| MYO6 | 0.058 | 0.11 | 0.38 | 13 | -0.35 | 12 | 25 |
| CTNNB1 | 0.021 | 0.014 | -10000 | 0 | -10000 | 0 | 0 |
| ABI1/Sra1/Nap1 | 0.038 | 0.059 | -10000 | 0 | -0.4 | 7 | 7 |
| AQP5 | -0.11 | 0.24 | -10000 | 0 | -0.5 | 116 | 116 |
| CTNND1 | 0.03 | 0.003 | -10000 | 0 | -10000 | 0 | 0 |
| mol:PI-4-5-P2 | 0.061 | 0.11 | 0.4 | 13 | -10000 | 0 | 13 |
| regulation of calcium-dependent cell-cell adhesion | 0.051 | 0.12 | 0.4 | 11 | -0.46 | 1 | 12 |
| EGF | -0.57 | 0.2 | -10000 | 0 | -0.63 | 460 | 460 |
| NCKAP1 | 0.029 | 0.006 | -10000 | 0 | -10000 | 0 | 0 |
| AQP3 | 0.008 | 0.16 | -10000 | 0 | -0.54 | 29 | 29 |
| cortical microtubule organization | 0.028 | 0.07 | -10000 | 0 | -0.34 | 13 | 13 |
| GO:0000145 | 0.052 | 0.1 | 0.39 | 13 | -10000 | 0 | 13 |
| E-cadherin/Ca2+/beta catenin/alpha catenin/p120 catenin | 0.032 | 0.072 | -10000 | 0 | -0.34 | 13 | 13 |
| MLLT4 | 0.028 | 0.008 | -10000 | 0 | -10000 | 0 | 0 |
| ARF6/GDP | -0.008 | 0.045 | -10000 | 0 | -10000 | 0 | 0 |
| ARF6 | 0.028 | 0.008 | -10000 | 0 | -10000 | 0 | 0 |
| Ephrin A1/EPHA2/NCK1/GIT1 | 0.065 | 0.042 | -10000 | 0 | -0.37 | 2 | 2 |
| mol:Ca2+ | 0 | 0 | -10000 | 0 | -10000 | 0 | 0 |
| VASP | 0.041 | 0.083 | 0.38 | 2 | -10000 | 0 | 2 |
| PVRL2 | 0.03 | 0.004 | -10000 | 0 | -10000 | 0 | 0 |
| ZYX | 0.047 | 0.093 | 0.36 | 5 | -10000 | 0 | 5 |
| ARF6/GTP | 0.069 | 0.045 | -10000 | 0 | -10000 | 0 | 0 |
| CDH1 | 0.007 | 0.12 | -10000 | 0 | -0.62 | 17 | 17 |
| EGFR/EGFR/EGF/EGF | -0.24 | 0.14 | -10000 | 0 | -0.59 | 18 | 18 |
| RhoA/GDP | 0.03 | 0.067 | -10000 | 0 | -0.32 | 10 | 10 |
| actin cytoskeleton organization | 0.051 | 0.1 | 0.35 | 12 | -0.45 | 2 | 14 |
| IGF-1R heterotetramer | 0.03 | 0.003 | -10000 | 0 | -10000 | 0 | 0 |
| GIT1 | 0.03 | 0.005 | -10000 | 0 | -10000 | 0 | 0 |
| IGF1R | 0.03 | 0.003 | -10000 | 0 | -10000 | 0 | 0 |
| IGF1 | 0.023 | 0.061 | -10000 | 0 | -0.59 | 5 | 5 |
| DIAPH1 | 0.032 | 0.11 | -10000 | 0 | -0.67 | 7 | 7 |
| Wnt receptor signaling pathway | -0.028 | 0.07 | 0.34 | 13 | -10000 | 0 | 13 |
| RHOA | 0.021 | 0.014 | -10000 | 0 | -10000 | 0 | 0 |
| RhoA/GTP | -0.009 | 0.047 | -10000 | 0 | -10000 | 0 | 0 |
| CTNNA1 | 0.023 | 0.013 | -10000 | 0 | -10000 | 0 | 0 |
| VCL | 0.051 | 0.1 | 0.35 | 12 | -0.46 | 2 | 14 |
| EFNA1 | 0.027 | 0.028 | -10000 | 0 | -0.59 | 1 | 1 |
| LPP | 0.046 | 0.094 | 0.39 | 6 | -10000 | 0 | 6 |
| Ephrin A1/EPHA2 | 0.024 | 0.064 | -10000 | 0 | -10000 | 0 | 0 |
| SEC6/SEC8 | 0.002 | 0.049 | -10000 | 0 | -10000 | 0 | 0 |
| MGAT3 | 0.052 | 0.12 | 0.41 | 11 | -0.47 | 1 | 12 |
| HGF/MET | 0.013 | 0.09 | -10000 | 0 | -0.59 | 3 | 3 |
| HGF | 0.002 | 0.12 | -10000 | 0 | -0.6 | 20 | 20 |
| E-cadherin/Ca2+/beta catenin/alpha catenin/p120 catenin/EPLIN | 0.013 | 0.058 | -10000 | 0 | -0.3 | 13 | 13 |
| actin cable formation | 0.11 | 0.13 | 0.33 | 72 | -10000 | 0 | 72 |
| KIAA1543 | 0.048 | 0.1 | 0.36 | 10 | -0.53 | 2 | 12 |
| KIFC3 | 0.05 | 0.093 | -10000 | 0 | -0.33 | 11 | 11 |
| NCK1 | 0.027 | 0.03 | -10000 | 0 | -0.64 | 1 | 1 |
| EXOC3 | 0.027 | 0.009 | -10000 | 0 | -10000 | 0 | 0 |
| ACTN1 | 0.052 | 0.1 | 0.43 | 7 | -10000 | 0 | 7 |
| NCK1/GIT1 | 0.04 | 0.026 | -10000 | 0 | -0.47 | 1 | 1 |
| mol:GDP | 0.028 | 0.07 | -10000 | 0 | -0.34 | 13 | 13 |
| EXOC4 | 0.027 | 0.009 | -10000 | 0 | -10000 | 0 | 0 |
| STX4 | 0.05 | 0.091 | -10000 | 0 | -10000 | 0 | 0 |
| PIP5K1C | 0.062 | 0.11 | 0.4 | 13 | -10000 | 0 | 13 |
| LIMA1 | 0.029 | 0.005 | -10000 | 0 | -10000 | 0 | 0 |
| ABI1 | 0.03 | 0.004 | -10000 | 0 | -10000 | 0 | 0 |
| ROCK1 | 0.075 | 0.11 | 0.41 | 19 | -10000 | 0 | 19 |
| adherens junction assembly | 0.072 | 0.14 | 0.51 | 16 | -0.71 | 2 | 18 |
| IGF-1R heterotetramer/IGF1 | 0.023 | 0.069 | -10000 | 0 | -10000 | 0 | 0 |
| nectin-2(dimer)/I-afadin/I-afadin/nectin-2(dimer/I-afadin/I-afadin | 0.041 | 0.013 | -10000 | 0 | -10000 | 0 | 0 |
| MET | 0.024 | 0.04 | -10000 | 0 | -0.59 | 2 | 2 |
| PLEKHA7 | 0.058 | 0.11 | 0.36 | 10 | -0.55 | 2 | 12 |
| mol:GTP | 0.063 | 0.041 | -10000 | 0 | -0.36 | 2 | 2 |
| establishment of epithelial cell apical/basal polarity | 0.083 | 0.12 | 0.38 | 46 | -10000 | 0 | 46 |
| cortical actin cytoskeleton stabilization | 0.013 | 0.057 | -10000 | 0 | -0.3 | 13 | 13 |
| regulation of cell-cell adhesion | 0.051 | 0.1 | 0.35 | 12 | -0.45 | 2 | 14 |
| E-cadherin/Ca2+/beta catenin/alpha catenin/p120 catenin/EPLIN/cortical actin cytoskeleton | 0.013 | 0.058 | -10000 | 0 | -0.3 | 13 | 13 |
Figure S65. Get High-res Image This plot shows pathway concept perturbations across all samples against a permutation model. The concepts along the x-axis are sorted by lowest to highest mean activity for the real patient samples. Mean inferred activities are plotted along the y-axis as a colored band showing the average level and one standard deviation range. Real samples are shown in red and permuted samples in black.
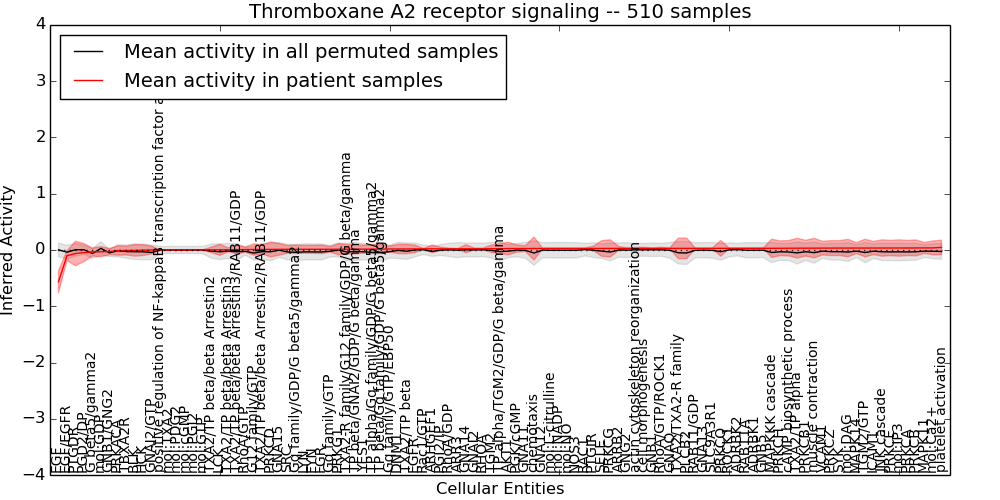
Table S65. Get Full Table This table displays mean, standard deviation, and perturbation statistics for Inferred Pathway Levels (IPLs). A mean perturbation of -9999 implies that the IPLs across all the real samples did not differ enough from the IPLs generated by a background model of permuted samples (> 1 Std.Dev from the permuted sample IPLs).
| Entity | Mean | Std.Dev | Mean.of.Up.Perturbations | Number.of.Up.Perturbations | Mean.of.Down.Perturbations | Number.of.Down.Perturbations | Number.of.Total.Perturbations |
|---|---|---|---|---|---|---|---|
| TGM2 | 0.022 | 0.067 | -10000 | 0 | -0.59 | 6 | 6 |
| GNB1/GNG2 | -0.027 | 0.054 | -10000 | 0 | -0.2 | 19 | 19 |
| AKT1 | 0.026 | 0.11 | 0.3 | 6 | -0.35 | 13 | 19 |
| EGF | -0.57 | 0.2 | -10000 | 0 | -0.63 | 460 | 460 |
| mol:TXA2 | 0 | 0 | -10000 | 0 | -10000 | 0 | 0 |
| FGR | 0.013 | 0.076 | 0.34 | 3 | -0.4 | 2 | 5 |
| mol:Ca2+ | 0.038 | 0.12 | 0.33 | 6 | -0.33 | 17 | 23 |
| LYN | 0.012 | 0.069 | 0.37 | 2 | -10000 | 0 | 2 |
| RhoA/GTP | 0.008 | 0.047 | -10000 | 0 | -10000 | 0 | 0 |
| mol:PGI2 | 0 | 0 | -10000 | 0 | -10000 | 0 | 0 |
| SYK | 0.034 | 0.13 | 0.36 | 5 | -0.36 | 18 | 23 |
| GNG2 | 0.028 | 0.008 | -10000 | 0 | -10000 | 0 | 0 |
| ARRB2 | 0.028 | 0.033 | -10000 | 0 | -0.71 | 1 | 1 |
| TP alpha/Gq family/GDP/G beta5/gamma2 | 0.015 | 0.079 | 0.36 | 1 | -0.48 | 5 | 6 |
| G beta5/gamma2 | -0.035 | 0.071 | -10000 | 0 | -0.27 | 19 | 19 |
| PRKCH | 0.031 | 0.13 | 0.38 | 3 | -0.38 | 16 | 19 |
| DNM1 | 0.018 | 0.083 | -10000 | 0 | -0.6 | 9 | 9 |
| TXA2/TP beta/beta Arrestin3 | 0.004 | 0.035 | -10000 | 0 | -0.42 | 1 | 1 |
| mol:GTP | 0.001 | 0.001 | -10000 | 0 | -10000 | 0 | 0 |
| PTGDR | -0.063 | 0.22 | -10000 | 0 | -0.59 | 75 | 75 |
| G12 family/GTP | 0.009 | 0.1 | -10000 | 0 | -0.32 | 14 | 14 |
| ADRBK1 | 0.03 | 0.003 | -10000 | 0 | -10000 | 0 | 0 |
| ADRBK2 | 0.03 | 0.004 | -10000 | 0 | -10000 | 0 | 0 |
| RhoA/GTP/ROCK1 | 0.029 | 0.019 | -10000 | 0 | -10000 | 0 | 0 |
| mol:GDP | -0.031 | 0.092 | 0.42 | 4 | -0.31 | 3 | 7 |
| mol:NADP | 0.027 | 0.009 | -10000 | 0 | -10000 | 0 | 0 |
| RAB11A | 0.03 | 0.003 | -10000 | 0 | -10000 | 0 | 0 |
| PRKG1 | 0.014 | 0.1 | -10000 | 0 | -0.64 | 12 | 12 |
| mol:IP3 | 0.036 | 0.15 | 0.39 | 4 | -0.41 | 19 | 23 |
| cell morphogenesis | 0.029 | 0.019 | -10000 | 0 | -10000 | 0 | 0 |
| PLCB2 | 0.029 | 0.18 | 0.5 | 2 | -0.55 | 22 | 24 |
| mol:cGMP | 0 | 0 | -10000 | 0 | -10000 | 0 | 0 |
| BLK | -0.007 | 0.1 | 0.37 | 2 | -0.39 | 15 | 17 |
| mol:PDG2 | 0 | 0 | -10000 | 0 | -10000 | 0 | 0 |
| HCK | -0.002 | 0.095 | 0.39 | 1 | -0.39 | 9 | 10 |
| RHOA | 0.021 | 0.014 | -10000 | 0 | -10000 | 0 | 0 |
| PTGIR | 0.027 | 0.04 | -10000 | 0 | -0.61 | 2 | 2 |
| PRKCB1 | 0.033 | 0.14 | 0.37 | 4 | -0.38 | 28 | 32 |
| GNAQ | 0.029 | 0.006 | -10000 | 0 | -10000 | 0 | 0 |
| mol:L-citrulline | 0.027 | 0.009 | -10000 | 0 | -10000 | 0 | 0 |
| TXA2/TXA2-R family | 0.029 | 0.18 | 0.51 | 2 | -0.52 | 37 | 39 |
| LCK | 0.003 | 0.098 | 0.34 | 3 | -0.4 | 12 | 15 |
| TXA2/TP beta/beta Arrestin3/RAB11/GDP | 0.007 | 0.08 | -10000 | 0 | -10000 | 0 | 0 |
| TXA2-R family/G12 family/GDP/G beta/gamma | 0.014 | 0.083 | -10000 | 0 | -0.46 | 9 | 9 |
| TXA2/TP beta/beta Arrestin2/RAB11/GDP | 0.01 | 0.081 | -10000 | 0 | -0.35 | 1 | 1 |
| MAPK14 | 0.035 | 0.097 | 0.28 | 9 | -0.26 | 2 | 11 |
| TGM2/GTP | 0.035 | 0.16 | 0.38 | 2 | -0.46 | 14 | 16 |
| MAPK11 | 0.037 | 0.097 | 0.28 | 10 | -0.28 | 5 | 15 |
| ARHGEF1 | 0.02 | 0.069 | -10000 | 0 | -0.22 | 1 | 1 |
| GNAI2 | 0.021 | 0.014 | -10000 | 0 | -10000 | 0 | 0 |
| JNK cascade | 0.035 | 0.15 | 0.4 | 4 | -0.38 | 34 | 38 |
| RAB11/GDP | 0.029 | 0.003 | -10000 | 0 | -10000 | 0 | 0 |
| ICAM1 | 0.035 | 0.12 | 0.32 | 5 | -0.32 | 16 | 21 |
| cAMP biosynthetic process | 0.032 | 0.14 | 0.36 | 5 | -0.37 | 19 | 24 |
| Gq family/GTP/EBP50 | 0.018 | 0.053 | 0.23 | 3 | -10000 | 0 | 3 |
| actin cytoskeleton reorganization | 0.029 | 0.019 | -10000 | 0 | -10000 | 0 | 0 |
| SRC | 0.012 | 0.068 | 0.39 | 1 | -10000 | 0 | 1 |
| GNB5 | 0.03 | 0.003 | -10000 | 0 | -10000 | 0 | 0 |
| GNB1 | 0.029 | 0.006 | -10000 | 0 | -10000 | 0 | 0 |
| EGF/EGFR | -0.1 | 0.086 | 0.27 | 2 | -0.32 | 16 | 18 |
| VCAM1 | 0.034 | 0.12 | 0.31 | 6 | -0.34 | 19 | 25 |
| TP beta/Gq family/GDP/G beta5/gamma2 | 0.015 | 0.079 | 0.36 | 1 | -0.48 | 5 | 6 |
| platelet activation | 0.046 | 0.13 | 0.36 | 10 | -0.32 | 12 | 22 |
| PGI2/IP | 0.02 | 0.03 | -10000 | 0 | -0.45 | 2 | 2 |
| PRKACA | -0.009 | 0.084 | -10000 | 0 | -0.32 | 2 | 2 |
| Gq family/GDP/G beta5/gamma2 | 0.012 | 0.076 | 0.26 | 1 | -0.47 | 4 | 5 |
| TXA2/TP beta/beta Arrestin2 | 0.002 | 0.049 | -10000 | 0 | -0.38 | 4 | 4 |
| positive regulation of NF-kappaB transcription factor activity | 0 | 0 | -10000 | 0 | -10000 | 0 | 0 |
| TBXA2R | -0.009 | 0.078 | -10000 | 0 | -0.3 | 2 | 2 |
| mol:DAG | 0.034 | 0.16 | 0.42 | 3 | -0.43 | 29 | 32 |
| EGFR | 0.02 | 0.068 | -10000 | 0 | -0.6 | 6 | 6 |
| TXA2/TP alpha | 0.032 | 0.18 | 0.47 | 3 | -0.51 | 20 | 23 |
| Gq family/GTP | 0.013 | 0.05 | 0.22 | 1 | -0.3 | 6 | 7 |
| YES1 | 0.014 | 0.071 | 0.37 | 2 | -10000 | 0 | 2 |
| GNAI2/GTP | 0 | 0.068 | -10000 | 0 | -10000 | 0 | 0 |
| PGD2/DP | -0.046 | 0.16 | -10000 | 0 | -0.44 | 75 | 75 |
| SLC9A3R1 | 0.029 | 0.005 | -10000 | 0 | -10000 | 0 | 0 |
| FYN | 0.013 | 0.07 | 0.34 | 3 | -10000 | 0 | 3 |
| mol:NO | 0.027 | 0.009 | -10000 | 0 | -10000 | 0 | 0 |
| GNA15 | 0.012 | 0.1 | -10000 | 0 | -0.59 | 15 | 15 |
| PGK/cGMP | 0.026 | 0.065 | -10000 | 0 | -0.41 | 10 | 10 |
| RhoA/GDP | 0.021 | 0.013 | -10000 | 0 | -10000 | 0 | 0 |
| TP alpha/TGM2/GDP/G beta/gamma | 0.023 | 0.093 | -10000 | 0 | -0.45 | 1 | 1 |
| NOS3 | 0.027 | 0.009 | -10000 | 0 | -10000 | 0 | 0 |
| RAC1 | 0.027 | 0.009 | -10000 | 0 | -10000 | 0 | 0 |
| PRKCA | 0.036 | 0.14 | 0.37 | 6 | -0.38 | 14 | 20 |
| PRKCB | 0.037 | 0.14 | 0.35 | 12 | -0.39 | 20 | 32 |
| PRKCE | 0.035 | 0.14 | 0.34 | 5 | -0.4 | 14 | 19 |
| PRKCD | 0.01 | 0.13 | 0.41 | 3 | -0.38 | 27 | 30 |
| PRKCG | 0.028 | 0.15 | 0.42 | 3 | -0.42 | 31 | 34 |
| muscle contraction | 0.033 | 0.17 | 0.46 | 3 | -0.48 | 33 | 36 |
| PRKCZ | 0.034 | 0.13 | 0.38 | 4 | -0.36 | 16 | 20 |
| ARR3 | 0.021 | 0.005 | -10000 | 0 | -10000 | 0 | 0 |
| TXA2/TP beta | 0.018 | 0.083 | -10000 | 0 | -10000 | 0 | 0 |
| PRKCQ | 0.029 | 0.14 | 0.37 | 5 | -0.38 | 26 | 31 |
| MAPKKK cascade | 0.03 | 0.16 | 0.43 | 3 | -0.47 | 26 | 29 |
| SELE | 0.027 | 0.14 | 0.31 | 6 | -0.4 | 37 | 43 |
| TP beta/GNAI2/GDP/G beta/gamma | 0.014 | 0.083 | -10000 | 0 | -10000 | 0 | 0 |
| ROCK1 | 0.03 | 0.004 | -10000 | 0 | -10000 | 0 | 0 |
| GNA14 | 0.021 | 0.072 | -10000 | 0 | -0.64 | 6 | 6 |
| chemotaxis | 0.027 | 0.2 | 0.52 | 2 | -0.6 | 37 | 39 |
| GNA12 | 0.027 | 0.009 | -10000 | 0 | -10000 | 0 | 0 |
| GNA13 | 0.029 | 0.005 | -10000 | 0 | -10000 | 0 | 0 |
| GNA11 | 0.026 | 0.051 | -10000 | 0 | -0.64 | 3 | 3 |
| Rac1/GTP | 0.02 | 0.007 | -10000 | 0 | -10000 | 0 | 0 |
Figure S66. Get High-res Image This plot shows pathway concept perturbations across all samples against a permutation model. The concepts along the x-axis are sorted by lowest to highest mean activity for the real patient samples. Mean inferred activities are plotted along the y-axis as a colored band showing the average level and one standard deviation range. Real samples are shown in red and permuted samples in black.
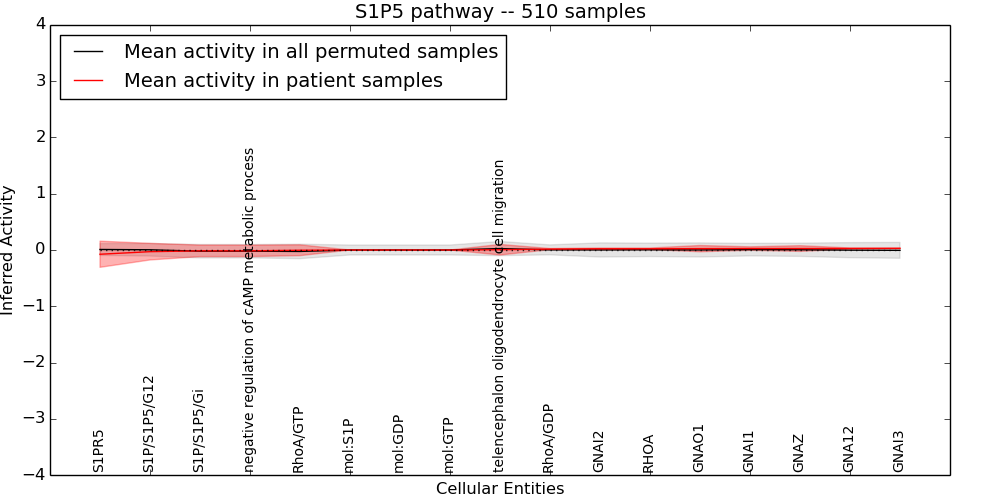
Table S66. Get Full Table This table displays mean, standard deviation, and perturbation statistics for Inferred Pathway Levels (IPLs). A mean perturbation of -9999 implies that the IPLs across all the real samples did not differ enough from the IPLs generated by a background model of permuted samples (> 1 Std.Dev from the permuted sample IPLs).
| Entity | Mean | Std.Dev | Mean.of.Up.Perturbations | Number.of.Up.Perturbations | Mean.of.Down.Perturbations | Number.of.Down.Perturbations | Number.of.Total.Perturbations |
|---|---|---|---|---|---|---|---|
| mol:S1P | 0 | 0 | -10000 | 0 | -10000 | 0 | 0 |
| telencephalon oligodendrocyte cell migration | 0.005 | 0.094 | 0.31 | 17 | -10000 | 0 | 17 |
| GNAI2 | 0.021 | 0.014 | -10000 | 0 | -10000 | 0 | 0 |
| S1P/S1P5/G12 | -0.03 | 0.15 | -10000 | 0 | -0.37 | 78 | 78 |
| mol:GDP | 0 | 0 | -10000 | 0 | -10000 | 0 | 0 |
| GNAO1 | 0.024 | 0.056 | -10000 | 0 | -0.6 | 4 | 4 |
| RhoA/GTP | -0.004 | 0.096 | -10000 | 0 | -0.31 | 17 | 17 |
| negative regulation of cAMP metabolic process | -0.015 | 0.1 | -10000 | 0 | -0.33 | 25 | 25 |
| GNAZ | 0.026 | 0.051 | -10000 | 0 | -0.64 | 3 | 3 |
| GNAI3 | 0.029 | 0.005 | -10000 | 0 | -10000 | 0 | 0 |
| GNA12 | 0.027 | 0.009 | -10000 | 0 | -10000 | 0 | 0 |
| S1PR5 | -0.075 | 0.23 | -10000 | 0 | -0.59 | 87 | 87 |
| mol:GTP | 0 | 0 | -10000 | 0 | -10000 | 0 | 0 |
| S1P/S1P5/Gi | -0.015 | 0.1 | -10000 | 0 | -0.34 | 25 | 25 |
| RhoA/GDP | 0.016 | 0.01 | -10000 | 0 | -10000 | 0 | 0 |
| RHOA | 0.021 | 0.014 | -10000 | 0 | -10000 | 0 | 0 |
| GNAI1 | 0.026 | 0.031 | -10000 | 0 | -0.64 | 1 | 1 |
Figure S67. Get High-res Image This plot shows pathway concept perturbations across all samples against a permutation model. The concepts along the x-axis are sorted by lowest to highest mean activity for the real patient samples. Mean inferred activities are plotted along the y-axis as a colored band showing the average level and one standard deviation range. Real samples are shown in red and permuted samples in black.
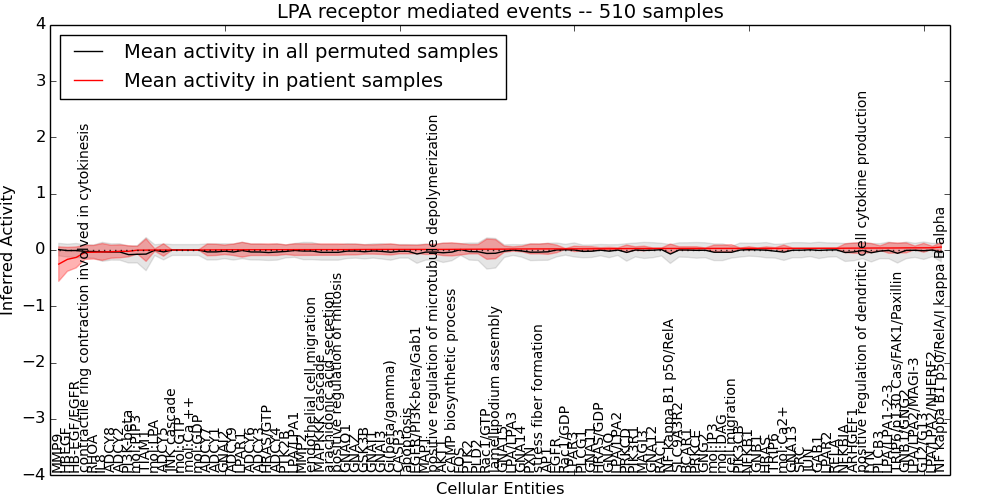
Table S67. Get Full Table This table displays mean, standard deviation, and perturbation statistics for Inferred Pathway Levels (IPLs). A mean perturbation of -9999 implies that the IPLs across all the real samples did not differ enough from the IPLs generated by a background model of permuted samples (> 1 Std.Dev from the permuted sample IPLs).
| Entity | Mean | Std.Dev | Mean.of.Up.Perturbations | Number.of.Up.Perturbations | Mean.of.Down.Perturbations | Number.of.Down.Perturbations | Number.of.Total.Perturbations |
|---|---|---|---|---|---|---|---|
| GNB1/GNG2 | 0.038 | 0.088 | -10000 | 0 | -0.36 | 21 | 21 |
| NF kappa B1 p50/RelA/I kappa B alpha | 0.052 | 0.079 | -10000 | 0 | -10000 | 0 | 0 |
| AP1 | 0.019 | 0.096 | -10000 | 0 | -0.39 | 4 | 4 |
| mol:PIP3 | -0.002 | 0.067 | -10000 | 0 | -0.49 | 1 | 1 |
| AKT1 | 0.011 | 0.11 | 0.42 | 1 | -0.4 | 1 | 2 |
| PTK2B | 0.005 | 0.086 | 0.26 | 1 | -0.38 | 9 | 10 |
| RHOA | -0.04 | 0.12 | -10000 | 0 | -0.38 | 19 | 19 |
| PIK3CB | 0.028 | 0.007 | -10000 | 0 | -10000 | 0 | 0 |
| mol:Ca2+ | 0.029 | 0.059 | 0.42 | 2 | -0.39 | 2 | 4 |
| MAGI3 | 0.027 | 0.042 | -10000 | 0 | -0.63 | 2 | 2 |
| RELA | 0.03 | 0.003 | -10000 | 0 | -10000 | 0 | 0 |
| apoptosis | 0.01 | 0.078 | -10000 | 0 | -0.33 | 22 | 22 |
| HRAS/GDP | 0.021 | 0.02 | -10000 | 0 | -0.43 | 1 | 1 |
| positive regulation of microtubule depolymerization | 0.011 | 0.087 | 0.28 | 4 | -0.34 | 7 | 11 |
| NF kappa B1 p50/RelA | 0.027 | 0.078 | -10000 | 0 | -10000 | 0 | 0 |
| endothelial cell migration | 0.006 | 0.1 | -10000 | 0 | -0.42 | 26 | 26 |
| ADCY4 | 0.005 | 0.1 | -10000 | 0 | -0.45 | 21 | 21 |
| ADCY5 | 0 | 0.11 | -10000 | 0 | -0.44 | 26 | 26 |
| ADCY6 | 0.005 | 0.1 | -10000 | 0 | -0.44 | 21 | 21 |
| ADCY7 | 0.002 | 0.1 | -10000 | 0 | -0.45 | 21 | 21 |
| ADCY1 | 0.002 | 0.1 | -10000 | 0 | -0.44 | 21 | 21 |
| ADCY2 | -0.023 | 0.12 | -10000 | 0 | -0.44 | 25 | 25 |
| ADCY3 | 0.005 | 0.1 | -10000 | 0 | -0.44 | 22 | 22 |
| ADCY8 | -0.031 | 0.12 | -10000 | 0 | -0.43 | 27 | 27 |
| ADCY9 | 0.004 | 0.1 | -10000 | 0 | -0.44 | 21 | 21 |
| GSK3B | 0.009 | 0.083 | 0.28 | 4 | -0.38 | 7 | 11 |
| arachidonic acid secretion | 0.007 | 0.1 | -10000 | 0 | -0.44 | 21 | 21 |
| GNG2 | 0.028 | 0.008 | -10000 | 0 | -10000 | 0 | 0 |
| TRIP6 | 0.029 | 0.012 | -10000 | 0 | -10000 | 0 | 0 |
| GNAO1 | 0.007 | 0.094 | -10000 | 0 | -0.38 | 25 | 25 |
| HRAS | 0.029 | 0.027 | -10000 | 0 | -0.59 | 1 | 1 |
| NFKBIA | 0.032 | 0.077 | 0.36 | 4 | -0.38 | 2 | 6 |
| GAB1 | 0.03 | 0.004 | -10000 | 0 | -10000 | 0 | 0 |
| mol:GTP | 0 | 0 | -10000 | 0 | -10000 | 0 | 0 |
| lamellipodium assembly | 0.015 | 0.17 | -10000 | 0 | -0.82 | 19 | 19 |
| JUN | 0.029 | 0.006 | -10000 | 0 | -10000 | 0 | 0 |
| LPA/LPA2/NHERF2 | 0.04 | 0.025 | -10000 | 0 | -0.4 | 1 | 1 |
| TIAM1 | -0.002 | 0.2 | -10000 | 0 | -0.98 | 20 | 20 |
| PIK3R1 | 0.026 | 0.031 | -10000 | 0 | -0.63 | 1 | 1 |
| mol:IP3 | 0.028 | 0.059 | 0.42 | 2 | -0.4 | 2 | 4 |
| PLCB3 | 0.035 | 0.039 | -10000 | 0 | -0.36 | 1 | 1 |
| FOS | 0.012 | 0.1 | -10000 | 0 | -0.63 | 12 | 12 |
| positive regulation of mitosis | 0.007 | 0.1 | -10000 | 0 | -0.44 | 21 | 21 |
| LPA/LPA1-2-3 | 0.035 | 0.094 | -10000 | 0 | -0.36 | 24 | 24 |
| mol:Ca ++ | 0 | 0 | -10000 | 0 | -10000 | 0 | 0 |
| JNK cascade | 0 | 0 | -10000 | 0 | -10000 | 0 | 0 |
| BCAR1 | 0.028 | 0.03 | -10000 | 0 | -0.64 | 1 | 1 |
| stress fiber formation | 0.019 | 0.087 | 0.38 | 1 | -0.37 | 6 | 7 |
| GNAZ | 0.008 | 0.095 | -10000 | 0 | -0.4 | 23 | 23 |
| EGFR/PI3K-beta/Gab1 | 0.01 | 0.073 | -10000 | 0 | -0.51 | 1 | 1 |
| positive regulation of dendritic cell cytokine production | 0.034 | 0.093 | -10000 | 0 | -0.36 | 24 | 24 |
| LPA/LPA2/MAGI-3 | 0.038 | 0.032 | -10000 | 0 | -0.4 | 2 | 2 |
| ARHGEF1 | 0.033 | 0.091 | 0.37 | 6 | -10000 | 0 | 6 |
| GNAI2 | 0.004 | 0.084 | -10000 | 0 | -0.37 | 21 | 21 |
| GNAI3 | 0.01 | 0.089 | -10000 | 0 | -0.39 | 21 | 21 |
| GNAI1 | 0.009 | 0.083 | -10000 | 0 | -0.38 | 19 | 19 |
| LPA/LPA3 | 0.017 | 0.038 | -10000 | 0 | -0.37 | 4 | 4 |
| LPA/LPA2 | 0.024 | 0.015 | -10000 | 0 | -10000 | 0 | 0 |
| LPA/LPA1 | 0.006 | 0.1 | -10000 | 0 | -0.43 | 26 | 26 |
| HB-EGF/EGFR | -0.13 | 0.19 | -10000 | 0 | -0.37 | 182 | 182 |
| HBEGF | -0.17 | 0.21 | -10000 | 0 | -0.43 | 188 | 188 |
| mol:DAG | 0.028 | 0.059 | 0.42 | 2 | -0.4 | 2 | 4 |
| cAMP biosynthetic process | 0.011 | 0.12 | 0.36 | 10 | -0.43 | 16 | 26 |
| NFKB1 | 0.028 | 0.03 | -10000 | 0 | -0.64 | 1 | 1 |
| SRC | 0.029 | 0.006 | -10000 | 0 | -10000 | 0 | 0 |
| GNB1 | 0.029 | 0.006 | -10000 | 0 | -10000 | 0 | 0 |
| LYN | 0.035 | 0.081 | 0.35 | 6 | -0.41 | 1 | 7 |
| GNAQ | 0.022 | 0.026 | -10000 | 0 | -10000 | 0 | 0 |
| LPAR2 | 0.03 | 0.003 | -10000 | 0 | -10000 | 0 | 0 |
| LPAR3 | 0.02 | 0.048 | -10000 | 0 | -0.59 | 3 | 3 |
| LPAR1 | 0.004 | 0.13 | -10000 | 0 | -0.6 | 22 | 22 |
| IL8 | -0.035 | 0.15 | -10000 | 0 | -0.41 | 30 | 30 |
| PTK2 | 0.013 | 0.082 | -10000 | 0 | -0.34 | 16 | 16 |
| Rac1/GDP | 0.02 | 0.007 | -10000 | 0 | -10000 | 0 | 0 |
| CASP3 | 0.01 | 0.079 | -10000 | 0 | -0.33 | 22 | 22 |
| EGFR | 0.02 | 0.068 | -10000 | 0 | -0.6 | 6 | 6 |
| PLCG1 | 0.02 | 0.04 | -10000 | 0 | -0.36 | 2 | 2 |
| PLD2 | 0.014 | 0.082 | -10000 | 0 | -0.34 | 2 | 2 |
| G12/G13 | 0.039 | 0.079 | -10000 | 0 | -0.36 | 14 | 14 |
| PI3K-beta | -0.023 | 0.099 | -10000 | 0 | -0.43 | 10 | 10 |
| cell migration | 0.028 | 0.066 | -10000 | 0 | -0.26 | 7 | 7 |
| SLC9A3R2 | 0.028 | 0.03 | -10000 | 0 | -0.64 | 1 | 1 |
| PXN | 0.019 | 0.088 | 0.38 | 1 | -0.38 | 6 | 7 |
| HRAS/GTP | 0.005 | 0.1 | -10000 | 0 | -0.45 | 21 | 21 |
| RAC1 | 0.027 | 0.009 | -10000 | 0 | -10000 | 0 | 0 |
| MMP9 | -0.25 | 0.31 | -10000 | 0 | -0.59 | 231 | 231 |
| PRKCE | 0.028 | 0.03 | -10000 | 0 | -0.64 | 1 | 1 |
| PRKCD | 0.025 | 0.063 | 0.36 | 4 | -0.38 | 2 | 6 |
| Gi(beta/gamma) | 0.01 | 0.099 | -10000 | 0 | -0.42 | 21 | 21 |
| mol:LPA | 0 | 0.021 | -10000 | 0 | -0.28 | 1 | 1 |
| TRIP6/p130 Cas/FAK1/Paxillin | 0.036 | 0.088 | -10000 | 0 | -10000 | 0 | 0 |
| MAPKKK cascade | 0.007 | 0.1 | -10000 | 0 | -0.44 | 21 | 21 |
| contractile ring contraction involved in cytokinesis | -0.043 | 0.12 | -10000 | 0 | -0.38 | 19 | 19 |
| mol:GDP | 0 | 0 | -10000 | 0 | -10000 | 0 | 0 |
| GNA14 | 0.018 | 0.049 | -10000 | 0 | -0.34 | 8 | 8 |
| GNA15 | 0.015 | 0.054 | -10000 | 0 | -0.26 | 15 | 15 |
| GNA12 | 0.027 | 0.009 | -10000 | 0 | -10000 | 0 | 0 |
| GNA13 | 0.029 | 0.005 | -10000 | 0 | -10000 | 0 | 0 |
| MAPT | 0.01 | 0.089 | 0.28 | 4 | -0.35 | 7 | 11 |
| GNA11 | 0.021 | 0.037 | -10000 | 0 | -0.34 | 3 | 3 |
| Rac1/GTP | 0.015 | 0.18 | -10000 | 0 | -0.87 | 19 | 19 |
| MMP2 | 0.006 | 0.1 | -10000 | 0 | -0.42 | 26 | 26 |
Figure S68. Get High-res Image This plot shows pathway concept perturbations across all samples against a permutation model. The concepts along the x-axis are sorted by lowest to highest mean activity for the real patient samples. Mean inferred activities are plotted along the y-axis as a colored band showing the average level and one standard deviation range. Real samples are shown in red and permuted samples in black.
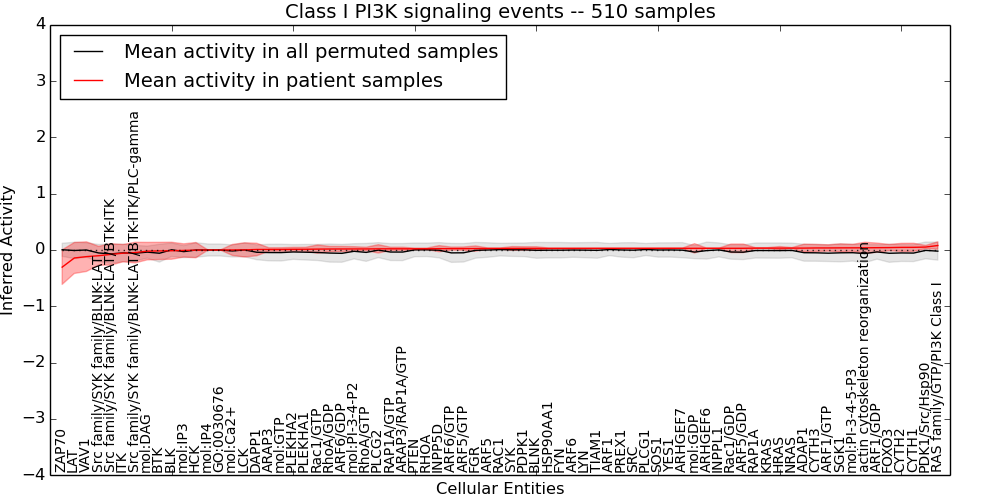
Table S68. Get Full Table This table displays mean, standard deviation, and perturbation statistics for Inferred Pathway Levels (IPLs). A mean perturbation of -9999 implies that the IPLs across all the real samples did not differ enough from the IPLs generated by a background model of permuted samples (> 1 Std.Dev from the permuted sample IPLs).
| Entity | Mean | Std.Dev | Mean.of.Up.Perturbations | Number.of.Up.Perturbations | Mean.of.Down.Perturbations | Number.of.Down.Perturbations | Number.of.Total.Perturbations |
|---|---|---|---|---|---|---|---|
| ARF5/GTP | 0.024 | 0.029 | 0.3 | 1 | -10000 | 0 | 1 |
| DAPP1 | 0.009 | 0.11 | 0.34 | 8 | -0.41 | 13 | 21 |
| Src family/SYK family/BLNK-LAT/BTK-ITK | -0.078 | 0.19 | 0.32 | 3 | -0.51 | 42 | 45 |
| mol:DAG | -0.02 | 0.16 | 0.29 | 55 | -0.28 | 13 | 68 |
| HRAS | 0.033 | 0.028 | -10000 | 0 | -0.59 | 1 | 1 |
| RAP1A | 0.033 | 0.009 | -10000 | 0 | -10000 | 0 | 0 |
| ARF5/GDP | 0.03 | 0.076 | 0.24 | 1 | -0.38 | 4 | 5 |
| PLCG2 | 0.02 | 0.074 | -10000 | 0 | -0.61 | 7 | 7 |
| PLCG1 | 0.029 | 0.006 | -10000 | 0 | -10000 | 0 | 0 |
| ARF5 | 0.027 | 0.009 | -10000 | 0 | -10000 | 0 | 0 |
| mol:GTP | 0.01 | 0.03 | 0.3 | 2 | -10000 | 0 | 2 |
| ARF1/GTP | 0.037 | 0.057 | 0.31 | 3 | -10000 | 0 | 3 |
| RHOA | 0.021 | 0.014 | -10000 | 0 | -10000 | 0 | 0 |
| YES1 | 0.03 | 0.004 | -10000 | 0 | -10000 | 0 | 0 |
| RAP1A/GTP | 0.021 | 0.028 | 0.3 | 1 | -10000 | 0 | 1 |
| ADAP1 | 0.033 | 0.07 | 0.29 | 3 | -10000 | 0 | 3 |
| ARAP3 | 0.01 | 0.03 | 0.3 | 2 | -10000 | 0 | 2 |
| INPPL1 | 0.03 | 0.003 | -10000 | 0 | -10000 | 0 | 0 |
| PREX1 | 0.029 | 0.006 | -10000 | 0 | -10000 | 0 | 0 |
| ARHGEF6 | 0.03 | 0.003 | -10000 | 0 | -10000 | 0 | 0 |
| ARHGEF7 | 0.03 | 0.004 | -10000 | 0 | -10000 | 0 | 0 |
| ARF1 | 0.029 | 0.006 | -10000 | 0 | -10000 | 0 | 0 |
| NRAS | 0.033 | 0.009 | -10000 | 0 | -10000 | 0 | 0 |
| FYN | 0.028 | 0.008 | -10000 | 0 | -10000 | 0 | 0 |
| ARF6 | 0.028 | 0.008 | -10000 | 0 | -10000 | 0 | 0 |
| FGR | 0.025 | 0.048 | -10000 | 0 | -0.59 | 3 | 3 |
| mol:Ca2+ | 0.001 | 0.098 | 0.31 | 20 | -10000 | 0 | 20 |
| mol:IP4 | 0 | 0 | -10000 | 0 | -10000 | 0 | 0 |
| TIAM1 | 0.029 | 0.006 | -10000 | 0 | -10000 | 0 | 0 |
| ZAP70 | -0.3 | 0.31 | -10000 | 0 | -0.59 | 276 | 276 |
| mol:IP3 | -0.008 | 0.12 | 0.34 | 21 | -10000 | 0 | 21 |
| LYN | 0.028 | 0.007 | -10000 | 0 | -10000 | 0 | 0 |
| ARF1/GDP | 0.041 | 0.082 | 0.25 | 6 | -0.37 | 4 | 10 |
| RhoA/GDP | 0.017 | 0.047 | 0.38 | 1 | -10000 | 0 | 1 |
| PDK1/Src/Hsp90 | 0.052 | 0.029 | -10000 | 0 | -0.4 | 1 | 1 |
| BLNK | 0.028 | 0.03 | -10000 | 0 | -0.64 | 1 | 1 |
| actin cytoskeleton reorganization | 0.039 | 0.098 | 0.36 | 13 | -10000 | 0 | 13 |
| SRC | 0.029 | 0.006 | -10000 | 0 | -10000 | 0 | 0 |
| PLEKHA2 | 0.012 | 0.034 | -10000 | 0 | -0.36 | 4 | 4 |
| RAC1 | 0.027 | 0.009 | -10000 | 0 | -10000 | 0 | 0 |
| PTEN | 0.021 | 0.013 | -10000 | 0 | -10000 | 0 | 0 |
| HSP90AA1 | 0.028 | 0.008 | -10000 | 0 | -10000 | 0 | 0 |
| ARF6/GTP | 0.024 | 0.028 | 0.3 | 1 | -10000 | 0 | 1 |
| RhoA/GTP | 0.019 | 0.031 | 0.3 | 2 | -10000 | 0 | 2 |
| Src family/SYK family/BLNK-LAT | -0.1 | 0.17 | -10000 | 0 | -0.43 | 57 | 57 |
| BLK | -0.013 | 0.15 | -10000 | 0 | -0.59 | 33 | 33 |
| PDPK1 | 0.028 | 0.03 | -10000 | 0 | -0.64 | 1 | 1 |
| CYTH1 | 0.047 | 0.073 | 0.29 | 11 | -10000 | 0 | 11 |
| HCK | -0.002 | 0.14 | -10000 | 0 | -0.59 | 26 | 26 |
| CYTH3 | 0.036 | 0.062 | 0.29 | 3 | -10000 | 0 | 3 |
| CYTH2 | 0.046 | 0.072 | 0.29 | 10 | -10000 | 0 | 10 |
| KRAS | 0.033 | 0.009 | -10000 | 0 | -10000 | 0 | 0 |
| GO:0030676 | 0 | 0 | -10000 | 0 | -10000 | 0 | 0 |
| FOXO3 | 0.043 | 0.056 | -10000 | 0 | -0.42 | 1 | 1 |
| SGK1 | 0.038 | 0.071 | -10000 | 0 | -0.45 | 1 | 1 |
| INPP5D | 0.024 | 0.055 | -10000 | 0 | -0.59 | 4 | 4 |
| mol:GDP | 0.03 | 0.083 | 0.24 | 9 | -0.4 | 4 | 13 |
| SOS1 | 0.029 | 0.005 | -10000 | 0 | -10000 | 0 | 0 |
| SYK | 0.027 | 0.034 | -10000 | 0 | -0.48 | 2 | 2 |
| ARF6/GDP | 0.018 | 0.046 | 0.39 | 1 | -10000 | 0 | 1 |
| mol:PI-3-4-5-P3 | 0.038 | 0.061 | -10000 | 0 | -10000 | 0 | 0 |
| ARAP3/RAP1A/GTP | 0.021 | 0.028 | 0.3 | 1 | -10000 | 0 | 1 |
| VAV1 | -0.12 | 0.26 | -10000 | 0 | -0.59 | 122 | 122 |
| mol:PI-3-4-P2 | 0.019 | 0.04 | -10000 | 0 | -0.43 | 4 | 4 |
| RAS family/GTP/PI3K Class I | 0.08 | 0.066 | 0.34 | 1 | -10000 | 0 | 1 |
| PLEKHA1 | 0.013 | 0.034 | -10000 | 0 | -0.36 | 4 | 4 |
| Rac1/GDP | 0.03 | 0.076 | 0.24 | 1 | -0.38 | 4 | 5 |
| LAT | -0.14 | 0.28 | -10000 | 0 | -0.59 | 141 | 141 |
| Rac1/GTP | 0.016 | 0.074 | -10000 | 0 | -0.4 | 1 | 1 |
| ITK | -0.056 | 0.15 | 0.28 | 25 | -10000 | 0 | 25 |
| Src family/SYK family/BLNK-LAT/BTK-ITK/PLC-gamma | -0.046 | 0.18 | 0.3 | 49 | -0.38 | 38 | 87 |
| LCK | 0.002 | 0.13 | -10000 | 0 | -0.59 | 22 | 22 |
| BTK | -0.017 | 0.15 | 0.29 | 11 | -10000 | 0 | 11 |
Figure S69. Get High-res Image This plot shows pathway concept perturbations across all samples against a permutation model. The concepts along the x-axis are sorted by lowest to highest mean activity for the real patient samples. Mean inferred activities are plotted along the y-axis as a colored band showing the average level and one standard deviation range. Real samples are shown in red and permuted samples in black.
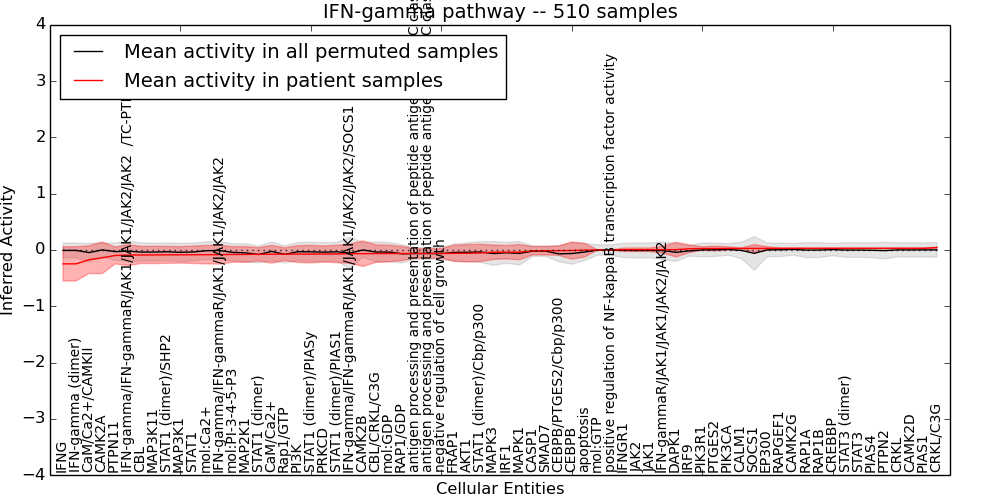
Table S69. Get Full Table This table displays mean, standard deviation, and perturbation statistics for Inferred Pathway Levels (IPLs). A mean perturbation of -9999 implies that the IPLs across all the real samples did not differ enough from the IPLs generated by a background model of permuted samples (> 1 Std.Dev from the permuted sample IPLs).
| Entity | Mean | Std.Dev | Mean.of.Up.Perturbations | Number.of.Up.Perturbations | Mean.of.Down.Perturbations | Number.of.Down.Perturbations | Number.of.Total.Perturbations |
|---|---|---|---|---|---|---|---|
| IFN-gamma/IFN-gammaR/JAK1/JAK1/JAK2/JAK2 | -0.083 | 0.17 | -10000 | 0 | -10000 | 0 | 0 |
| positive regulation of NF-kappaB transcription factor activity | 0 | 0.001 | -10000 | 0 | -10000 | 0 | 0 |
| CRKL | 0.03 | 0.004 | -10000 | 0 | -10000 | 0 | 0 |
| STAT1 (dimer)/Cbp/p300 | -0.052 | 0.15 | -10000 | 0 | -0.78 | 1 | 1 |
| IFN-gammaR/JAK1/JAK1/JAK2/JAK2 | 0.006 | 0.062 | -10000 | 0 | -10000 | 0 | 0 |
| antigen processing and presentation of peptide antigen via MHC class I | -0.061 | 0.086 | -10000 | 0 | -0.34 | 1 | 1 |
| CaM/Ca2+ | -0.075 | 0.16 | -10000 | 0 | -10000 | 0 | 0 |
| RAP1A | 0.029 | 0.005 | -10000 | 0 | -10000 | 0 | 0 |
| STAT1 (dimer)/SHP2 | -0.086 | 0.15 | -10000 | 0 | -0.65 | 1 | 1 |
| AKT1 | -0.058 | 0.16 | 0.4 | 8 | -10000 | 0 | 8 |
| MAP2K1 | -0.079 | 0.14 | 0.31 | 4 | -10000 | 0 | 4 |
| MAP3K11 | -0.088 | 0.15 | 0.31 | 7 | -0.58 | 1 | 8 |
| IFNGR1 | 0.004 | 0.031 | -10000 | 0 | -10000 | 0 | 0 |
| mol:GTP | 0 | 0 | -10000 | 0 | -10000 | 0 | 0 |
| CaM/Ca2+/CAMKII | -0.17 | 0.25 | -10000 | 0 | -0.53 | 139 | 139 |
| Rap1/GTP | -0.074 | 0.11 | -10000 | 0 | -10000 | 0 | 0 |
| CRKL/C3G | 0.043 | 0.01 | -10000 | 0 | -10000 | 0 | 0 |
| IFN-gamma/IFN-gammaR/JAK1/JAK1/JAK2/JAK2 /TC-PTP | -0.089 | 0.19 | -10000 | 0 | -10000 | 0 | 0 |
| CEBPB | -0.009 | 0.15 | 0.45 | 15 | -10000 | 0 | 15 |
| STAT3 | 0.03 | 0.005 | -10000 | 0 | -10000 | 0 | 0 |
| IFN-gamma/IFN-gammaR/JAK1/JAK1/JAK2/JAK2/SOCS1 | -0.065 | 0.17 | -10000 | 0 | -0.64 | 1 | 1 |
| STAT1 | -0.085 | 0.16 | 0.31 | 11 | -0.66 | 1 | 12 |
| CALM1 | 0.028 | 0.008 | -10000 | 0 | -10000 | 0 | 0 |
| IFN-gamma (dimer) | -0.25 | 0.3 | -10000 | 0 | -0.58 | 230 | 230 |
| PIK3CA | 0.027 | 0.03 | -10000 | 0 | -0.64 | 1 | 1 |
| STAT1 (dimer)/PIAS1 | -0.07 | 0.16 | 0.31 | 4 | -0.62 | 1 | 5 |
| CEBPB/PTGES2/Cbp/p300 | -0.011 | 0.084 | -10000 | 0 | -0.4 | 1 | 1 |
| mol:Ca2+ | -0.083 | 0.16 | -10000 | 0 | -10000 | 0 | 0 |
| MAPK3 | -0.039 | 0.13 | 0.42 | 3 | -0.62 | 1 | 4 |
| STAT1 (dimer) | -0.077 | 0.12 | -10000 | 0 | -0.49 | 1 | 1 |
| MAPK1 | -0.039 | 0.14 | 0.45 | 4 | -0.59 | 2 | 6 |
| JAK2 | 0.005 | 0.031 | -10000 | 0 | -10000 | 0 | 0 |
| PIK3R1 | 0.026 | 0.031 | -10000 | 0 | -0.64 | 1 | 1 |
| JAK1 | 0.005 | 0.032 | -10000 | 0 | -10000 | 0 | 0 |
| CAMK2D | 0.03 | 0.004 | -10000 | 0 | -10000 | 0 | 0 |
| DAPK1 | 0.006 | 0.13 | 0.43 | 14 | -0.61 | 3 | 17 |
| SMAD7 | -0.013 | 0.075 | 0.23 | 18 | -10000 | 0 | 18 |
| CBL/CRKL/C3G | -0.063 | 0.16 | -10000 | 0 | -10000 | 0 | 0 |
| PI3K | -0.073 | 0.15 | -10000 | 0 | -10000 | 0 | 0 |
| IFNG | -0.25 | 0.3 | -10000 | 0 | -0.58 | 230 | 230 |
| apoptosis | -0.002 | 0.12 | 0.41 | 13 | -0.43 | 7 | 20 |
| CAMK2G | 0.029 | 0.006 | -10000 | 0 | -10000 | 0 | 0 |
| STAT3 (dimer) | 0.029 | 0.005 | -10000 | 0 | -10000 | 0 | 0 |
| CAMK2A | -0.14 | 0.28 | -10000 | 0 | -0.63 | 124 | 124 |
| CAMK2B | -0.065 | 0.23 | -10000 | 0 | -0.63 | 71 | 71 |
| FRAP1 | -0.059 | 0.14 | 0.36 | 11 | -10000 | 0 | 11 |
| PRKCD | -0.071 | 0.14 | 0.37 | 6 | -10000 | 0 | 6 |
| RAP1B | 0.029 | 0.005 | -10000 | 0 | -10000 | 0 | 0 |
| negative regulation of cell growth | -0.061 | 0.086 | -10000 | 0 | -0.34 | 1 | 1 |
| PTPN2 | 0.03 | 0.005 | -10000 | 0 | -10000 | 0 | 0 |
| EP300 | 0.029 | 0.03 | -10000 | 0 | -0.63 | 1 | 1 |
| IRF1 | -0.039 | 0.12 | 0.42 | 5 | -0.74 | 1 | 6 |
| STAT1 (dimer)/PIASy | -0.073 | 0.16 | 0.35 | 3 | -0.62 | 1 | 4 |
| SOCS1 | 0.028 | 0.07 | -10000 | 0 | -0.98 | 1 | 1 |
| mol:GDP | -0.063 | 0.15 | -10000 | 0 | -10000 | 0 | 0 |
| CASP1 | -0.013 | 0.074 | 0.23 | 18 | -10000 | 0 | 18 |
| PTGES2 | 0.026 | 0.042 | -10000 | 0 | -0.64 | 2 | 2 |
| IRF9 | 0.022 | 0.071 | 0.25 | 18 | -10000 | 0 | 18 |
| mol:PI-3-4-5-P3 | -0.079 | 0.14 | -10000 | 0 | -10000 | 0 | 0 |
| RAP1/GDP | -0.062 | 0.12 | -10000 | 0 | -10000 | 0 | 0 |
| CBL | -0.088 | 0.15 | 0.3 | 7 | -10000 | 0 | 7 |
| MAP3K1 | -0.086 | 0.15 | 0.33 | 5 | -10000 | 0 | 5 |
| PIAS1 | 0.03 | 0.003 | -10000 | 0 | -10000 | 0 | 0 |
| PIAS4 | 0.03 | 0.003 | -10000 | 0 | -10000 | 0 | 0 |
| antigen processing and presentation of peptide antigen via MHC class II | -0.061 | 0.086 | -10000 | 0 | -0.34 | 1 | 1 |
| PTPN11 | -0.098 | 0.15 | -10000 | 0 | -10000 | 0 | 0 |
| CREBBP | 0.029 | 0.007 | -10000 | 0 | -10000 | 0 | 0 |
| RAPGEF1 | 0.029 | 0.006 | -10000 | 0 | -10000 | 0 | 0 |
Figure S70. Get High-res Image This plot shows pathway concept perturbations across all samples against a permutation model. The concepts along the x-axis are sorted by lowest to highest mean activity for the real patient samples. Mean inferred activities are plotted along the y-axis as a colored band showing the average level and one standard deviation range. Real samples are shown in red and permuted samples in black.
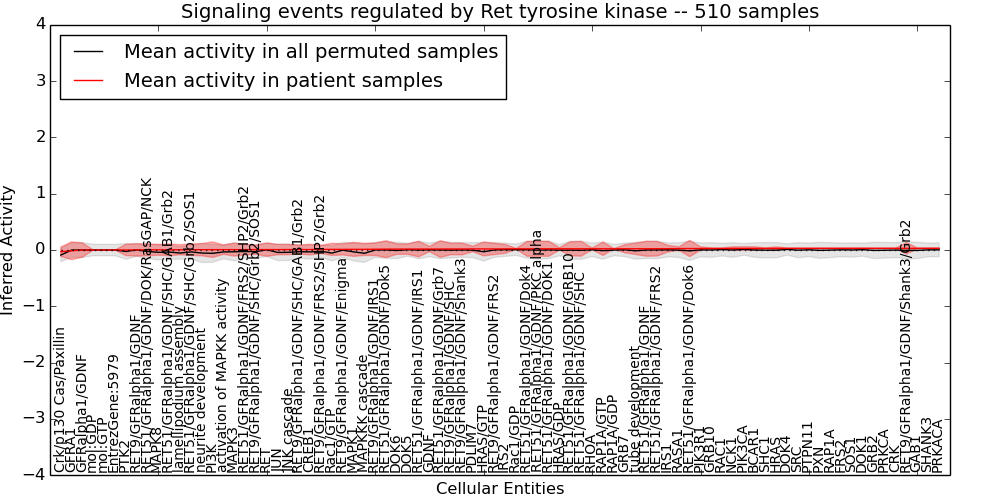
Table S70. Get Full Table This table displays mean, standard deviation, and perturbation statistics for Inferred Pathway Levels (IPLs). A mean perturbation of -9999 implies that the IPLs across all the real samples did not differ enough from the IPLs generated by a background model of permuted samples (> 1 Std.Dev from the permuted sample IPLs).
| Entity | Mean | Std.Dev | Mean.of.Up.Perturbations | Number.of.Up.Perturbations | Mean.of.Down.Perturbations | Number.of.Down.Perturbations | Number.of.Total.Perturbations |
|---|---|---|---|---|---|---|---|
| PTK2 | 0 | 0.1 | -10000 | 0 | -0.54 | 15 | 15 |
| Crk/p130 Cas/Paxillin | -0.029 | 0.083 | -10000 | 0 | -0.41 | 6 | 6 |
| JUN | 0.007 | 0.093 | -10000 | 0 | -0.47 | 8 | 8 |
| HRAS | 0.029 | 0.027 | -10000 | 0 | -0.59 | 1 | 1 |
| RET51/GFRalpha1/GDNF/GRB10 | 0.021 | 0.13 | -10000 | 0 | -0.39 | 38 | 38 |
| RAP1A | 0.029 | 0.005 | -10000 | 0 | -10000 | 0 | 0 |
| FRS2 | 0.029 | 0.005 | -10000 | 0 | -10000 | 0 | 0 |
| RAP1A/GDP | 0.022 | 0.004 | -10000 | 0 | -10000 | 0 | 0 |
| RET51/GFRalpha1/GDNF/DOK1 | 0.021 | 0.13 | -10000 | 0 | -0.39 | 44 | 44 |
| EntrezGene:5979 | 0 | 0 | -10000 | 0 | -10000 | 0 | 0 |
| PTPN11 | 0.029 | 0.006 | -10000 | 0 | -10000 | 0 | 0 |
| mol:GTP | 0 | 0 | -10000 | 0 | -10000 | 0 | 0 |
| CRK | 0.029 | 0.005 | -10000 | 0 | -10000 | 0 | 0 |
| RET9/GFRalpha1/GDNF/Enigma | 0.011 | 0.098 | -10000 | 0 | -0.36 | 27 | 27 |
| RHOA | 0.021 | 0.014 | -10000 | 0 | -10000 | 0 | 0 |
| RAP1A/GTP | 0.022 | 0.12 | -10000 | 0 | -0.36 | 32 | 32 |
| GRB7 | 0.022 | 0.072 | -10000 | 0 | -0.64 | 6 | 6 |
| RET51/GFRalpha1/GDNF | 0.022 | 0.13 | -10000 | 0 | -0.39 | 44 | 44 |
| MAPKKK cascade | 0.012 | 0.11 | -10000 | 0 | -0.52 | 4 | 4 |
| BCAR1 | 0.028 | 0.03 | -10000 | 0 | -0.64 | 1 | 1 |
| RET9/GFRalpha1/GDNF/IRS1 | 0.014 | 0.11 | -10000 | 0 | -0.38 | 35 | 35 |
| lamellipodium assembly | 0.004 | 0.09 | -10000 | 0 | -0.33 | 11 | 11 |
| RET51/GFRalpha1/GDNF/SHC | 0.021 | 0.13 | -10000 | 0 | -0.39 | 39 | 39 |
| PIK3CA | 0.027 | 0.03 | -10000 | 0 | -0.64 | 1 | 1 |
| RET9/GFRalpha1/GDNF/SHC | 0.018 | 0.1 | -10000 | 0 | -0.37 | 30 | 30 |
| RET9/GFRalpha1/GDNF/Shank3 | 0.018 | 0.1 | -10000 | 0 | -0.37 | 32 | 32 |
| MAPK3 | 0.006 | 0.11 | 0.52 | 1 | -0.59 | 3 | 4 |
| DOK1 | 0.029 | 0.005 | -10000 | 0 | -10000 | 0 | 0 |
| DOK6 | 0.015 | 0.093 | -10000 | 0 | -0.61 | 11 | 11 |
| PXN | 0.029 | 0.006 | -10000 | 0 | -10000 | 0 | 0 |
| neurite development | 0.006 | 0.11 | -10000 | 0 | -0.48 | 6 | 6 |
| DOK5 | 0.016 | 0.092 | -10000 | 0 | -0.63 | 10 | 10 |
| GFRA1 | -0.014 | 0.16 | -10000 | 0 | -0.58 | 36 | 36 |
| MAPK8 | 0.003 | 0.096 | -10000 | 0 | -0.45 | 11 | 11 |
| HRAS/GTP | 0.019 | 0.12 | -10000 | 0 | -0.48 | 8 | 8 |
| tube development | 0.022 | 0.1 | -10000 | 0 | -0.35 | 32 | 32 |
| MAPK1 | 0.011 | 0.12 | 0.43 | 6 | -0.59 | 3 | 9 |
| RET9/GFRalpha1/GDNF/FRS2/SHP2/Grb2 | 0.01 | 0.072 | -10000 | 0 | -0.27 | 26 | 26 |
| Rac1/GDP | 0.02 | 0.007 | -10000 | 0 | -10000 | 0 | 0 |
| SRC | 0.029 | 0.006 | -10000 | 0 | -10000 | 0 | 0 |
| PDLIM7 | 0.019 | 0.048 | -10000 | 0 | -0.59 | 3 | 3 |
| RET51/GFRalpha1/GDNF/Dok6 | 0.026 | 0.14 | -10000 | 0 | -0.62 | 9 | 9 |
| SHC1 | 0.029 | 0.007 | -10000 | 0 | -10000 | 0 | 0 |
| RET51/GFRalpha1/GDNF/Dok4 | 0.021 | 0.13 | -10000 | 0 | -0.39 | 43 | 43 |
| RET51/GFRalpha1/GDNF/Dok5 | 0.015 | 0.15 | -10000 | 0 | -0.43 | 44 | 44 |
| PRKCA | 0.029 | 0.005 | -10000 | 0 | -10000 | 0 | 0 |
| HRAS/GDP | 0.021 | 0.02 | -10000 | 0 | -0.43 | 1 | 1 |
| CREB1 | 0.008 | 0.095 | -10000 | 0 | -0.35 | 23 | 23 |
| PIK3R1 | 0.026 | 0.031 | -10000 | 0 | -0.64 | 1 | 1 |
| RET9/GFRalpha1/GDNF/SHC/GAB1/Grb2 | 0.008 | 0.08 | -10000 | 0 | -0.31 | 22 | 22 |
| RET51/GFRalpha1/GDNF/Grb7 | 0.017 | 0.15 | -10000 | 0 | -0.42 | 45 | 45 |
| mol:GDP | 0 | 0 | -10000 | 0 | -10000 | 0 | 0 |
| RET | 0.007 | 0.12 | -10000 | 0 | -0.61 | 18 | 18 |
| DOK4 | 0.029 | 0.006 | -10000 | 0 | -10000 | 0 | 0 |
| JNK cascade | 0.007 | 0.091 | -10000 | 0 | -0.46 | 8 | 8 |
| RET9/GFRalpha1/GDNF/FRS2 | 0.019 | 0.1 | -10000 | 0 | -0.37 | 28 | 28 |
| SHANK3 | 0.03 | 0.004 | -10000 | 0 | -10000 | 0 | 0 |
| RASA1 | 0.025 | 0.031 | -10000 | 0 | -0.64 | 1 | 1 |
| NCK1 | 0.027 | 0.03 | -10000 | 0 | -0.64 | 1 | 1 |
| RET9/GFRalpha1/GDNF/SHC/Grb2/SOS1 | 0.007 | 0.083 | -10000 | 0 | -0.31 | 28 | 28 |
| RET51/GFRalpha1/GDNF/FRS2/SHP2/Grb2 | 0.007 | 0.094 | -10000 | 0 | -0.3 | 32 | 32 |
| RET51/GFRalpha1/GDNF/DOK/RasGAP/NCK | 0.003 | 0.11 | -10000 | 0 | -0.42 | 16 | 16 |
| RET51/GFRalpha1/GDNF/SHC/Grb2/SOS1 | 0.005 | 0.1 | -10000 | 0 | -0.45 | 11 | 11 |
| PI3K | 0.006 | 0.14 | -10000 | 0 | -0.44 | 30 | 30 |
| SOS1 | 0.029 | 0.005 | -10000 | 0 | -10000 | 0 | 0 |
| RET9/GFRalpha1/GDNF/Shank3/Grb2 | 0.029 | 0.1 | -10000 | 0 | -0.35 | 32 | 32 |
| GRB10 | 0.027 | 0.009 | -10000 | 0 | -10000 | 0 | 0 |
| activation of MAPKK activity | 0.006 | 0.083 | -10000 | 0 | -0.33 | 10 | 10 |
| RET51/GFRalpha1/GDNF/FRS2 | 0.023 | 0.13 | -10000 | 0 | -0.39 | 40 | 40 |
| GAB1 | 0.03 | 0.004 | -10000 | 0 | -10000 | 0 | 0 |
| IRS1 | 0.023 | 0.059 | -10000 | 0 | -0.64 | 4 | 4 |
| IRS2 | 0.02 | 0.079 | -10000 | 0 | -0.6 | 8 | 8 |
| RET51/GFRalpha1/GDNF/SHC/GAB1/Grb2 | 0.003 | 0.1 | -10000 | 0 | -0.42 | 15 | 15 |
| RET51/GFRalpha1/GDNF/PKC alpha | 0.021 | 0.13 | -10000 | 0 | -0.39 | 43 | 43 |
| GRB2 | 0.029 | 0.005 | -10000 | 0 | -10000 | 0 | 0 |
| PRKACA | 0.03 | 0.002 | -10000 | 0 | -10000 | 0 | 0 |
| GDNF | 0.017 | 0.047 | -10000 | 0 | -0.59 | 3 | 3 |
| RAC1 | 0.027 | 0.009 | -10000 | 0 | -10000 | 0 | 0 |
| RET51/GFRalpha1/GDNF/IRS1 | 0.017 | 0.14 | -10000 | 0 | -0.39 | 47 | 47 |
| Rac1/GTP | 0.011 | 0.11 | -10000 | 0 | -0.4 | 10 | 10 |
| RET9/GFRalpha1/GDNF | 0.001 | 0.11 | -10000 | 0 | -0.4 | 32 | 32 |
| GFRalpha1/GDNF | 0 | 0.13 | -10000 | 0 | -0.47 | 32 | 32 |
Figure S71. Get High-res Image This plot shows pathway concept perturbations across all samples against a permutation model. The concepts along the x-axis are sorted by lowest to highest mean activity for the real patient samples. Mean inferred activities are plotted along the y-axis as a colored band showing the average level and one standard deviation range. Real samples are shown in red and permuted samples in black.
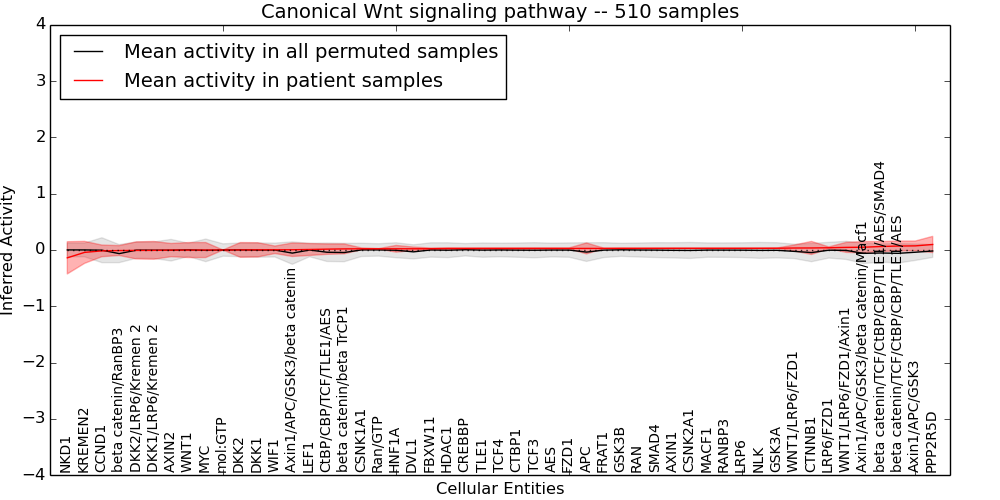
Table S71. Get Full Table This table displays mean, standard deviation, and perturbation statistics for Inferred Pathway Levels (IPLs). A mean perturbation of -9999 implies that the IPLs across all the real samples did not differ enough from the IPLs generated by a background model of permuted samples (> 1 Std.Dev from the permuted sample IPLs).
| Entity | Mean | Std.Dev | Mean.of.Up.Perturbations | Number.of.Up.Perturbations | Mean.of.Down.Perturbations | Number.of.Down.Perturbations | Number.of.Total.Perturbations |
|---|---|---|---|---|---|---|---|
| HDAC1 | 0.026 | 0.013 | -10000 | 0 | -10000 | 0 | 0 |
| AES | 0.028 | 0.01 | -10000 | 0 | -10000 | 0 | 0 |
| FBXW11 | 0.023 | 0.013 | -10000 | 0 | -10000 | 0 | 0 |
| mol:GTP | 0 | 0.001 | -10000 | 0 | -10000 | 0 | 0 |
| LRP6/FZD1 | 0.04 | 0.015 | -10000 | 0 | -10000 | 0 | 0 |
| SMAD4 | 0.029 | 0.005 | -10000 | 0 | -10000 | 0 | 0 |
| DKK2 | 0.001 | 0.13 | -10000 | 0 | -0.6 | 23 | 23 |
| TLE1 | 0.027 | 0.012 | -10000 | 0 | -10000 | 0 | 0 |
| MACF1 | 0.03 | 0.006 | -10000 | 0 | -10000 | 0 | 0 |
| CTNNB1 | 0.036 | 0.12 | 0.39 | 11 | -0.41 | 1 | 12 |
| WIF1 | 0.004 | 0.067 | -10000 | 0 | -0.63 | 5 | 5 |
| beta catenin/RanBP3 | -0.01 | 0.088 | 0.32 | 11 | -10000 | 0 | 11 |
| KREMEN2 | -0.042 | 0.2 | -10000 | 0 | -0.59 | 58 | 58 |
| DKK1 | 0.003 | 0.13 | -10000 | 0 | -0.61 | 21 | 21 |
| beta catenin/beta TrCP1 | 0.02 | 0.088 | 0.38 | 1 | -10000 | 0 | 1 |
| FZD1 | 0.028 | 0.01 | -10000 | 0 | -10000 | 0 | 0 |
| AXIN2 | -0.002 | 0.12 | 0.54 | 8 | -1.4 | 2 | 10 |
| AXIN1 | 0.03 | 0.007 | -10000 | 0 | -10000 | 0 | 0 |
| RAN | 0.029 | 0.006 | -10000 | 0 | -10000 | 0 | 0 |
| Axin1/APC/GSK3/beta catenin | 0.004 | 0.12 | -10000 | 0 | -0.53 | 16 | 16 |
| beta catenin/TCF/CtBP/CBP/TLE1/AES/SMAD4 | 0.062 | 0.088 | 0.34 | 1 | -0.57 | 2 | 3 |
| Axin1/APC/GSK3 | 0.074 | 0.086 | 0.31 | 20 | -10000 | 0 | 20 |
| Axin1/APC/GSK3/beta catenin/Macf1 | 0.049 | 0.1 | 0.4 | 5 | -10000 | 0 | 5 |
| HNF1A | 0.022 | 0.06 | -10000 | 0 | -0.64 | 4 | 4 |
| CTBP1 | 0.027 | 0.012 | -10000 | 0 | -10000 | 0 | 0 |
| MYC | -0.001 | 0.13 | 0.58 | 13 | -0.47 | 16 | 29 |
| RANBP3 | 0.03 | 0.003 | -10000 | 0 | -10000 | 0 | 0 |
| DKK2/LRP6/Kremen 2 | -0.007 | 0.15 | -10000 | 0 | -0.37 | 72 | 72 |
| NKD1 | -0.14 | 0.29 | -10000 | 0 | -0.63 | 130 | 130 |
| TCF4 | 0.027 | 0.012 | -10000 | 0 | -10000 | 0 | 0 |
| TCF3 | 0.027 | 0.011 | -10000 | 0 | -10000 | 0 | 0 |
| WNT1/LRP6/FZD1/Axin1 | 0.046 | 0.089 | -10000 | 0 | -0.33 | 20 | 20 |
| Ran/GTP | 0.021 | 0.004 | -10000 | 0 | -10000 | 0 | 0 |
| CtBP/CBP/TCF/TLE1/AES | 0.015 | 0.092 | 0.37 | 13 | -0.52 | 2 | 15 |
| LEF1 | 0.009 | 0.11 | -10000 | 0 | -0.59 | 15 | 15 |
| DVL1 | 0.022 | 0.031 | -10000 | 0 | -0.3 | 2 | 2 |
| CSNK2A1 | 0.03 | 0.006 | -10000 | 0 | -10000 | 0 | 0 |
| beta catenin/TCF/CtBP/CBP/TLE1/AES | 0.07 | 0.089 | 0.35 | 1 | -0.6 | 2 | 3 |
| DKK1/LRP6/Kremen 2 | -0.006 | 0.16 | -10000 | 0 | -0.4 | 66 | 66 |
| LRP6 | 0.03 | 0.006 | -10000 | 0 | -10000 | 0 | 0 |
| CSNK1A1 | 0.021 | 0.016 | -10000 | 0 | -10000 | 0 | 0 |
| NLK | 0.03 | 0.005 | -10000 | 0 | -10000 | 0 | 0 |
| CCND1 | -0.015 | 0.1 | 0.7 | 1 | -0.48 | 17 | 18 |
| WNT1 | -0.001 | 0.13 | -10000 | 0 | -0.59 | 25 | 25 |
| GSK3A | 0.031 | 0.005 | -10000 | 0 | -10000 | 0 | 0 |
| GSK3B | 0.028 | 0.008 | -10000 | 0 | -10000 | 0 | 0 |
| FRAT1 | 0.028 | 0.006 | -10000 | 0 | -10000 | 0 | 0 |
| PPP2R5D | 0.098 | 0.14 | 0.34 | 121 | -0.34 | 8 | 129 |
| APC | 0.028 | 0.097 | 0.38 | 9 | -10000 | 0 | 9 |
| WNT1/LRP6/FZD1 | 0.035 | 0.053 | 0.25 | 3 | -10000 | 0 | 3 |
| CREBBP | 0.026 | 0.012 | -10000 | 0 | -10000 | 0 | 0 |
Figure S72. Get High-res Image This plot shows pathway concept perturbations across all samples against a permutation model. The concepts along the x-axis are sorted by lowest to highest mean activity for the real patient samples. Mean inferred activities are plotted along the y-axis as a colored band showing the average level and one standard deviation range. Real samples are shown in red and permuted samples in black.
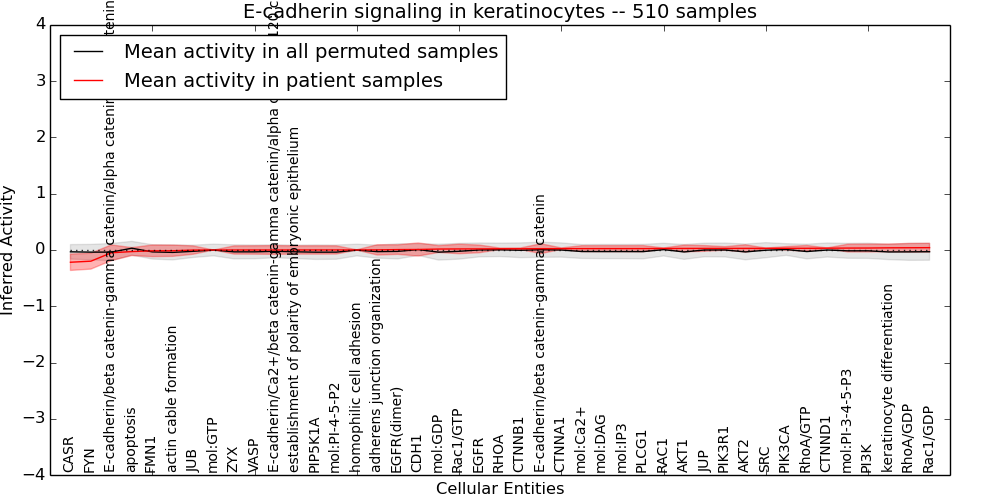
Table S72. Get Full Table This table displays mean, standard deviation, and perturbation statistics for Inferred Pathway Levels (IPLs). A mean perturbation of -9999 implies that the IPLs across all the real samples did not differ enough from the IPLs generated by a background model of permuted samples (> 1 Std.Dev from the permuted sample IPLs).
| Entity | Mean | Std.Dev | Mean.of.Up.Perturbations | Number.of.Up.Perturbations | Mean.of.Down.Perturbations | Number.of.Down.Perturbations | Number.of.Total.Perturbations |
|---|---|---|---|---|---|---|---|
| keratinocyte differentiation | 0.039 | 0.068 | 0.25 | 16 | -0.35 | 2 | 18 |
| adherens junction organization | 0.002 | 0.091 | 0.25 | 5 | -0.38 | 7 | 12 |
| mol:GTP | 0 | 0 | -10000 | 0 | -10000 | 0 | 0 |
| Rac1/GDP | 0.042 | 0.077 | 0.34 | 2 | -0.35 | 1 | 3 |
| FMN1 | -0.015 | 0.1 | -10000 | 0 | -0.37 | 24 | 24 |
| mol:IP3 | 0.025 | 0.053 | -10000 | 0 | -0.34 | 3 | 3 |
| E-cadherin/Ca2+/beta catenin-gamma catenin/alpha catenin/p120 catenin | 0 | 0.078 | -10000 | 0 | -0.31 | 17 | 17 |
| CTNNB1 | 0.022 | 0.014 | -10000 | 0 | -10000 | 0 | 0 |
| AKT1 | 0.027 | 0.06 | 0.26 | 1 | -0.36 | 1 | 2 |
| E-cadherin/beta catenin-gamma catenin/alpha catenin/p120 catenin | -0.049 | 0.14 | -10000 | 0 | -0.55 | 21 | 21 |
| CTNND1 | 0.032 | 0.005 | -10000 | 0 | -10000 | 0 | 0 |
| mol:PI-4-5-P2 | 0.001 | 0.073 | -10000 | 0 | -0.41 | 4 | 4 |
| VASP | 0 | 0.075 | -10000 | 0 | -0.47 | 3 | 3 |
| ZYX | 0 | 0.073 | -10000 | 0 | -0.47 | 3 | 3 |
| JUB | -0.001 | 0.074 | -10000 | 0 | -0.29 | 17 | 17 |
| EGFR(dimer) | 0.007 | 0.085 | -10000 | 0 | -0.46 | 4 | 4 |
| E-cadherin/beta catenin-gamma catenin | 0.023 | 0.087 | -10000 | 0 | -0.4 | 18 | 18 |
| mol:PI-3-4-5-P3 | 0.034 | 0.069 | 0.27 | 2 | -0.34 | 5 | 7 |
| PIK3CA | 0.03 | 0.031 | -10000 | 0 | -0.64 | 1 | 1 |
| PI3K | 0.035 | 0.07 | 0.27 | 2 | -0.34 | 5 | 7 |
| FYN | -0.2 | 0.14 | 0.24 | 3 | -0.39 | 77 | 80 |
| mol:Ca2+ | 0.025 | 0.052 | -10000 | 0 | -0.33 | 3 | 3 |
| JUP | 0.028 | 0.051 | -10000 | 0 | -0.63 | 3 | 3 |
| PIK3R1 | 0.028 | 0.031 | -10000 | 0 | -0.64 | 1 | 1 |
| mol:DAG | 0.025 | 0.053 | -10000 | 0 | -0.34 | 3 | 3 |
| CDH1 | 0.009 | 0.12 | -10000 | 0 | -0.61 | 17 | 17 |
| RhoA/GDP | 0.04 | 0.076 | 0.33 | 3 | -0.35 | 1 | 4 |
| establishment of polarity of embryonic epithelium | 0.001 | 0.073 | -10000 | 0 | -0.46 | 3 | 3 |
| SRC | 0.029 | 0.006 | -10000 | 0 | -10000 | 0 | 0 |
| RAC1 | 0.027 | 0.009 | -10000 | 0 | -10000 | 0 | 0 |
| RHOA | 0.021 | 0.014 | -10000 | 0 | -10000 | 0 | 0 |
| EGFR | 0.02 | 0.068 | -10000 | 0 | -0.6 | 6 | 6 |
| CASR | -0.22 | 0.15 | 0.24 | 2 | -0.31 | 303 | 305 |
| RhoA/GTP | 0.03 | 0.051 | -10000 | 0 | -0.32 | 2 | 2 |
| AKT2 | 0.028 | 0.064 | 0.26 | 2 | -0.38 | 2 | 4 |
| actin cable formation | -0.013 | 0.1 | -10000 | 0 | -0.42 | 12 | 12 |
| apoptosis | -0.028 | 0.071 | 0.33 | 4 | -0.35 | 6 | 10 |
| CTNNA1 | 0.024 | 0.013 | -10000 | 0 | -10000 | 0 | 0 |
| mol:GDP | 0.017 | 0.061 | 0.29 | 1 | -0.35 | 3 | 4 |
| PIP5K1A | 0.001 | 0.074 | -10000 | 0 | -0.42 | 4 | 4 |
| PLCG1 | 0.025 | 0.054 | -10000 | 0 | -0.34 | 3 | 3 |
| Rac1/GTP | 0.019 | 0.085 | -10000 | 0 | -0.42 | 4 | 4 |
| homophilic cell adhesion | 0.001 | 0.003 | -10000 | 0 | -10000 | 0 | 0 |
Figure S73. Get High-res Image This plot shows pathway concept perturbations across all samples against a permutation model. The concepts along the x-axis are sorted by lowest to highest mean activity for the real patient samples. Mean inferred activities are plotted along the y-axis as a colored band showing the average level and one standard deviation range. Real samples are shown in red and permuted samples in black.
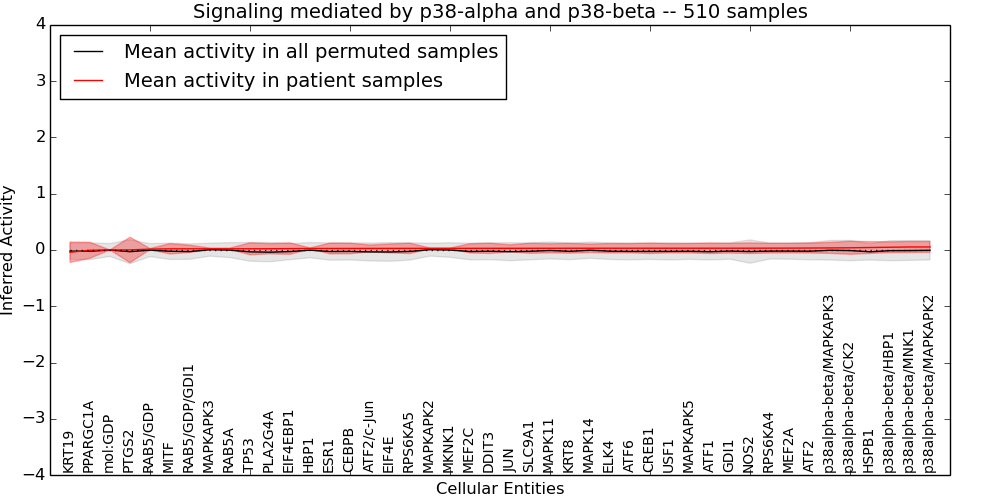
Table S73. Get Full Table This table displays mean, standard deviation, and perturbation statistics for Inferred Pathway Levels (IPLs). A mean perturbation of -9999 implies that the IPLs across all the real samples did not differ enough from the IPLs generated by a background model of permuted samples (> 1 Std.Dev from the permuted sample IPLs).
| Entity | Mean | Std.Dev | Mean.of.Up.Perturbations | Number.of.Up.Perturbations | Mean.of.Down.Perturbations | Number.of.Down.Perturbations | Number.of.Total.Perturbations |
|---|---|---|---|---|---|---|---|
| PTGS2 | 0.002 | 0.23 | -10000 | 0 | -1.1 | 20 | 20 |
| MKNK1 | 0.029 | 0.006 | -10000 | 0 | -10000 | 0 | 0 |
| MAPK14 | 0.031 | 0.075 | -10000 | 0 | -0.45 | 1 | 1 |
| ATF2/c-Jun | 0.028 | 0.061 | -10000 | 0 | -0.43 | 1 | 1 |
| MAPK11 | 0.031 | 0.081 | -10000 | 0 | -0.46 | 3 | 3 |
| MITF | 0.021 | 0.092 | -10000 | 0 | -0.37 | 21 | 21 |
| MAPKAPK5 | 0.032 | 0.085 | -10000 | 0 | -0.35 | 20 | 20 |
| KRT8 | 0.031 | 0.088 | -10000 | 0 | -0.35 | 21 | 21 |
| MAPKAPK3 | 0.021 | 0.014 | -10000 | 0 | -10000 | 0 | 0 |
| MAPKAPK2 | 0.029 | 0.006 | -10000 | 0 | -10000 | 0 | 0 |
| p38alpha-beta/CK2 | 0.039 | 0.12 | -10000 | 0 | -0.45 | 22 | 22 |
| CEBPB | 0.027 | 0.094 | -10000 | 0 | -0.5 | 3 | 3 |
| SLC9A1 | 0.03 | 0.09 | -10000 | 0 | -0.36 | 21 | 21 |
| mol:GDP | 0 | 0 | -10000 | 0 | -10000 | 0 | 0 |
| ATF2 | 0.035 | 0.089 | -10000 | 0 | -0.53 | 3 | 3 |
| p38alpha-beta/MNK1 | 0.054 | 0.098 | -10000 | 0 | -0.57 | 2 | 2 |
| JUN | 0.03 | 0.062 | -10000 | 0 | -0.42 | 1 | 1 |
| PPARGC1A | -0.005 | 0.14 | -10000 | 0 | -0.35 | 66 | 66 |
| USF1 | 0.032 | 0.082 | -10000 | 0 | -0.34 | 19 | 19 |
| RAB5/GDP/GDI1 | 0.021 | 0.064 | -10000 | 0 | -0.39 | 2 | 2 |
| NOS2 | 0.032 | 0.095 | -10000 | 0 | -0.51 | 2 | 2 |
| DDIT3 | 0.03 | 0.091 | -10000 | 0 | -0.36 | 22 | 22 |
| RAB5A | 0.021 | 0.014 | -10000 | 0 | -10000 | 0 | 0 |
| HSPB1 | 0.044 | 0.1 | 0.3 | 41 | -0.44 | 4 | 45 |
| p38alpha-beta/HBP1 | 0.049 | 0.096 | -10000 | 0 | -0.58 | 2 | 2 |
| CREB1 | 0.032 | 0.094 | -10000 | 0 | -0.39 | 20 | 20 |
| RAB5/GDP | 0.016 | 0.01 | -10000 | 0 | -10000 | 0 | 0 |
| EIF4E | 0.028 | 0.079 | -10000 | 0 | -0.51 | 2 | 2 |
| RPS6KA4 | 0.033 | 0.087 | -10000 | 0 | -0.36 | 20 | 20 |
| PLA2G4A | 0.022 | 0.09 | -10000 | 0 | -0.58 | 3 | 3 |
| GDI1 | 0.032 | 0.087 | -10000 | 0 | -0.35 | 21 | 21 |
| TP53 | 0.022 | 0.11 | -10000 | 0 | -0.45 | 21 | 21 |
| RPS6KA5 | 0.029 | 0.092 | -10000 | 0 | -0.54 | 5 | 5 |
| ESR1 | 0.027 | 0.096 | -10000 | 0 | -0.56 | 4 | 4 |
| HBP1 | 0.027 | 0.009 | -10000 | 0 | -10000 | 0 | 0 |
| MEF2C | 0.029 | 0.082 | -10000 | 0 | -0.36 | 17 | 17 |
| MEF2A | 0.033 | 0.086 | -10000 | 0 | -0.36 | 19 | 19 |
| EIF4EBP1 | 0.025 | 0.1 | -10000 | 0 | -0.41 | 20 | 20 |
| KRT19 | -0.04 | 0.18 | -10000 | 0 | -0.37 | 96 | 96 |
| ELK4 | 0.031 | 0.084 | -10000 | 0 | -0.34 | 20 | 20 |
| ATF6 | 0.031 | 0.082 | -10000 | 0 | -0.34 | 20 | 20 |
| ATF1 | 0.032 | 0.094 | -10000 | 0 | -0.39 | 20 | 20 |
| p38alpha-beta/MAPKAPK2 | 0.054 | 0.097 | -10000 | 0 | -0.5 | 2 | 2 |
| p38alpha-beta/MAPKAPK3 | 0.037 | 0.098 | -10000 | 0 | -0.58 | 2 | 2 |
Figure S74. Get High-res Image This plot shows pathway concept perturbations across all samples against a permutation model. The concepts along the x-axis are sorted by lowest to highest mean activity for the real patient samples. Mean inferred activities are plotted along the y-axis as a colored band showing the average level and one standard deviation range. Real samples are shown in red and permuted samples in black.
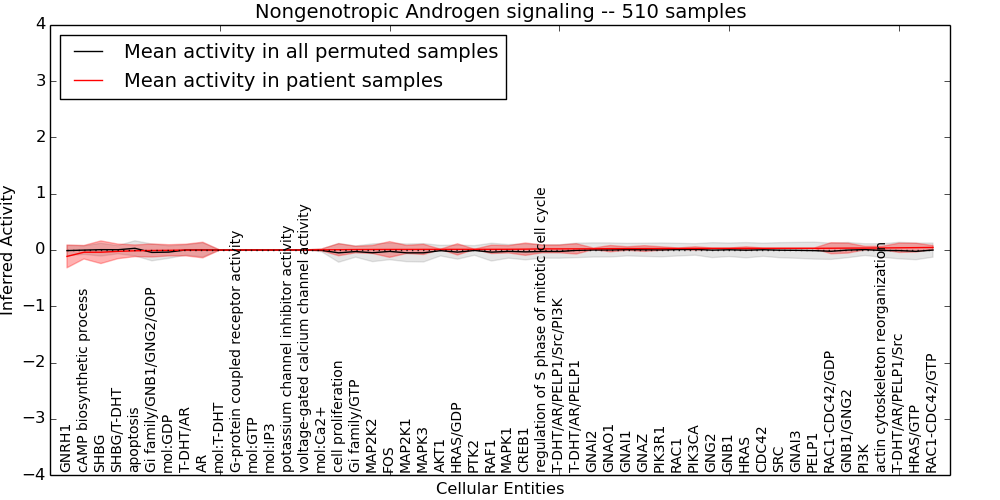
Table S74. Get Full Table This table displays mean, standard deviation, and perturbation statistics for Inferred Pathway Levels (IPLs). A mean perturbation of -9999 implies that the IPLs across all the real samples did not differ enough from the IPLs generated by a background model of permuted samples (> 1 Std.Dev from the permuted sample IPLs).
| Entity | Mean | Std.Dev | Mean.of.Up.Perturbations | Number.of.Up.Perturbations | Mean.of.Down.Perturbations | Number.of.Down.Perturbations | Number.of.Total.Perturbations |
|---|---|---|---|---|---|---|---|
| PTK2 | 0.011 | 0.003 | -10000 | 0 | -10000 | 0 | 0 |
| GNB1/GNG2 | 0.034 | 0.088 | -10000 | 0 | -0.36 | 23 | 23 |
| regulation of S phase of mitotic cell cycle | 0.02 | 0.069 | -10000 | 0 | -0.3 | 17 | 17 |
| GNAO1 | 0.024 | 0.056 | -10000 | 0 | -0.6 | 4 | 4 |
| HRAS | 0.029 | 0.027 | -10000 | 0 | -0.59 | 1 | 1 |
| SHBG/T-DHT | -0.024 | 0.13 | -10000 | 0 | -0.4 | 53 | 53 |
| PELP1 | 0.029 | 0.006 | -10000 | 0 | -10000 | 0 | 0 |
| AKT1 | 0.011 | 0.003 | -10000 | 0 | -10000 | 0 | 0 |
| MAP2K1 | 0.01 | 0.072 | 0.35 | 1 | -0.4 | 3 | 4 |
| T-DHT/AR | -0.001 | 0.1 | -10000 | 0 | -0.46 | 24 | 24 |
| G-protein coupled receptor activity | 0 | 0 | -10000 | 0 | -10000 | 0 | 0 |
| mol:GTP | 0 | 0.002 | -10000 | 0 | -0.009 | 13 | 13 |
| GNAI2 | 0.021 | 0.014 | -10000 | 0 | -10000 | 0 | 0 |
| GNAI3 | 0.029 | 0.005 | -10000 | 0 | -10000 | 0 | 0 |
| GNAI1 | 0.026 | 0.031 | -10000 | 0 | -0.64 | 1 | 1 |
| mol:GDP | -0.006 | 0.1 | -10000 | 0 | -0.46 | 22 | 22 |
| cell proliferation | 0.005 | 0.11 | 0.31 | 4 | -0.56 | 6 | 10 |
| PIK3CA | 0.027 | 0.03 | -10000 | 0 | -0.64 | 1 | 1 |
| FOS | 0.01 | 0.14 | 0.27 | 1 | -0.68 | 16 | 17 |
| mol:Ca2+ | 0.003 | 0.016 | -10000 | 0 | -0.08 | 10 | 10 |
| MAPK3 | 0.011 | 0.09 | 0.31 | 5 | -0.48 | 5 | 10 |
| MAPK1 | 0.013 | 0.064 | -10000 | 0 | -0.41 | 5 | 5 |
| PIK3R1 | 0.026 | 0.031 | -10000 | 0 | -0.64 | 1 | 1 |
| mol:IP3 | 0 | 0.001 | -10000 | 0 | -0.005 | 12 | 12 |
| cAMP biosynthetic process | -0.04 | 0.12 | 0.24 | 2 | -0.39 | 52 | 54 |
| GNG2 | 0.028 | 0.008 | -10000 | 0 | -10000 | 0 | 0 |
| potassium channel inhibitor activity | 0 | 0.001 | -10000 | 0 | -0.005 | 12 | 12 |
| HRAS/GTP | 0.042 | 0.078 | -10000 | 0 | -0.34 | 14 | 14 |
| actin cytoskeleton reorganization | 0.036 | 0.03 | -10000 | 0 | -0.32 | 2 | 2 |
| SRC | 0.029 | 0.006 | -10000 | 0 | -10000 | 0 | 0 |
| voltage-gated calcium channel activity | 0 | 0.001 | -10000 | 0 | -0.005 | 12 | 12 |
| PI3K | 0.034 | 0.031 | -10000 | 0 | -0.41 | 2 | 2 |
| apoptosis | -0.014 | 0.1 | 0.5 | 12 | -0.26 | 3 | 15 |
| T-DHT/AR/PELP1 | 0.02 | 0.091 | -10000 | 0 | -0.4 | 22 | 22 |
| HRAS/GDP | 0.011 | 0.1 | -10000 | 0 | -0.44 | 22 | 22 |
| CREB1 | 0.015 | 0.11 | 0.27 | 2 | -0.54 | 12 | 14 |
| RAC1-CDC42/GTP | 0.045 | 0.034 | -10000 | 0 | -0.32 | 2 | 2 |
| AR | -0.001 | 0.14 | -10000 | 0 | -0.62 | 24 | 24 |
| GNB1 | 0.029 | 0.006 | -10000 | 0 | -10000 | 0 | 0 |
| RAF1 | 0.012 | 0.074 | 0.35 | 1 | -0.39 | 3 | 4 |
| RAC1-CDC42/GDP | 0.031 | 0.098 | -10000 | 0 | -0.45 | 17 | 17 |
| T-DHT/AR/PELP1/Src | 0.039 | 0.082 | -10000 | 0 | -0.37 | 18 | 18 |
| MAP2K2 | 0.009 | 0.071 | 0.35 | 1 | -0.4 | 3 | 4 |
| T-DHT/AR/PELP1/Src/PI3K | 0.02 | 0.069 | -10000 | 0 | -0.31 | 17 | 17 |
| GNAZ | 0.026 | 0.051 | -10000 | 0 | -0.64 | 3 | 3 |
| SHBG | -0.039 | 0.2 | -10000 | 0 | -0.63 | 53 | 53 |
| Gi family/GNB1/GNG2/GDP | -0.009 | 0.12 | -10000 | 0 | -0.48 | 15 | 15 |
| mol:T-DHT | 0 | 0.001 | -10000 | 0 | -0.006 | 10 | 10 |
| RAC1 | 0.027 | 0.009 | -10000 | 0 | -10000 | 0 | 0 |
| GNRH1 | -0.11 | 0.2 | 0.17 | 1 | -0.44 | 141 | 142 |
| Gi family/GTP | 0.008 | 0.058 | -10000 | 0 | -0.31 | 10 | 10 |
| CDC42 | 0.029 | 0.006 | -10000 | 0 | -10000 | 0 | 0 |
Figure S75. Get High-res Image This plot shows pathway concept perturbations across all samples against a permutation model. The concepts along the x-axis are sorted by lowest to highest mean activity for the real patient samples. Mean inferred activities are plotted along the y-axis as a colored band showing the average level and one standard deviation range. Real samples are shown in red and permuted samples in black.
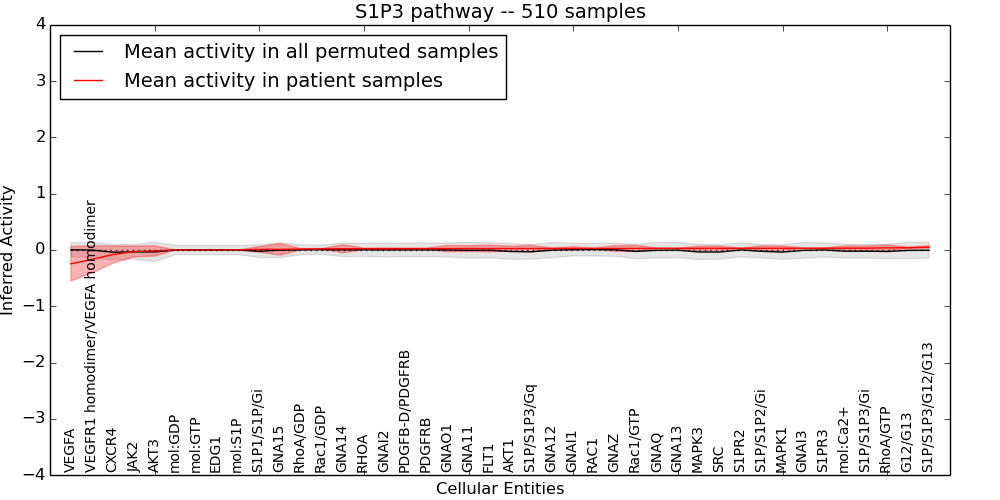
Table S75. Get Full Table This table displays mean, standard deviation, and perturbation statistics for Inferred Pathway Levels (IPLs). A mean perturbation of -9999 implies that the IPLs across all the real samples did not differ enough from the IPLs generated by a background model of permuted samples (> 1 Std.Dev from the permuted sample IPLs).
| Entity | Mean | Std.Dev | Mean.of.Up.Perturbations | Number.of.Up.Perturbations | Mean.of.Down.Perturbations | Number.of.Down.Perturbations | Number.of.Total.Perturbations |
|---|---|---|---|---|---|---|---|
| PDGFRB | 0.023 | 0.013 | -9999 | 0 | -10000 | 0 | 0 |
| mol:S1P | 0.001 | 0 | -9999 | 0 | -10000 | 0 | 0 |
| S1P1/S1P/Gi | 0.011 | 0.049 | -9999 | 0 | -0.28 | 4 | 4 |
| GNAO1 | 0.026 | 0.056 | -9999 | 0 | -0.6 | 4 | 4 |
| S1P/S1P3/G12/G13 | 0.052 | 0.022 | -9999 | 0 | -10000 | 0 | 0 |
| AKT1 | 0.026 | 0.041 | -9999 | 0 | -0.37 | 1 | 1 |
| AKT3 | -0.016 | 0.092 | -9999 | 0 | -0.54 | 3 | 3 |
| mol:GTP | 0 | 0 | -9999 | 0 | -10000 | 0 | 0 |
| PDGFB-D/PDGFRB | 0.023 | 0.013 | -9999 | 0 | -10000 | 0 | 0 |
| GNAI2 | 0.023 | 0.015 | -9999 | 0 | -10000 | 0 | 0 |
| GNAI3 | 0.031 | 0.006 | -9999 | 0 | -10000 | 0 | 0 |
| GNAI1 | 0.027 | 0.031 | -9999 | 0 | -0.63 | 1 | 1 |
| mol:GDP | 0 | 0 | -9999 | 0 | -10000 | 0 | 0 |
| S1PR3 | 0.031 | 0.006 | -9999 | 0 | -10000 | 0 | 0 |
| S1PR2 | 0.03 | 0.003 | -9999 | 0 | -10000 | 0 | 0 |
| EDG1 | 0 | 0 | -9999 | 0 | -10000 | 0 | 0 |
| mol:Ca2+ | 0.033 | 0.041 | -9999 | 0 | -0.31 | 2 | 2 |
| MAPK3 | 0.029 | 0.039 | -9999 | 0 | -0.31 | 1 | 1 |
| MAPK1 | 0.03 | 0.039 | -9999 | 0 | -0.31 | 1 | 1 |
| JAK2 | -0.027 | 0.097 | -9999 | 0 | -0.43 | 5 | 5 |
| CXCR4 | -0.081 | 0.16 | -9999 | 0 | -0.36 | 35 | 35 |
| FLT1 | 0.026 | 0.061 | -9999 | 0 | -0.58 | 5 | 5 |
| RhoA/GDP | 0.016 | 0.01 | -9999 | 0 | -10000 | 0 | 0 |
| Rac1/GDP | 0.02 | 0.007 | -9999 | 0 | -10000 | 0 | 0 |
| SRC | 0.03 | 0.039 | -9999 | 0 | -0.31 | 1 | 1 |
| S1P/S1P3/Gi | 0.033 | 0.042 | -9999 | 0 | -0.31 | 2 | 2 |
| RAC1 | 0.027 | 0.009 | -9999 | 0 | -10000 | 0 | 0 |
| RhoA/GTP | 0.038 | 0.048 | -9999 | 0 | -10000 | 0 | 0 |
| VEGFA | -0.24 | 0.31 | -9999 | 0 | -0.58 | 228 | 228 |
| S1P/S1P2/Gi | 0.03 | 0.043 | -9999 | 0 | -0.32 | 2 | 2 |
| VEGFR1 homodimer/VEGFA homodimer | -0.17 | 0.24 | -9999 | 0 | -0.43 | 228 | 228 |
| RHOA | 0.021 | 0.014 | -9999 | 0 | -10000 | 0 | 0 |
| S1P/S1P3/Gq | 0.027 | 0.056 | -9999 | 0 | -0.38 | 2 | 2 |
| GNAQ | 0.029 | 0.006 | -9999 | 0 | -10000 | 0 | 0 |
| GNAZ | 0.027 | 0.051 | -9999 | 0 | -0.63 | 3 | 3 |
| G12/G13 | 0.039 | 0.015 | -9999 | 0 | -10000 | 0 | 0 |
| GNA14 | 0.021 | 0.072 | -9999 | 0 | -0.64 | 6 | 6 |
| GNA15 | 0.012 | 0.1 | -9999 | 0 | -0.59 | 15 | 15 |
| GNA12 | 0.027 | 0.009 | -9999 | 0 | -10000 | 0 | 0 |
| GNA13 | 0.029 | 0.005 | -9999 | 0 | -10000 | 0 | 0 |
| GNA11 | 0.026 | 0.051 | -9999 | 0 | -0.64 | 3 | 3 |
| Rac1/GTP | 0.028 | 0.054 | -9999 | 0 | -0.3 | 1 | 1 |
Figure S76. Get High-res Image This plot shows pathway concept perturbations across all samples against a permutation model. The concepts along the x-axis are sorted by lowest to highest mean activity for the real patient samples. Mean inferred activities are plotted along the y-axis as a colored band showing the average level and one standard deviation range. Real samples are shown in red and permuted samples in black.
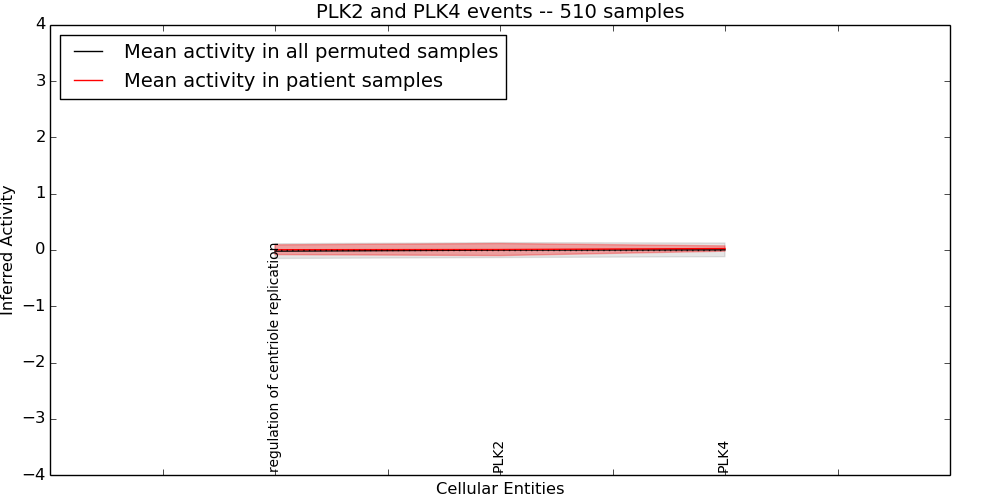
Table S76. Get Full Table This table displays mean, standard deviation, and perturbation statistics for Inferred Pathway Levels (IPLs). A mean perturbation of -9999 implies that the IPLs across all the real samples did not differ enough from the IPLs generated by a background model of permuted samples (> 1 Std.Dev from the permuted sample IPLs).
| Entity | Mean | Std.Dev | Mean.of.Up.Perturbations | Number.of.Up.Perturbations | Mean.of.Down.Perturbations | Number.of.Down.Perturbations | Number.of.Total.Perturbations |
|---|---|---|---|---|---|---|---|
| PLK2 | 0.008 | 0.11 | -9999 | 0 | -0.59 | 16 | 16 |
| PLK4 | 0.026 | 0.047 | -9999 | 0 | -0.59 | 3 | 3 |
| regulation of centriole replication | 0.005 | 0.087 | -9999 | 0 | -0.43 | 19 | 19 |
Figure S77. Get High-res Image This plot shows pathway concept perturbations across all samples against a permutation model. The concepts along the x-axis are sorted by lowest to highest mean activity for the real patient samples. Mean inferred activities are plotted along the y-axis as a colored band showing the average level and one standard deviation range. Real samples are shown in red and permuted samples in black.
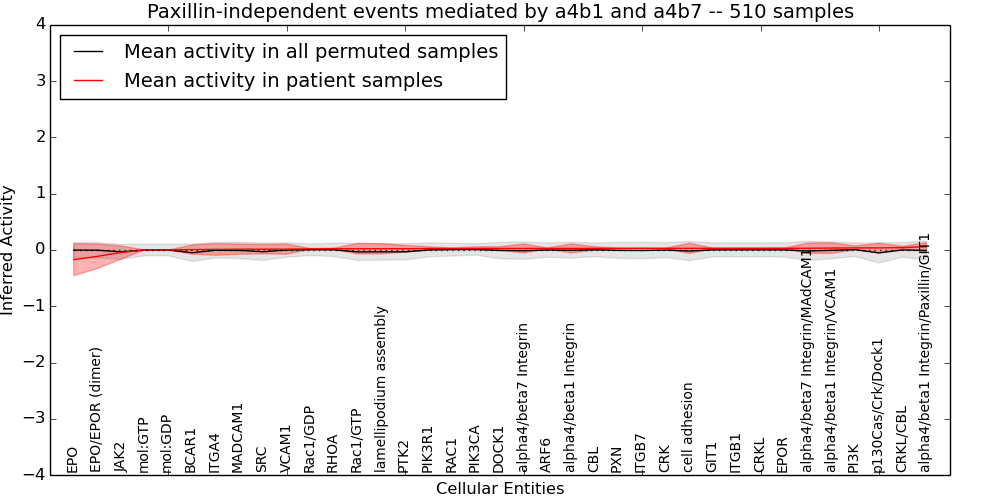
Table S77. Get Full Table This table displays mean, standard deviation, and perturbation statistics for Inferred Pathway Levels (IPLs). A mean perturbation of -9999 implies that the IPLs across all the real samples did not differ enough from the IPLs generated by a background model of permuted samples (> 1 Std.Dev from the permuted sample IPLs).
| Entity | Mean | Std.Dev | Mean.of.Up.Perturbations | Number.of.Up.Perturbations | Mean.of.Down.Perturbations | Number.of.Down.Perturbations | Number.of.Total.Perturbations |
|---|---|---|---|---|---|---|---|
| PTK2 | 0.023 | 0.059 | -10000 | 0 | -10000 | 0 | 0 |
| CRKL | 0.03 | 0.004 | -10000 | 0 | -10000 | 0 | 0 |
| Rac1/GDP | 0.02 | 0.007 | -10000 | 0 | -10000 | 0 | 0 |
| DOCK1 | 0.028 | 0.03 | -10000 | 0 | -0.64 | 1 | 1 |
| ITGA4 | 0.011 | 0.1 | -10000 | 0 | -0.59 | 15 | 15 |
| alpha4/beta7 Integrin/MAdCAM1 | 0.031 | 0.092 | -10000 | 0 | -0.42 | 1 | 1 |
| EPO | -0.17 | 0.28 | -10000 | 0 | -0.59 | 163 | 163 |
| alpha4/beta7 Integrin | 0.028 | 0.081 | -10000 | 0 | -0.43 | 15 | 15 |
| mol:GTP | 0 | 0 | -10000 | 0 | -10000 | 0 | 0 |
| CRK | 0.029 | 0.005 | -10000 | 0 | -10000 | 0 | 0 |
| alpha4/beta1 Integrin | 0.028 | 0.081 | -10000 | 0 | -0.43 | 15 | 15 |
| EPO/EPOR (dimer) | -0.11 | 0.22 | -10000 | 0 | -0.43 | 163 | 163 |
| lamellipodium assembly | 0.022 | 0.091 | 0.31 | 1 | -0.52 | 7 | 8 |
| PIK3CA | 0.027 | 0.03 | -10000 | 0 | -0.64 | 1 | 1 |
| PI3K | 0.037 | 0.035 | -10000 | 0 | -0.47 | 2 | 2 |
| ARF6 | 0.028 | 0.008 | -10000 | 0 | -10000 | 0 | 0 |
| JAK2 | -0.044 | 0.12 | -10000 | 0 | -0.39 | 9 | 9 |
| PXN | 0.029 | 0.006 | -10000 | 0 | -10000 | 0 | 0 |
| PIK3R1 | 0.026 | 0.031 | -10000 | 0 | -0.64 | 1 | 1 |
| MADCAM1 | 0.014 | 0.091 | -10000 | 0 | -0.6 | 11 | 11 |
| cell adhesion | 0.029 | 0.091 | -10000 | 0 | -0.42 | 1 | 1 |
| CRKL/CBL | 0.043 | 0.024 | -10000 | 0 | -0.47 | 1 | 1 |
| ITGB1 | 0.03 | 0.004 | -10000 | 0 | -10000 | 0 | 0 |
| SRC | 0.014 | 0.084 | -10000 | 0 | -0.35 | 1 | 1 |
| ITGB7 | 0.029 | 0.005 | -10000 | 0 | -10000 | 0 | 0 |
| RAC1 | 0.027 | 0.009 | -10000 | 0 | -10000 | 0 | 0 |
| alpha4/beta1 Integrin/VCAM1 | 0.035 | 0.094 | -10000 | 0 | -0.37 | 25 | 25 |
| p130Cas/Crk/Dock1 | 0.038 | 0.083 | -10000 | 0 | -0.59 | 1 | 1 |
| VCAM1 | 0.015 | 0.09 | -10000 | 0 | -0.53 | 13 | 13 |
| RHOA | 0.021 | 0.014 | -10000 | 0 | -10000 | 0 | 0 |
| alpha4/beta1 Integrin/Paxillin/GIT1 | 0.058 | 0.072 | -10000 | 0 | -10000 | 0 | 0 |
| BCAR1 | 0.008 | 0.081 | -10000 | 0 | -0.64 | 1 | 1 |
| EPOR | 0.03 | 0.003 | -10000 | 0 | -10000 | 0 | 0 |
| mol:GDP | 0 | 0 | -10000 | 0 | -10000 | 0 | 0 |
| CBL | 0.029 | 0.03 | -10000 | 0 | -0.64 | 1 | 1 |
| GIT1 | 0.03 | 0.005 | -10000 | 0 | -10000 | 0 | 0 |
| Rac1/GTP | 0.022 | 0.093 | 0.32 | 1 | -0.54 | 7 | 8 |
Figure S78. Get High-res Image This plot shows pathway concept perturbations across all samples against a permutation model. The concepts along the x-axis are sorted by lowest to highest mean activity for the real patient samples. Mean inferred activities are plotted along the y-axis as a colored band showing the average level and one standard deviation range. Real samples are shown in red and permuted samples in black.
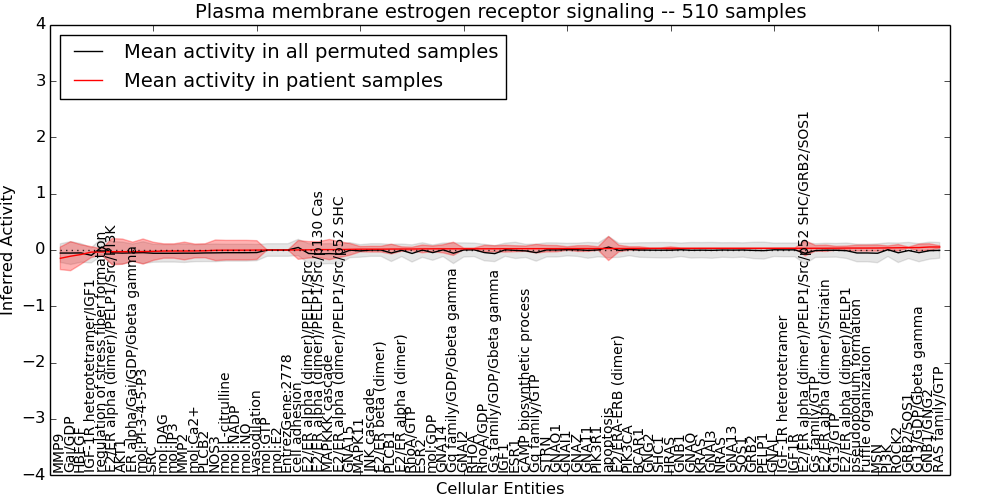
Table S78. Get Full Table This table displays mean, standard deviation, and perturbation statistics for Inferred Pathway Levels (IPLs). A mean perturbation of -9999 implies that the IPLs across all the real samples did not differ enough from the IPLs generated by a background model of permuted samples (> 1 Std.Dev from the permuted sample IPLs).
| Entity | Mean | Std.Dev | Mean.of.Up.Perturbations | Number.of.Up.Perturbations | Mean.of.Down.Perturbations | Number.of.Down.Perturbations | Number.of.Total.Perturbations |
|---|---|---|---|---|---|---|---|
| GNB1/GNG2 | 0.053 | 0.058 | -10000 | 0 | -0.34 | 4 | 4 |
| ER alpha/Gai/GDP/Gbeta gamma | -0.03 | 0.17 | -10000 | 0 | -0.54 | 34 | 34 |
| AKT1 | -0.03 | 0.22 | -10000 | 0 | -0.72 | 44 | 44 |
| PIK3CA | 0.027 | 0.03 | -10000 | 0 | -0.64 | 1 | 1 |
| E2/ER alpha (dimer)/PELP1/Src/PI3K | -0.03 | 0.23 | -10000 | 0 | -0.75 | 44 | 44 |
| mol:Ca2+ | -0.017 | 0.12 | -10000 | 0 | -0.46 | 16 | 16 |
| IGF1R | 0.03 | 0.003 | -10000 | 0 | -10000 | 0 | 0 |
| E2/ER alpha (dimer)/Striatin | 0.031 | 0.057 | -10000 | 0 | -0.46 | 6 | 6 |
| SHC1 | 0.029 | 0.007 | -10000 | 0 | -10000 | 0 | 0 |
| apoptosis | 0.027 | 0.21 | 0.69 | 44 | -10000 | 0 | 44 |
| RhoA/GTP | 0.018 | 0.031 | -10000 | 0 | -10000 | 0 | 0 |
| E2/ER alpha (dimer)/PELP1/Src/p130 Cas | 0.007 | 0.14 | -10000 | 0 | -0.61 | 10 | 10 |
| regulation of stress fiber formation | -0.034 | 0.053 | -10000 | 0 | -0.38 | 3 | 3 |
| E2/ERA-ERB (dimer) | 0.027 | 0.058 | -10000 | 0 | -0.38 | 9 | 9 |
| KRAS | 0.029 | 0.006 | -10000 | 0 | -10000 | 0 | 0 |
| G13/GTP | 0.032 | 0.033 | -10000 | 0 | -0.36 | 3 | 3 |
| pseudopodium formation | 0.034 | 0.053 | 0.38 | 3 | -10000 | 0 | 3 |
| E2/ER alpha (dimer)/PELP1 | 0.034 | 0.036 | -10000 | 0 | -0.39 | 3 | 3 |
| GRB2 | 0.029 | 0.005 | -10000 | 0 | -10000 | 0 | 0 |
| GNG2 | 0.028 | 0.008 | -10000 | 0 | -10000 | 0 | 0 |
| GNAO1 | 0.024 | 0.056 | -10000 | 0 | -0.6 | 4 | 4 |
| HRAS | 0.029 | 0.027 | -10000 | 0 | -0.59 | 1 | 1 |
| mol:GTP | 0 | 0 | -10000 | 0 | -10000 | 0 | 0 |
| mol:NO | -0.003 | 0.17 | 0.33 | 4 | -0.53 | 39 | 43 |
| E2/ER beta (dimer) | 0.015 | 0.051 | -10000 | 0 | -0.44 | 6 | 6 |
| mol:GDP | 0.021 | 0.051 | -10000 | 0 | -0.41 | 3 | 3 |
| mol:NADP | -0.003 | 0.17 | 0.33 | 4 | -0.53 | 39 | 43 |
| PIK3R1 | 0.026 | 0.031 | -10000 | 0 | -0.64 | 1 | 1 |
| mol:IP3 | -0.018 | 0.13 | -10000 | 0 | -0.48 | 16 | 16 |
| IGF-1R heterotetramer | 0.03 | 0.003 | -10000 | 0 | -10000 | 0 | 0 |
| PLCB1 | 0.017 | 0.085 | -10000 | 0 | -0.49 | 9 | 9 |
| PLCB2 | -0.014 | 0.12 | -10000 | 0 | -0.46 | 15 | 15 |
| IGF1 | 0.023 | 0.061 | -10000 | 0 | -0.59 | 5 | 5 |
| mol:L-citrulline | -0.003 | 0.17 | 0.33 | 4 | -0.53 | 39 | 43 |
| RHOA | 0.021 | 0.014 | -10000 | 0 | -10000 | 0 | 0 |
| Gai/GDP | -0.11 | 0.26 | -10000 | 0 | -0.53 | 118 | 118 |
| JNK cascade | 0.015 | 0.051 | -10000 | 0 | -0.44 | 6 | 6 |
| BCAR1 | 0.028 | 0.03 | -10000 | 0 | -0.64 | 1 | 1 |
| ESR2 | 0.02 | 0.069 | -10000 | 0 | -0.56 | 7 | 7 |
| GNAQ | 0.029 | 0.006 | -10000 | 0 | -10000 | 0 | 0 |
| ESR1 | 0.023 | 0.052 | -10000 | 0 | -0.55 | 4 | 4 |
| Gq family/GDP/Gbeta gamma | 0.021 | 0.12 | -10000 | 0 | -0.76 | 7 | 7 |
| E2/ER alpha (dimer)/PELP1/Src/p52 SHC/GRB2/SOS1 | 0.03 | 0.14 | -10000 | 0 | -0.97 | 8 | 8 |
| E2/ER alpha (dimer)/PELP1/Src/p52 SHC | 0.007 | 0.14 | -10000 | 0 | -0.61 | 10 | 10 |
| GNAZ | 0.026 | 0.051 | -10000 | 0 | -0.64 | 3 | 3 |
| E2/ER alpha (dimer) | 0.017 | 0.039 | -10000 | 0 | -0.46 | 3 | 3 |
| STRN | 0.024 | 0.059 | -10000 | 0 | -0.64 | 4 | 4 |
| GNAL | 0.03 | 0.005 | -10000 | 0 | -10000 | 0 | 0 |
| PELP1 | 0.029 | 0.005 | -10000 | 0 | -10000 | 0 | 0 |
| MAPK11 | 0.015 | 0.047 | -10000 | 0 | -0.37 | 7 | 7 |
| GNAI2 | 0.021 | 0.014 | -10000 | 0 | -10000 | 0 | 0 |
| GNAI3 | 0.029 | 0.005 | -10000 | 0 | -10000 | 0 | 0 |
| GNAI1 | 0.026 | 0.031 | -10000 | 0 | -0.64 | 1 | 1 |
| HBEGF | -0.08 | 0.17 | 0.41 | 10 | -0.55 | 28 | 38 |
| cAMP biosynthetic process | 0.023 | 0.047 | -10000 | 0 | -0.31 | 9 | 9 |
| SRC | -0.024 | 0.16 | -10000 | 0 | -0.6 | 20 | 20 |
| PI3K | 0.037 | 0.035 | -10000 | 0 | -0.47 | 2 | 2 |
| GNB1 | 0.029 | 0.006 | -10000 | 0 | -10000 | 0 | 0 |
| G13/GDP/Gbeta gamma | 0.043 | 0.063 | -10000 | 0 | -0.4 | 1 | 1 |
| SOS1 | 0.029 | 0.005 | -10000 | 0 | -10000 | 0 | 0 |
| IGF-1R heterotetramer/IGF1 | -0.037 | 0.096 | -10000 | 0 | -0.48 | 13 | 13 |
| Gs family/GTP | 0.031 | 0.05 | -10000 | 0 | -0.31 | 9 | 9 |
| EntrezGene:2778 | 0 | 0 | -10000 | 0 | -10000 | 0 | 0 |
| RAS family/GTP | 0.053 | 0.023 | -10000 | 0 | -0.33 | 1 | 1 |
| vasodilation | -0.001 | 0.17 | 0.32 | 4 | -0.5 | 39 | 43 |
| mol:DAG | -0.018 | 0.13 | -10000 | 0 | -0.48 | 16 | 16 |
| Gs family/GDP/Gbeta gamma | 0.022 | 0.054 | -10000 | 0 | -0.37 | 1 | 1 |
| MSN | 0.035 | 0.055 | 0.38 | 3 | -10000 | 0 | 3 |
| Gq family/GTP | 0.024 | 0.076 | -10000 | 0 | -0.47 | 8 | 8 |
| mol:PI-3-4-5-P3 | -0.027 | 0.22 | -10000 | 0 | -0.72 | 44 | 44 |
| NRAS | 0.029 | 0.005 | -10000 | 0 | -10000 | 0 | 0 |
| mol:E2 | 0 | 0 | -10000 | 0 | -10000 | 0 | 0 |
| cell adhesion | 0.001 | 0.17 | 0.5 | 39 | -0.32 | 4 | 43 |
| GRB2/SOS1 | 0.043 | 0.01 | -10000 | 0 | -10000 | 0 | 0 |
| RhoA/GDP | 0.022 | 0.061 | -10000 | 0 | -0.41 | 2 | 2 |
| NOS3 | -0.005 | 0.18 | 0.36 | 3 | -0.56 | 39 | 42 |
| GNA11 | 0.026 | 0.051 | -10000 | 0 | -0.64 | 3 | 3 |
| MAPKKK cascade | 0.007 | 0.18 | 0.38 | 4 | -0.55 | 41 | 45 |
| E2/ER alpha (dimer)/PELP1/Src | 0.003 | 0.15 | -10000 | 0 | -0.61 | 12 | 12 |
| ruffle organization | 0.034 | 0.053 | 0.38 | 3 | -10000 | 0 | 3 |
| ROCK2 | 0.04 | 0.058 | 0.4 | 3 | -10000 | 0 | 3 |
| GNA14 | 0.021 | 0.072 | -10000 | 0 | -0.64 | 6 | 6 |
| GNA15 | 0.012 | 0.1 | -10000 | 0 | -0.59 | 15 | 15 |
| GNA13 | 0.029 | 0.005 | -10000 | 0 | -10000 | 0 | 0 |
| MMP9 | -0.15 | 0.2 | 0.38 | 7 | -0.57 | 38 | 45 |
| MMP2 | -0.018 | 0.16 | 0.33 | 2 | -0.58 | 19 | 21 |
Figure S79. Get High-res Image This plot shows pathway concept perturbations across all samples against a permutation model. The concepts along the x-axis are sorted by lowest to highest mean activity for the real patient samples. Mean inferred activities are plotted along the y-axis as a colored band showing the average level and one standard deviation range. Real samples are shown in red and permuted samples in black.
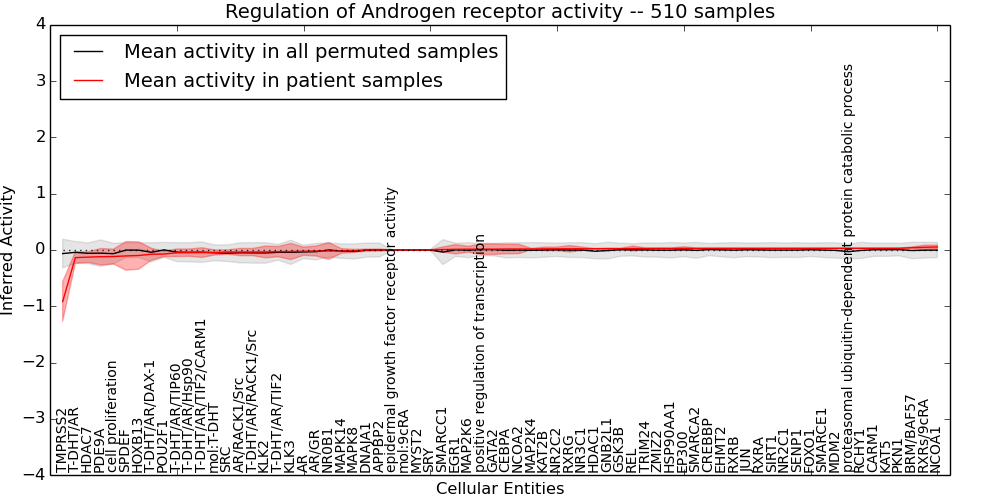
Table S79. Get Full Table This table displays mean, standard deviation, and perturbation statistics for Inferred Pathway Levels (IPLs). A mean perturbation of -9999 implies that the IPLs across all the real samples did not differ enough from the IPLs generated by a background model of permuted samples (> 1 Std.Dev from the permuted sample IPLs).
| Entity | Mean | Std.Dev | Mean.of.Up.Perturbations | Number.of.Up.Perturbations | Mean.of.Down.Perturbations | Number.of.Down.Perturbations | Number.of.Total.Perturbations |
|---|---|---|---|---|---|---|---|
| HDAC1 | 0.022 | 0.006 | -10000 | 0 | -10000 | 0 | 0 |
| SMARCC1 | 0.009 | 0.046 | -10000 | 0 | -0.66 | 2 | 2 |
| REL | 0.026 | 0.045 | -10000 | 0 | -0.53 | 3 | 3 |
| HDAC7 | -0.13 | 0.095 | -10000 | 0 | -0.61 | 4 | 4 |
| JUN | 0.029 | 0.006 | -10000 | 0 | -10000 | 0 | 0 |
| EP300 | 0.028 | 0.03 | -10000 | 0 | -0.64 | 1 | 1 |
| KAT2B | 0.02 | 0.032 | -10000 | 0 | -0.64 | 1 | 1 |
| KAT5 | 0.03 | 0.003 | -10000 | 0 | -10000 | 0 | 0 |
| MAPK14 | -0.017 | 0.041 | -10000 | 0 | -0.5 | 3 | 3 |
| FOXO1 | 0.029 | 0.005 | -10000 | 0 | -10000 | 0 | 0 |
| T-DHT/AR | -0.14 | 0.1 | -10000 | 0 | -0.64 | 4 | 4 |
| MAP2K6 | 0.014 | 0.053 | -10000 | 0 | -0.66 | 3 | 3 |
| BRM/BAF57 | 0.042 | 0.012 | -10000 | 0 | -10000 | 0 | 0 |
| MAP2K4 | 0.018 | 0.011 | -10000 | 0 | -10000 | 0 | 0 |
| SMARCA2 | 0.029 | 0.007 | -10000 | 0 | -10000 | 0 | 0 |
| PDE9A | -0.12 | 0.15 | -10000 | 0 | -0.82 | 14 | 14 |
| NCOA2 | 0.018 | 0.083 | -10000 | 0 | -0.64 | 8 | 8 |
| CEBPA | 0.018 | 0.086 | -10000 | 0 | -0.59 | 10 | 10 |
| EHMT2 | 0.029 | 0.006 | -10000 | 0 | -10000 | 0 | 0 |
| cell proliferation | -0.12 | 0.13 | 0.51 | 4 | -0.49 | 10 | 14 |
| NR0B1 | -0.017 | 0.15 | -10000 | 0 | -0.59 | 32 | 32 |
| EGR1 | 0.013 | 0.083 | -10000 | 0 | -0.64 | 8 | 8 |
| RXRs/9cRA | 0.048 | 0.038 | -10000 | 0 | -0.36 | 3 | 3 |
| AR/RACK1/Src | -0.036 | 0.065 | -10000 | 0 | -0.48 | 3 | 3 |
| AR/GR | -0.018 | 0.089 | -10000 | 0 | -0.51 | 9 | 9 |
| GNB2L1 | 0.023 | 0.013 | -10000 | 0 | -10000 | 0 | 0 |
| PKN1 | 0.03 | 0.002 | -10000 | 0 | -10000 | 0 | 0 |
| RCHY1 | 0.03 | 0.004 | -10000 | 0 | -10000 | 0 | 0 |
| epidermal growth factor receptor activity | 0 | 0.001 | -10000 | 0 | -0.017 | 1 | 1 |
| MAPK8 | -0.015 | 0.028 | -10000 | 0 | -0.49 | 1 | 1 |
| T-DHT/AR/TIF2/CARM1 | -0.046 | 0.087 | -10000 | 0 | -0.58 | 6 | 6 |
| SRC | -0.037 | 0.039 | -10000 | 0 | -0.4 | 3 | 3 |
| NR3C1 | 0.022 | 0.03 | -10000 | 0 | -0.59 | 1 | 1 |
| KLK3 | -0.027 | 0.14 | -10000 | 0 | -0.7 | 11 | 11 |
| APPBP2 | 0 | 0.019 | -10000 | 0 | -10000 | 0 | 0 |
| TRIM24 | 0.027 | 0.01 | -10000 | 0 | -10000 | 0 | 0 |
| T-DHT/AR/TIP60 | -0.049 | 0.068 | -10000 | 0 | -0.5 | 5 | 5 |
| TMPRSS2 | -0.92 | 0.35 | -10000 | 0 | -1 | 447 | 447 |
| RXRG | 0.022 | 0.058 | -10000 | 0 | -0.62 | 4 | 4 |
| mol:9cRA | 0 | 0.001 | -10000 | 0 | -10000 | 0 | 0 |
| RXRA | 0.029 | 0.006 | -10000 | 0 | -10000 | 0 | 0 |
| RXRB | 0.029 | 0.006 | -10000 | 0 | -10000 | 0 | 0 |
| CARM1 | 0.03 | 0.003 | -10000 | 0 | -10000 | 0 | 0 |
| NR2C2 | 0.02 | 0.032 | -10000 | 0 | -0.64 | 1 | 1 |
| KLK2 | -0.035 | 0.1 | -10000 | 0 | -0.54 | 14 | 14 |
| AR | -0.022 | 0.074 | -10000 | 0 | -0.39 | 14 | 14 |
| SENP1 | 0.029 | 0.005 | -10000 | 0 | -10000 | 0 | 0 |
| HSP90AA1 | 0.028 | 0.008 | -10000 | 0 | -10000 | 0 | 0 |
| MDM2 | 0.03 | 0.007 | -10000 | 0 | -10000 | 0 | 0 |
| SRY | 0 | 0.004 | 0.019 | 18 | -10000 | 0 | 18 |
| GATA2 | 0.015 | 0.093 | -10000 | 0 | -0.61 | 11 | 11 |
| MYST2 | 0 | 0 | -10000 | 0 | -10000 | 0 | 0 |
| HOXB13 | -0.097 | 0.24 | -10000 | 0 | -0.59 | 101 | 101 |
| T-DHT/AR/RACK1/Src | -0.036 | 0.065 | -10000 | 0 | -0.48 | 3 | 3 |
| positive regulation of transcription | 0.015 | 0.093 | -10000 | 0 | -0.61 | 11 | 11 |
| DNAJA1 | -0.001 | 0.019 | -10000 | 0 | -10000 | 0 | 0 |
| proteasomal ubiquitin-dependent protein catabolic process | 0.03 | 0.008 | -10000 | 0 | -10000 | 0 | 0 |
| NCOA1 | 0.054 | 0.032 | -10000 | 0 | -10000 | 0 | 0 |
| SPDEF | -0.1 | 0.26 | -10000 | 0 | -0.59 | 109 | 109 |
| T-DHT/AR/TIF2 | -0.029 | 0.091 | -10000 | 0 | -0.55 | 7 | 7 |
| T-DHT/AR/Hsp90 | -0.047 | 0.066 | -10000 | 0 | -0.49 | 4 | 4 |
| GSK3B | 0.024 | 0.008 | -10000 | 0 | -10000 | 0 | 0 |
| NR2C1 | 0.029 | 0.006 | -10000 | 0 | -10000 | 0 | 0 |
| mol:T-DHT | -0.043 | 0.045 | -10000 | 0 | -0.42 | 4 | 4 |
| SIRT1 | 0.029 | 0.006 | -10000 | 0 | -10000 | 0 | 0 |
| ZMIZ2 | 0.027 | 0.01 | -10000 | 0 | -10000 | 0 | 0 |
| POU2F1 | -0.071 | 0.047 | -10000 | 0 | -10000 | 0 | 0 |
| T-DHT/AR/DAX-1 | -0.075 | 0.11 | -10000 | 0 | -0.55 | 10 | 10 |
| CREBBP | 0.029 | 0.006 | -10000 | 0 | -10000 | 0 | 0 |
| SMARCE1 | 0.029 | 0.005 | -10000 | 0 | -10000 | 0 | 0 |
Figure S80. Get High-res Image This plot shows pathway concept perturbations across all samples against a permutation model. The concepts along the x-axis are sorted by lowest to highest mean activity for the real patient samples. Mean inferred activities are plotted along the y-axis as a colored band showing the average level and one standard deviation range. Real samples are shown in red and permuted samples in black.
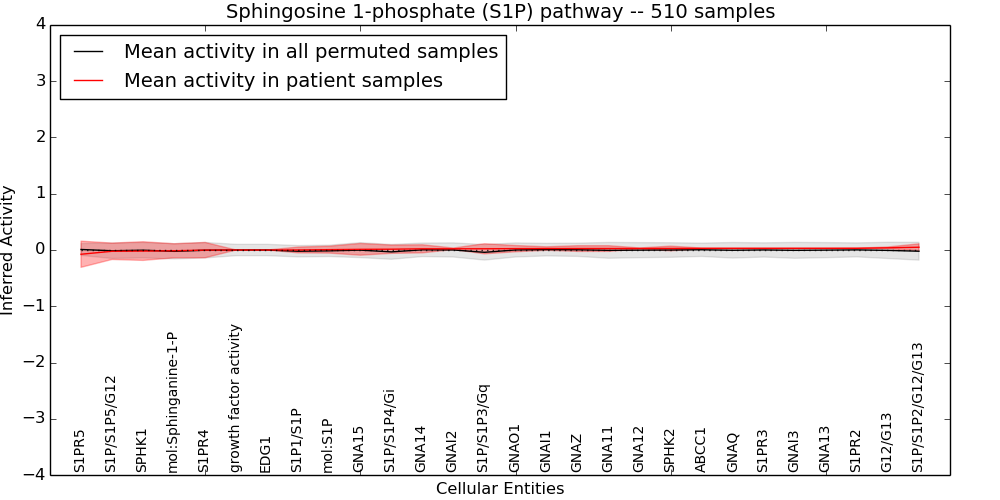
Table S80. Get Full Table This table displays mean, standard deviation, and perturbation statistics for Inferred Pathway Levels (IPLs). A mean perturbation of -9999 implies that the IPLs across all the real samples did not differ enough from the IPLs generated by a background model of permuted samples (> 1 Std.Dev from the permuted sample IPLs).
| Entity | Mean | Std.Dev | Mean.of.Up.Perturbations | Number.of.Up.Perturbations | Mean.of.Down.Perturbations | Number.of.Down.Perturbations | Number.of.Total.Perturbations |
|---|---|---|---|---|---|---|---|
| SPHK2 | 0.027 | 0.042 | -10000 | 0 | -0.64 | 2 | 2 |
| SPHK1 | -0.019 | 0.17 | -10000 | 0 | -0.59 | 40 | 40 |
| GNAI2 | 0.021 | 0.014 | -10000 | 0 | -10000 | 0 | 0 |
| mol:S1P | 0.006 | 0.062 | -10000 | 0 | -0.31 | 3 | 3 |
| GNAO1 | 0.024 | 0.056 | -10000 | 0 | -0.6 | 4 | 4 |
| mol:Sphinganine-1-P | -0.014 | 0.12 | -10000 | 0 | -0.43 | 41 | 41 |
| growth factor activity | 0 | 0 | -10000 | 0 | -10000 | 0 | 0 |
| S1P/S1P2/G12/G13 | 0.049 | 0.06 | -10000 | 0 | -10000 | 0 | 0 |
| GNAI3 | 0.029 | 0.005 | -10000 | 0 | -10000 | 0 | 0 |
| G12/G13 | 0.039 | 0.015 | -10000 | 0 | -10000 | 0 | 0 |
| S1PR3 | 0.029 | 0.006 | -10000 | 0 | -10000 | 0 | 0 |
| S1PR2 | 0.03 | 0.003 | -10000 | 0 | -10000 | 0 | 0 |
| EDG1 | 0 | 0 | -10000 | 0 | -10000 | 0 | 0 |
| S1P1/S1P | 0.001 | 0.052 | -10000 | 0 | -0.27 | 3 | 3 |
| S1PR5 | -0.075 | 0.23 | -10000 | 0 | -0.59 | 87 | 87 |
| S1PR4 | -0.002 | 0.14 | -10000 | 0 | -0.59 | 26 | 26 |
| GNAI1 | 0.026 | 0.031 | -10000 | 0 | -0.64 | 1 | 1 |
| S1P/S1P5/G12 | -0.023 | 0.15 | -10000 | 0 | -0.34 | 78 | 78 |
| S1P/S1P3/Gq | 0.022 | 0.09 | -10000 | 0 | -0.39 | 6 | 6 |
| S1P/S1P4/Gi | 0.014 | 0.074 | 0.29 | 1 | -0.34 | 6 | 7 |
| GNAQ | 0.029 | 0.006 | -10000 | 0 | -10000 | 0 | 0 |
| GNAZ | 0.026 | 0.051 | -10000 | 0 | -0.64 | 3 | 3 |
| GNA14 | 0.021 | 0.072 | -10000 | 0 | -0.64 | 6 | 6 |
| GNA15 | 0.012 | 0.1 | -10000 | 0 | -0.59 | 15 | 15 |
| GNA12 | 0.027 | 0.009 | -10000 | 0 | -10000 | 0 | 0 |
| GNA13 | 0.029 | 0.005 | -10000 | 0 | -10000 | 0 | 0 |
| GNA11 | 0.026 | 0.051 | -10000 | 0 | -0.64 | 3 | 3 |
| ABCC1 | 0.029 | 0.006 | -10000 | 0 | -10000 | 0 | 0 |
Figure S81. Get High-res Image This plot shows pathway concept perturbations across all samples against a permutation model. The concepts along the x-axis are sorted by lowest to highest mean activity for the real patient samples. Mean inferred activities are plotted along the y-axis as a colored band showing the average level and one standard deviation range. Real samples are shown in red and permuted samples in black.
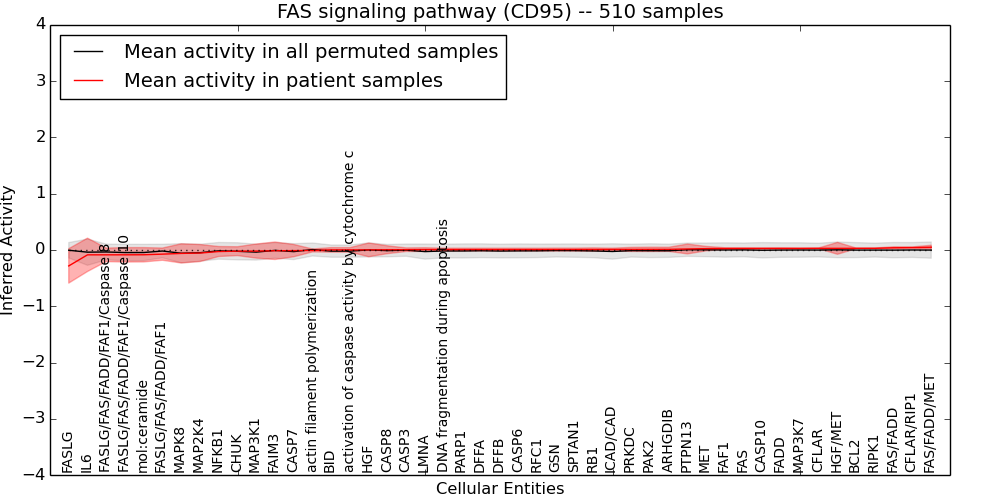
Table S81. Get Full Table This table displays mean, standard deviation, and perturbation statistics for Inferred Pathway Levels (IPLs). A mean perturbation of -9999 implies that the IPLs across all the real samples did not differ enough from the IPLs generated by a background model of permuted samples (> 1 Std.Dev from the permuted sample IPLs).
| Entity | Mean | Std.Dev | Mean.of.Up.Perturbations | Number.of.Up.Perturbations | Mean.of.Down.Perturbations | Number.of.Down.Perturbations | Number.of.Total.Perturbations |
|---|---|---|---|---|---|---|---|
| SPTAN1 | 0.008 | 0.026 | -10000 | 0 | -10000 | 0 | 0 |
| RFC1 | 0.008 | 0.024 | -10000 | 0 | -10000 | 0 | 0 |
| PRKDC | 0.01 | 0.036 | 0.33 | 1 | -10000 | 0 | 1 |
| RIPK1 | 0.03 | 0.007 | -10000 | 0 | -10000 | 0 | 0 |
| CASP7 | -0.011 | 0.11 | -10000 | 0 | -0.63 | 12 | 12 |
| FASLG/FAS/FADD/FAF1 | -0.074 | 0.11 | 0.24 | 6 | -0.28 | 6 | 12 |
| MAP2K4 | -0.054 | 0.15 | 0.31 | 5 | -0.56 | 18 | 23 |
| mol:ceramide | -0.085 | 0.13 | -10000 | 0 | -0.38 | 11 | 11 |
| GSN | 0.008 | 0.026 | -10000 | 0 | -10000 | 0 | 0 |
| FASLG/FAS/FADD/FAF1/Caspase 8 | -0.086 | 0.12 | -10000 | 0 | -0.44 | 4 | 4 |
| FAS | 0.027 | 0.011 | -10000 | 0 | -10000 | 0 | 0 |
| BID | 0.002 | 0.04 | -10000 | 0 | -10000 | 0 | 0 |
| MAP3K1 | -0.019 | 0.12 | 0.33 | 4 | -0.51 | 15 | 19 |
| MAP3K7 | 0.028 | 0.008 | -10000 | 0 | -10000 | 0 | 0 |
| RB1 | 0.009 | 0.029 | -10000 | 0 | -10000 | 0 | 0 |
| CFLAR | 0.029 | 0.007 | -10000 | 0 | -10000 | 0 | 0 |
| HGF/MET | 0.029 | 0.11 | -10000 | 0 | -0.41 | 25 | 25 |
| ARHGDIB | 0.012 | 0.037 | -10000 | 0 | -10000 | 0 | 0 |
| FADD | 0.028 | 0.011 | -10000 | 0 | -10000 | 0 | 0 |
| actin filament polymerization | -0.008 | 0.026 | -10000 | 0 | -10000 | 0 | 0 |
| NFKB1 | -0.027 | 0.089 | -10000 | 0 | -0.59 | 6 | 6 |
| MAPK8 | -0.061 | 0.17 | 0.38 | 4 | -0.53 | 30 | 34 |
| DFFA | 0.008 | 0.025 | -10000 | 0 | -10000 | 0 | 0 |
| DNA fragmentation during apoptosis | 0.008 | 0.024 | -10000 | 0 | -10000 | 0 | 0 |
| FAS/FADD/MET | 0.049 | 0.035 | -10000 | 0 | -0.36 | 2 | 2 |
| CFLAR/RIP1 | 0.043 | 0.012 | -10000 | 0 | -10000 | 0 | 0 |
| FAIM3 | -0.013 | 0.16 | -10000 | 0 | -0.59 | 35 | 35 |
| FAF1 | 0.026 | 0.014 | -10000 | 0 | -10000 | 0 | 0 |
| PARP1 | 0.008 | 0.025 | -10000 | 0 | -10000 | 0 | 0 |
| DFFB | 0.008 | 0.025 | -10000 | 0 | -10000 | 0 | 0 |
| CHUK | -0.021 | 0.079 | -10000 | 0 | -0.55 | 5 | 5 |
| FASLG | -0.28 | 0.31 | -10000 | 0 | -0.59 | 255 | 255 |
| FAS/FADD | 0.04 | 0.017 | -10000 | 0 | -10000 | 0 | 0 |
| HGF | 0.002 | 0.12 | -10000 | 0 | -0.6 | 20 | 20 |
| LMNA | 0.007 | 0.033 | 0.29 | 1 | -0.32 | 1 | 2 |
| CASP6 | 0.008 | 0.025 | -10000 | 0 | -10000 | 0 | 0 |
| CASP10 | 0.027 | 0.011 | -10000 | 0 | -10000 | 0 | 0 |
| CASP3 | 0.005 | 0.032 | -10000 | 0 | -10000 | 0 | 0 |
| PTPN13 | 0.018 | 0.088 | -10000 | 0 | -0.64 | 9 | 9 |
| CASP8 | 0.005 | 0.07 | 0.26 | 35 | -10000 | 0 | 35 |
| IL6 | -0.086 | 0.3 | -10000 | 0 | -1.1 | 32 | 32 |
| MET | 0.024 | 0.04 | -10000 | 0 | -0.59 | 2 | 2 |
| ICAD/CAD | 0.01 | 0.023 | -10000 | 0 | -10000 | 0 | 0 |
| FASLG/FAS/FADD/FAF1/Caspase 10 | -0.086 | 0.13 | -10000 | 0 | -0.39 | 11 | 11 |
| activation of caspase activity by cytochrome c | 0.002 | 0.04 | -10000 | 0 | -10000 | 0 | 0 |
| PAK2 | 0.012 | 0.038 | -10000 | 0 | -10000 | 0 | 0 |
| BCL2 | 0.03 | 0.005 | -10000 | 0 | -10000 | 0 | 0 |
Figure S82. Get High-res Image This plot shows pathway concept perturbations across all samples against a permutation model. The concepts along the x-axis are sorted by lowest to highest mean activity for the real patient samples. Mean inferred activities are plotted along the y-axis as a colored band showing the average level and one standard deviation range. Real samples are shown in red and permuted samples in black.
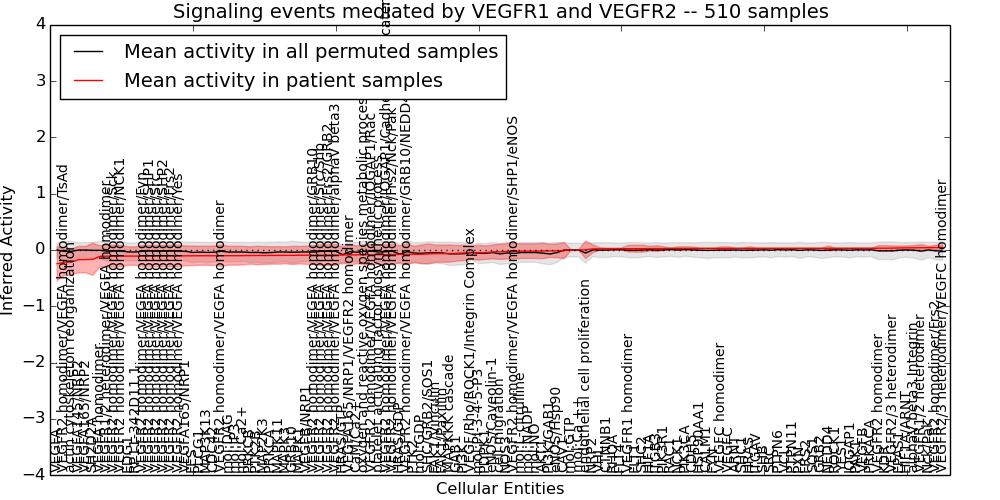
Table S82. Get Full Table This table displays mean, standard deviation, and perturbation statistics for Inferred Pathway Levels (IPLs). A mean perturbation of -9999 implies that the IPLs across all the real samples did not differ enough from the IPLs generated by a background model of permuted samples (> 1 Std.Dev from the permuted sample IPLs).
| Entity | Mean | Std.Dev | Mean.of.Up.Perturbations | Number.of.Up.Perturbations | Mean.of.Down.Perturbations | Number.of.Down.Perturbations | Number.of.Total.Perturbations |
|---|---|---|---|---|---|---|---|
| alphaV beta3 Integrin | 0.039 | 0.041 | -10000 | 0 | -0.47 | 3 | 3 |
| AKT1 | -0.017 | 0.14 | 0.46 | 6 | -0.57 | 3 | 9 |
| PTK2B | -0.098 | 0.16 | 0.36 | 2 | -0.88 | 1 | 3 |
| VEGFR2 homodimer/Frs2 | 0.043 | 0.042 | -10000 | 0 | -0.57 | 2 | 2 |
| CAV1 | -0.009 | 0.14 | -10000 | 0 | -0.59 | 30 | 30 |
| CALM1 | 0.028 | 0.008 | -10000 | 0 | -10000 | 0 | 0 |
| VEGFR2 homodimer/VEGFA homodimer/Frs2 | -0.11 | 0.19 | -10000 | 0 | -0.7 | 2 | 2 |
| endothelial cell proliferation | 0.003 | 0.16 | 0.49 | 18 | -0.47 | 2 | 20 |
| mol:Ca2+ | -0.1 | 0.17 | -10000 | 0 | -0.75 | 1 | 1 |
| VEGFR2 homodimer/VEGFA homodimer/IQGAP1/Rac | -0.085 | 0.18 | -10000 | 0 | -0.59 | 2 | 2 |
| RP11-342D11.1 | -0.11 | 0.16 | -10000 | 0 | -0.63 | 2 | 2 |
| CDH5 | 0.028 | 0.028 | -10000 | 0 | -0.59 | 1 | 1 |
| VEGFA homodimer | -0.11 | 0.19 | -10000 | 0 | -0.33 | 142 | 142 |
| SHC1 | 0.029 | 0.007 | -10000 | 0 | -10000 | 0 | 0 |
| SHC2 | 0.024 | 0.063 | -10000 | 0 | -0.61 | 5 | 5 |
| HRAS/GDP | -0.078 | 0.15 | -10000 | 0 | -0.6 | 2 | 2 |
| SH2D2A | -0.16 | 0.29 | -10000 | 0 | -0.59 | 160 | 160 |
| VEGFR2 homodimer/VEGFA homodimer/SHP1/eNOS | -0.024 | 0.14 | -10000 | 0 | -0.6 | 1 | 1 |
| VEGFR2 homodimer/VEGFA homodimer/TsAd | -0.22 | 0.24 | -10000 | 0 | -0.63 | 65 | 65 |
| VEGFR1 homodimer | 0.023 | 0.061 | -10000 | 0 | -0.59 | 5 | 5 |
| SHC/GRB2/SOS1 | -0.069 | 0.18 | -10000 | 0 | -0.73 | 1 | 1 |
| GRB10 | -0.095 | 0.16 | -10000 | 0 | -0.75 | 1 | 1 |
| PTPN11 | 0.029 | 0.006 | -10000 | 0 | -10000 | 0 | 0 |
| GRB2 | 0.029 | 0.005 | -10000 | 0 | -10000 | 0 | 0 |
| PAK1 | 0.03 | 0.003 | -10000 | 0 | -10000 | 0 | 0 |
| VEGFR2 homodimer/VEGFA homodimer/IQGAP1/Cadherin/beta catenin | -0.083 | 0.18 | -10000 | 0 | -0.75 | 2 | 2 |
| HRAS | 0.029 | 0.027 | -10000 | 0 | -0.59 | 1 | 1 |
| VEGF/Rho/ROCK1/Integrin Complex | -0.049 | 0.11 | -10000 | 0 | -0.41 | 14 | 14 |
| HIF1A | 0.025 | 0.042 | -10000 | 0 | -0.64 | 2 | 2 |
| FRS2 | 0.029 | 0.005 | -10000 | 0 | -10000 | 0 | 0 |
| oxygen and reactive oxygen species metabolic process | -0.085 | 0.18 | -10000 | 0 | -0.58 | 2 | 2 |
| mol:GTP | 0 | 0 | -10000 | 0 | -10000 | 0 | 0 |
| FLT4 | 0.023 | 0.013 | -10000 | 0 | -10000 | 0 | 0 |
| Nck/Pak | 0.041 | 0.025 | -10000 | 0 | -0.47 | 1 | 1 |
| VEGFR2 homodimer/VEGFA homodimer/Fyn | -0.11 | 0.19 | -10000 | 0 | -0.69 | 2 | 2 |
| mol:GDP | -0.076 | 0.16 | -10000 | 0 | -0.7 | 1 | 1 |
| mol:NADP | -0.02 | 0.13 | 0.47 | 5 | -0.49 | 1 | 6 |
| eNOS/Hsp90 | -0.014 | 0.12 | 0.37 | 2 | -0.45 | 1 | 3 |
| PIK3R1 | 0.026 | 0.031 | -10000 | 0 | -0.64 | 1 | 1 |
| mol:IP3 | -0.1 | 0.17 | -10000 | 0 | -0.76 | 1 | 1 |
| HIF1A/ARNT | 0.038 | 0.035 | -10000 | 0 | -0.47 | 2 | 2 |
| SHB | 0.029 | 0.006 | -10000 | 0 | -10000 | 0 | 0 |
| VEGFA | -0.24 | 0.3 | -10000 | 0 | -0.58 | 228 | 228 |
| VEGFC | 0.028 | 0.028 | -10000 | 0 | -0.59 | 1 | 1 |
| FAK1/Vinculin | -0.064 | 0.15 | 0.45 | 2 | -0.6 | 3 | 5 |
| mol:Ca ++ | 0 | 0 | -10000 | 0 | -10000 | 0 | 0 |
| RHOA | 0.021 | 0.014 | -10000 | 0 | -10000 | 0 | 0 |
| VEGFR2 homodimer/VEGFA homodimer/alphaV beta3 Integrin | -0.09 | 0.19 | -10000 | 0 | -0.67 | 2 | 2 |
| PTPN6 | 0.029 | 0.006 | -10000 | 0 | -10000 | 0 | 0 |
| EPAS1 | 0.037 | 0.034 | -10000 | 0 | -0.48 | 2 | 2 |
| mol:L-citrulline | -0.02 | 0.13 | 0.47 | 5 | -0.49 | 1 | 6 |
| ITGAV | 0.029 | 0.007 | -10000 | 0 | -10000 | 0 | 0 |
| PIK3CA | 0.027 | 0.03 | -10000 | 0 | -0.64 | 1 | 1 |
| VEGFR2 homodimer/VEGFA homodimer/Frs2/GRB2 | -0.09 | 0.19 | -10000 | 0 | -0.67 | 2 | 2 |
| VEGFR2 homodimer/VEGFA homodimer | -0.1 | 0.19 | -10000 | 0 | -0.69 | 2 | 2 |
| VEGFR2/3 heterodimer | 0.033 | 0.04 | -10000 | 0 | -0.49 | 2 | 2 |
| VEGFB | 0.03 | 0.003 | -10000 | 0 | -10000 | 0 | 0 |
| MAPK11 | -0.096 | 0.16 | 0.35 | 1 | -0.66 | 2 | 3 |
| VEGFR2 homodimer | 0.032 | 0.045 | -10000 | 0 | -0.65 | 2 | 2 |
| FLT1 | 0.023 | 0.061 | -10000 | 0 | -0.59 | 5 | 5 |
| NEDD4 | 0.029 | 0.041 | -10000 | 0 | -0.63 | 2 | 2 |
| MAPK3 | -0.095 | 0.15 | 0.35 | 2 | -0.72 | 1 | 3 |
| MAPK1 | -0.093 | 0.16 | 0.35 | 2 | -0.65 | 1 | 3 |
| VEGFA145/NRP2 | -0.17 | 0.24 | -10000 | 0 | -0.43 | 226 | 226 |
| VEGFR1/2 heterodimer | 0.04 | 0.057 | -10000 | 0 | -0.42 | 7 | 7 |
| KDR | 0.032 | 0.045 | -10000 | 0 | -0.65 | 2 | 2 |
| VEGFA165/NRP1/VEGFR2 homodimer | -0.088 | 0.18 | -10000 | 0 | -0.88 | 2 | 2 |
| SRC | 0.029 | 0.006 | -10000 | 0 | -10000 | 0 | 0 |
| platelet activating factor biosynthetic process | -0.084 | 0.17 | 0.43 | 5 | -0.7 | 1 | 6 |
| PI3K | -0.052 | 0.14 | -10000 | 0 | -0.58 | 3 | 3 |
| VEGFR2 homodimer/VEGFA homodimer/NCK1 | -0.11 | 0.19 | -10000 | 0 | -0.53 | 3 | 3 |
| FES | -0.1 | 0.17 | -10000 | 0 | -0.78 | 2 | 2 |
| GAB1 | -0.059 | 0.14 | -10000 | 0 | -0.79 | 1 | 1 |
| VEGFR2 homodimer/VEGFA homodimer/Src | -0.11 | 0.19 | -10000 | 0 | -0.62 | 2 | 2 |
| CTNNB1 | 0.021 | 0.014 | -10000 | 0 | -10000 | 0 | 0 |
| SOS1 | 0.029 | 0.005 | -10000 | 0 | -10000 | 0 | 0 |
| ARNT | 0.029 | 0.007 | -10000 | 0 | -10000 | 0 | 0 |
| eNOS/Caveolin-1 | -0.034 | 0.12 | 0.33 | 1 | -0.44 | 3 | 4 |
| VEGFR2 homodimer/VEGFA homodimer/Yes | -0.1 | 0.19 | -10000 | 0 | -0.7 | 2 | 2 |
| PI3K/GAB1 | -0.016 | 0.12 | -10000 | 0 | -0.49 | 1 | 1 |
| VEGFR2 homodimer/VEGFA homodimer/Frs2/Nck/Pak | -0.079 | 0.18 | -10000 | 0 | -0.77 | 1 | 1 |
| PRKACA | 0.03 | 0.002 | -10000 | 0 | -10000 | 0 | 0 |
| VEGFR2/3 heterodimer/VEGFC homodimer | 0.044 | 0.046 | -10000 | 0 | -0.55 | 1 | 1 |
| HSP90AA1 | 0.028 | 0.008 | -10000 | 0 | -10000 | 0 | 0 |
| CDC42 | -0.1 | 0.17 | -10000 | 0 | -0.92 | 1 | 1 |
| actin cytoskeleton reorganization | -0.22 | 0.23 | -10000 | 0 | -0.62 | 65 | 65 |
| PTK2 | -0.077 | 0.14 | -10000 | 0 | -0.55 | 5 | 5 |
| EDG1 | -0.11 | 0.16 | -10000 | 0 | -0.63 | 2 | 2 |
| mol:DAG | -0.1 | 0.17 | -10000 | 0 | -0.76 | 1 | 1 |
| CaM/Ca2+ | -0.086 | 0.16 | -10000 | 0 | -0.69 | 1 | 1 |
| MAP2K3 | -0.098 | 0.16 | 0.39 | 1 | -0.74 | 1 | 2 |
| VEGFR2 homodimer/VEGFA homodimer/GRB10/NEDD4 | -0.077 | 0.19 | -10000 | 0 | -0.79 | 1 | 1 |
| PLCG1 | -0.1 | 0.17 | -10000 | 0 | -0.78 | 1 | 1 |
| VEGFR2 homodimer/VEGFA homodimer/Src/Shb | -0.09 | 0.19 | -10000 | 0 | -0.8 | 1 | 1 |
| IQGAP1 | 0.03 | 0.004 | -10000 | 0 | -10000 | 0 | 0 |
| YES1 | 0.03 | 0.004 | -10000 | 0 | -10000 | 0 | 0 |
| VEGFR2 homodimer/VEGFA homodimer/SHP2 | -0.11 | 0.19 | -10000 | 0 | -0.7 | 2 | 2 |
| VEGFR2 homodimer/VEGFA homodimer/SHP1 | -0.11 | 0.19 | -10000 | 0 | -0.7 | 2 | 2 |
| cell migration | -0.033 | 0.14 | 0.43 | 3 | -0.53 | 3 | 6 |
| mol:PI-3-4-5-P3 | -0.048 | 0.13 | -10000 | 0 | -0.53 | 3 | 3 |
| FYN | 0.028 | 0.008 | -10000 | 0 | -10000 | 0 | 0 |
| VEGFB/NRP1 | -0.092 | 0.16 | -10000 | 0 | -0.84 | 1 | 1 |
| mol:NO | -0.02 | 0.13 | 0.47 | 5 | -0.49 | 1 | 6 |
| PXN | 0.029 | 0.006 | -10000 | 0 | -10000 | 0 | 0 |
| HRAS/GTP | -0.089 | 0.14 | -10000 | 0 | -0.6 | 2 | 2 |
| VEGFR2 homodimer/VEGFA homodimer/GRB10 | -0.091 | 0.17 | -10000 | 0 | -0.79 | 1 | 1 |
| VHL | 0.021 | 0.021 | -10000 | 0 | -0.32 | 1 | 1 |
| ITGB3 | 0.025 | 0.051 | -10000 | 0 | -0.64 | 3 | 3 |
| NOS3 | -0.025 | 0.14 | 0.48 | 5 | -0.56 | 1 | 6 |
| VEGFR2 homodimer/VEGFA homodimer/Sck | -0.11 | 0.19 | -10000 | 0 | -0.61 | 4 | 4 |
| RAC1 | 0.027 | 0.009 | -10000 | 0 | -10000 | 0 | 0 |
| PRKCA | -0.096 | 0.16 | -10000 | 0 | -0.71 | 1 | 1 |
| PRKCB | -0.098 | 0.15 | -10000 | 0 | -0.64 | 2 | 2 |
| VCL | 0.029 | 0.006 | -10000 | 0 | -10000 | 0 | 0 |
| VEGFA165/NRP1 | -0.1 | 0.18 | -10000 | 0 | -0.65 | 2 | 2 |
| VEGFR1/2 heterodimer/VEGFA homodimer | -0.11 | 0.2 | -10000 | 0 | -0.65 | 6 | 6 |
| VEGFA165/NRP2 | -0.17 | 0.24 | -10000 | 0 | -0.43 | 226 | 226 |
| MAPKKK cascade | -0.064 | 0.15 | 0.4 | 1 | -0.53 | 2 | 3 |
| NRP2 | 0.02 | 0.072 | -10000 | 0 | -0.59 | 7 | 7 |
| VEGFC homodimer | 0.028 | 0.028 | -10000 | 0 | -0.59 | 1 | 1 |
| NCK1 | 0.027 | 0.03 | -10000 | 0 | -0.64 | 1 | 1 |
| ROCK1 | 0.03 | 0.004 | -10000 | 0 | -10000 | 0 | 0 |
| FAK1/Paxillin | -0.064 | 0.15 | 0.45 | 2 | -0.68 | 2 | 4 |
| MAP3K13 | -0.1 | 0.17 | -10000 | 0 | -0.78 | 1 | 1 |
| PDPK1 | -0.046 | 0.12 | 0.29 | 1 | -0.56 | 3 | 4 |
Figure S83. Get High-res Image This plot shows pathway concept perturbations across all samples against a permutation model. The concepts along the x-axis are sorted by lowest to highest mean activity for the real patient samples. Mean inferred activities are plotted along the y-axis as a colored band showing the average level and one standard deviation range. Real samples are shown in red and permuted samples in black.
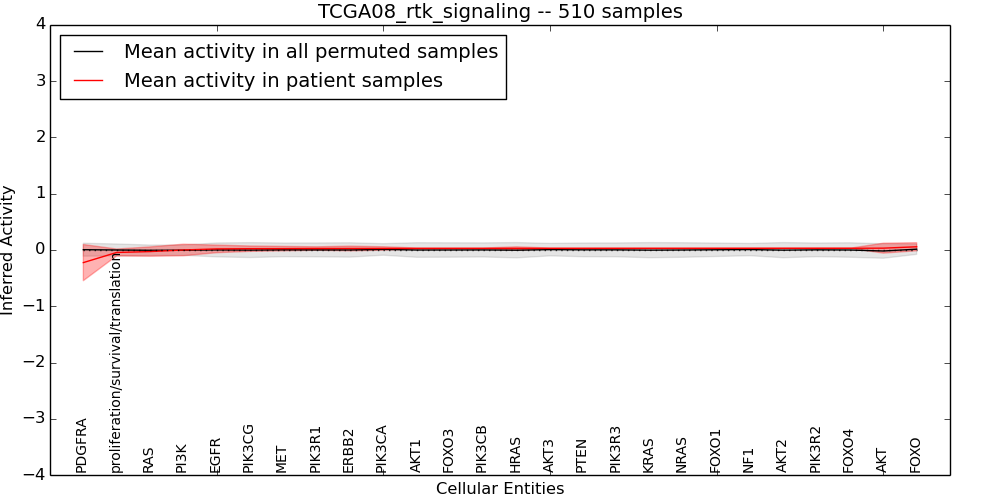
Table S83. Get Full Table This table displays mean, standard deviation, and perturbation statistics for Inferred Pathway Levels (IPLs). A mean perturbation of -9999 implies that the IPLs across all the real samples did not differ enough from the IPLs generated by a background model of permuted samples (> 1 Std.Dev from the permuted sample IPLs).
| Entity | Mean | Std.Dev | Mean.of.Up.Perturbations | Number.of.Up.Perturbations | Mean.of.Down.Perturbations | Number.of.Down.Perturbations | Number.of.Total.Perturbations |
|---|---|---|---|---|---|---|---|
| PDGFRA | -0.22 | 0.32 | -10000 | 0 | -0.63 | 196 | 196 |
| HRAS | 0.029 | 0.027 | -10000 | 0 | -0.59 | 1 | 1 |
| EGFR | 0.02 | 0.068 | -10000 | 0 | -0.6 | 6 | 6 |
| AKT | 0.033 | 0.088 | 0.28 | 24 | -10000 | 0 | 24 |
| FOXO3 | 0.028 | 0.008 | -10000 | 0 | -10000 | 0 | 0 |
| AKT1 | 0.028 | 0.008 | -10000 | 0 | -10000 | 0 | 0 |
| FOXO1 | 0.029 | 0.005 | -10000 | 0 | -10000 | 0 | 0 |
| AKT3 | 0.029 | 0.007 | -10000 | 0 | -10000 | 0 | 0 |
| FOXO4 | 0.03 | 0.001 | -10000 | 0 | -10000 | 0 | 0 |
| MET | 0.024 | 0.04 | -10000 | 0 | -0.59 | 2 | 2 |
| PIK3CA | 0.027 | 0.03 | -10000 | 0 | -0.64 | 1 | 1 |
| PIK3CB | 0.029 | 0.007 | -10000 | 0 | -10000 | 0 | 0 |
| NRAS | 0.029 | 0.005 | -10000 | 0 | -10000 | 0 | 0 |
| PIK3CG | 0.023 | 0.048 | -10000 | 0 | -0.59 | 3 | 3 |
| PIK3R3 | 0.029 | 0.006 | -10000 | 0 | -10000 | 0 | 0 |
| PIK3R2 | 0.03 | 0.003 | -10000 | 0 | -10000 | 0 | 0 |
| NF1 | 0.03 | 0.005 | -10000 | 0 | -10000 | 0 | 0 |
| RAS | -0.028 | 0.083 | 0.18 | 2 | -0.27 | 3 | 5 |
| ERBB2 | 0.027 | 0.042 | -10000 | 0 | -0.64 | 2 | 2 |
| proliferation/survival/translation | -0.044 | 0.062 | 0.26 | 8 | -0.23 | 1 | 9 |
| PI3K | 0 | 0.1 | 0.3 | 24 | -0.26 | 5 | 29 |
| PIK3R1 | 0.026 | 0.031 | -10000 | 0 | -0.64 | 1 | 1 |
| KRAS | 0.029 | 0.006 | -10000 | 0 | -10000 | 0 | 0 |
| FOXO | 0.057 | 0.072 | 0.27 | 23 | -10000 | 0 | 23 |
| AKT2 | 0.03 | 0.004 | -10000 | 0 | -10000 | 0 | 0 |
| PTEN | 0.029 | 0.006 | -10000 | 0 | -10000 | 0 | 0 |
Figure S84. Get High-res Image This plot shows pathway concept perturbations across all samples against a permutation model. The concepts along the x-axis are sorted by lowest to highest mean activity for the real patient samples. Mean inferred activities are plotted along the y-axis as a colored band showing the average level and one standard deviation range. Real samples are shown in red and permuted samples in black.
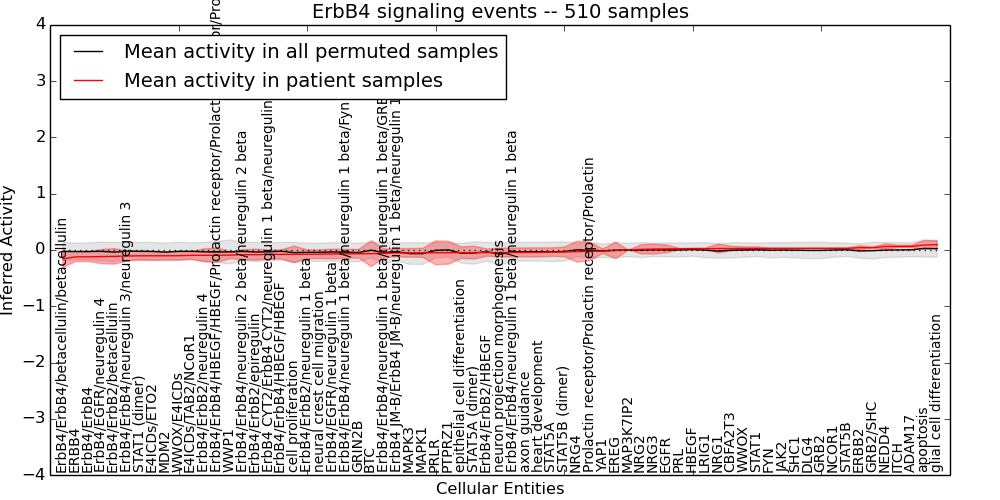
Table S84. Get Full Table This table displays mean, standard deviation, and perturbation statistics for Inferred Pathway Levels (IPLs). A mean perturbation of -9999 implies that the IPLs across all the real samples did not differ enough from the IPLs generated by a background model of permuted samples (> 1 Std.Dev from the permuted sample IPLs).
| Entity | Mean | Std.Dev | Mean.of.Up.Perturbations | Number.of.Up.Perturbations | Mean.of.Down.Perturbations | Number.of.Down.Perturbations | Number.of.Total.Perturbations |
|---|---|---|---|---|---|---|---|
| ErbB4/ErbB4/HBEGF/HBEGF | -0.078 | 0.082 | -10000 | 0 | -0.38 | 1 | 1 |
| epithelial cell differentiation | -0.048 | 0.1 | -10000 | 0 | -0.46 | 3 | 3 |
| ITCH | 0.063 | 0.02 | -10000 | 0 | -10000 | 0 | 0 |
| WWP1 | -0.091 | 0.064 | -10000 | 0 | -10000 | 0 | 0 |
| FYN | 0.028 | 0.008 | -10000 | 0 | -10000 | 0 | 0 |
| EGFR | 0.02 | 0.068 | -10000 | 0 | -0.6 | 6 | 6 |
| PRL | 0.022 | 0.007 | -10000 | 0 | -10000 | 0 | 0 |
| neuron projection morphogenesis | -0.047 | 0.078 | 0.45 | 1 | -0.52 | 1 | 2 |
| PTPRZ1 | -0.048 | 0.2 | -10000 | 0 | -0.63 | 56 | 56 |
| ErbB4/ErbB4/neuregulin 1 beta/neuregulin 1 beta/GRB2/SHC | -0.057 | 0.078 | -10000 | 0 | -0.57 | 1 | 1 |
| ErbB4 CYT2/ErbB4 CYT2/neuregulin 1 beta/neuregulin 1 beta | -0.078 | 0.082 | -10000 | 0 | -0.46 | 10 | 10 |
| ADAM17 | 0.064 | 0.02 | -10000 | 0 | -10000 | 0 | 0 |
| ErbB4/ErbB4 | -0.12 | 0.084 | -10000 | 0 | -0.43 | 1 | 1 |
| ErbB4/ErbB4/neuregulin 3/neuregulin 3 | -0.11 | 0.091 | -10000 | 0 | -0.46 | 9 | 9 |
| NCOR1 | 0.029 | 0.005 | -10000 | 0 | -10000 | 0 | 0 |
| ErbB4/ErbB4/neuregulin 1 beta/neuregulin 1 beta/Fyn | -0.068 | 0.08 | -10000 | 0 | -0.46 | 8 | 8 |
| GRIN2B | -0.066 | 0.076 | -10000 | 0 | -0.44 | 8 | 8 |
| ErbB4/ErbB2/betacellulin | -0.11 | 0.14 | -10000 | 0 | -0.44 | 58 | 58 |
| STAT1 | 0.028 | 0.028 | -10000 | 0 | -0.59 | 1 | 1 |
| HBEGF | 0.023 | 0.013 | -10000 | 0 | -10000 | 0 | 0 |
| PRLR | -0.05 | 0.21 | -10000 | 0 | -0.64 | 59 | 59 |
| E4ICDs/ETO2 | -0.1 | 0.079 | -10000 | 0 | -0.45 | 3 | 3 |
| axon guidance | -0.043 | 0.081 | -10000 | 0 | -10000 | 0 | 0 |
| NEDD4 | 0.062 | 0.046 | -10000 | 0 | -0.62 | 2 | 2 |
| Prolactin receptor/Prolactin receptor/Prolactin | -0.026 | 0.16 | -10000 | 0 | -0.48 | 59 | 59 |
| CBFA2T3 | 0.027 | 0.039 | -10000 | 0 | -0.59 | 2 | 2 |
| ErbB4/ErbB2/HBEGF | -0.047 | 0.064 | -10000 | 0 | -0.44 | 1 | 1 |
| MAPK3 | -0.051 | 0.078 | 0.45 | 1 | -0.54 | 1 | 2 |
| STAT1 (dimer) | -0.1 | 0.076 | -10000 | 0 | -0.38 | 1 | 1 |
| MAPK1 | -0.05 | 0.08 | 0.38 | 2 | -0.54 | 1 | 3 |
| JAK2 | 0.029 | 0.007 | -10000 | 0 | -10000 | 0 | 0 |
| ErbB4/ErbB2/neuregulin 1 beta | -0.075 | 0.078 | -10000 | 0 | -0.45 | 9 | 9 |
| NRG1 | 0.026 | 0.08 | -10000 | 0 | -0.46 | 12 | 12 |
| NRG3 | 0.017 | 0.087 | -10000 | 0 | -0.6 | 10 | 10 |
| NRG2 | 0.012 | 0.082 | -10000 | 0 | -0.59 | 9 | 9 |
| NRG4 | -0.029 | 0.19 | -10000 | 0 | -0.63 | 45 | 45 |
| heart development | -0.043 | 0.081 | -10000 | 0 | -10000 | 0 | 0 |
| neural crest cell migration | -0.074 | 0.078 | -10000 | 0 | -0.45 | 9 | 9 |
| ERBB2 | 0.042 | 0.035 | -10000 | 0 | -0.47 | 2 | 2 |
| WWOX/E4ICDs | -0.1 | 0.078 | -10000 | 0 | -0.41 | 2 | 2 |
| SHC1 | 0.029 | 0.007 | -10000 | 0 | -10000 | 0 | 0 |
| ErbB4/EGFR/neuregulin 4 | -0.12 | 0.13 | -10000 | 0 | -0.47 | 36 | 36 |
| apoptosis | 0.088 | 0.079 | 0.43 | 3 | -10000 | 0 | 3 |
| ErbB4/ErbB4/neuregulin 2 beta/neuregulin 2 beta | -0.084 | 0.089 | -10000 | 0 | -0.44 | 5 | 5 |
| ErbB4/ErbB2/epiregulin | -0.083 | 0.097 | -10000 | 0 | -0.41 | 22 | 22 |
| ErbB4/ErbB4/betacellulin/betacellulin | -0.16 | 0.15 | -10000 | 0 | -0.49 | 70 | 70 |
| ErbB4/ErbB4/HBEGF/HBEGF/Prolactin receptor/Prolactin receptor/Prolactin/JAK2 | -0.093 | 0.13 | -10000 | 0 | -0.45 | 30 | 30 |
| MDM2 | -0.1 | 0.071 | -10000 | 0 | -0.38 | 1 | 1 |
| ErbB4 JM-B/ErbB4 JM-B/neuregulin 1 beta/neuregulin 1 beta | -0.051 | 0.07 | -10000 | 0 | -0.44 | 8 | 8 |
| STAT5A | -0.037 | 0.076 | -10000 | 0 | -10000 | 0 | 0 |
| ErbB4/EGFR/neuregulin 1 beta | -0.071 | 0.086 | -10000 | 0 | -0.44 | 13 | 13 |
| DLG4 | 0.029 | 0.005 | -10000 | 0 | -10000 | 0 | 0 |
| GRB2/SHC | 0.042 | 0.011 | -10000 | 0 | -10000 | 0 | 0 |
| E4ICDs/TAB2/NCoR1 | -0.095 | 0.068 | -10000 | 0 | -0.35 | 1 | 1 |
| STAT5A (dimer) | -0.047 | 0.12 | -10000 | 0 | -0.49 | 3 | 3 |
| MAP3K7IP2 | 0 | 0 | -10000 | 0 | -10000 | 0 | 0 |
| STAT5B (dimer) | -0.035 | 0.085 | 0.35 | 1 | -10000 | 0 | 1 |
| LRIG1 | 0.023 | 0.013 | -10000 | 0 | -10000 | 0 | 0 |
| EREG | -0.009 | 0.15 | -10000 | 0 | -0.59 | 31 | 31 |
| BTC | -0.065 | 0.23 | -10000 | 0 | -0.62 | 74 | 74 |
| ErbB4/ErbB4/neuregulin 1 beta/neuregulin 1 beta | -0.044 | 0.08 | -10000 | 0 | -10000 | 0 | 0 |
| ERBB4 | -0.12 | 0.084 | -10000 | 0 | -0.43 | 1 | 1 |
| STAT5B | 0.03 | 0.005 | -10000 | 0 | -10000 | 0 | 0 |
| YAP1 | -0.02 | 0.039 | -10000 | 0 | -0.53 | 2 | 2 |
| GRB2 | 0.029 | 0.005 | -10000 | 0 | -10000 | 0 | 0 |
| ErbB4/ErbB2/neuregulin 4 | -0.095 | 0.12 | -10000 | 0 | -0.44 | 37 | 37 |
| glial cell differentiation | 0.094 | 0.068 | 0.35 | 1 | -10000 | 0 | 1 |
| WWOX | 0.028 | 0.028 | -10000 | 0 | -0.59 | 1 | 1 |
| cell proliferation | -0.077 | 0.15 | 0.35 | 1 | -0.57 | 15 | 16 |
Figure S85. Get High-res Image This plot shows pathway concept perturbations across all samples against a permutation model. The concepts along the x-axis are sorted by lowest to highest mean activity for the real patient samples. Mean inferred activities are plotted along the y-axis as a colored band showing the average level and one standard deviation range. Real samples are shown in red and permuted samples in black.
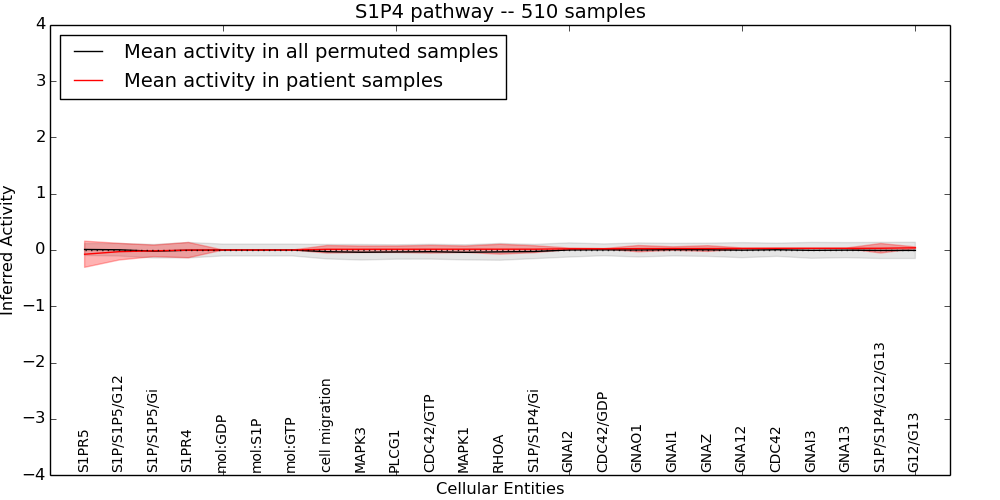
Table S85. Get Full Table This table displays mean, standard deviation, and perturbation statistics for Inferred Pathway Levels (IPLs). A mean perturbation of -9999 implies that the IPLs across all the real samples did not differ enough from the IPLs generated by a background model of permuted samples (> 1 Std.Dev from the permuted sample IPLs).
| Entity | Mean | Std.Dev | Mean.of.Up.Perturbations | Number.of.Up.Perturbations | Mean.of.Down.Perturbations | Number.of.Down.Perturbations | Number.of.Total.Perturbations |
|---|---|---|---|---|---|---|---|
| mol:S1P | 0 | 0 | -10000 | 0 | -10000 | 0 | 0 |
| GNAO1 | 0.024 | 0.056 | -10000 | 0 | -0.6 | 4 | 4 |
| CDC42/GTP | 0.014 | 0.068 | -10000 | 0 | -0.33 | 3 | 3 |
| PLCG1 | 0.013 | 0.057 | -10000 | 0 | -0.34 | 3 | 3 |
| mol:GTP | 0 | 0 | -10000 | 0 | -10000 | 0 | 0 |
| GNAI2 | 0.021 | 0.014 | -10000 | 0 | -10000 | 0 | 0 |
| GNAI3 | 0.029 | 0.005 | -10000 | 0 | -10000 | 0 | 0 |
| G12/G13 | 0.039 | 0.015 | -10000 | 0 | -10000 | 0 | 0 |
| cell migration | 0.013 | 0.067 | -10000 | 0 | -0.32 | 3 | 3 |
| S1PR5 | -0.075 | 0.23 | -10000 | 0 | -0.59 | 87 | 87 |
| S1PR4 | -0.002 | 0.14 | -10000 | 0 | -0.59 | 26 | 26 |
| MAPK3 | 0.013 | 0.057 | -10000 | 0 | -0.34 | 3 | 3 |
| MAPK1 | 0.014 | 0.057 | -10000 | 0 | -0.34 | 3 | 3 |
| S1P/S1P5/Gi | -0.015 | 0.1 | -10000 | 0 | -0.34 | 25 | 25 |
| GNAI1 | 0.026 | 0.031 | -10000 | 0 | -0.64 | 1 | 1 |
| CDC42/GDP | 0.021 | 0.005 | -10000 | 0 | -10000 | 0 | 0 |
| S1P/S1P5/G12 | -0.03 | 0.15 | -10000 | 0 | -0.37 | 78 | 78 |
| RHOA | 0.014 | 0.087 | 0.36 | 4 | -10000 | 0 | 4 |
| S1P/S1P4/Gi | 0.014 | 0.061 | -10000 | 0 | -0.35 | 4 | 4 |
| mol:GDP | 0 | 0 | -10000 | 0 | -10000 | 0 | 0 |
| GNAZ | 0.026 | 0.051 | -10000 | 0 | -0.64 | 3 | 3 |
| S1P/S1P4/G12/G13 | 0.031 | 0.085 | -10000 | 0 | -0.33 | 24 | 24 |
| GNA12 | 0.027 | 0.009 | -10000 | 0 | -10000 | 0 | 0 |
| GNA13 | 0.029 | 0.005 | -10000 | 0 | -10000 | 0 | 0 |
| CDC42 | 0.029 | 0.006 | -10000 | 0 | -10000 | 0 | 0 |
Figure S86. Get High-res Image This plot shows pathway concept perturbations across all samples against a permutation model. The concepts along the x-axis are sorted by lowest to highest mean activity for the real patient samples. Mean inferred activities are plotted along the y-axis as a colored band showing the average level and one standard deviation range. Real samples are shown in red and permuted samples in black.
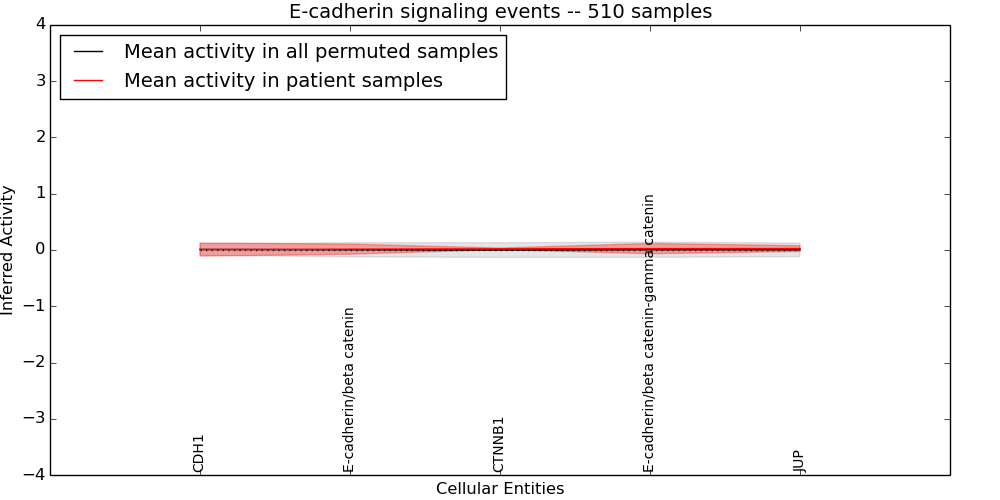
Table S86. Get Full Table This table displays mean, standard deviation, and perturbation statistics for Inferred Pathway Levels (IPLs). A mean perturbation of -9999 implies that the IPLs across all the real samples did not differ enough from the IPLs generated by a background model of permuted samples (> 1 Std.Dev from the permuted sample IPLs).
| Entity | Mean | Std.Dev | Mean.of.Up.Perturbations | Number.of.Up.Perturbations | Mean.of.Down.Perturbations | Number.of.Down.Perturbations | Number.of.Total.Perturbations |
|---|---|---|---|---|---|---|---|
| E-cadherin/beta catenin-gamma catenin | 0.025 | 0.092 | -9999 | 0 | -0.42 | 18 | 18 |
| E-cadherin/beta catenin | 0.015 | 0.09 | -9999 | 0 | -0.47 | 16 | 16 |
| CTNNB1 | 0.021 | 0.014 | -9999 | 0 | -10000 | 0 | 0 |
| JUP | 0.026 | 0.051 | -9999 | 0 | -0.64 | 3 | 3 |
| CDH1 | 0.007 | 0.12 | -9999 | 0 | -0.62 | 17 | 17 |
Figure S87. Get High-res Image This plot shows pathway concept perturbations across all samples against a permutation model. The concepts along the x-axis are sorted by lowest to highest mean activity for the real patient samples. Mean inferred activities are plotted along the y-axis as a colored band showing the average level and one standard deviation range. Real samples are shown in red and permuted samples in black.
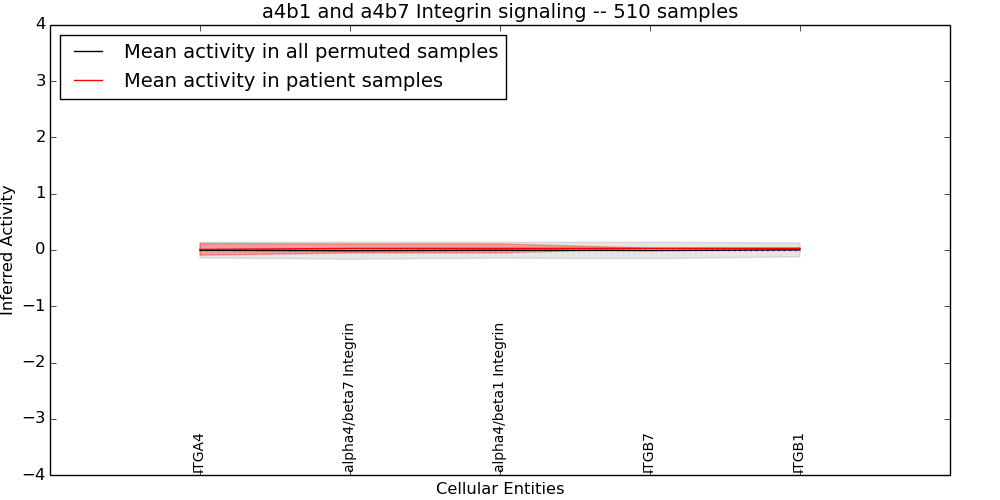
Table S87. Get Full Table This table displays mean, standard deviation, and perturbation statistics for Inferred Pathway Levels (IPLs). A mean perturbation of -9999 implies that the IPLs across all the real samples did not differ enough from the IPLs generated by a background model of permuted samples (> 1 Std.Dev from the permuted sample IPLs).
| Entity | Mean | Std.Dev | Mean.of.Up.Perturbations | Number.of.Up.Perturbations | Mean.of.Down.Perturbations | Number.of.Down.Perturbations | Number.of.Total.Perturbations |
|---|---|---|---|---|---|---|---|
| ITGB1 | 0.03 | 0.004 | -9999 | 0 | -10000 | 0 | 0 |
| ITGB7 | 0.029 | 0.005 | -9999 | 0 | -10000 | 0 | 0 |
| ITGA4 | 0.011 | 0.1 | -9999 | 0 | -0.59 | 15 | 15 |
| alpha4/beta7 Integrin | 0.028 | 0.081 | -9999 | 0 | -0.43 | 15 | 15 |
| alpha4/beta1 Integrin | 0.028 | 0.081 | -9999 | 0 | -0.43 | 15 | 15 |
Figure S88. Get High-res Image This plot shows pathway concept perturbations across all samples against a permutation model. The concepts along the x-axis are sorted by lowest to highest mean activity for the real patient samples. Mean inferred activities are plotted along the y-axis as a colored band showing the average level and one standard deviation range. Real samples are shown in red and permuted samples in black.
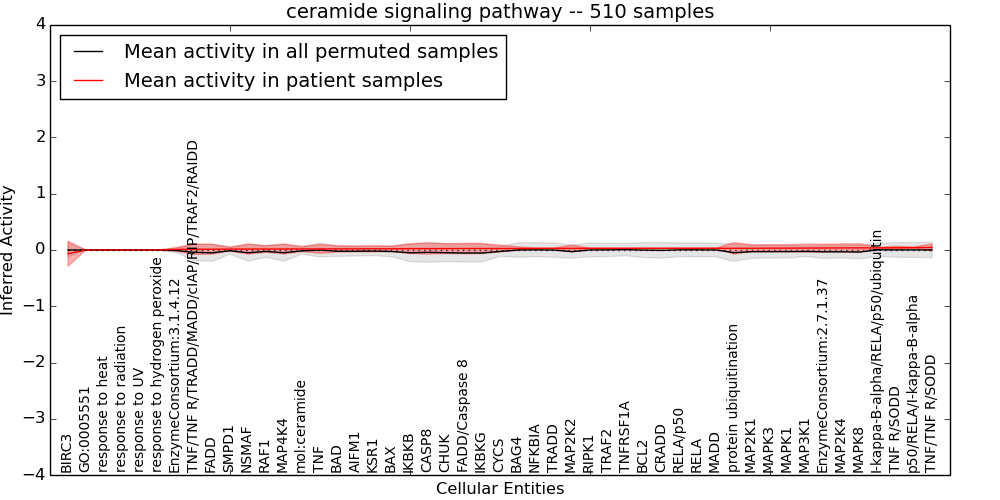
Table S88. Get Full Table This table displays mean, standard deviation, and perturbation statistics for Inferred Pathway Levels (IPLs). A mean perturbation of -9999 implies that the IPLs across all the real samples did not differ enough from the IPLs generated by a background model of permuted samples (> 1 Std.Dev from the permuted sample IPLs).
| Entity | Mean | Std.Dev | Mean.of.Up.Perturbations | Number.of.Up.Perturbations | Mean.of.Down.Perturbations | Number.of.Down.Perturbations | Number.of.Total.Perturbations |
|---|---|---|---|---|---|---|---|
| MAP4K4 | 0.018 | 0.087 | -10000 | 0 | -0.48 | 5 | 5 |
| BAG4 | 0.026 | 0.031 | -10000 | 0 | -0.64 | 1 | 1 |
| BAD | 0.02 | 0.056 | 0.38 | 5 | -0.29 | 2 | 7 |
| NFKBIA | 0.028 | 0.008 | -10000 | 0 | -10000 | 0 | 0 |
| BIRC3 | -0.066 | 0.22 | -10000 | 0 | -0.59 | 79 | 79 |
| BAX | 0.022 | 0.049 | 0.26 | 10 | -10000 | 0 | 10 |
| EnzymeConsortium:3.1.4.12 | 0.011 | 0.032 | 0.13 | 11 | -0.12 | 3 | 14 |
| IKBKB | 0.024 | 0.086 | 0.33 | 3 | -0.52 | 3 | 6 |
| MAP2K2 | 0.029 | 0.06 | 0.3 | 9 | -0.28 | 1 | 10 |
| MAP2K1 | 0.03 | 0.062 | 0.34 | 8 | -10000 | 0 | 8 |
| SMPD1 | 0.016 | 0.035 | 0.21 | 6 | -0.16 | 1 | 7 |
| GO:0005551 | 0 | 0 | -10000 | 0 | -10000 | 0 | 0 |
| FADD/Caspase 8 | 0.026 | 0.093 | 0.35 | 1 | -0.53 | 4 | 5 |
| MAP2K4 | 0.037 | 0.072 | 0.25 | 27 | -10000 | 0 | 27 |
| protein ubiquitination | 0.03 | 0.1 | 0.4 | 8 | -0.54 | 3 | 11 |
| EnzymeConsortium:2.7.1.37 | 0.036 | 0.07 | 0.38 | 8 | -10000 | 0 | 8 |
| response to UV | 0 | 0.001 | 0.004 | 18 | -0.003 | 1 | 19 |
| RAF1 | 0.017 | 0.058 | 0.28 | 10 | -0.25 | 3 | 13 |
| CRADD | 0.029 | 0.005 | -10000 | 0 | -10000 | 0 | 0 |
| mol:ceramide | 0.019 | 0.046 | 0.2 | 10 | -0.18 | 3 | 13 |
| I-kappa-B-alpha/RELA/p50/ubiquitin | 0.038 | 0.011 | -10000 | 0 | -10000 | 0 | 0 |
| MADD | 0.03 | 0.003 | -10000 | 0 | -10000 | 0 | 0 |
| MAP3K1 | 0.034 | 0.07 | 0.23 | 41 | -10000 | 0 | 41 |
| TRADD | 0.029 | 0.006 | -10000 | 0 | -10000 | 0 | 0 |
| RELA/p50 | 0.03 | 0.003 | -10000 | 0 | -10000 | 0 | 0 |
| MAPK3 | 0.033 | 0.06 | 0.29 | 11 | -10000 | 0 | 11 |
| MAPK1 | 0.033 | 0.061 | 0.29 | 11 | -10000 | 0 | 11 |
| p50/RELA/I-kappa-B-alpha | 0.042 | 0.012 | -10000 | 0 | -10000 | 0 | 0 |
| FADD | 0.014 | 0.088 | 0.35 | 1 | -0.48 | 5 | 6 |
| KSR1 | 0.022 | 0.056 | 0.27 | 9 | -0.25 | 5 | 14 |
| MAPK8 | 0.037 | 0.075 | 0.32 | 14 | -10000 | 0 | 14 |
| TRAF2 | 0.029 | 0.006 | -10000 | 0 | -10000 | 0 | 0 |
| response to radiation | 0 | 0.001 | 0.004 | 6 | -10000 | 0 | 6 |
| CHUK | 0.025 | 0.088 | 0.29 | 3 | -0.52 | 3 | 6 |
| TNF R/SODD | 0.039 | 0.027 | -10000 | 0 | -0.47 | 1 | 1 |
| TNF | 0.019 | 0.08 | -10000 | 0 | -0.61 | 8 | 8 |
| CYCS | 0.026 | 0.06 | 0.27 | 13 | -10000 | 0 | 13 |
| IKBKG | 0.026 | 0.091 | 0.3 | 4 | -0.52 | 3 | 7 |
| TNF/TNF R/TRADD/MADD/cIAP/RIP/TRAF2/RAIDD | 0.013 | 0.092 | -10000 | 0 | -0.51 | 5 | 5 |
| RELA | 0.03 | 0.003 | -10000 | 0 | -10000 | 0 | 0 |
| RIPK1 | 0.029 | 0.006 | -10000 | 0 | -10000 | 0 | 0 |
| AIFM1 | 0.021 | 0.052 | 0.25 | 11 | -0.19 | 1 | 12 |
| TNF/TNF R/SODD | 0.045 | 0.062 | -10000 | 0 | -0.39 | 9 | 9 |
| TNFRSF1A | 0.029 | 0.006 | -10000 | 0 | -10000 | 0 | 0 |
| response to heat | 0 | 0.001 | 0.004 | 6 | -10000 | 0 | 6 |
| CASP8 | 0.024 | 0.098 | -10000 | 0 | -0.61 | 11 | 11 |
| NSMAF | 0.017 | 0.09 | 0.31 | 2 | -0.5 | 4 | 6 |
| response to hydrogen peroxide | 0 | 0.001 | 0.004 | 18 | -0.003 | 1 | 19 |
| BCL2 | 0.029 | 0.005 | -10000 | 0 | -10000 | 0 | 0 |
Figure S89. Get High-res Image This plot shows pathway concept perturbations across all samples against a permutation model. The concepts along the x-axis are sorted by lowest to highest mean activity for the real patient samples. Mean inferred activities are plotted along the y-axis as a colored band showing the average level and one standard deviation range. Real samples are shown in red and permuted samples in black.
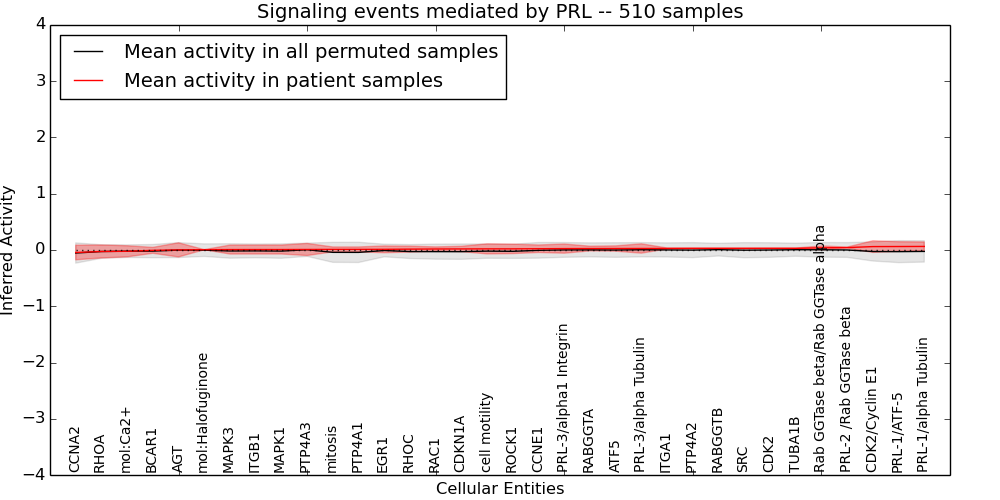
Table S89. Get Full Table This table displays mean, standard deviation, and perturbation statistics for Inferred Pathway Levels (IPLs). A mean perturbation of -9999 implies that the IPLs across all the real samples did not differ enough from the IPLs generated by a background model of permuted samples (> 1 Std.Dev from the permuted sample IPLs).
| Entity | Mean | Std.Dev | Mean.of.Up.Perturbations | Number.of.Up.Perturbations | Mean.of.Down.Perturbations | Number.of.Down.Perturbations | Number.of.Total.Perturbations |
|---|---|---|---|---|---|---|---|
| CCNE1 | 0.023 | 0.067 | -10000 | 0 | -0.59 | 6 | 6 |
| mol:Halofuginone | 0.006 | 0.001 | -10000 | 0 | -10000 | 0 | 0 |
| ITGA1 | 0.028 | 0.009 | -10000 | 0 | -10000 | 0 | 0 |
| CDKN1A | 0.019 | 0.047 | -10000 | 0 | -10000 | 0 | 0 |
| PRL-3/alpha Tubulin | 0.027 | 0.083 | -10000 | 0 | -0.43 | 16 | 16 |
| mol:Ca2+ | -0.023 | 0.099 | 0.26 | 16 | -0.44 | 20 | 36 |
| AGT | 0.002 | 0.12 | -10000 | 0 | -0.57 | 23 | 23 |
| CCNA2 | -0.045 | 0.13 | -10000 | 0 | -0.63 | 5 | 5 |
| TUBA1B | 0.029 | 0.005 | -10000 | 0 | -10000 | 0 | 0 |
| EGR1 | 0.012 | 0.06 | -10000 | 0 | -0.46 | 8 | 8 |
| CDK2/Cyclin E1 | 0.061 | 0.1 | -10000 | 0 | -0.58 | 4 | 4 |
| MAPK3 | 0.008 | 0.08 | -10000 | 0 | -0.43 | 16 | 16 |
| PRL-2 /Rab GGTase beta | 0.043 | 0.009 | -10000 | 0 | -10000 | 0 | 0 |
| MAPK1 | 0.008 | 0.08 | -10000 | 0 | -0.43 | 16 | 16 |
| PTP4A1 | 0.011 | 0.044 | -10000 | 0 | -10000 | 0 | 0 |
| PTP4A3 | 0.009 | 0.11 | -10000 | 0 | -0.59 | 16 | 16 |
| PTP4A2 | 0.029 | 0.006 | -10000 | 0 | -10000 | 0 | 0 |
| ITGB1 | 0.008 | 0.08 | -10000 | 0 | -0.43 | 16 | 16 |
| SRC | 0.029 | 0.006 | -10000 | 0 | -10000 | 0 | 0 |
| RAC1 | 0.018 | 0.037 | -10000 | 0 | -10000 | 0 | 0 |
| Rab GGTase beta/Rab GGTase alpha | 0.039 | 0.034 | -10000 | 0 | -0.47 | 2 | 2 |
| PRL-1/ATF-5 | 0.062 | 0.085 | -10000 | 0 | -10000 | 0 | 0 |
| RABGGTA | 0.026 | 0.042 | -10000 | 0 | -0.64 | 2 | 2 |
| BCAR1 | -0.006 | 0.053 | 0.26 | 16 | -0.49 | 1 | 17 |
| RHOC | 0.015 | 0.053 | -10000 | 0 | -0.33 | 6 | 6 |
| RHOA | -0.026 | 0.12 | -10000 | 0 | -0.29 | 72 | 72 |
| cell motility | 0.02 | 0.09 | 0.29 | 8 | -0.33 | 8 | 16 |
| PRL-1/alpha Tubulin | 0.063 | 0.079 | -10000 | 0 | -10000 | 0 | 0 |
| PRL-3/alpha1 Integrin | 0.025 | 0.081 | -10000 | 0 | -0.43 | 15 | 15 |
| ROCK1 | 0.02 | 0.084 | 0.27 | 6 | -0.31 | 6 | 12 |
| RABGGTB | 0.029 | 0.006 | -10000 | 0 | -10000 | 0 | 0 |
| CDK2 | 0.029 | 0.005 | -10000 | 0 | -10000 | 0 | 0 |
| mitosis | 0.011 | 0.043 | -10000 | 0 | -10000 | 0 | 0 |
| ATF5 | 0.026 | 0.047 | -10000 | 0 | -0.59 | 3 | 3 |
Figure S90. Get High-res Image This plot shows pathway concept perturbations across all samples against a permutation model. The concepts along the x-axis are sorted by lowest to highest mean activity for the real patient samples. Mean inferred activities are plotted along the y-axis as a colored band showing the average level and one standard deviation range. Real samples are shown in red and permuted samples in black.
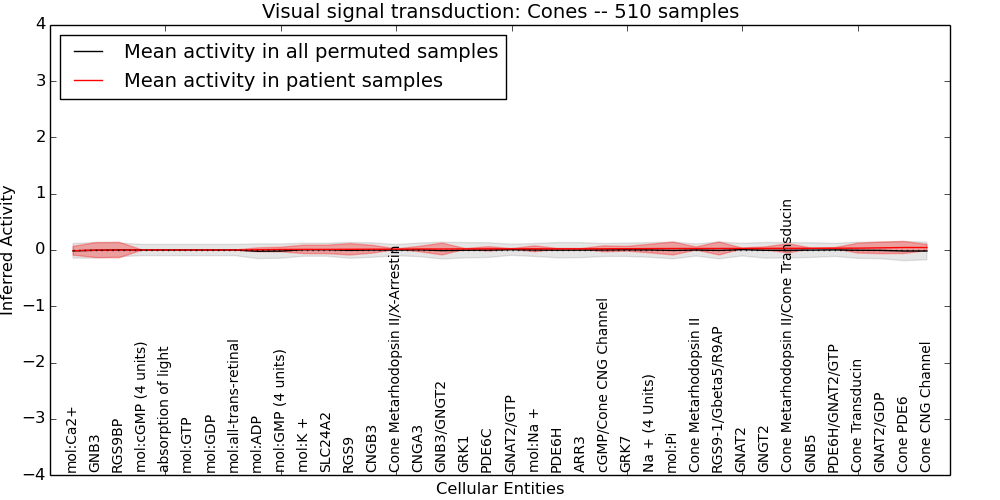
Table S90. Get Full Table This table displays mean, standard deviation, and perturbation statistics for Inferred Pathway Levels (IPLs). A mean perturbation of -9999 implies that the IPLs across all the real samples did not differ enough from the IPLs generated by a background model of permuted samples (> 1 Std.Dev from the permuted sample IPLs).
| Entity | Mean | Std.Dev | Mean.of.Up.Perturbations | Number.of.Up.Perturbations | Mean.of.Down.Perturbations | Number.of.Down.Perturbations | Number.of.Total.Perturbations |
|---|---|---|---|---|---|---|---|
| Cone Metarhodopsin II/Cone Transducin | 0.03 | 0.082 | -9999 | 0 | -0.32 | 26 | 26 |
| RGS9BP | 0 | 0.14 | -9999 | 0 | -0.64 | 23 | 23 |
| mol:GTP | 0 | 0 | -9999 | 0 | -10000 | 0 | 0 |
| GRK1 | 0.02 | 0.005 | -9999 | 0 | -10000 | 0 | 0 |
| mol:Na + | 0.021 | 0.052 | -9999 | 0 | -0.38 | 8 | 8 |
| mol:ADP | 0.004 | 0.035 | -9999 | 0 | -0.49 | 2 | 2 |
| GNAT2 | 0.028 | 0.006 | -9999 | 0 | -10000 | 0 | 0 |
| RGS9-1/Gbeta5/R9AP | 0.027 | 0.12 | -9999 | 0 | -0.39 | 34 | 34 |
| mol:GDP | 0 | 0 | -9999 | 0 | -10000 | 0 | 0 |
| PDE6H/GNAT2/GTP | 0.032 | 0.01 | -9999 | 0 | -10000 | 0 | 0 |
| GRK7 | 0.023 | 0.043 | -9999 | 0 | -0.65 | 2 | 2 |
| CNGB3 | 0.014 | 0.068 | -9999 | 0 | -0.61 | 6 | 6 |
| Cone Metarhodopsin II/X-Arrestin | 0.016 | 0.004 | -9999 | 0 | -10000 | 0 | 0 |
| mol:Ca2+ | -0.013 | 0.078 | -9999 | 0 | -0.43 | 12 | 12 |
| Cone PDE6 | 0.044 | 0.11 | -9999 | 0 | -10000 | 0 | 0 |
| Cone Metarhodopsin II | 0.027 | 0.028 | -9999 | 0 | -0.39 | 2 | 2 |
| Na + (4 Units) | 0.025 | 0.076 | -9999 | 0 | -0.43 | 12 | 12 |
| GNAT2/GDP | 0.038 | 0.1 | -9999 | 0 | -0.34 | 33 | 33 |
| GNB5 | 0.03 | 0.003 | -9999 | 0 | -10000 | 0 | 0 |
| mol:GMP (4 units) | 0.01 | 0.04 | -9999 | 0 | -0.33 | 2 | 2 |
| Cone Transducin | 0.033 | 0.087 | -9999 | 0 | -0.34 | 26 | 26 |
| SLC24A2 | 0.011 | 0.075 | -9999 | 0 | -0.62 | 7 | 7 |
| GNB3/GNGT2 | 0.018 | 0.1 | -9999 | 0 | -0.43 | 26 | 26 |
| GNB3 | -0.002 | 0.13 | -9999 | 0 | -0.59 | 25 | 25 |
| GNAT2/GTP | 0.021 | 0.005 | -9999 | 0 | -10000 | 0 | 0 |
| CNGA3 | 0.018 | 0.047 | -9999 | 0 | -0.59 | 3 | 3 |
| ARR3 | 0.021 | 0.005 | -9999 | 0 | -10000 | 0 | 0 |
| absorption of light | 0 | 0 | -9999 | 0 | -10000 | 0 | 0 |
| cGMP/Cone CNG Channel | 0.021 | 0.052 | -9999 | 0 | -0.38 | 8 | 8 |
| mol:Pi | 0.027 | 0.11 | -9999 | 0 | -0.39 | 34 | 34 |
| Cone CNG Channel | 0.044 | 0.055 | -9999 | 0 | -0.37 | 3 | 3 |
| mol:all-trans-retinal | 0 | 0 | -9999 | 0 | -10000 | 0 | 0 |
| mol:K + | 0.011 | 0.075 | -9999 | 0 | -0.62 | 7 | 7 |
| RGS9 | 0.013 | 0.1 | -9999 | 0 | -0.58 | 14 | 14 |
| PDE6C | 0.02 | 0.039 | -9999 | 0 | -0.59 | 2 | 2 |
| GNGT2 | 0.028 | 0.028 | -9999 | 0 | -0.59 | 1 | 1 |
| mol:cGMP (4 units) | 0 | 0 | -9999 | 0 | -10000 | 0 | 0 |
| PDE6H | 0.021 | 0.007 | -9999 | 0 | -10000 | 0 | 0 |
Figure S91. Get High-res Image This plot shows pathway concept perturbations across all samples against a permutation model. The concepts along the x-axis are sorted by lowest to highest mean activity for the real patient samples. Mean inferred activities are plotted along the y-axis as a colored band showing the average level and one standard deviation range. Real samples are shown in red and permuted samples in black.
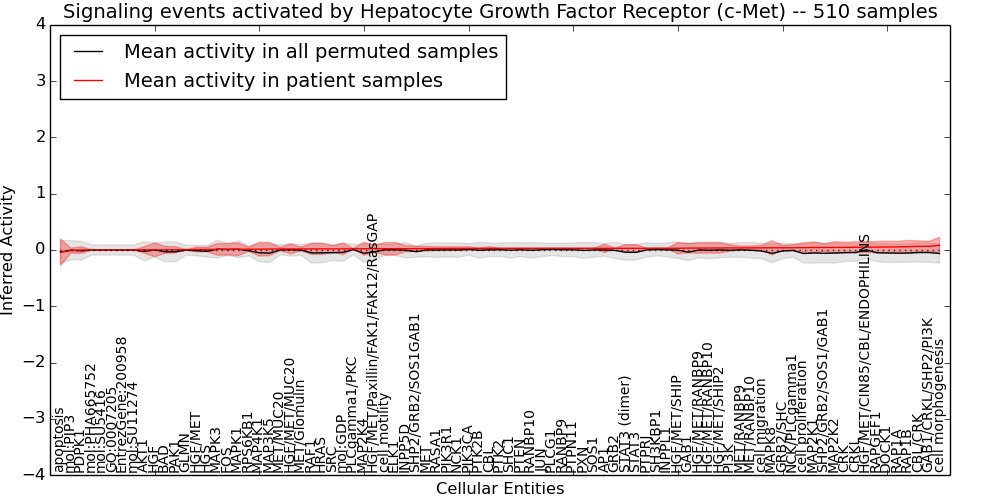
Table S91. Get Full Table This table displays mean, standard deviation, and perturbation statistics for Inferred Pathway Levels (IPLs). A mean perturbation of -9999 implies that the IPLs across all the real samples did not differ enough from the IPLs generated by a background model of permuted samples (> 1 Std.Dev from the permuted sample IPLs).
| Entity | Mean | Std.Dev | Mean.of.Up.Perturbations | Number.of.Up.Perturbations | Mean.of.Down.Perturbations | Number.of.Down.Perturbations | Number.of.Total.Perturbations |
|---|---|---|---|---|---|---|---|
| MET/RANBP9 | 0.037 | 0.033 | -10000 | 0 | -0.43 | 2 | 2 |
| CRKL | 0.049 | 0.098 | 0.39 | 8 | -0.43 | 7 | 15 |
| mol:PIP3 | -0.011 | 0.044 | -10000 | 0 | -0.7 | 2 | 2 |
| AKT1 | 0.001 | 0.057 | -10000 | 0 | -0.61 | 2 | 2 |
| PTK2B | 0.027 | 0.009 | -10000 | 0 | -10000 | 0 | 0 |
| RAPGEF1 | 0.052 | 0.099 | 0.38 | 12 | -0.48 | 3 | 15 |
| RANBP10 | 0.029 | 0.006 | -10000 | 0 | -10000 | 0 | 0 |
| PIK3CA | 0.027 | 0.03 | -10000 | 0 | -0.64 | 1 | 1 |
| HGF/MET/SHIP2 | 0.036 | 0.092 | -10000 | 0 | -0.4 | 20 | 20 |
| MAP3K5 | 0.017 | 0.12 | 0.44 | 11 | -0.48 | 3 | 14 |
| HGF/MET/CIN85/CBL/ENDOPHILINS | 0.05 | 0.094 | -10000 | 0 | -0.38 | 20 | 20 |
| AP1 | 0.029 | 0.074 | -10000 | 0 | -0.4 | 12 | 12 |
| mol:SU11274 | 0 | 0 | -10000 | 0 | -10000 | 0 | 0 |
| SHC1 | 0.029 | 0.007 | -10000 | 0 | -10000 | 0 | 0 |
| apoptosis | -0.039 | 0.24 | -10000 | 0 | -0.7 | 55 | 55 |
| STAT3 (dimer) | 0.029 | 0.067 | -10000 | 0 | -0.48 | 3 | 3 |
| GAB1/CRKL/SHP2/PI3K | 0.066 | 0.087 | 0.43 | 1 | -0.48 | 4 | 5 |
| INPP5D | 0.024 | 0.055 | -10000 | 0 | -0.59 | 4 | 4 |
| CBL/CRK | 0.064 | 0.098 | 0.4 | 6 | -0.55 | 3 | 9 |
| PTPN11 | 0.029 | 0.006 | -10000 | 0 | -10000 | 0 | 0 |
| GO:0007205 | 0 | 0 | -10000 | 0 | -10000 | 0 | 0 |
| PLCG1 | 0.029 | 0.006 | -10000 | 0 | -10000 | 0 | 0 |
| PTEN | 0.029 | 0.006 | -10000 | 0 | -10000 | 0 | 0 |
| ELK1 | 0.023 | 0.11 | 0.33 | 54 | -0.24 | 2 | 56 |
| mol:SU5416 | 0 | 0 | -10000 | 0 | -10000 | 0 | 0 |
| SHP2/GRB2/SOS1GAB1 | 0.024 | 0.043 | -10000 | 0 | -0.27 | 4 | 4 |
| PAK1 | 0.004 | 0.056 | 0.38 | 1 | -0.57 | 2 | 3 |
| HGF/MET/RANBP10 | 0.035 | 0.09 | -10000 | 0 | -0.4 | 19 | 19 |
| HRAS | 0.02 | 0.099 | -10000 | 0 | -0.55 | 6 | 6 |
| DOCK1 | 0.053 | 0.1 | 0.44 | 9 | -0.55 | 3 | 12 |
| GAB1 | 0.034 | 0.085 | -10000 | 0 | -0.46 | 7 | 7 |
| CRK | 0.047 | 0.093 | 0.32 | 8 | -0.43 | 7 | 15 |
| mol:PHA665752 | 0 | 0 | -10000 | 0 | -10000 | 0 | 0 |
| mol:GDP | 0.02 | 0.1 | -10000 | 0 | -0.56 | 10 | 10 |
| JUN | 0.029 | 0.006 | -10000 | 0 | -10000 | 0 | 0 |
| EntrezGene:200958 | 0 | 0 | -10000 | 0 | -10000 | 0 | 0 |
| HGF/MET | 0.009 | 0.042 | -10000 | 0 | -0.22 | 10 | 10 |
| PIK3R1 | 0.026 | 0.031 | -10000 | 0 | -0.64 | 1 | 1 |
| cell morphogenesis | 0.082 | 0.14 | 0.48 | 31 | -0.55 | 3 | 34 |
| GRB2/SHC | 0.039 | 0.046 | -10000 | 0 | -10000 | 0 | 0 |
| FOS | 0.012 | 0.1 | -10000 | 0 | -0.63 | 12 | 12 |
| GLMN | 0.005 | 0.001 | -10000 | 0 | -10000 | 0 | 0 |
| cell motility | 0.023 | 0.11 | 0.33 | 54 | -0.24 | 2 | 56 |
| HGF/MET/MUC20 | 0.018 | 0.088 | -10000 | 0 | -0.4 | 20 | 20 |
| cell migration | 0.038 | 0.045 | -10000 | 0 | -10000 | 0 | 0 |
| GRB2 | 0.029 | 0.005 | -10000 | 0 | -10000 | 0 | 0 |
| CBL | 0.029 | 0.03 | -10000 | 0 | -0.64 | 1 | 1 |
| MET/RANBP10 | 0.037 | 0.033 | -10000 | 0 | -0.43 | 2 | 2 |
| HGF/MET/Paxillin/FAK1/FAK12/RasGAP | 0.023 | 0.062 | -10000 | 0 | -0.46 | 3 | 3 |
| MET/MUC20 | 0.018 | 0.029 | -10000 | 0 | -0.43 | 2 | 2 |
| RAP1B | 0.06 | 0.11 | 0.46 | 15 | -0.49 | 2 | 17 |
| RAP1A | 0.055 | 0.097 | 0.4 | 12 | -0.58 | 1 | 13 |
| HGF/MET/RANBP9 | 0.034 | 0.091 | -10000 | 0 | -0.4 | 20 | 20 |
| RAF1 | 0.019 | 0.096 | -10000 | 0 | -0.54 | 5 | 5 |
| STAT3 | 0.029 | 0.067 | -10000 | 0 | -0.48 | 3 | 3 |
| cell proliferation | 0.043 | 0.086 | 0.31 | 6 | -0.48 | 3 | 9 |
| RPS6KB1 | 0.013 | 0.037 | -10000 | 0 | -0.42 | 3 | 3 |
| MAPK3 | 0.011 | 0.1 | 0.5 | 6 | -10000 | 0 | 6 |
| MAPK1 | 0.013 | 0.11 | 0.56 | 8 | -10000 | 0 | 8 |
| RANBP9 | 0.029 | 0.006 | -10000 | 0 | -10000 | 0 | 0 |
| MAPK8 | 0.039 | 0.12 | 0.48 | 13 | -0.44 | 5 | 18 |
| SRC | 0.02 | 0.057 | -10000 | 0 | -0.5 | 2 | 2 |
| PI3K | 0.036 | 0.055 | -10000 | 0 | -0.44 | 3 | 3 |
| MET/Glomulin | 0.018 | 0.033 | -10000 | 0 | -0.38 | 2 | 2 |
| SOS1 | 0.029 | 0.005 | -10000 | 0 | -10000 | 0 | 0 |
| MAP2K1 | 0.044 | 0.1 | -10000 | 0 | -0.52 | 4 | 4 |
| MET | 0.024 | 0.04 | -10000 | 0 | -0.59 | 2 | 2 |
| MAP4K1 | 0.015 | 0.12 | 0.44 | 11 | -0.48 | 5 | 16 |
| PTK2 | 0.029 | 0.007 | -10000 | 0 | -10000 | 0 | 0 |
| MAP2K2 | 0.046 | 0.1 | 0.36 | 4 | -0.52 | 4 | 8 |
| BAD | 0.003 | 0.063 | 0.38 | 1 | -0.6 | 3 | 4 |
| MAP2K4 | 0.022 | 0.12 | 0.44 | 12 | -0.54 | 1 | 13 |
| SHP2/GRB2/SOS1/GAB1 | 0.045 | 0.068 | -10000 | 0 | -0.62 | 1 | 1 |
| INPPL1 | 0.03 | 0.003 | -10000 | 0 | -10000 | 0 | 0 |
| PXN | 0.029 | 0.006 | -10000 | 0 | -10000 | 0 | 0 |
| SH3KBP1 | 0.03 | 0.003 | -10000 | 0 | -10000 | 0 | 0 |
| HGS | 0.009 | 0.038 | -10000 | 0 | -0.31 | 1 | 1 |
| PLCgamma1/PKC | 0.022 | 0.004 | -10000 | 0 | -10000 | 0 | 0 |
| HGF | 0.002 | 0.12 | -10000 | 0 | -0.6 | 20 | 20 |
| RASA1 | 0.025 | 0.031 | -10000 | 0 | -0.64 | 1 | 1 |
| NCK1 | 0.027 | 0.03 | -10000 | 0 | -0.64 | 1 | 1 |
| PTPRJ | 0.03 | 0.003 | -10000 | 0 | -10000 | 0 | 0 |
| NCK/PLCgamma1 | 0.04 | 0.055 | -10000 | 0 | -0.42 | 2 | 2 |
| PDPK1 | -0.002 | 0.059 | -10000 | 0 | -0.56 | 3 | 3 |
| HGF/MET/SHIP | 0.031 | 0.1 | -10000 | 0 | -0.41 | 23 | 23 |
Figure S92. Get High-res Image This plot shows pathway concept perturbations across all samples against a permutation model. The concepts along the x-axis are sorted by lowest to highest mean activity for the real patient samples. Mean inferred activities are plotted along the y-axis as a colored band showing the average level and one standard deviation range. Real samples are shown in red and permuted samples in black.
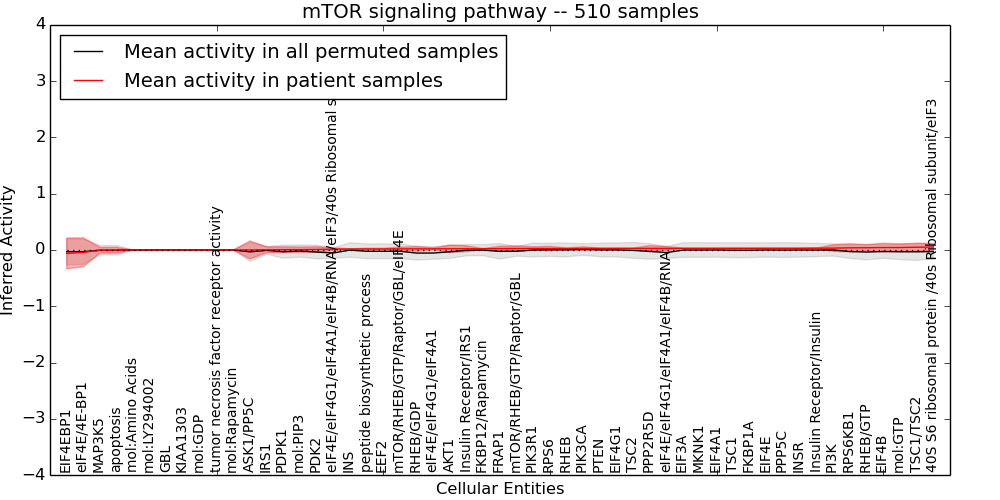
Table S92. Get Full Table This table displays mean, standard deviation, and perturbation statistics for Inferred Pathway Levels (IPLs). A mean perturbation of -9999 implies that the IPLs across all the real samples did not differ enough from the IPLs generated by a background model of permuted samples (> 1 Std.Dev from the permuted sample IPLs).
| Entity | Mean | Std.Dev | Mean.of.Up.Perturbations | Number.of.Up.Perturbations | Mean.of.Down.Perturbations | Number.of.Down.Perturbations | Number.of.Total.Perturbations |
|---|---|---|---|---|---|---|---|
| GBL | 0 | 0 | -10000 | 0 | -10000 | 0 | 0 |
| MKNK1 | 0.029 | 0.006 | -10000 | 0 | -10000 | 0 | 0 |
| mol:PIP3 | 0.006 | 0.047 | -10000 | 0 | -0.35 | 6 | 6 |
| FRAP1 | 0.025 | 0.043 | 0.28 | 1 | -10000 | 0 | 1 |
| AKT1 | 0.022 | 0.066 | 0.26 | 3 | -0.43 | 3 | 6 |
| INSR | 0.03 | 0.003 | -10000 | 0 | -10000 | 0 | 0 |
| Insulin Receptor/Insulin | 0.032 | 0.004 | -10000 | 0 | -10000 | 0 | 0 |
| mol:GTP | 0.044 | 0.064 | 0.3 | 1 | -0.39 | 2 | 3 |
| eIF4E/eIF4G1/eIF4A1/eIF4B/RNA/eIF3/40s Ribosomal subunit | 0.015 | 0.025 | -10000 | 0 | -0.26 | 1 | 1 |
| TSC2 | 0.029 | 0.006 | -10000 | 0 | -10000 | 0 | 0 |
| RHEB/GDP | 0.02 | 0.041 | -10000 | 0 | -0.36 | 2 | 2 |
| TSC1 | 0.029 | 0.006 | -10000 | 0 | -10000 | 0 | 0 |
| Insulin Receptor/IRS1 | 0.022 | 0.053 | -10000 | 0 | -0.37 | 4 | 4 |
| eIF4E/eIF4G1/eIF4A1/eIF4B/RNA | 0.029 | 0.034 | -10000 | 0 | -0.3 | 1 | 1 |
| mol:GDP | 0 | 0 | -10000 | 0 | -10000 | 0 | 0 |
| EIF3A | 0.029 | 0.006 | -10000 | 0 | -10000 | 0 | 0 |
| RPS6KB1 | 0.039 | 0.073 | 0.33 | 7 | -0.37 | 3 | 10 |
| MAP3K5 | -0.004 | 0.051 | 0.17 | 1 | -0.18 | 30 | 31 |
| PIK3R1 | 0.026 | 0.031 | -10000 | 0 | -0.64 | 1 | 1 |
| apoptosis | -0.004 | 0.051 | 0.17 | 1 | -0.18 | 31 | 32 |
| mol:LY294002 | 0 | 0 | 0.001 | 1 | -0.001 | 21 | 22 |
| EIF4B | 0.043 | 0.078 | 0.33 | 14 | -0.46 | 1 | 15 |
| 40S S6 ribosomal protein /40s Ribosomal subunit/eIF3 | 0.054 | 0.065 | 0.29 | 5 | -0.61 | 1 | 6 |
| eIF4E/eIF4G1/eIF4A1 | 0.02 | 0.018 | -10000 | 0 | -10000 | 0 | 0 |
| KIAA1303 | 0 | 0 | -10000 | 0 | -10000 | 0 | 0 |
| PI3K | 0.033 | 0.059 | -10000 | 0 | -0.36 | 6 | 6 |
| mTOR/RHEB/GTP/Raptor/GBL | 0.026 | 0.047 | 0.23 | 8 | -0.22 | 1 | 9 |
| FKBP1A | 0.029 | 0.006 | -10000 | 0 | -10000 | 0 | 0 |
| RHEB/GTP | 0.04 | 0.054 | -10000 | 0 | -0.35 | 2 | 2 |
| mol:Amino Acids | 0 | 0 | 0.001 | 1 | -0.001 | 21 | 22 |
| FKBP12/Rapamycin | 0.022 | 0.005 | -10000 | 0 | -10000 | 0 | 0 |
| PDPK1 | 0.006 | 0.051 | -10000 | 0 | -0.37 | 6 | 6 |
| EIF4E | 0.03 | 0.004 | -10000 | 0 | -10000 | 0 | 0 |
| ASK1/PP5C | 0.001 | 0.16 | -10000 | 0 | -0.54 | 40 | 40 |
| mTOR/RHEB/GTP/Raptor/GBL/eIF4E | 0.02 | 0.031 | -10000 | 0 | -10000 | 0 | 0 |
| TSC1/TSC2 | 0.049 | 0.069 | 0.32 | 1 | -0.42 | 2 | 3 |
| tumor necrosis factor receptor activity | 0 | 0 | 0.001 | 21 | -0.001 | 1 | 22 |
| RPS6 | 0.027 | 0.039 | -10000 | 0 | -0.59 | 2 | 2 |
| PPP5C | 0.03 | 0.003 | -10000 | 0 | -10000 | 0 | 0 |
| EIF4G1 | 0.029 | 0.007 | -10000 | 0 | -10000 | 0 | 0 |
| IRS1 | 0.003 | 0.054 | -10000 | 0 | -0.23 | 23 | 23 |
| INS | 0.018 | 0.002 | -10000 | 0 | -10000 | 0 | 0 |
| PTEN | 0.028 | 0.006 | -10000 | 0 | -10000 | 0 | 0 |
| PDK2 | 0.009 | 0.049 | 0.21 | 4 | -0.33 | 5 | 9 |
| EIF4EBP1 | -0.061 | 0.28 | -10000 | 0 | -1 | 39 | 39 |
| PIK3CA | 0.028 | 0.03 | -10000 | 0 | -0.64 | 1 | 1 |
| PPP2R5D | 0.029 | 0.05 | 0.33 | 5 | -10000 | 0 | 5 |
| peptide biosynthetic process | 0.018 | 0.013 | -10000 | 0 | -10000 | 0 | 0 |
| RHEB | 0.027 | 0.009 | -10000 | 0 | -10000 | 0 | 0 |
| EIF4A1 | 0.029 | 0.005 | -10000 | 0 | -10000 | 0 | 0 |
| mol:Rapamycin | 0.001 | 0.001 | 0.005 | 17 | -0.003 | 1 | 18 |
| EEF2 | 0.019 | 0.013 | -10000 | 0 | -10000 | 0 | 0 |
| eIF4E/4E-BP1 | -0.041 | 0.26 | -10000 | 0 | -0.92 | 39 | 39 |
Figure S93. Get High-res Image This plot shows pathway concept perturbations across all samples against a permutation model. The concepts along the x-axis are sorted by lowest to highest mean activity for the real patient samples. Mean inferred activities are plotted along the y-axis as a colored band showing the average level and one standard deviation range. Real samples are shown in red and permuted samples in black.
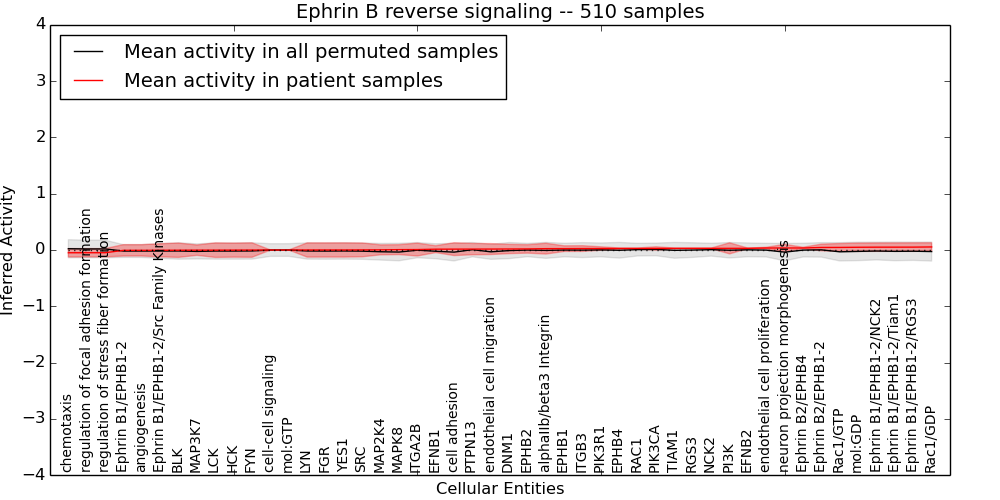
Table S93. Get Full Table This table displays mean, standard deviation, and perturbation statistics for Inferred Pathway Levels (IPLs). A mean perturbation of -9999 implies that the IPLs across all the real samples did not differ enough from the IPLs generated by a background model of permuted samples (> 1 Std.Dev from the permuted sample IPLs).
| Entity | Mean | Std.Dev | Mean.of.Up.Perturbations | Number.of.Up.Perturbations | Mean.of.Down.Perturbations | Number.of.Down.Perturbations | Number.of.Total.Perturbations |
|---|---|---|---|---|---|---|---|
| EFNB2 | 0.03 | 0.004 | -10000 | 0 | -10000 | 0 | 0 |
| EPHB2 | 0.019 | 0.075 | -10000 | 0 | -0.52 | 9 | 9 |
| EFNB1 | 0.015 | 0.061 | -10000 | 0 | -0.44 | 9 | 9 |
| mol:GTP | 0 | 0 | -10000 | 0 | -10000 | 0 | 0 |
| Rac1/GDP | 0.054 | 0.074 | -10000 | 0 | -0.55 | 2 | 2 |
| Ephrin B2/EPHB1-2 | 0.045 | 0.059 | -10000 | 0 | -0.44 | 6 | 6 |
| neuron projection morphogenesis | 0.036 | 0.065 | -10000 | 0 | -0.52 | 2 | 2 |
| Ephrin B1/EPHB1-2/Tiam1 | 0.05 | 0.075 | -10000 | 0 | -0.58 | 2 | 2 |
| DNM1 | 0.018 | 0.082 | -10000 | 0 | -0.6 | 9 | 9 |
| cell-cell signaling | 0 | 0.002 | -10000 | 0 | -10000 | 0 | 0 |
| MAP2K4 | 0.003 | 0.088 | -10000 | 0 | -0.5 | 14 | 14 |
| YES1 | 0.001 | 0.13 | -10000 | 0 | -0.74 | 14 | 14 |
| Ephrin B1/EPHB1-2/NCK2 | 0.05 | 0.075 | -10000 | 0 | -0.44 | 5 | 5 |
| PI3K | 0.029 | 0.099 | -10000 | 0 | -0.5 | 15 | 15 |
| mol:GDP | 0.049 | 0.074 | -10000 | 0 | -0.58 | 2 | 2 |
| ITGA2B | 0.008 | 0.11 | -10000 | 0 | -0.59 | 18 | 18 |
| endothelial cell proliferation | 0.036 | 0.013 | -10000 | 0 | -10000 | 0 | 0 |
| FYN | -0.001 | 0.13 | -10000 | 0 | -0.75 | 14 | 14 |
| MAP3K7 | -0.003 | 0.092 | -10000 | 0 | -0.56 | 13 | 13 |
| FGR | 0 | 0.13 | -10000 | 0 | -0.74 | 14 | 14 |
| TIAM1 | 0.029 | 0.006 | -10000 | 0 | -10000 | 0 | 0 |
| PIK3R1 | 0.026 | 0.031 | -10000 | 0 | -0.64 | 1 | 1 |
| RGS3 | 0.029 | 0.006 | -10000 | 0 | -10000 | 0 | 0 |
| cell adhesion | 0.015 | 0.11 | -10000 | 0 | -0.6 | 10 | 10 |
| LYN | 0 | 0.13 | -10000 | 0 | -0.74 | 14 | 14 |
| Ephrin B1/EPHB1-2/Src Family Kinases | -0.005 | 0.12 | -10000 | 0 | -0.69 | 14 | 14 |
| Ephrin B1/EPHB1-2 | -0.006 | 0.1 | -10000 | 0 | -0.6 | 14 | 14 |
| SRC | 0.002 | 0.12 | -10000 | 0 | -0.72 | 14 | 14 |
| ITGB3 | 0.025 | 0.051 | -10000 | 0 | -0.64 | 3 | 3 |
| EPHB1 | 0.024 | 0.05 | -10000 | 0 | -0.62 | 3 | 3 |
| EPHB4 | 0.027 | 0.009 | -10000 | 0 | -10000 | 0 | 0 |
| RAC1 | 0.027 | 0.009 | -10000 | 0 | -10000 | 0 | 0 |
| Ephrin B2/EPHB4 | 0.036 | 0.013 | -10000 | 0 | -10000 | 0 | 0 |
| alphaIIb/beta3 Integrin | 0.024 | 0.096 | -10000 | 0 | -0.44 | 21 | 21 |
| BLK | -0.004 | 0.13 | -10000 | 0 | -0.74 | 14 | 14 |
| HCK | -0.002 | 0.12 | -10000 | 0 | -0.73 | 14 | 14 |
| regulation of stress fiber formation | -0.048 | 0.074 | 0.43 | 5 | -10000 | 0 | 5 |
| MAPK8 | 0.006 | 0.088 | 0.4 | 1 | -0.5 | 12 | 13 |
| Ephrin B1/EPHB1-2/RGS3 | 0.051 | 0.076 | -10000 | 0 | -0.58 | 2 | 2 |
| endothelial cell migration | 0.017 | 0.097 | 0.4 | 3 | -0.48 | 11 | 14 |
| NCK2 | 0.029 | 0.006 | -10000 | 0 | -10000 | 0 | 0 |
| PTPN13 | 0.016 | 0.1 | -10000 | 0 | -0.73 | 9 | 9 |
| regulation of focal adhesion formation | -0.048 | 0.074 | 0.43 | 5 | -10000 | 0 | 5 |
| chemotaxis | -0.049 | 0.075 | 0.58 | 2 | -10000 | 0 | 2 |
| PIK3CA | 0.027 | 0.03 | -10000 | 0 | -0.64 | 1 | 1 |
| Rac1/GTP | 0.046 | 0.069 | -10000 | 0 | -0.54 | 2 | 2 |
| angiogenesis | -0.006 | 0.1 | -10000 | 0 | -0.59 | 14 | 14 |
| LCK | -0.002 | 0.13 | -10000 | 0 | -0.75 | 14 | 14 |
Figure S94. Get High-res Image This plot shows pathway concept perturbations across all samples against a permutation model. The concepts along the x-axis are sorted by lowest to highest mean activity for the real patient samples. Mean inferred activities are plotted along the y-axis as a colored band showing the average level and one standard deviation range. Real samples are shown in red and permuted samples in black.
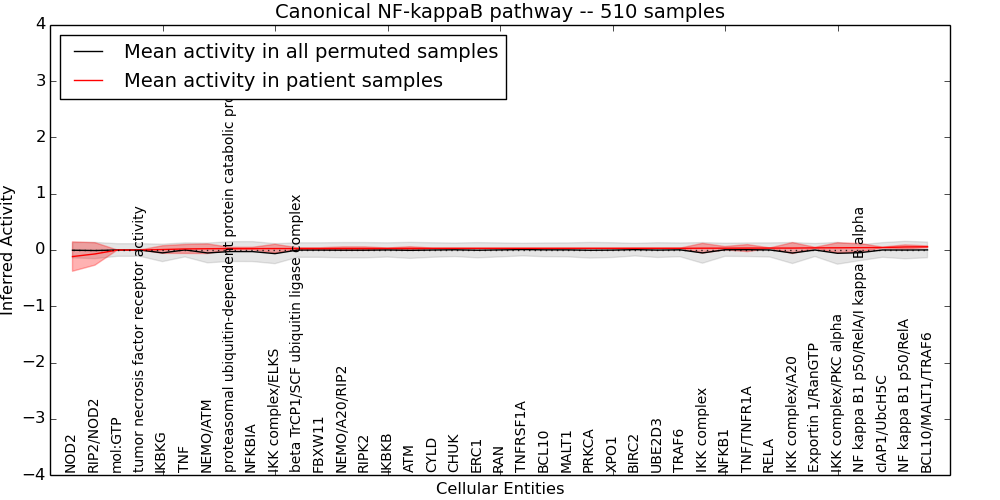
Table S94. Get Full Table This table displays mean, standard deviation, and perturbation statistics for Inferred Pathway Levels (IPLs). A mean perturbation of -9999 implies that the IPLs across all the real samples did not differ enough from the IPLs generated by a background model of permuted samples (> 1 Std.Dev from the permuted sample IPLs).
| Entity | Mean | Std.Dev | Mean.of.Up.Perturbations | Number.of.Up.Perturbations | Mean.of.Down.Perturbations | Number.of.Down.Perturbations | Number.of.Total.Perturbations |
|---|---|---|---|---|---|---|---|
| FBXW11 | 0.026 | 0.015 | -10000 | 0 | -10000 | 0 | 0 |
| mol:GTP | 0 | 0 | -10000 | 0 | -10000 | 0 | 0 |
| NF kappa B1 p50/RelA/I kappa B alpha | 0.042 | 0.074 | 0.31 | 9 | -10000 | 0 | 9 |
| ERC1 | 0.029 | 0.006 | -10000 | 0 | -10000 | 0 | 0 |
| RIP2/NOD2 | -0.07 | 0.2 | -10000 | 0 | -0.43 | 116 | 116 |
| NFKBIA | 0.025 | 0.023 | -10000 | 0 | -10000 | 0 | 0 |
| BIRC2 | 0.03 | 0.004 | -10000 | 0 | -10000 | 0 | 0 |
| IKBKB | 0.028 | 0.008 | -10000 | 0 | -10000 | 0 | 0 |
| RIPK2 | 0.027 | 0.028 | -10000 | 0 | -0.59 | 1 | 1 |
| IKBKG | 0.008 | 0.067 | -10000 | 0 | -10000 | 0 | 0 |
| IKK complex/A20 | 0.034 | 0.097 | -10000 | 0 | -0.48 | 1 | 1 |
| NEMO/A20/RIP2 | 0.027 | 0.028 | -10000 | 0 | -0.59 | 1 | 1 |
| XPO1 | 0.029 | 0.005 | -10000 | 0 | -10000 | 0 | 0 |
| NEMO/ATM | 0.023 | 0.085 | -10000 | 0 | -10000 | 0 | 0 |
| tumor necrosis factor receptor activity | 0 | 0 | -10000 | 0 | -10000 | 0 | 0 |
| RAN | 0.029 | 0.006 | -10000 | 0 | -10000 | 0 | 0 |
| Exportin 1/RanGTP | 0.038 | 0.01 | -10000 | 0 | -10000 | 0 | 0 |
| IKK complex/ELKS | 0.025 | 0.076 | -10000 | 0 | -10000 | 0 | 0 |
| BCL10/MALT1/TRAF6 | 0.058 | 0.015 | -10000 | 0 | -10000 | 0 | 0 |
| NOD2 | -0.12 | 0.26 | -10000 | 0 | -0.59 | 120 | 120 |
| NFKB1 | 0.032 | 0.03 | -10000 | 0 | -0.63 | 1 | 1 |
| RELA | 0.034 | 0.003 | -10000 | 0 | -10000 | 0 | 0 |
| MALT1 | 0.029 | 0.005 | -10000 | 0 | -10000 | 0 | 0 |
| cIAP1/UbcH5C | 0.044 | 0.007 | -10000 | 0 | -10000 | 0 | 0 |
| ATM | 0.029 | 0.03 | -10000 | 0 | -0.64 | 1 | 1 |
| TNF/TNFR1A | 0.034 | 0.062 | -10000 | 0 | -0.45 | 8 | 8 |
| TRAF6 | 0.03 | 0.003 | -10000 | 0 | -10000 | 0 | 0 |
| PRKCA | 0.029 | 0.005 | -10000 | 0 | -10000 | 0 | 0 |
| CHUK | 0.029 | 0.006 | -10000 | 0 | -10000 | 0 | 0 |
| UBE2D3 | 0.03 | 0.004 | -10000 | 0 | -10000 | 0 | 0 |
| TNF | 0.019 | 0.08 | -10000 | 0 | -0.61 | 8 | 8 |
| NF kappa B1 p50/RelA | 0.054 | 0.037 | -10000 | 0 | -0.39 | 1 | 1 |
| BCL10 | 0.029 | 0.006 | -10000 | 0 | -10000 | 0 | 0 |
| proteasomal ubiquitin-dependent protein catabolic process | 0.025 | 0.023 | -10000 | 0 | -10000 | 0 | 0 |
| beta TrCP1/SCF ubiquitin ligase complex | 0.026 | 0.015 | -10000 | 0 | -10000 | 0 | 0 |
| TNFRSF1A | 0.029 | 0.006 | -10000 | 0 | -10000 | 0 | 0 |
| IKK complex | 0.032 | 0.086 | -10000 | 0 | -10000 | 0 | 0 |
| CYLD | 0.029 | 0.006 | -10000 | 0 | -10000 | 0 | 0 |
| IKK complex/PKC alpha | 0.039 | 0.089 | -10000 | 0 | -10000 | 0 | 0 |
Figure S95. Get High-res Image This plot shows pathway concept perturbations across all samples against a permutation model. The concepts along the x-axis are sorted by lowest to highest mean activity for the real patient samples. Mean inferred activities are plotted along the y-axis as a colored band showing the average level and one standard deviation range. Real samples are shown in red and permuted samples in black.
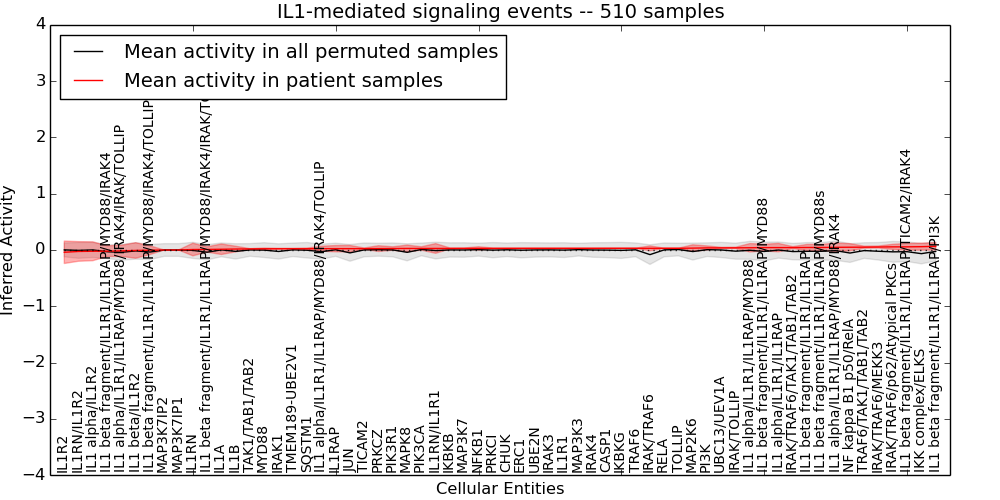
Table S95. Get Full Table This table displays mean, standard deviation, and perturbation statistics for Inferred Pathway Levels (IPLs). A mean perturbation of -9999 implies that the IPLs across all the real samples did not differ enough from the IPLs generated by a background model of permuted samples (> 1 Std.Dev from the permuted sample IPLs).
| Entity | Mean | Std.Dev | Mean.of.Up.Perturbations | Number.of.Up.Perturbations | Mean.of.Down.Perturbations | Number.of.Down.Perturbations | Number.of.Total.Perturbations |
|---|---|---|---|---|---|---|---|
| UBC13/UEV1A | 0.038 | 0.01 | -10000 | 0 | -10000 | 0 | 0 |
| PRKCZ | 0.025 | 0.051 | -10000 | 0 | -0.64 | 3 | 3 |
| MAP3K7IP2 | 0 | 0 | -10000 | 0 | -10000 | 0 | 0 |
| ERC1 | 0.029 | 0.006 | -10000 | 0 | -10000 | 0 | 0 |
| IL1 beta fragment/IL1R1/IL1RAP/MYD88/IRAK4 | -0.02 | 0.096 | -10000 | 0 | -0.39 | 2 | 2 |
| IRAK/TOLLIP | 0.038 | 0.012 | -10000 | 0 | -10000 | 0 | 0 |
| IKBKB | 0.028 | 0.008 | -10000 | 0 | -10000 | 0 | 0 |
| IKBKG | 0.03 | 0.004 | -10000 | 0 | -10000 | 0 | 0 |
| IL1 alpha/IL1R2 | -0.022 | 0.17 | -10000 | 0 | -0.46 | 65 | 65 |
| IL1A | 0.013 | 0.093 | -10000 | 0 | -0.59 | 12 | 12 |
| IL1B | 0.017 | 0.05 | -10000 | 0 | -0.44 | 6 | 6 |
| IRAK/TRAF6/p62/Atypical PKCs | 0.056 | 0.046 | -10000 | 0 | -10000 | 0 | 0 |
| IL1R2 | -0.04 | 0.2 | -10000 | 0 | -0.6 | 56 | 56 |
| IL1R1 | 0.029 | 0.005 | -10000 | 0 | -10000 | 0 | 0 |
| IL1 beta fragment/IL1R1/IL1RAP/MYD88/IRAK4/IRAK/TOLLIP | 0.01 | 0.047 | -10000 | 0 | -10000 | 0 | 0 |
| TOLLIP | 0.03 | 0.003 | -10000 | 0 | -10000 | 0 | 0 |
| TICAM2 | 0.024 | 0.012 | -10000 | 0 | -10000 | 0 | 0 |
| MAP3K3 | 0.029 | 0.005 | -10000 | 0 | -10000 | 0 | 0 |
| TAK1/TAB1/TAB2 | 0.019 | 0.005 | -10000 | 0 | -10000 | 0 | 0 |
| IKK complex/ELKS | 0.059 | 0.063 | 0.38 | 1 | -10000 | 0 | 1 |
| JUN | 0.024 | 0.057 | 0.35 | 9 | -10000 | 0 | 9 |
| MAP3K7 | 0.028 | 0.007 | -10000 | 0 | -10000 | 0 | 0 |
| IL1 beta fragment/IL1R1/IL1RAP/PI3K | 0.065 | 0.065 | -10000 | 0 | -0.65 | 1 | 1 |
| IL1 alpha/IL1R1/IL1RAP/MYD88 | 0.04 | 0.075 | -10000 | 0 | -0.34 | 14 | 14 |
| PIK3R1 | 0.026 | 0.031 | -10000 | 0 | -0.64 | 1 | 1 |
| IL1 alpha/IL1R1/IL1RAP/MYD88/IRAK4 | 0.047 | 0.076 | -10000 | 0 | -10000 | 0 | 0 |
| IL1 beta fragment/IL1R1/IL1RAP | 0.045 | 0.055 | -10000 | 0 | -0.37 | 2 | 2 |
| NFKB1 | 0.028 | 0.03 | -10000 | 0 | -0.64 | 1 | 1 |
| MAPK8 | 0.027 | 0.06 | 0.36 | 9 | -10000 | 0 | 9 |
| IRAK1 | 0.022 | 0.008 | -10000 | 0 | -10000 | 0 | 0 |
| IL1RN/IL1R1 | 0.028 | 0.086 | -10000 | 0 | -0.44 | 17 | 17 |
| IRAK4 | 0.029 | 0.005 | -10000 | 0 | -10000 | 0 | 0 |
| PRKCI | 0.029 | 0.007 | -10000 | 0 | -10000 | 0 | 0 |
| TRAF6 | 0.03 | 0.003 | -10000 | 0 | -10000 | 0 | 0 |
| PI3K | 0.037 | 0.035 | -10000 | 0 | -0.47 | 2 | 2 |
| IL1 beta fragment/IL1R1/IL1RAP/MYD88/IRAK4/TOLLIP | -0.004 | 0.077 | -10000 | 0 | -0.4 | 1 | 1 |
| CHUK | 0.029 | 0.006 | -10000 | 0 | -10000 | 0 | 0 |
| IL1 beta fragment/IL1R1/IL1RAP/MYD88s | 0.045 | 0.055 | -10000 | 0 | -0.37 | 2 | 2 |
| IL1 beta/IL1R2 | -0.008 | 0.14 | -10000 | 0 | -0.39 | 59 | 59 |
| IRAK/TRAF6/TAK1/TAB1/TAB2 | 0.043 | 0.017 | -10000 | 0 | -10000 | 0 | 0 |
| NF kappa B1 p50/RelA | 0.049 | 0.064 | -10000 | 0 | -0.88 | 1 | 1 |
| IRAK3 | 0.029 | 0.005 | -10000 | 0 | -10000 | 0 | 0 |
| IL1 beta fragment/IL1R1/IL1RAP/TICAM2/IRAK4 | 0.056 | 0.061 | -10000 | 0 | -10000 | 0 | 0 |
| IL1 alpha/IL1R1/IL1RAP/MYD88/IRAK4/TOLLIP | 0.024 | 0.044 | -10000 | 0 | -0.35 | 1 | 1 |
| IL1 alpha/IL1R1/IL1RAP | 0.042 | 0.074 | -10000 | 0 | -0.37 | 15 | 15 |
| RELA | 0.03 | 0.003 | -10000 | 0 | -10000 | 0 | 0 |
| MAP3K7IP1 | 0 | 0 | -10000 | 0 | -10000 | 0 | 0 |
| SQSTM1 | 0.023 | 0.013 | -10000 | 0 | -10000 | 0 | 0 |
| MYD88 | 0.021 | 0.014 | -10000 | 0 | -10000 | 0 | 0 |
| IRAK/TRAF6/MEKK3 | 0.053 | 0.018 | -10000 | 0 | -10000 | 0 | 0 |
| IL1RAP | 0.024 | 0.056 | -10000 | 0 | -0.6 | 4 | 4 |
| UBE2N | 0.029 | 0.005 | -10000 | 0 | -10000 | 0 | 0 |
| IRAK/TRAF6 | 0.03 | 0.043 | -10000 | 0 | -10000 | 0 | 0 |
| CASP1 | 0.03 | 0.004 | -10000 | 0 | -10000 | 0 | 0 |
| IL1RN/IL1R2 | -0.026 | 0.17 | -10000 | 0 | -0.46 | 69 | 69 |
| IL1 beta fragment/IL1R1/IL1RAP/MYD88 | 0.042 | 0.06 | -10000 | 0 | -10000 | 0 | 0 |
| TMEM189-UBE2V1 | 0.023 | 0.007 | -10000 | 0 | -10000 | 0 | 0 |
| IL1 alpha/IL1R1/IL1RAP/MYD88/IRAK4/IRAK/TOLLIP | -0.016 | 0.099 | -10000 | 0 | -10000 | 0 | 0 |
| PIK3CA | 0.027 | 0.03 | -10000 | 0 | -0.64 | 1 | 1 |
| IL1RN | 0.009 | 0.11 | -10000 | 0 | -0.59 | 17 | 17 |
| TRAF6/TAK1/TAB1/TAB2 | 0.05 | 0.018 | -10000 | 0 | -10000 | 0 | 0 |
| MAP2K6 | 0.033 | 0.059 | 0.37 | 9 | -0.33 | 2 | 11 |
Figure S96. Get High-res Image This plot shows pathway concept perturbations across all samples against a permutation model. The concepts along the x-axis are sorted by lowest to highest mean activity for the real patient samples. Mean inferred activities are plotted along the y-axis as a colored band showing the average level and one standard deviation range. Real samples are shown in red and permuted samples in black.
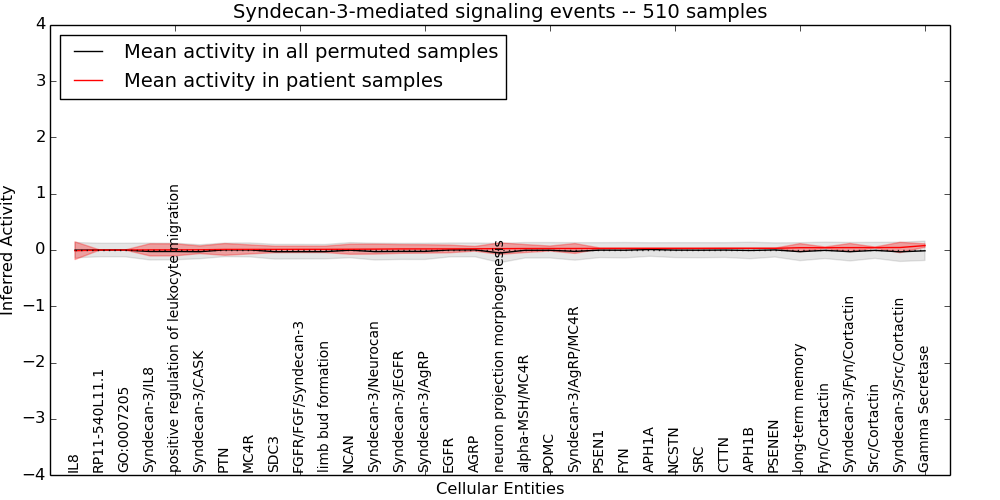
Table S96. Get Full Table This table displays mean, standard deviation, and perturbation statistics for Inferred Pathway Levels (IPLs). A mean perturbation of -9999 implies that the IPLs across all the real samples did not differ enough from the IPLs generated by a background model of permuted samples (> 1 Std.Dev from the permuted sample IPLs).
| Entity | Mean | Std.Dev | Mean.of.Up.Perturbations | Number.of.Up.Perturbations | Mean.of.Down.Perturbations | Number.of.Down.Perturbations | Number.of.Total.Perturbations |
|---|---|---|---|---|---|---|---|
| CTTN | 0.03 | 0.003 | -9999 | 0 | -10000 | 0 | 0 |
| Syndecan-3/Src/Cortactin | 0.044 | 0.092 | -9999 | 0 | -0.63 | 1 | 1 |
| Syndecan-3/Neurocan | 0.016 | 0.088 | -9999 | 0 | -0.36 | 16 | 16 |
| POMC | 0.026 | 0.044 | -9999 | 0 | -0.67 | 2 | 2 |
| EGFR | 0.02 | 0.068 | -9999 | 0 | -0.6 | 6 | 6 |
| Syndecan-3/EGFR | 0.019 | 0.078 | -9999 | 0 | -0.36 | 15 | 15 |
| AGRP | 0.022 | 0.042 | -9999 | 0 | -0.64 | 2 | 2 |
| NCSTN | 0.029 | 0.007 | -9999 | 0 | -10000 | 0 | 0 |
| PSENEN | 0.03 | 0.003 | -9999 | 0 | -10000 | 0 | 0 |
| RP11-540L11.1 | 0 | 0 | -9999 | 0 | -10000 | 0 | 0 |
| APH1B | 0.03 | 0.003 | -9999 | 0 | -10000 | 0 | 0 |
| APH1A | 0.029 | 0.007 | -9999 | 0 | -10000 | 0 | 0 |
| NCAN | 0.013 | 0.089 | -9999 | 0 | -0.59 | 11 | 11 |
| long-term memory | 0.041 | 0.072 | -9999 | 0 | -10000 | 0 | 0 |
| Syndecan-3/IL8 | 0.002 | 0.11 | -9999 | 0 | -0.34 | 17 | 17 |
| PSEN1 | 0.028 | 0.008 | -9999 | 0 | -10000 | 0 | 0 |
| Src/Cortactin | 0.043 | 0.009 | -9999 | 0 | -10000 | 0 | 0 |
| FYN | 0.028 | 0.008 | -9999 | 0 | -10000 | 0 | 0 |
| limb bud formation | 0.012 | 0.056 | -9999 | 0 | -0.36 | 11 | 11 |
| MC4R | 0.01 | 0.08 | -9999 | 0 | -0.59 | 9 | 9 |
| SRC | 0.029 | 0.006 | -9999 | 0 | -10000 | 0 | 0 |
| PTN | 0.01 | 0.1 | -9999 | 0 | -0.63 | 13 | 13 |
| FGFR/FGF/Syndecan-3 | 0.012 | 0.057 | -9999 | 0 | -0.36 | 11 | 11 |
| neuron projection morphogenesis | 0.024 | 0.1 | -9999 | 0 | -0.6 | 2 | 2 |
| Syndecan-3/AgRP | 0.019 | 0.075 | -9999 | 0 | -0.34 | 21 | 21 |
| Syndecan-3/AgRP/MC4R | 0.027 | 0.088 | -9999 | 0 | -0.35 | 6 | 6 |
| Fyn/Cortactin | 0.041 | 0.012 | -9999 | 0 | -10000 | 0 | 0 |
| SDC3 | 0.011 | 0.057 | -9999 | 0 | -0.37 | 11 | 11 |
| GO:0007205 | 0 | 0 | -9999 | 0 | -10000 | 0 | 0 |
| positive regulation of leukocyte migration | 0.003 | 0.11 | -9999 | 0 | -0.34 | 17 | 17 |
| IL8 | -0.012 | 0.16 | -9999 | 0 | -0.6 | 34 | 34 |
| Syndecan-3/Fyn/Cortactin | 0.042 | 0.074 | -9999 | 0 | -10000 | 0 | 0 |
| Syndecan-3/CASK | 0.004 | 0.068 | -9999 | 0 | -0.34 | 19 | 19 |
| alpha-MSH/MC4R | 0.026 | 0.071 | -9999 | 0 | -0.45 | 11 | 11 |
| Gamma Secretase | 0.079 | 0.03 | -9999 | 0 | -10000 | 0 | 0 |
Figure S97. Get High-res Image This plot shows pathway concept perturbations across all samples against a permutation model. The concepts along the x-axis are sorted by lowest to highest mean activity for the real patient samples. Mean inferred activities are plotted along the y-axis as a colored band showing the average level and one standard deviation range. Real samples are shown in red and permuted samples in black.
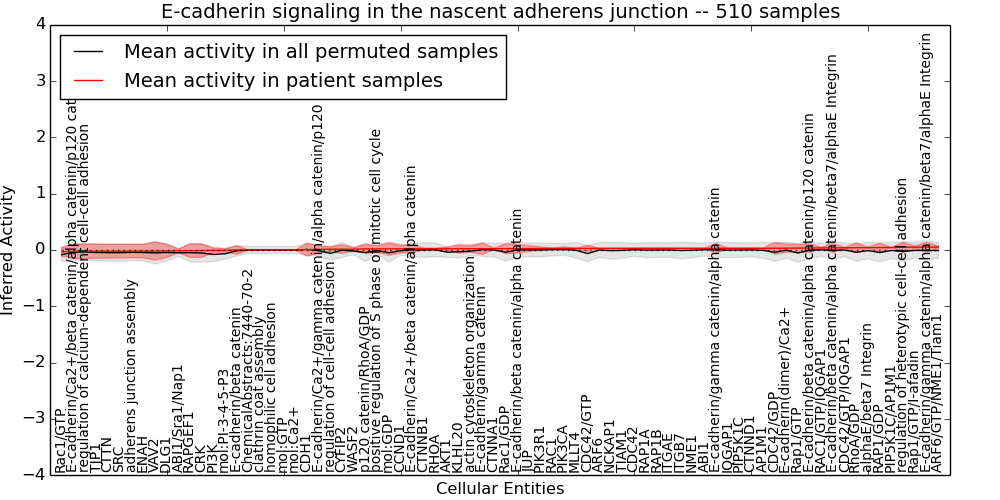
Table S97. Get Full Table This table displays mean, standard deviation, and perturbation statistics for Inferred Pathway Levels (IPLs). A mean perturbation of -9999 implies that the IPLs across all the real samples did not differ enough from the IPLs generated by a background model of permuted samples (> 1 Std.Dev from the permuted sample IPLs).
| Entity | Mean | Std.Dev | Mean.of.Up.Perturbations | Number.of.Up.Perturbations | Mean.of.Down.Perturbations | Number.of.Down.Perturbations | Number.of.Total.Perturbations |
|---|---|---|---|---|---|---|---|
| CTTN | -0.021 | 0.12 | -10000 | 0 | -0.48 | 16 | 16 |
| KLHL20 | 0.022 | 0.076 | 0.21 | 2 | -0.32 | 2 | 4 |
| CYFIP2 | 0.014 | 0.078 | -10000 | 0 | -0.64 | 7 | 7 |
| Rac1/GDP | 0.023 | 0.087 | 0.3 | 4 | -0.36 | 1 | 5 |
| ENAH | -0.02 | 0.12 | -10000 | 0 | -0.48 | 17 | 17 |
| AP1M1 | 0.03 | 0.003 | -10000 | 0 | -10000 | 0 | 0 |
| RAP1B | 0.029 | 0.005 | -10000 | 0 | -10000 | 0 | 0 |
| RAP1A | 0.029 | 0.005 | -10000 | 0 | -10000 | 0 | 0 |
| CTNNB1 | 0.021 | 0.014 | -10000 | 0 | -10000 | 0 | 0 |
| CDC42/GTP | 0.028 | 0.053 | -10000 | 0 | -10000 | 0 | 0 |
| ABI1/Sra1/Nap1 | -0.013 | 0.035 | -10000 | 0 | -0.2 | 4 | 4 |
| E-cadherin/beta catenin/alpha catenin/beta7/alphaE Integrin | 0.038 | 0.081 | -10000 | 0 | -0.36 | 16 | 16 |
| RAPGEF1 | -0.012 | 0.12 | -10000 | 0 | -0.43 | 12 | 12 |
| CTNND1 | 0.03 | 0.003 | -10000 | 0 | -10000 | 0 | 0 |
| regulation of calcium-dependent cell-cell adhesion | -0.022 | 0.13 | -10000 | 0 | -0.49 | 17 | 17 |
| CRK | -0.011 | 0.12 | -10000 | 0 | -0.45 | 15 | 15 |
| E-cadherin/gamma catenin/alpha catenin | 0.03 | 0.088 | -10000 | 0 | -0.43 | 15 | 15 |
| alphaE/beta7 Integrin | 0.042 | 0.01 | -10000 | 0 | -10000 | 0 | 0 |
| IQGAP1 | 0.03 | 0.004 | -10000 | 0 | -10000 | 0 | 0 |
| NCKAP1 | 0.029 | 0.006 | -10000 | 0 | -10000 | 0 | 0 |
| Rap1/GTP/I-afadin | 0.051 | 0.02 | -10000 | 0 | -10000 | 0 | 0 |
| DLG1 | -0.017 | 0.12 | -10000 | 0 | -0.48 | 15 | 15 |
| ChemicalAbstracts:7440-70-2 | 0 | 0 | -10000 | 0 | -10000 | 0 | 0 |
| mol:PI-3-4-5-P3 | -0.005 | 0.029 | -10000 | 0 | -10000 | 0 | 0 |
| MLLT4 | 0.028 | 0.008 | -10000 | 0 | -10000 | 0 | 0 |
| ARF6/GTP/NME1/Tiam1 | 0.051 | 0.019 | -10000 | 0 | -10000 | 0 | 0 |
| PI3K | -0.007 | 0.038 | -10000 | 0 | -10000 | 0 | 0 |
| ARF6 | 0.028 | 0.008 | -10000 | 0 | -10000 | 0 | 0 |
| mol:Ca2+ | 0 | 0 | -10000 | 0 | -10000 | 0 | 0 |
| E-cadherin/gamma catenin | 0.023 | 0.1 | -10000 | 0 | -0.49 | 18 | 18 |
| TIAM1 | 0.029 | 0.006 | -10000 | 0 | -10000 | 0 | 0 |
| E-cadherin(dimer)/Ca2+ | 0.032 | 0.072 | -10000 | 0 | -0.34 | 13 | 13 |
| AKT1 | 0.022 | 0.032 | -10000 | 0 | -10000 | 0 | 0 |
| PIK3R1 | 0.026 | 0.031 | -10000 | 0 | -0.64 | 1 | 1 |
| CDH1 | 0.008 | 0.12 | -10000 | 0 | -0.62 | 17 | 17 |
| RhoA/GDP | 0.04 | 0.085 | 0.36 | 7 | -10000 | 0 | 7 |
| actin cytoskeleton organization | 0.023 | 0.063 | 0.18 | 13 | -0.23 | 2 | 15 |
| CDC42/GDP | 0.031 | 0.11 | 0.42 | 10 | -10000 | 0 | 10 |
| E-cadherin/Ca2+/gamma catenin/alpha catenin/p120 catenin | 0.012 | 0.063 | -10000 | 0 | -0.3 | 15 | 15 |
| ITGB7 | 0.029 | 0.005 | -10000 | 0 | -10000 | 0 | 0 |
| RAC1 | 0.027 | 0.009 | -10000 | 0 | -10000 | 0 | 0 |
| E-cadherin/beta catenin/alpha catenin/p120 catenin | 0.035 | 0.077 | -10000 | 0 | -0.36 | 13 | 13 |
| E-cadherin/Ca2+/beta catenin/alpha catenin | 0.021 | 0.067 | -10000 | 0 | -0.34 | 13 | 13 |
| mol:GDP | 0.02 | 0.12 | 0.44 | 10 | -0.4 | 3 | 13 |
| CDC42/GTP/IQGAP1 | 0.039 | 0.009 | -10000 | 0 | -10000 | 0 | 0 |
| JUP | 0.026 | 0.051 | -10000 | 0 | -0.64 | 3 | 3 |
| p120 catenin/RhoA/GDP | 0.019 | 0.081 | 0.31 | 3 | -10000 | 0 | 3 |
| RAC1/GTP/IQGAP1 | 0.036 | 0.013 | -10000 | 0 | -10000 | 0 | 0 |
| PIP5K1C/AP1M1 | 0.044 | 0.005 | -10000 | 0 | -10000 | 0 | 0 |
| RHOA | 0.021 | 0.014 | -10000 | 0 | -10000 | 0 | 0 |
| CDC42 | 0.029 | 0.006 | -10000 | 0 | -10000 | 0 | 0 |
| CTNNA1 | 0.023 | 0.013 | -10000 | 0 | -10000 | 0 | 0 |
| positive regulation of S phase of mitotic cell cycle | 0.02 | 0.063 | 0.18 | 12 | -0.22 | 18 | 30 |
| NME1 | 0.029 | 0.005 | -10000 | 0 | -10000 | 0 | 0 |
| clathrin coat assembly | 0 | 0 | -10000 | 0 | -10000 | 0 | 0 |
| TJP1 | -0.022 | 0.12 | -10000 | 0 | -0.48 | 16 | 16 |
| regulation of cell-cell adhesion | 0.014 | 0.042 | -10000 | 0 | -10000 | 0 | 0 |
| WASF2 | 0.014 | 0.031 | -10000 | 0 | -10000 | 0 | 0 |
| Rap1/GTP | 0.034 | 0.066 | -10000 | 0 | -10000 | 0 | 0 |
| E-cadherin/gamma catenin/alpha catenin/beta7/alphaE Integrin | 0.051 | 0.086 | -10000 | 0 | -0.66 | 1 | 1 |
| CCND1 | 0.021 | 0.074 | 0.2 | 8 | -0.27 | 18 | 26 |
| VAV2 | -0.018 | 0.16 | -10000 | 0 | -0.56 | 17 | 17 |
| RAP1/GDP | 0.043 | 0.077 | 0.29 | 2 | -10000 | 0 | 2 |
| adherens junction assembly | -0.02 | 0.12 | -10000 | 0 | -0.47 | 16 | 16 |
| homophilic cell adhesion | 0 | 0 | -10000 | 0 | -10000 | 0 | 0 |
| ABI1 | 0.03 | 0.004 | -10000 | 0 | -10000 | 0 | 0 |
| PIP5K1C | 0.03 | 0.003 | -10000 | 0 | -10000 | 0 | 0 |
| regulation of heterotypic cell-cell adhesion | 0.048 | 0.09 | -10000 | 0 | -0.64 | 1 | 1 |
| E-cadherin/beta catenin | 0 | 0.077 | -10000 | 0 | -0.41 | 17 | 17 |
| mol:GTP | 0 | 0 | -10000 | 0 | -10000 | 0 | 0 |
| SRC | -0.021 | 0.12 | -10000 | 0 | -0.47 | 16 | 16 |
| PIK3CA | 0.027 | 0.03 | -10000 | 0 | -0.64 | 1 | 1 |
| Rac1/GTP | -0.032 | 0.079 | -10000 | 0 | -0.4 | 5 | 5 |
| E-cadherin/beta catenin/alpha catenin | 0.024 | 0.078 | -10000 | 0 | -0.4 | 13 | 13 |
| ITGAE | 0.029 | 0.005 | -10000 | 0 | -10000 | 0 | 0 |
| E-cadherin/Ca2+/beta catenin/alpha catenin/p120 catenin | -0.023 | 0.13 | -10000 | 0 | -0.5 | 17 | 17 |
Figure S98. Get High-res Image This plot shows pathway concept perturbations across all samples against a permutation model. The concepts along the x-axis are sorted by lowest to highest mean activity for the real patient samples. Mean inferred activities are plotted along the y-axis as a colored band showing the average level and one standard deviation range. Real samples are shown in red and permuted samples in black.
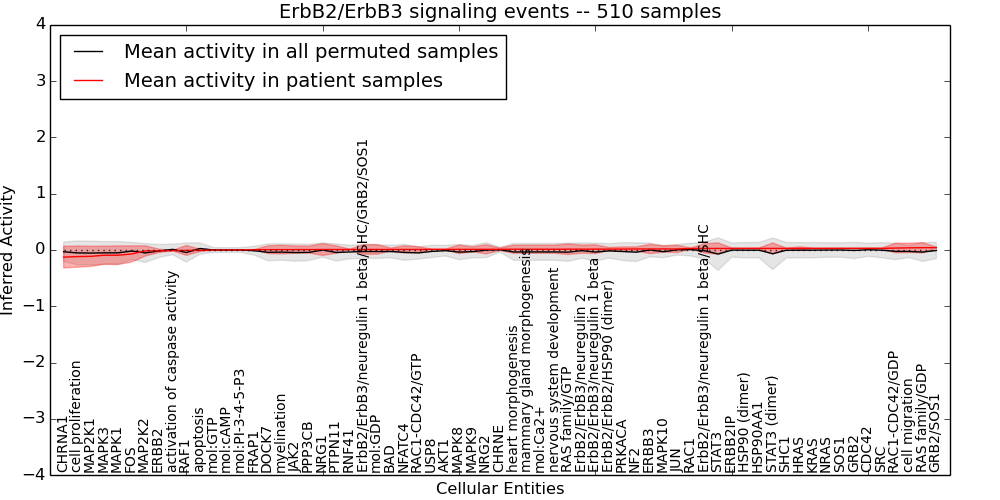
Table S98. Get Full Table This table displays mean, standard deviation, and perturbation statistics for Inferred Pathway Levels (IPLs). A mean perturbation of -9999 implies that the IPLs across all the real samples did not differ enough from the IPLs generated by a background model of permuted samples (> 1 Std.Dev from the permuted sample IPLs).
| Entity | Mean | Std.Dev | Mean.of.Up.Perturbations | Number.of.Up.Perturbations | Mean.of.Down.Perturbations | Number.of.Down.Perturbations | Number.of.Total.Perturbations |
|---|---|---|---|---|---|---|---|
| USP8 | 0.011 | 0.006 | -10000 | 0 | -10000 | 0 | 0 |
| RAS family/GTP | 0.014 | 0.094 | -10000 | 0 | -0.53 | 6 | 6 |
| NFATC4 | 0.01 | 0.065 | 0.28 | 7 | -0.48 | 1 | 8 |
| ERBB2IP | 0.028 | 0.009 | -10000 | 0 | -10000 | 0 | 0 |
| HSP90 (dimer) | 0.028 | 0.008 | -10000 | 0 | -10000 | 0 | 0 |
| mammary gland morphogenesis | 0.014 | 0.072 | -10000 | 0 | -10000 | 0 | 0 |
| JUN | 0.019 | 0.065 | 0.27 | 3 | -0.31 | 2 | 5 |
| HRAS | 0.028 | 0.028 | -10000 | 0 | -0.59 | 1 | 1 |
| DOCK7 | 0.006 | 0.069 | -10000 | 0 | -0.57 | 1 | 1 |
| ErbB2/ErbB3/neuregulin 1 beta/SHC | 0.028 | 0.082 | -10000 | 0 | -0.35 | 20 | 20 |
| AKT1 | 0.011 | 0.005 | -10000 | 0 | -10000 | 0 | 0 |
| BAD | 0.01 | 0.026 | -10000 | 0 | -0.39 | 2 | 2 |
| MAPK10 | 0.019 | 0.056 | 0.2 | 7 | -0.31 | 2 | 9 |
| mol:GTP | -0.001 | 0.002 | -10000 | 0 | -10000 | 0 | 0 |
| ErbB2/ErbB3/neuregulin 1 beta | 0.015 | 0.078 | -10000 | 0 | -10000 | 0 | 0 |
| RAF1 | -0.007 | 0.088 | -10000 | 0 | -0.51 | 6 | 6 |
| ErbB2/ErbB3/neuregulin 2 | 0.015 | 0.072 | -10000 | 0 | -0.36 | 16 | 16 |
| STAT3 | 0.028 | 0.1 | -10000 | 0 | -0.89 | 6 | 6 |
| cell migration | 0.039 | 0.082 | 0.32 | 16 | -0.26 | 2 | 18 |
| mol:PI-3-4-5-P3 | 0 | 0.002 | -10000 | 0 | -10000 | 0 | 0 |
| cell proliferation | -0.12 | 0.19 | -10000 | 0 | -0.53 | 11 | 11 |
| FOS | -0.07 | 0.14 | 0.3 | 2 | -0.49 | 12 | 14 |
| NRAS | 0.029 | 0.005 | -10000 | 0 | -10000 | 0 | 0 |
| mol:Ca2+ | 0.014 | 0.072 | -10000 | 0 | -10000 | 0 | 0 |
| MAPK3 | -0.093 | 0.16 | -10000 | 0 | -0.56 | 6 | 6 |
| MAPK1 | -0.093 | 0.17 | 0.38 | 1 | -0.58 | 8 | 9 |
| JAK2 | 0.007 | 0.065 | -10000 | 0 | -10000 | 0 | 0 |
| NF2 | 0.018 | 0.037 | -10000 | 0 | -0.79 | 1 | 1 |
| ErbB2/ErbB3/neuregulin 1 beta/SHC/GRB2/SOS1 | 0.009 | 0.085 | -10000 | 0 | -0.4 | 17 | 17 |
| NRG1 | 0.008 | 0.1 | -10000 | 0 | -0.56 | 16 | 16 |
| GRB2/SOS1 | 0.042 | 0.009 | -10000 | 0 | -10000 | 0 | 0 |
| MAPK8 | 0.011 | 0.076 | -10000 | 0 | -0.34 | 5 | 5 |
| MAPK9 | 0.011 | 0.044 | 0.2 | 5 | -0.27 | 1 | 6 |
| ERBB2 | -0.015 | 0.03 | -10000 | 0 | -0.49 | 2 | 2 |
| ERBB3 | 0.018 | 0.083 | -10000 | 0 | -0.64 | 8 | 8 |
| SHC1 | 0.028 | 0.007 | -10000 | 0 | -10000 | 0 | 0 |
| RAC1 | 0.027 | 0.009 | -10000 | 0 | -10000 | 0 | 0 |
| apoptosis | -0.006 | 0.022 | 0.28 | 2 | -10000 | 0 | 2 |
| STAT3 (dimer) | 0.028 | 0.099 | -10000 | 0 | -0.86 | 6 | 6 |
| RNF41 | 0.009 | 0.006 | -10000 | 0 | -10000 | 0 | 0 |
| FRAP1 | 0.005 | 0.003 | -10000 | 0 | -10000 | 0 | 0 |
| RAC1-CDC42/GTP | 0.01 | 0.049 | -10000 | 0 | -0.39 | 1 | 1 |
| ErbB2/ErbB2/HSP90 (dimer) | 0.016 | 0.029 | -10000 | 0 | -0.42 | 2 | 2 |
| CHRNA1 | -0.13 | 0.19 | 0.34 | 1 | -0.42 | 59 | 60 |
| myelination | 0.007 | 0.078 | 0.37 | 9 | -0.43 | 1 | 10 |
| PPP3CB | 0.007 | 0.063 | -10000 | 0 | -10000 | 0 | 0 |
| KRAS | 0.029 | 0.006 | -10000 | 0 | -10000 | 0 | 0 |
| RAC1-CDC42/GDP | 0.034 | 0.085 | -10000 | 0 | -0.53 | 5 | 5 |
| NRG2 | 0.012 | 0.082 | -10000 | 0 | -0.59 | 9 | 9 |
| mol:GDP | 0.009 | 0.085 | -10000 | 0 | -0.39 | 17 | 17 |
| SOS1 | 0.029 | 0.005 | -10000 | 0 | -10000 | 0 | 0 |
| MAP2K2 | -0.016 | 0.091 | 0.29 | 1 | -0.48 | 6 | 7 |
| SRC | 0.029 | 0.006 | -10000 | 0 | -10000 | 0 | 0 |
| mol:cAMP | 0 | 0.001 | -10000 | 0 | -10000 | 0 | 0 |
| PTPN11 | 0.009 | 0.066 | -10000 | 0 | -10000 | 0 | 0 |
| MAP2K1 | -0.11 | 0.18 | -10000 | 0 | -0.56 | 12 | 12 |
| heart morphogenesis | 0.014 | 0.072 | -10000 | 0 | -10000 | 0 | 0 |
| RAS family/GDP | 0.041 | 0.091 | -10000 | 0 | -0.53 | 6 | 6 |
| GRB2 | 0.029 | 0.005 | -10000 | 0 | -10000 | 0 | 0 |
| PRKACA | 0.017 | 0.038 | -10000 | 0 | -0.83 | 1 | 1 |
| CHRNE | 0.013 | 0.022 | 0.2 | 1 | -0.19 | 2 | 3 |
| HSP90AA1 | 0.028 | 0.008 | -10000 | 0 | -10000 | 0 | 0 |
| activation of caspase activity | -0.011 | 0.005 | -10000 | 0 | -10000 | 0 | 0 |
| nervous system development | 0.014 | 0.072 | -10000 | 0 | -10000 | 0 | 0 |
| CDC42 | 0.029 | 0.006 | -10000 | 0 | -10000 | 0 | 0 |
Figure S99. Get High-res Image This plot shows pathway concept perturbations across all samples against a permutation model. The concepts along the x-axis are sorted by lowest to highest mean activity for the real patient samples. Mean inferred activities are plotted along the y-axis as a colored band showing the average level and one standard deviation range. Real samples are shown in red and permuted samples in black.
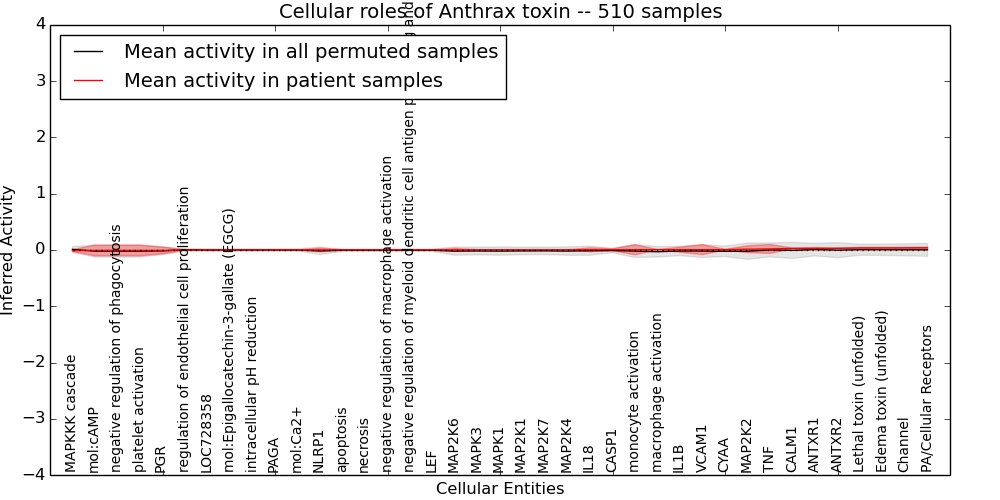
Table S99. Get Full Table This table displays mean, standard deviation, and perturbation statistics for Inferred Pathway Levels (IPLs). A mean perturbation of -9999 implies that the IPLs across all the real samples did not differ enough from the IPLs generated by a background model of permuted samples (> 1 Std.Dev from the permuted sample IPLs).
| Entity | Mean | Std.Dev | Mean.of.Up.Perturbations | Number.of.Up.Perturbations | Mean.of.Down.Perturbations | Number.of.Down.Perturbations | Number.of.Total.Perturbations |
|---|---|---|---|---|---|---|---|
| ANTXR1 | 0.029 | 0.016 | -10000 | 0 | -0.32 | 1 | 1 |
| ANTXR2 | 0.03 | 0.004 | -10000 | 0 | -10000 | 0 | 0 |
| negative regulation of myeloid dendritic cell antigen processing and presentation | 0.002 | 0.002 | -10000 | 0 | -10000 | 0 | 0 |
| monocyte activation | 0.005 | 0.091 | -10000 | 0 | -0.37 | 23 | 23 |
| MAP2K2 | 0.014 | 0.061 | -10000 | 0 | -0.59 | 5 | 5 |
| MAP2K1 | 0.004 | 0.002 | -10000 | 0 | -10000 | 0 | 0 |
| MAP2K7 | 0.004 | 0.002 | -10000 | 0 | -10000 | 0 | 0 |
| MAP2K6 | 0.002 | 0.026 | -10000 | 0 | -0.34 | 3 | 3 |
| CYAA | 0.006 | 0.007 | -10000 | 0 | -10000 | 0 | 0 |
| MAP2K4 | 0.004 | 0.001 | -10000 | 0 | -10000 | 0 | 0 |
| IL1B | 0.006 | 0.046 | 0.24 | 6 | -0.31 | 6 | 12 |
| Channel | 0.037 | 0.012 | -10000 | 0 | -10000 | 0 | 0 |
| NLRP1 | 0.001 | 0.034 | -10000 | 0 | -0.34 | 5 | 5 |
| CALM1 | 0.028 | 0.008 | -10000 | 0 | -10000 | 0 | 0 |
| negative regulation of phagocytosis | -0.008 | 0.096 | -10000 | 0 | -0.37 | 33 | 33 |
| mol:Ca2+ | 0 | 0 | -10000 | 0 | -10000 | 0 | 0 |
| regulation of endothelial cell proliferation | -0.002 | 0.002 | -10000 | 0 | -10000 | 0 | 0 |
| MAPK3 | 0.004 | 0.002 | -10000 | 0 | -10000 | 0 | 0 |
| MAPK1 | 0.004 | 0.002 | -10000 | 0 | -10000 | 0 | 0 |
| PGR | -0.007 | 0.061 | -10000 | 0 | -0.35 | 16 | 16 |
| PA/Cellular Receptors | 0.039 | 0.013 | -10000 | 0 | -10000 | 0 | 0 |
| apoptosis | 0.002 | 0.002 | -10000 | 0 | -10000 | 0 | 0 |
| LOC728358 | 0 | 0 | -10000 | 0 | -10000 | 0 | 0 |
| Lethal toxin (unfolded) | 0.036 | 0.011 | -10000 | 0 | -10000 | 0 | 0 |
| macrophage activation | 0.006 | 0.003 | -10000 | 0 | -10000 | 0 | 0 |
| TNF | 0.019 | 0.08 | -10000 | 0 | -0.61 | 8 | 8 |
| VCAM1 | 0.006 | 0.09 | -10000 | 0 | -0.37 | 22 | 22 |
| platelet activation | -0.008 | 0.096 | -10000 | 0 | -0.37 | 33 | 33 |
| MAPKKK cascade | -0.01 | 0.018 | -10000 | 0 | -0.14 | 4 | 4 |
| IL18 | 0.004 | 0.036 | -10000 | 0 | -0.29 | 6 | 6 |
| negative regulation of macrophage activation | 0.002 | 0.002 | -10000 | 0 | -10000 | 0 | 0 |
| LEF | 0.002 | 0.002 | -10000 | 0 | -10000 | 0 | 0 |
| CASP1 | 0.005 | 0.017 | -10000 | 0 | -0.16 | 5 | 5 |
| mol:cAMP | -0.008 | 0.096 | -10000 | 0 | -0.37 | 33 | 33 |
| necrosis | 0.002 | 0.002 | -10000 | 0 | -10000 | 0 | 0 |
| intracellular pH reduction | 0 | 0 | -10000 | 0 | -10000 | 0 | 0 |
| PAGA | 0 | 0 | -10000 | 0 | -10000 | 0 | 0 |
| Edema toxin (unfolded) | 0.036 | 0.011 | -10000 | 0 | -10000 | 0 | 0 |
| mol:Epigallocatechin-3-gallate (EGCG) | 0 | 0 | -10000 | 0 | -10000 | 0 | 0 |
Figure S100. Get High-res Image This plot shows pathway concept perturbations across all samples against a permutation model. The concepts along the x-axis are sorted by lowest to highest mean activity for the real patient samples. Mean inferred activities are plotted along the y-axis as a colored band showing the average level and one standard deviation range. Real samples are shown in red and permuted samples in black.
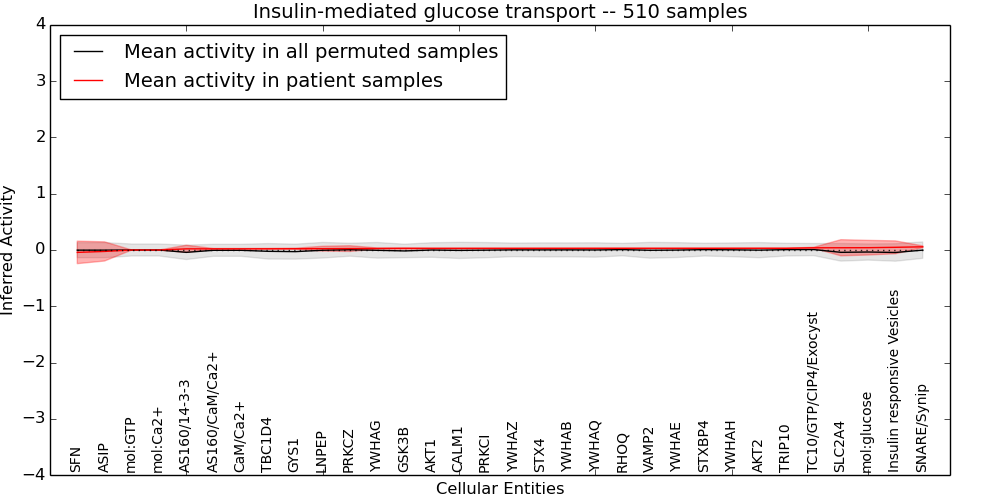
Table S100. Get Full Table This table displays mean, standard deviation, and perturbation statistics for Inferred Pathway Levels (IPLs). A mean perturbation of -9999 implies that the IPLs across all the real samples did not differ enough from the IPLs generated by a background model of permuted samples (> 1 Std.Dev from the permuted sample IPLs).
| Entity | Mean | Std.Dev | Mean.of.Up.Perturbations | Number.of.Up.Perturbations | Mean.of.Down.Perturbations | Number.of.Down.Perturbations | Number.of.Total.Perturbations |
|---|---|---|---|---|---|---|---|
| Insulin responsive Vesicles | 0.048 | 0.11 | 0.35 | 2 | -0.57 | 7 | 9 |
| CaM/Ca2+ | 0.021 | 0.006 | -10000 | 0 | -10000 | 0 | 0 |
| AKT1 | 0.028 | 0.008 | -10000 | 0 | -10000 | 0 | 0 |
| AKT2 | 0.03 | 0.004 | -10000 | 0 | -10000 | 0 | 0 |
| STXBP4 | 0.029 | 0.005 | -10000 | 0 | -10000 | 0 | 0 |
| mol:GTP | 0 | 0 | -10000 | 0 | -10000 | 0 | 0 |
| mol:glucose | 0.041 | 0.13 | 0.33 | 10 | -0.52 | 13 | 23 |
| YWHAZ | 0.029 | 0.007 | -10000 | 0 | -10000 | 0 | 0 |
| CALM1 | 0.028 | 0.008 | -10000 | 0 | -10000 | 0 | 0 |
| YWHAQ | 0.029 | 0.005 | -10000 | 0 | -10000 | 0 | 0 |
| TBC1D4 | 0.021 | 0.007 | -10000 | 0 | -10000 | 0 | 0 |
| mol:Ca2+ | 0 | 0 | -10000 | 0 | -10000 | 0 | 0 |
| YWHAH | 0.03 | 0.004 | -10000 | 0 | -10000 | 0 | 0 |
| YWHAB | 0.029 | 0.006 | -10000 | 0 | -10000 | 0 | 0 |
| SNARE/Synip | 0.057 | 0.016 | -10000 | 0 | -10000 | 0 | 0 |
| YWHAG | 0.027 | 0.009 | -10000 | 0 | -10000 | 0 | 0 |
| ASIP | -0.025 | 0.17 | -10000 | 0 | -0.59 | 43 | 43 |
| PRKCI | 0.029 | 0.007 | -10000 | 0 | -10000 | 0 | 0 |
| AS160/CaM/Ca2+ | 0.021 | 0.006 | -10000 | 0 | -10000 | 0 | 0 |
| RHOQ | 0.029 | 0.005 | -10000 | 0 | -10000 | 0 | 0 |
| GYS1 | 0.023 | 0.009 | -10000 | 0 | -10000 | 0 | 0 |
| PRKCZ | 0.025 | 0.051 | -10000 | 0 | -0.64 | 3 | 3 |
| TRIP10 | 0.03 | 0.003 | -10000 | 0 | -10000 | 0 | 0 |
| TC10/GTP/CIP4/Exocyst | 0.039 | 0.008 | -10000 | 0 | -10000 | 0 | 0 |
| AS160/14-3-3 | 0.021 | 0.064 | -10000 | 0 | -0.34 | 3 | 3 |
| VAMP2 | 0.029 | 0.005 | -10000 | 0 | -10000 | 0 | 0 |
| SLC2A4 | 0.04 | 0.14 | 0.34 | 10 | -0.6 | 13 | 23 |
| STX4 | 0.029 | 0.006 | -10000 | 0 | -10000 | 0 | 0 |
| GSK3B | 0.028 | 0.011 | -10000 | 0 | -10000 | 0 | 0 |
| SFN | -0.043 | 0.2 | -10000 | 0 | -0.59 | 59 | 59 |
| LNPEP | 0.023 | 0.043 | -10000 | 0 | -0.64 | 2 | 2 |
| YWHAE | 0.029 | 0.005 | -10000 | 0 | -10000 | 0 | 0 |
Figure S101. Get High-res Image This plot shows pathway concept perturbations across all samples against a permutation model. The concepts along the x-axis are sorted by lowest to highest mean activity for the real patient samples. Mean inferred activities are plotted along the y-axis as a colored band showing the average level and one standard deviation range. Real samples are shown in red and permuted samples in black.
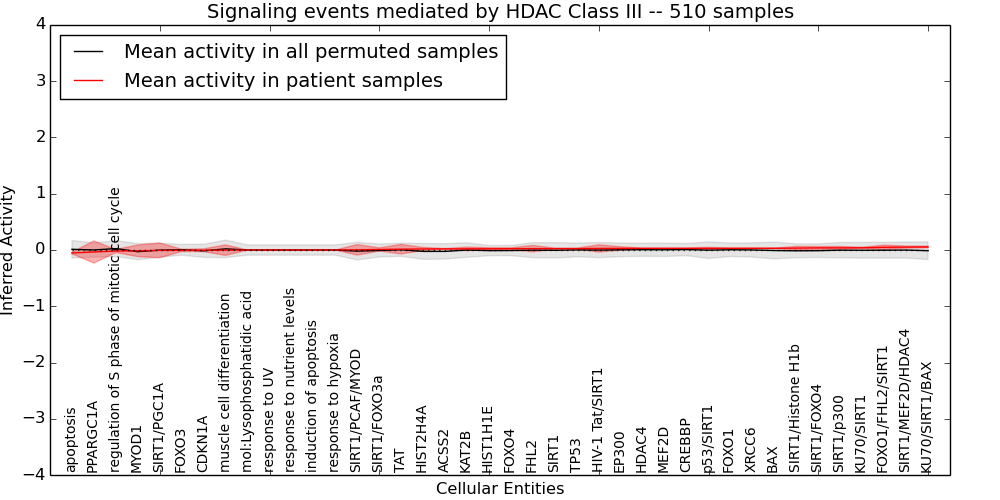
Table S101. Get Full Table This table displays mean, standard deviation, and perturbation statistics for Inferred Pathway Levels (IPLs). A mean perturbation of -9999 implies that the IPLs across all the real samples did not differ enough from the IPLs generated by a background model of permuted samples (> 1 Std.Dev from the permuted sample IPLs).
| Entity | Mean | Std.Dev | Mean.of.Up.Perturbations | Number.of.Up.Perturbations | Mean.of.Down.Perturbations | Number.of.Down.Perturbations | Number.of.Total.Perturbations |
|---|---|---|---|---|---|---|---|
| EP300 | 0.028 | 0.03 | -10000 | 0 | -0.64 | 1 | 1 |
| HDAC4 | 0.029 | 0.007 | -10000 | 0 | -10000 | 0 | 0 |
| induction of apoptosis | 0 | 0 | -10000 | 0 | -10000 | 0 | 0 |
| regulation of S phase of mitotic cell cycle | -0.018 | 0.028 | 0.41 | 2 | -10000 | 0 | 2 |
| CDKN1A | -0.004 | 0.025 | -10000 | 0 | -0.4 | 2 | 2 |
| KAT2B | 0.02 | 0.032 | -10000 | 0 | -0.64 | 1 | 1 |
| BAX | 0.03 | 0.003 | -10000 | 0 | -10000 | 0 | 0 |
| FOXO3 | -0.007 | 0.021 | 0.47 | 1 | -10000 | 0 | 1 |
| FOXO1 | 0.029 | 0.005 | -10000 | 0 | -10000 | 0 | 0 |
| FOXO4 | 0.023 | 0.016 | -10000 | 0 | -0.3 | 1 | 1 |
| response to UV | 0 | 0 | -10000 | 0 | -10000 | 0 | 0 |
| XRCC6 | 0.03 | 0.004 | -10000 | 0 | -10000 | 0 | 0 |
| TAT | 0.015 | 0.085 | -10000 | 0 | -0.59 | 10 | 10 |
| mol:Lysophosphatidic acid | 0 | 0 | -10000 | 0 | -10000 | 0 | 0 |
| MYOD1 | -0.014 | 0.1 | -10000 | 0 | -0.43 | 30 | 30 |
| PPARGC1A | -0.035 | 0.2 | -10000 | 0 | -0.63 | 50 | 50 |
| FHL2 | 0.024 | 0.058 | -10000 | 0 | -0.62 | 4 | 4 |
| response to nutrient levels | 0 | 0 | -10000 | 0 | -10000 | 0 | 0 |
| KU70/SIRT1 | 0.039 | 0.01 | -10000 | 0 | -10000 | 0 | 0 |
| HIST2H4A | 0.018 | 0.028 | -10000 | 0 | -0.41 | 2 | 2 |
| SIRT1/FOXO3a | 0.01 | 0.028 | 0.31 | 1 | -10000 | 0 | 1 |
| SIRT1 | 0.024 | 0.008 | -10000 | 0 | -10000 | 0 | 0 |
| response to hypoxia | 0 | 0 | -10000 | 0 | -10000 | 0 | 0 |
| SIRT1/MEF2D/HDAC4 | 0.052 | 0.019 | -10000 | 0 | -10000 | 0 | 0 |
| SIRT1/Histone H1b | 0.034 | 0.031 | -10000 | 0 | -0.27 | 1 | 1 |
| apoptosis | -0.054 | 0.014 | -10000 | 0 | -10000 | 0 | 0 |
| SIRT1/PGC1A | -0.007 | 0.13 | -10000 | 0 | -0.41 | 49 | 49 |
| p53/SIRT1 | 0.029 | 0.018 | 0.3 | 2 | -10000 | 0 | 2 |
| SIRT1/FOXO4 | 0.038 | 0.024 | -10000 | 0 | -0.26 | 1 | 1 |
| FOXO1/FHL2/SIRT1 | 0.048 | 0.039 | -10000 | 0 | -0.36 | 4 | 4 |
| HIST1H1E | 0.022 | 0.019 | -10000 | 0 | -0.31 | 1 | 1 |
| SIRT1/p300 | 0.038 | 0.025 | -10000 | 0 | -0.47 | 1 | 1 |
| muscle cell differentiation | -0.003 | 0.094 | 0.36 | 30 | -10000 | 0 | 30 |
| TP53 | 0.025 | 0.008 | -10000 | 0 | -10000 | 0 | 0 |
| KU70/SIRT1/BAX | 0.055 | 0.015 | -10000 | 0 | -10000 | 0 | 0 |
| CREBBP | 0.029 | 0.006 | -10000 | 0 | -10000 | 0 | 0 |
| MEF2D | 0.029 | 0.007 | -10000 | 0 | -10000 | 0 | 0 |
| HIV-1 Tat/SIRT1 | 0.028 | 0.066 | -10000 | 0 | -0.43 | 10 | 10 |
| ACSS2 | 0.02 | 0.006 | -10000 | 0 | -10000 | 0 | 0 |
| SIRT1/PCAF/MYOD | 0.003 | 0.094 | -10000 | 0 | -0.36 | 30 | 30 |
Figure S102. Get High-res Image This plot shows pathway concept perturbations across all samples against a permutation model. The concepts along the x-axis are sorted by lowest to highest mean activity for the real patient samples. Mean inferred activities are plotted along the y-axis as a colored band showing the average level and one standard deviation range. Real samples are shown in red and permuted samples in black.
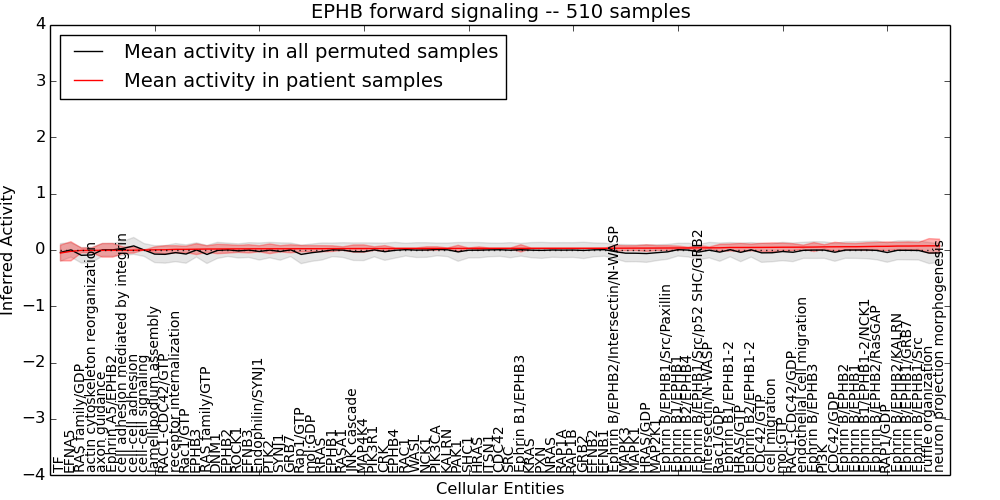
Table S102. Get Full Table This table displays mean, standard deviation, and perturbation statistics for Inferred Pathway Levels (IPLs). A mean perturbation of -9999 implies that the IPLs across all the real samples did not differ enough from the IPLs generated by a background model of permuted samples (> 1 Std.Dev from the permuted sample IPLs).
| Entity | Mean | Std.Dev | Mean.of.Up.Perturbations | Number.of.Up.Perturbations | Mean.of.Down.Perturbations | Number.of.Down.Perturbations | Number.of.Total.Perturbations |
|---|---|---|---|---|---|---|---|
| Ephrin A5/EPHB2 | -0.006 | 0.12 | -10000 | 0 | -0.4 | 42 | 42 |
| cell-cell adhesion | -0.003 | 0.051 | 0.47 | 2 | -10000 | 0 | 2 |
| Ephrin B/EPHB2/RasGAP | 0.065 | 0.07 | -10000 | 0 | -0.34 | 9 | 9 |
| ITSN1 | 0.029 | 0.006 | -10000 | 0 | -10000 | 0 | 0 |
| PIK3CA | 0.027 | 0.03 | -10000 | 0 | -0.64 | 1 | 1 |
| SHC1 | 0.029 | 0.007 | -10000 | 0 | -10000 | 0 | 0 |
| Ephrin B1/EPHB3 | 0.029 | 0.065 | -10000 | 0 | -0.41 | 11 | 11 |
| Ephrin B1/EPHB1 | 0.036 | 0.035 | -10000 | 0 | -0.39 | 3 | 3 |
| HRAS/GDP | 0.034 | 0.058 | -10000 | 0 | -0.48 | 1 | 1 |
| Ephrin B/EPHB1/GRB7 | 0.07 | 0.073 | -10000 | 0 | -0.34 | 11 | 11 |
| Endophilin/SYNJ1 | 0.021 | 0.055 | -10000 | 0 | -10000 | 0 | 0 |
| KRAS | 0.029 | 0.006 | -10000 | 0 | -10000 | 0 | 0 |
| Ephrin B/EPHB1/Src | 0.072 | 0.062 | -10000 | 0 | -10000 | 0 | 0 |
| endothelial cell migration | 0.051 | 0.036 | -10000 | 0 | -0.34 | 2 | 2 |
| GRB2 | 0.029 | 0.005 | -10000 | 0 | -10000 | 0 | 0 |
| GRB7 | 0.022 | 0.072 | -10000 | 0 | -0.64 | 6 | 6 |
| PAK1 | 0.028 | 0.055 | -10000 | 0 | -10000 | 0 | 0 |
| HRAS | 0.029 | 0.027 | -10000 | 0 | -0.59 | 1 | 1 |
| RRAS | 0.023 | 0.055 | -10000 | 0 | -10000 | 0 | 0 |
| DNM1 | 0.018 | 0.083 | -10000 | 0 | -0.6 | 9 | 9 |
| cell-cell signaling | 0 | 0 | -10000 | 0 | -10000 | 0 | 0 |
| CRK | 0.026 | 0.052 | -10000 | 0 | -10000 | 0 | 0 |
| lamellipodium assembly | 0.003 | 0.051 | -10000 | 0 | -0.47 | 2 | 2 |
| Ephrin B/EPHB1/Src/p52 SHC/GRB2 | 0.038 | 0.046 | -10000 | 0 | -0.43 | 1 | 1 |
| PIK3R1 | 0.026 | 0.031 | -10000 | 0 | -0.64 | 1 | 1 |
| EPHB2 | 0.019 | 0.075 | -10000 | 0 | -0.52 | 9 | 9 |
| EPHB3 | 0.014 | 0.097 | -10000 | 0 | -0.64 | 11 | 11 |
| EPHB1 | 0.025 | 0.05 | -10000 | 0 | -0.62 | 3 | 3 |
| EPHB4 | 0.027 | 0.009 | -10000 | 0 | -10000 | 0 | 0 |
| mol:GDP | 0.023 | 0.056 | 0.36 | 2 | -0.47 | 1 | 3 |
| Ephrin B/EPHB2 | 0.058 | 0.06 | -10000 | 0 | -0.35 | 9 | 9 |
| Ephrin B/EPHB3 | 0.052 | 0.079 | -10000 | 0 | -0.37 | 16 | 16 |
| JNK cascade | 0.025 | 0.064 | 0.36 | 5 | -0.56 | 2 | 7 |
| Ephrin B/EPHB1 | 0.058 | 0.057 | -10000 | 0 | -0.34 | 9 | 9 |
| RAP1/GDP | 0.066 | 0.078 | 0.35 | 5 | -0.4 | 1 | 6 |
| EFNB2 | 0.03 | 0.004 | -10000 | 0 | -10000 | 0 | 0 |
| EFNB3 | 0.021 | 0.073 | -10000 | 0 | -0.59 | 7 | 7 |
| EFNB1 | 0.03 | 0.002 | -10000 | 0 | -10000 | 0 | 0 |
| Ephrin B2/EPHB1-2 | 0.045 | 0.06 | -10000 | 0 | -0.44 | 6 | 6 |
| RAP1B | 0.029 | 0.005 | -10000 | 0 | -10000 | 0 | 0 |
| RAP1A | 0.029 | 0.005 | -10000 | 0 | -10000 | 0 | 0 |
| CDC42/GTP | 0.046 | 0.072 | -10000 | 0 | -0.54 | 2 | 2 |
| Rap1/GTP | 0.023 | 0.057 | -10000 | 0 | -0.56 | 1 | 1 |
| axon guidance | -0.006 | 0.12 | -10000 | 0 | -0.4 | 42 | 42 |
| MAPK3 | 0.033 | 0.043 | -10000 | 0 | -0.38 | 1 | 1 |
| MAPK1 | 0.034 | 0.043 | -10000 | 0 | -0.38 | 1 | 1 |
| Rac1/GDP | 0.039 | 0.063 | 0.36 | 2 | -0.43 | 1 | 3 |
| actin cytoskeleton reorganization | -0.007 | 0.044 | -10000 | 0 | -0.39 | 3 | 3 |
| CDC42/GDP | 0.057 | 0.08 | 0.36 | 5 | -0.42 | 1 | 6 |
| PI3K | 0.056 | 0.038 | -10000 | 0 | -0.35 | 2 | 2 |
| EFNA5 | -0.023 | 0.17 | -10000 | 0 | -0.63 | 37 | 37 |
| Ephrin B2/EPHB4 | 0.036 | 0.013 | -10000 | 0 | -10000 | 0 | 0 |
| Ephrin B/EPHB2/Intersectin/N-WASP | 0.032 | 0.05 | -10000 | 0 | -0.37 | 1 | 1 |
| CDC42 | 0.029 | 0.006 | -10000 | 0 | -10000 | 0 | 0 |
| RAS family/GTP | 0.017 | 0.058 | -10000 | 0 | -0.54 | 2 | 2 |
| PTK2 | 0.022 | 0.087 | 0.53 | 14 | -10000 | 0 | 14 |
| MAP4K4 | 0.026 | 0.065 | 0.36 | 5 | -0.57 | 2 | 7 |
| SRC | 0.029 | 0.006 | -10000 | 0 | -10000 | 0 | 0 |
| KALRN | 0.028 | 0.008 | -10000 | 0 | -10000 | 0 | 0 |
| Intersectin/N-WASP | 0.039 | 0.016 | -10000 | 0 | -10000 | 0 | 0 |
| neuron projection morphogenesis | 0.074 | 0.12 | 0.42 | 37 | -0.45 | 1 | 38 |
| MAP2K1 | 0.034 | 0.043 | -10000 | 0 | -0.4 | 1 | 1 |
| WASL | 0.027 | 0.009 | -10000 | 0 | -10000 | 0 | 0 |
| Ephrin B1/EPHB1-2/NCK1 | 0.061 | 0.068 | -10000 | 0 | -0.43 | 7 | 7 |
| cell migration | 0.047 | 0.079 | 0.43 | 6 | -0.43 | 1 | 7 |
| NRAS | 0.029 | 0.005 | -10000 | 0 | -10000 | 0 | 0 |
| SYNJ1 | 0.022 | 0.056 | -10000 | 0 | -10000 | 0 | 0 |
| PXN | 0.029 | 0.006 | -10000 | 0 | -10000 | 0 | 0 |
| TF | -0.054 | 0.14 | -10000 | 0 | -0.52 | 3 | 3 |
| HRAS/GTP | 0.045 | 0.072 | -10000 | 0 | -0.53 | 3 | 3 |
| Ephrin B1/EPHB1-2 | 0.045 | 0.062 | -10000 | 0 | -0.42 | 7 | 7 |
| cell adhesion mediated by integrin | -0.004 | 0.059 | 0.37 | 6 | -0.37 | 3 | 9 |
| RAC1 | 0.027 | 0.009 | -10000 | 0 | -10000 | 0 | 0 |
| mol:GTP | 0.049 | 0.072 | -10000 | 0 | -0.54 | 2 | 2 |
| RAC1-CDC42/GTP | 0.004 | 0.071 | -10000 | 0 | -0.68 | 2 | 2 |
| RASA1 | 0.025 | 0.031 | -10000 | 0 | -0.64 | 1 | 1 |
| RAC1-CDC42/GDP | 0.05 | 0.062 | 0.36 | 2 | -0.4 | 1 | 3 |
| ruffle organization | 0.074 | 0.13 | 0.4 | 47 | -0.56 | 1 | 48 |
| NCK1 | 0.027 | 0.03 | -10000 | 0 | -0.64 | 1 | 1 |
| receptor internalization | 0.011 | 0.065 | -10000 | 0 | -10000 | 0 | 0 |
| Ephrin B/EPHB2/KALRN | 0.07 | 0.066 | -10000 | 0 | -0.34 | 9 | 9 |
| ROCK1 | 0.02 | 0.062 | -10000 | 0 | -0.37 | 11 | 11 |
| RAS family/GDP | -0.007 | 0.044 | -10000 | 0 | -0.42 | 1 | 1 |
| Rac1/GTP | 0.012 | 0.056 | -10000 | 0 | -0.5 | 2 | 2 |
| Ephrin B/EPHB1/Src/Paxillin | 0.035 | 0.043 | -10000 | 0 | -0.34 | 1 | 1 |
Figure S103. Get High-res Image This plot shows pathway concept perturbations across all samples against a permutation model. The concepts along the x-axis are sorted by lowest to highest mean activity for the real patient samples. Mean inferred activities are plotted along the y-axis as a colored band showing the average level and one standard deviation range. Real samples are shown in red and permuted samples in black.
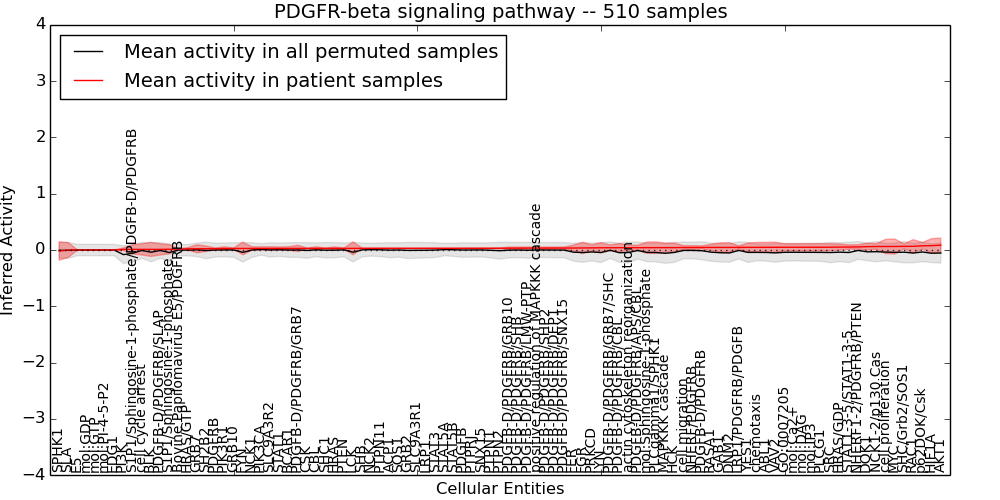
Table S103. Get Full Table This table displays mean, standard deviation, and perturbation statistics for Inferred Pathway Levels (IPLs). A mean perturbation of -9999 implies that the IPLs across all the real samples did not differ enough from the IPLs generated by a background model of permuted samples (> 1 Std.Dev from the permuted sample IPLs).
| Entity | Mean | Std.Dev | Mean.of.Up.Perturbations | Number.of.Up.Perturbations | Mean.of.Down.Perturbations | Number.of.Down.Perturbations | Number.of.Total.Perturbations |
|---|---|---|---|---|---|---|---|
| S1P1/Sphingosine-1-phosphate | 0.013 | 0.081 | -10000 | 0 | -10000 | 0 | 0 |
| PDGFB-D/PDGFRB/SLAP | 0.011 | 0.1 | -10000 | 0 | -0.44 | 23 | 23 |
| PDGFB-D/PDGFRB/APS/CBL | 0.041 | 0.044 | -10000 | 0 | -0.38 | 3 | 3 |
| AKT1 | 0.086 | 0.13 | 0.39 | 54 | -10000 | 0 | 54 |
| mol:PI-4-5-P2 | 0 | 0.001 | -10000 | 0 | -10000 | 0 | 0 |
| mol:Sphingosine-1-phosphate | 0.042 | 0.1 | 0.34 | 6 | -10000 | 0 | 6 |
| PIK3CA | 0.027 | 0.03 | -10000 | 0 | -0.64 | 1 | 1 |
| FGR | 0.036 | 0.1 | 0.33 | 5 | -0.62 | 2 | 7 |
| mol:Ca2+ | 0.049 | 0.065 | 0.33 | 8 | -10000 | 0 | 8 |
| MYC | 0.063 | 0.13 | 0.44 | 21 | -0.41 | 6 | 27 |
| SHC1 | 0.029 | 0.007 | -10000 | 0 | -10000 | 0 | 0 |
| HRAS/GDP | 0.052 | 0.056 | -10000 | 0 | -0.63 | 1 | 1 |
| LRP1/PDGFRB/PDGFB | 0.046 | 0.027 | -10000 | 0 | -10000 | 0 | 0 |
| GRB10 | 0.027 | 0.009 | -10000 | 0 | -10000 | 0 | 0 |
| PTPN11 | 0.029 | 0.006 | -10000 | 0 | -10000 | 0 | 0 |
| GO:0007205 | 0.048 | 0.065 | 0.33 | 8 | -10000 | 0 | 8 |
| PTEN | 0.029 | 0.006 | -10000 | 0 | -10000 | 0 | 0 |
| GRB2 | 0.029 | 0.005 | -10000 | 0 | -10000 | 0 | 0 |
| GRB7 | 0.022 | 0.072 | -10000 | 0 | -0.64 | 6 | 6 |
| PDGFB-D/PDGFRB/SHP2 | 0.034 | 0.02 | -10000 | 0 | -10000 | 0 | 0 |
| PDGFB-D/PDGFRB/GRB10 | 0.032 | 0.02 | -10000 | 0 | -10000 | 0 | 0 |
| cell cycle arrest | 0.011 | 0.099 | -10000 | 0 | -0.43 | 23 | 23 |
| HRAS | 0.029 | 0.027 | -10000 | 0 | -0.59 | 1 | 1 |
| HIF1A | 0.078 | 0.12 | 0.38 | 52 | -0.53 | 1 | 53 |
| GAB1 | 0.046 | 0.082 | 0.35 | 8 | -10000 | 0 | 8 |
| mol:GTP | 0 | 0 | -10000 | 0 | -10000 | 0 | 0 |
| DNM2 | 0.046 | 0.086 | 0.35 | 11 | -10000 | 0 | 11 |
| PDGFB-D/PDGFRB | 0.045 | 0.029 | -10000 | 0 | -10000 | 0 | 0 |
| mol:GDP | 0 | 0 | -10000 | 0 | -10000 | 0 | 0 |
| PDGFB-D/PDGFRB/LMW-PTP | 0.034 | 0.02 | -10000 | 0 | -10000 | 0 | 0 |
| S1P1/Sphingosine-1-phosphate/PDGFB-D/PDGFRB | 0.011 | 0.083 | -10000 | 0 | -0.4 | 1 | 1 |
| positive regulation of MAPKKK cascade | 0.034 | 0.02 | -10000 | 0 | -10000 | 0 | 0 |
| PIK3R1 | 0.026 | 0.031 | -10000 | 0 | -0.64 | 1 | 1 |
| mol:IP3 | 0.049 | 0.065 | 0.34 | 8 | -10000 | 0 | 8 |
| E5 | 0 | 0.001 | -10000 | 0 | -10000 | 0 | 0 |
| CSK | 0.028 | 0.005 | -10000 | 0 | -10000 | 0 | 0 |
| PDGFB-D/PDGFRB/GRB7 | 0.028 | 0.056 | -10000 | 0 | -0.44 | 6 | 6 |
| SHB | 0.029 | 0.006 | -10000 | 0 | -10000 | 0 | 0 |
| BLK | 0.011 | 0.13 | 0.32 | 3 | -0.48 | 8 | 11 |
| PTPN2 | 0.031 | 0.006 | -10000 | 0 | -10000 | 0 | 0 |
| PDGFB-D/PDGFRB/SNX15 | 0.034 | 0.019 | -10000 | 0 | -10000 | 0 | 0 |
| BCAR1 | 0.028 | 0.03 | -10000 | 0 | -0.64 | 1 | 1 |
| VAV2 | 0.048 | 0.091 | 0.36 | 10 | -10000 | 0 | 10 |
| CBL | 0.029 | 0.03 | -10000 | 0 | -0.64 | 1 | 1 |
| PDGFB-D/PDGFRB/DEP1 | 0.034 | 0.019 | -10000 | 0 | -10000 | 0 | 0 |
| LCK | 0.029 | 0.11 | 0.33 | 5 | -0.57 | 4 | 9 |
| PDGFRB | 0.024 | 0.013 | -10000 | 0 | -10000 | 0 | 0 |
| ACP1 | 0.029 | 0.005 | -10000 | 0 | -10000 | 0 | 0 |
| HCK | 0.042 | 0.081 | 0.35 | 4 | -10000 | 0 | 4 |
| ABL1 | 0.048 | 0.089 | 0.34 | 10 | -0.44 | 2 | 12 |
| PDGFB-D/PDGFRB/CBL | 0.041 | 0.076 | 0.35 | 3 | -0.4 | 2 | 5 |
| PTPN1 | 0.03 | 0.007 | -10000 | 0 | -10000 | 0 | 0 |
| SNX15 | 0.03 | 0.003 | -10000 | 0 | -10000 | 0 | 0 |
| STAT3 | 0.03 | 0.005 | -10000 | 0 | -10000 | 0 | 0 |
| STAT1 | 0.028 | 0.028 | -10000 | 0 | -0.59 | 1 | 1 |
| cell proliferation | 0.062 | 0.13 | 0.42 | 22 | -0.38 | 6 | 28 |
| SLA | 0 | 0.13 | -10000 | 0 | -0.59 | 24 | 24 |
| actin cytoskeleton reorganization | 0.041 | 0.047 | 0.36 | 2 | -10000 | 0 | 2 |
| SRC | 0.049 | 0.063 | 0.32 | 2 | -10000 | 0 | 2 |
| PI3K | 0.011 | 0.026 | -10000 | 0 | -10000 | 0 | 0 |
| PDGFB-D/PDGFRB/GRB7/SHC | 0.04 | 0.051 | -10000 | 0 | -0.41 | 4 | 4 |
| SH2B2 | 0.023 | 0.048 | -10000 | 0 | -0.59 | 3 | 3 |
| PLCgamma1/SPHK1 | 0.042 | 0.1 | 0.34 | 6 | -10000 | 0 | 6 |
| LYN | 0.04 | 0.09 | 0.32 | 2 | -0.63 | 2 | 4 |
| LRP1 | 0.029 | 0.005 | -10000 | 0 | -10000 | 0 | 0 |
| SOS1 | 0.029 | 0.005 | -10000 | 0 | -10000 | 0 | 0 |
| STAT5B | 0.03 | 0.005 | -10000 | 0 | -10000 | 0 | 0 |
| STAT5A | 0.03 | 0.005 | -10000 | 0 | -10000 | 0 | 0 |
| NCK1-2/p130 Cas | 0.062 | 0.05 | -10000 | 0 | -10000 | 0 | 0 |
| SPHK1 | -0.018 | 0.17 | -10000 | 0 | -0.58 | 40 | 40 |
| EDG1 | 0.001 | 0.003 | -10000 | 0 | -10000 | 0 | 0 |
| mol:DAG | 0.049 | 0.065 | 0.34 | 8 | -10000 | 0 | 8 |
| PLCG1 | 0.049 | 0.066 | 0.34 | 8 | -10000 | 0 | 8 |
| NHERF/PDGFRB | 0.045 | 0.034 | -10000 | 0 | -0.4 | 1 | 1 |
| YES1 | 0.047 | 0.077 | 0.34 | 1 | -0.53 | 3 | 4 |
| cell migration | 0.044 | 0.033 | -10000 | 0 | -0.4 | 1 | 1 |
| SHC/Grb2/SOS1 | 0.064 | 0.044 | -10000 | 0 | -10000 | 0 | 0 |
| SLC9A3R2 | 0.028 | 0.03 | -10000 | 0 | -0.64 | 1 | 1 |
| SLC9A3R1 | 0.029 | 0.005 | -10000 | 0 | -10000 | 0 | 0 |
| NHERF1-2/PDGFRB/PTEN | 0.054 | 0.04 | -10000 | 0 | -0.37 | 1 | 1 |
| FYN | 0.027 | 0.11 | 0.32 | 3 | -0.47 | 6 | 9 |
| DOK1 | 0.06 | 0.063 | -10000 | 0 | -10000 | 0 | 0 |
| HRAS/GTP | 0.021 | 0.02 | -10000 | 0 | -0.43 | 1 | 1 |
| PDGFB | 0.03 | 0.004 | -10000 | 0 | -10000 | 0 | 0 |
| RAC1 | 0.065 | 0.12 | 0.45 | 14 | -0.48 | 1 | 15 |
| PRKCD | 0.038 | 0.056 | -10000 | 0 | -10000 | 0 | 0 |
| FER | 0.035 | 0.051 | -10000 | 0 | -0.38 | 2 | 2 |
| MAPKKK cascade | 0.042 | 0.081 | 0.38 | 14 | -10000 | 0 | 14 |
| RASA1 | 0.046 | 0.057 | -10000 | 0 | -0.38 | 1 | 1 |
| NCK1 | 0.027 | 0.03 | -10000 | 0 | -0.64 | 1 | 1 |
| NCK2 | 0.029 | 0.006 | -10000 | 0 | -10000 | 0 | 0 |
| p62DOK/Csk | 0.074 | 0.059 | -10000 | 0 | -10000 | 0 | 0 |
| PDGFB-D/PDGFRB/SHB | 0.033 | 0.02 | -10000 | 0 | -10000 | 0 | 0 |
| chemotaxis | 0.047 | 0.088 | 0.34 | 11 | -0.43 | 2 | 13 |
| STAT1-3-5/STAT1-3-5 | 0.053 | 0.039 | -10000 | 0 | -10000 | 0 | 0 |
| Bovine Papilomavirus E5/PDGFRB | 0.017 | 0.01 | -10000 | 0 | -10000 | 0 | 0 |
| PTPRJ | 0.03 | 0.003 | -10000 | 0 | -10000 | 0 | 0 |
Figure S104. Get High-res Image This plot shows pathway concept perturbations across all samples against a permutation model. The concepts along the x-axis are sorted by lowest to highest mean activity for the real patient samples. Mean inferred activities are plotted along the y-axis as a colored band showing the average level and one standard deviation range. Real samples are shown in red and permuted samples in black.
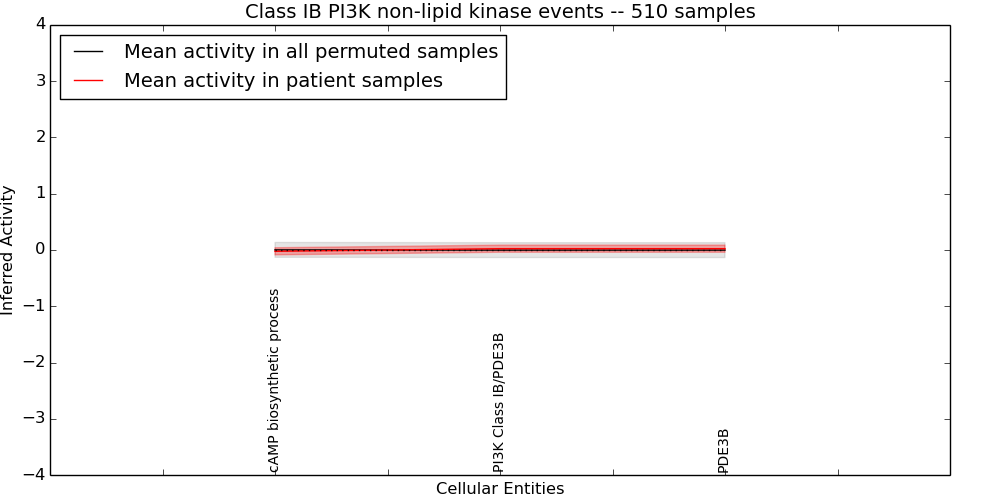
Table S104. Get Full Table This table displays mean, standard deviation, and perturbation statistics for Inferred Pathway Levels (IPLs). A mean perturbation of -9999 implies that the IPLs across all the real samples did not differ enough from the IPLs generated by a background model of permuted samples (> 1 Std.Dev from the permuted sample IPLs).
| Entity | Mean | Std.Dev | Mean.of.Up.Perturbations | Number.of.Up.Perturbations | Mean.of.Down.Perturbations | Number.of.Down.Perturbations | Number.of.Total.Perturbations |
|---|---|---|---|---|---|---|---|
| cAMP biosynthetic process | -0.023 | 0.064 | 0.61 | 5 | -10000 | 0 | 5 |
| PI3K Class IB/PDE3B | 0.023 | 0.064 | -10000 | 0 | -0.62 | 5 | 5 |
| PDE3B | 0.023 | 0.064 | -10000 | 0 | -0.62 | 5 | 5 |
Figure S105. Get High-res Image This plot shows pathway concept perturbations across all samples against a permutation model. The concepts along the x-axis are sorted by lowest to highest mean activity for the real patient samples. Mean inferred activities are plotted along the y-axis as a colored band showing the average level and one standard deviation range. Real samples are shown in red and permuted samples in black.
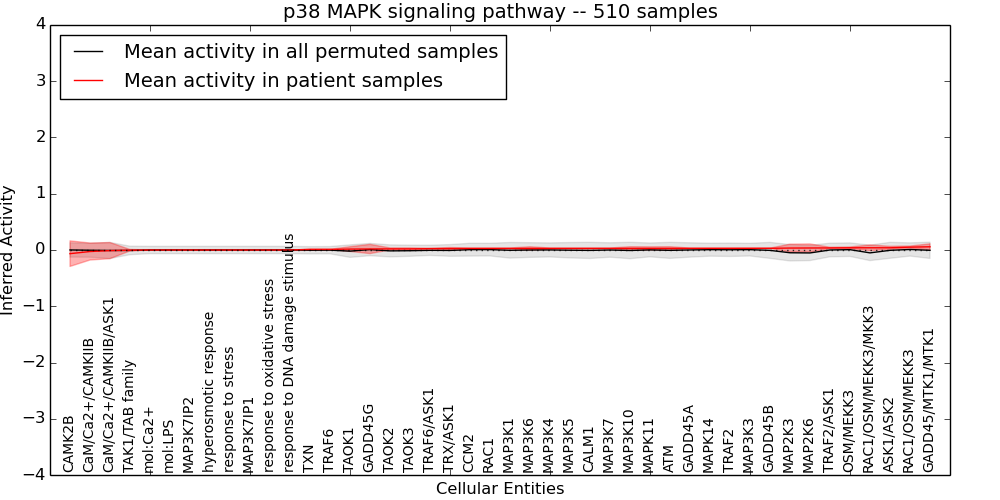
Table S105. Get Full Table This table displays mean, standard deviation, and perturbation statistics for Inferred Pathway Levels (IPLs). A mean perturbation of -9999 implies that the IPLs across all the real samples did not differ enough from the IPLs generated by a background model of permuted samples (> 1 Std.Dev from the permuted sample IPLs).
| Entity | Mean | Std.Dev | Mean.of.Up.Perturbations | Number.of.Up.Perturbations | Mean.of.Down.Perturbations | Number.of.Down.Perturbations | Number.of.Total.Perturbations |
|---|---|---|---|---|---|---|---|
| TRAF6/ASK1 | 0.024 | 0.008 | -10000 | 0 | -10000 | 0 | 0 |
| TRAF2/ASK1 | 0.037 | 0.012 | -10000 | 0 | -10000 | 0 | 0 |
| ATM | 0.029 | 0.03 | -10000 | 0 | -0.64 | 1 | 1 |
| MAP2K3 | 0.034 | 0.069 | 0.47 | 3 | -10000 | 0 | 3 |
| response to stress | 0 | 0 | -10000 | 0 | -10000 | 0 | 0 |
| MAP2K6 | 0.036 | 0.072 | 0.41 | 3 | -0.36 | 3 | 6 |
| hyperosmotic response | 0 | 0 | -10000 | 0 | -10000 | 0 | 0 |
| response to oxidative stress | 0 | 0 | -10000 | 0 | -10000 | 0 | 0 |
| GADD45G | 0.018 | 0.082 | -10000 | 0 | -0.59 | 9 | 9 |
| TXN | 0.01 | 0.002 | -10000 | 0 | -10000 | 0 | 0 |
| CALM1 | 0.028 | 0.008 | -10000 | 0 | -10000 | 0 | 0 |
| GADD45A | 0.029 | 0.006 | -10000 | 0 | -10000 | 0 | 0 |
| GADD45B | 0.03 | 0.003 | -10000 | 0 | -10000 | 0 | 0 |
| MAP3K1 | 0.028 | 0.009 | -10000 | 0 | -10000 | 0 | 0 |
| MAP3K6 | 0.028 | 0.03 | -10000 | 0 | -0.64 | 1 | 1 |
| MAP3K7 | 0.028 | 0.007 | -10000 | 0 | -10000 | 0 | 0 |
| MAP3K4 | 0.028 | 0.008 | -10000 | 0 | -10000 | 0 | 0 |
| mol:Ca2+ | 0 | 0 | -10000 | 0 | -10000 | 0 | 0 |
| ASK1/ASK2 | 0.039 | 0.026 | -10000 | 0 | -0.47 | 1 | 1 |
| TAK1/TAB family | -0.004 | 0.013 | 0.15 | 1 | -10000 | 0 | 1 |
| RAC1/OSM/MEKK3 | 0.051 | 0.02 | -10000 | 0 | -10000 | 0 | 0 |
| TRAF2 | 0.029 | 0.006 | -10000 | 0 | -10000 | 0 | 0 |
| RAC1/OSM/MEKK3/MKK3 | 0.039 | 0.051 | -10000 | 0 | -10000 | 0 | 0 |
| TRAF6 | 0.011 | 0.001 | -10000 | 0 | -10000 | 0 | 0 |
| RAC1 | 0.027 | 0.009 | -10000 | 0 | -10000 | 0 | 0 |
| mol:LPS | 0 | 0 | -10000 | 0 | -10000 | 0 | 0 |
| CAMK2B | -0.065 | 0.23 | -10000 | 0 | -0.63 | 71 | 71 |
| CCM2 | 0.027 | 0.009 | -10000 | 0 | -10000 | 0 | 0 |
| CaM/Ca2+/CAMKIIB | -0.027 | 0.15 | -10000 | 0 | -0.4 | 71 | 71 |
| MAPK11 | 0.029 | 0.028 | -10000 | 0 | -0.59 | 1 | 1 |
| response to DNA damage stimulus | 0 | 0 | -10000 | 0 | -10000 | 0 | 0 |
| CaM/Ca2+/CAMKIIB/ASK1 | -0.011 | 0.14 | -10000 | 0 | -0.36 | 71 | 71 |
| OSM/MEKK3 | 0.039 | 0.015 | -10000 | 0 | -10000 | 0 | 0 |
| TAOK1 | 0.016 | 0.042 | -10000 | 0 | -0.33 | 7 | 7 |
| TAOK2 | 0.02 | 0.018 | -10000 | 0 | -0.37 | 1 | 1 |
| TAOK3 | 0.02 | 0.018 | -10000 | 0 | -0.37 | 1 | 1 |
| MAP3K7IP1 | 0 | 0 | -10000 | 0 | -10000 | 0 | 0 |
| MAPK14 | 0.029 | 0.006 | -10000 | 0 | -10000 | 0 | 0 |
| MAP3K7IP2 | 0 | 0 | -10000 | 0 | -10000 | 0 | 0 |
| MAP3K5 | 0.028 | 0.008 | -10000 | 0 | -10000 | 0 | 0 |
| MAP3K10 | 0.029 | 0.03 | -10000 | 0 | -0.64 | 1 | 1 |
| MAP3K3 | 0.029 | 0.005 | -10000 | 0 | -10000 | 0 | 0 |
| TRX/ASK1 | 0.025 | 0.018 | -10000 | 0 | -10000 | 0 | 0 |
| GADD45/MTK1/MTK1 | 0.057 | 0.053 | -10000 | 0 | -0.3 | 6 | 6 |
Figure S106. Get High-res Image This plot shows pathway concept perturbations across all samples against a permutation model. The concepts along the x-axis are sorted by lowest to highest mean activity for the real patient samples. Mean inferred activities are plotted along the y-axis as a colored band showing the average level and one standard deviation range. Real samples are shown in red and permuted samples in black.
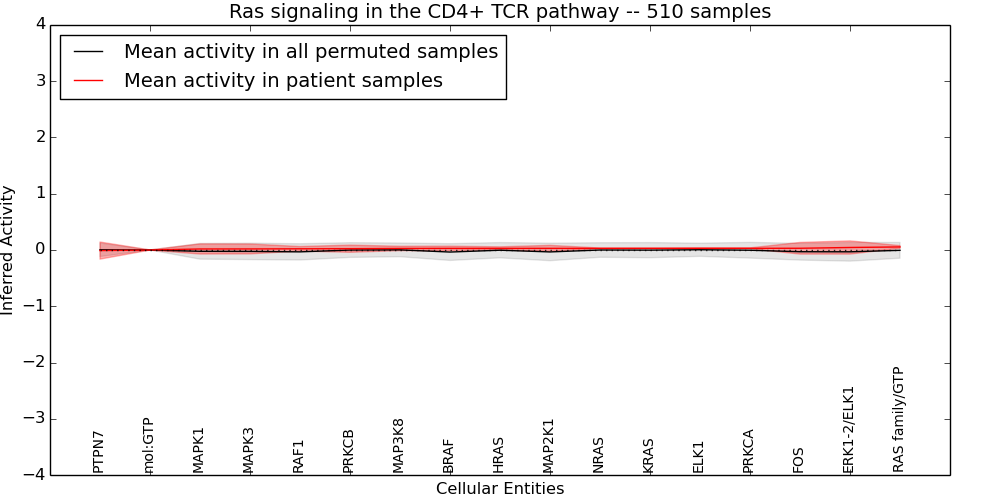
Table S106. Get Full Table This table displays mean, standard deviation, and perturbation statistics for Inferred Pathway Levels (IPLs). A mean perturbation of -9999 implies that the IPLs across all the real samples did not differ enough from the IPLs generated by a background model of permuted samples (> 1 Std.Dev from the permuted sample IPLs).
| Entity | Mean | Std.Dev | Mean.of.Up.Perturbations | Number.of.Up.Perturbations | Mean.of.Down.Perturbations | Number.of.Down.Perturbations | Number.of.Total.Perturbations |
|---|---|---|---|---|---|---|---|
| ERK1-2/ELK1 | 0.045 | 0.12 | 0.38 | 2 | -0.55 | 10 | 12 |
| MAP3K8 | 0.027 | 0.039 | -10000 | 0 | -0.59 | 2 | 2 |
| FOS | 0.031 | 0.1 | 0.36 | 4 | -0.53 | 8 | 12 |
| PRKCA | 0.03 | 0.008 | -10000 | 0 | -10000 | 0 | 0 |
| PTPN7 | -0.01 | 0.15 | -10000 | 0 | -0.59 | 33 | 33 |
| HRAS | 0.029 | 0.027 | -10000 | 0 | -0.59 | 1 | 1 |
| PRKCB | 0.023 | 0.064 | -10000 | 0 | -0.62 | 5 | 5 |
| NRAS | 0.029 | 0.006 | -10000 | 0 | -10000 | 0 | 0 |
| RAS family/GTP | 0.055 | 0.024 | -10000 | 0 | -0.33 | 1 | 1 |
| MAPK3 | 0.019 | 0.088 | -10000 | 0 | -0.55 | 7 | 7 |
| MAP2K1 | 0.029 | 0.054 | -10000 | 0 | -0.49 | 2 | 2 |
| ELK1 | 0.03 | 0.009 | -10000 | 0 | -10000 | 0 | 0 |
| BRAF | 0.029 | 0.04 | -10000 | 0 | -0.45 | 2 | 2 |
| mol:GTP | 0 | 0.002 | -10000 | 0 | -0.007 | 13 | 13 |
| MAPK1 | 0.018 | 0.09 | -10000 | 0 | -0.48 | 9 | 9 |
| RAF1 | 0.021 | 0.041 | -10000 | 0 | -0.45 | 2 | 2 |
| KRAS | 0.029 | 0.006 | -10000 | 0 | -10000 | 0 | 0 |
Figure S107. Get High-res Image This plot shows pathway concept perturbations across all samples against a permutation model. The concepts along the x-axis are sorted by lowest to highest mean activity for the real patient samples. Mean inferred activities are plotted along the y-axis as a colored band showing the average level and one standard deviation range. Real samples are shown in red and permuted samples in black.
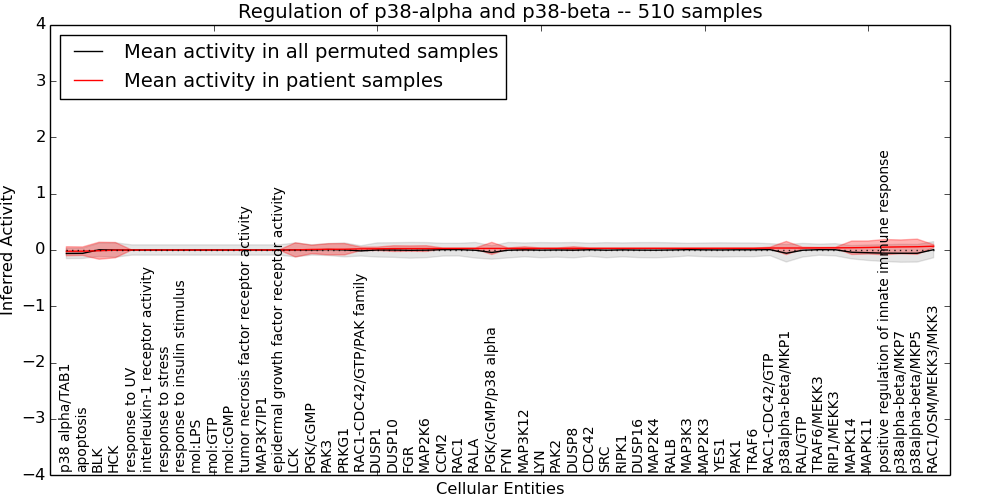
Table S107. Get Full Table This table displays mean, standard deviation, and perturbation statistics for Inferred Pathway Levels (IPLs). A mean perturbation of -9999 implies that the IPLs across all the real samples did not differ enough from the IPLs generated by a background model of permuted samples (> 1 Std.Dev from the permuted sample IPLs).
| Entity | Mean | Std.Dev | Mean.of.Up.Perturbations | Number.of.Up.Perturbations | Mean.of.Down.Perturbations | Number.of.Down.Perturbations | Number.of.Total.Perturbations |
|---|---|---|---|---|---|---|---|
| RIP1/MEKK3 | 0.039 | 0.009 | -10000 | 0 | -10000 | 0 | 0 |
| response to insulin stimulus | 0 | 0 | -10000 | 0 | -10000 | 0 | 0 |
| RIPK1 | 0.029 | 0.006 | -10000 | 0 | -10000 | 0 | 0 |
| response to stress | 0 | 0 | -10000 | 0 | -10000 | 0 | 0 |
| MAP2K6 | 0.025 | 0.051 | -10000 | 0 | -0.64 | 3 | 3 |
| mol:GTP | 0 | 0 | -10000 | 0 | -10000 | 0 | 0 |
| MAP2K4 | 0.029 | 0.005 | -10000 | 0 | -10000 | 0 | 0 |
| RAC1-CDC42/GTP/PAK family | 0.021 | 0.03 | -10000 | 0 | -0.22 | 2 | 2 |
| response to UV | 0 | 0 | -10000 | 0 | -10000 | 0 | 0 |
| YES1 | 0.03 | 0.004 | -10000 | 0 | -10000 | 0 | 0 |
| interleukin-1 receptor activity | 0 | 0 | -10000 | 0 | -10000 | 0 | 0 |
| tumor necrosis factor receptor activity | 0 | 0 | -10000 | 0 | -10000 | 0 | 0 |
| MAP3K3 | 0.029 | 0.005 | -10000 | 0 | -10000 | 0 | 0 |
| FYN | 0.028 | 0.008 | -10000 | 0 | -10000 | 0 | 0 |
| MAP3K12 | 0.028 | 0.03 | -10000 | 0 | -0.64 | 1 | 1 |
| FGR | 0.025 | 0.048 | -10000 | 0 | -0.59 | 3 | 3 |
| p38 alpha/TAB1 | -0.022 | 0.08 | -10000 | 0 | -0.61 | 7 | 7 |
| PRKG1 | 0.013 | 0.1 | -10000 | 0 | -0.64 | 12 | 12 |
| DUSP8 | 0.029 | 0.03 | -10000 | 0 | -0.64 | 1 | 1 |
| PGK/cGMP/p38 alpha | 0.028 | 0.11 | -10000 | 0 | -0.52 | 10 | 10 |
| apoptosis | -0.021 | 0.076 | -10000 | 0 | -0.57 | 7 | 7 |
| RAL/GTP | 0.036 | 0.014 | -10000 | 0 | -10000 | 0 | 0 |
| LYN | 0.028 | 0.007 | -10000 | 0 | -10000 | 0 | 0 |
| DUSP1 | 0.021 | 0.03 | -10000 | 0 | -0.59 | 1 | 1 |
| PAK1 | 0.03 | 0.003 | -10000 | 0 | -10000 | 0 | 0 |
| SRC | 0.029 | 0.006 | -10000 | 0 | -10000 | 0 | 0 |
| RAC1/OSM/MEKK3/MKK3 | 0.068 | 0.026 | -10000 | 0 | -10000 | 0 | 0 |
| TRAF6 | 0.03 | 0.003 | -10000 | 0 | -10000 | 0 | 0 |
| RAC1 | 0.027 | 0.009 | -10000 | 0 | -10000 | 0 | 0 |
| epidermal growth factor receptor activity | 0 | 0 | -10000 | 0 | -10000 | 0 | 0 |
| mol:LPS | 0 | 0 | -10000 | 0 | -10000 | 0 | 0 |
| mol:cGMP | 0 | 0 | -10000 | 0 | -10000 | 0 | 0 |
| CCM2 | 0.027 | 0.009 | -10000 | 0 | -10000 | 0 | 0 |
| RAC1-CDC42/GTP | 0.035 | 0.014 | -10000 | 0 | -10000 | 0 | 0 |
| MAPK11 | 0.045 | 0.12 | 0.39 | 12 | -0.47 | 6 | 18 |
| BLK | -0.013 | 0.15 | -10000 | 0 | -0.59 | 33 | 33 |
| HCK | -0.002 | 0.14 | -10000 | 0 | -0.59 | 26 | 26 |
| MAP2K3 | 0.029 | 0.005 | -10000 | 0 | -10000 | 0 | 0 |
| DUSP16 | 0.029 | 0.006 | -10000 | 0 | -10000 | 0 | 0 |
| DUSP10 | 0.025 | 0.051 | -10000 | 0 | -0.63 | 3 | 3 |
| TRAF6/MEKK3 | 0.037 | 0.007 | -10000 | 0 | -10000 | 0 | 0 |
| MAP3K7IP1 | 0 | 0 | -10000 | 0 | -10000 | 0 | 0 |
| MAPK14 | 0.04 | 0.12 | 0.31 | 13 | -0.66 | 7 | 20 |
| positive regulation of innate immune response | 0.051 | 0.14 | 0.38 | 15 | -0.62 | 7 | 22 |
| LCK | 0.002 | 0.13 | -10000 | 0 | -0.59 | 22 | 22 |
| p38alpha-beta/MKP7 | 0.055 | 0.12 | 0.37 | 6 | -0.62 | 6 | 12 |
| p38alpha-beta/MKP5 | 0.058 | 0.14 | 0.45 | 9 | -0.58 | 8 | 17 |
| PGK/cGMP | 0.01 | 0.075 | -10000 | 0 | -0.47 | 12 | 12 |
| PAK2 | 0.029 | 0.007 | -10000 | 0 | -10000 | 0 | 0 |
| p38alpha-beta/MKP1 | 0.035 | 0.12 | 0.43 | 4 | -0.58 | 7 | 11 |
| CDC42 | 0.029 | 0.006 | -10000 | 0 | -10000 | 0 | 0 |
| RALB | 0.029 | 0.005 | -10000 | 0 | -10000 | 0 | 0 |
| RALA | 0.027 | 0.009 | -10000 | 0 | -10000 | 0 | 0 |
| PAK3 | 0.013 | 0.099 | -10000 | 0 | -0.6 | 13 | 13 |
Figure S108. Get High-res Image This plot shows pathway concept perturbations across all samples against a permutation model. The concepts along the x-axis are sorted by lowest to highest mean activity for the real patient samples. Mean inferred activities are plotted along the y-axis as a colored band showing the average level and one standard deviation range. Real samples are shown in red and permuted samples in black.
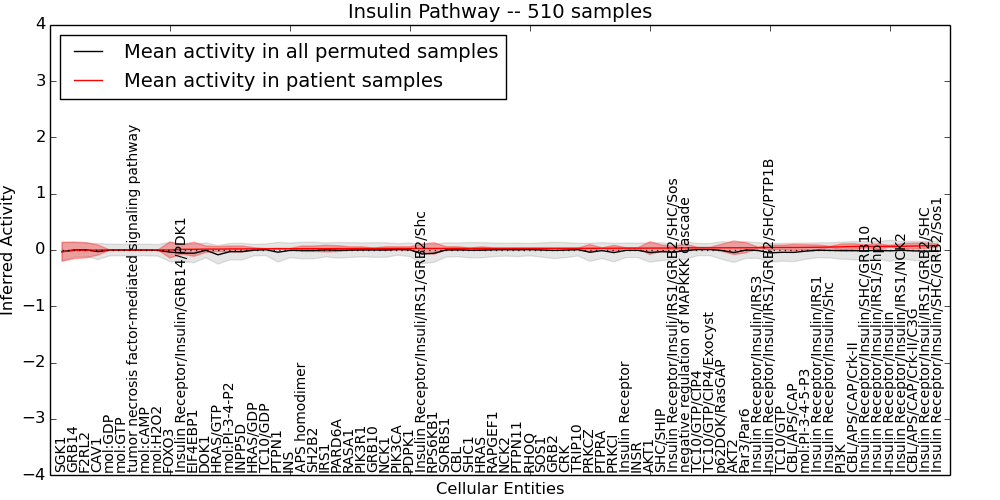
Table S108. Get Full Table This table displays mean, standard deviation, and perturbation statistics for Inferred Pathway Levels (IPLs). A mean perturbation of -9999 implies that the IPLs across all the real samples did not differ enough from the IPLs generated by a background model of permuted samples (> 1 Std.Dev from the permuted sample IPLs).
| Entity | Mean | Std.Dev | Mean.of.Up.Perturbations | Number.of.Up.Perturbations | Mean.of.Down.Perturbations | Number.of.Down.Perturbations | Number.of.Total.Perturbations |
|---|---|---|---|---|---|---|---|
| CBL/APS/CAP | 0.045 | 0.054 | -10000 | 0 | -10000 | 0 | 0 |
| TC10/GTP | 0.045 | 0.041 | -10000 | 0 | -10000 | 0 | 0 |
| Insulin Receptor/Insulin/IRS1/Shp2 | 0.064 | 0.046 | -10000 | 0 | -0.38 | 4 | 4 |
| HRAS | 0.029 | 0.027 | -10000 | 0 | -0.59 | 1 | 1 |
| APS homodimer | 0.023 | 0.048 | -10000 | 0 | -0.59 | 3 | 3 |
| GRB14 | -0.006 | 0.15 | -10000 | 0 | -0.64 | 27 | 27 |
| FOXO3 | 0.001 | 0.14 | -10000 | 0 | -0.6 | 26 | 26 |
| AKT1 | 0.034 | 0.11 | 0.41 | 15 | -0.57 | 2 | 17 |
| INSR | 0.033 | 0.008 | -10000 | 0 | -10000 | 0 | 0 |
| Insulin Receptor/Insulin | 0.065 | 0.017 | -10000 | 0 | -10000 | 0 | 0 |
| mol:GTP | 0 | 0 | -10000 | 0 | -10000 | 0 | 0 |
| GRB10 | 0.027 | 0.009 | -10000 | 0 | -10000 | 0 | 0 |
| SORBS1 | 0.028 | 0.03 | -10000 | 0 | -0.64 | 1 | 1 |
| CRK | 0.029 | 0.005 | -10000 | 0 | -10000 | 0 | 0 |
| PTPN1 | 0.022 | 0.01 | -10000 | 0 | -10000 | 0 | 0 |
| CAV1 | -0.001 | 0.09 | -10000 | 0 | -0.33 | 32 | 32 |
| CBL/APS/CAP/Crk-II/C3G | 0.071 | 0.052 | -10000 | 0 | -10000 | 0 | 0 |
| Insulin Receptor/Insulin/IRS1/NCK2 | 0.065 | 0.045 | -10000 | 0 | -0.38 | 4 | 4 |
| mol:GDP | 0 | 0 | -10000 | 0 | -10000 | 0 | 0 |
| mol:PI-3-4-5-P3 | 0.046 | 0.047 | -10000 | 0 | -0.33 | 6 | 6 |
| Insulin Receptor/Insuli/IRS1/GRB2/SHC/PTP1B | 0.044 | 0.039 | -10000 | 0 | -10000 | 0 | 0 |
| RPS6KB1 | 0.028 | 0.1 | 0.38 | 13 | -0.52 | 2 | 15 |
| PARD6A | 0.025 | 0.051 | -10000 | 0 | -0.64 | 3 | 3 |
| CBL | 0.029 | 0.03 | -10000 | 0 | -0.64 | 1 | 1 |
| tumor necrosis factor-mediated signaling pathway | 0 | 0 | -10000 | 0 | -10000 | 0 | 0 |
| DOK1 | 0.016 | 0.056 | -10000 | 0 | -0.49 | 6 | 6 |
| PIK3R1 | 0.026 | 0.031 | -10000 | 0 | -0.64 | 1 | 1 |
| Insulin Receptor/Insuli/IRS1/GRB2/Shc | 0.028 | 0.078 | -10000 | 0 | -0.53 | 2 | 2 |
| HRAS/GTP | 0.016 | 0.044 | -10000 | 0 | -0.55 | 1 | 1 |
| Insulin Receptor | 0.033 | 0.008 | -10000 | 0 | -10000 | 0 | 0 |
| Insulin Receptor/Insuli/IRS1/GRB2/SHC | 0.075 | 0.048 | -10000 | 0 | -10000 | 0 | 0 |
| PRKCI | 0.032 | 0.051 | -10000 | 0 | -0.48 | 2 | 2 |
| Insulin Receptor/Insulin/GRB14/PDK1 | 0.012 | 0.085 | -10000 | 0 | -0.62 | 2 | 2 |
| SHC1 | 0.029 | 0.007 | -10000 | 0 | -10000 | 0 | 0 |
| negative regulation of MAPKKK cascade | 0.039 | 0.063 | -10000 | 0 | -0.45 | 7 | 7 |
| PI3K | 0.057 | 0.051 | -10000 | 0 | -0.33 | 6 | 6 |
| NCK2 | 0.029 | 0.006 | -10000 | 0 | -10000 | 0 | 0 |
| RHOQ | 0.029 | 0.005 | -10000 | 0 | -10000 | 0 | 0 |
| mol:H2O2 | 0 | 0.002 | -10000 | 0 | -10000 | 0 | 0 |
| HRAS/GDP | 0.021 | 0.02 | -10000 | 0 | -0.43 | 1 | 1 |
| AKT2 | 0.04 | 0.12 | 0.41 | 19 | -0.57 | 2 | 21 |
| PRKCZ | 0.03 | 0.068 | -10000 | 0 | -0.59 | 5 | 5 |
| SH2B2 | 0.023 | 0.048 | -10000 | 0 | -0.59 | 3 | 3 |
| SHC/SHIP | 0.035 | 0.052 | -10000 | 0 | -0.63 | 1 | 1 |
| F2RL2 | -0.004 | 0.14 | -10000 | 0 | -0.59 | 26 | 26 |
| TRIP10 | 0.03 | 0.003 | -10000 | 0 | -10000 | 0 | 0 |
| Insulin Receptor/Insulin/Shc | 0.052 | 0.015 | -10000 | 0 | -10000 | 0 | 0 |
| TC10/GTP/CIP4/Exocyst | 0.039 | 0.008 | -10000 | 0 | -10000 | 0 | 0 |
| Insulin Receptor/Insulin/SHC/GRB2/Sos1 | 0.08 | 0.026 | -10000 | 0 | -10000 | 0 | 0 |
| RAPGEF1 | 0.029 | 0.006 | -10000 | 0 | -10000 | 0 | 0 |
| RASA1 | 0.025 | 0.031 | -10000 | 0 | -0.64 | 1 | 1 |
| NCK1 | 0.027 | 0.03 | -10000 | 0 | -0.64 | 1 | 1 |
| CBL/APS/CAP/Crk-II | 0.063 | 0.05 | -10000 | 0 | -0.37 | 2 | 2 |
| TC10/GDP | 0.022 | 0.004 | -10000 | 0 | -10000 | 0 | 0 |
| Insulin Receptor/Insulin/SHC/GRB10 | 0.064 | 0.027 | -10000 | 0 | -10000 | 0 | 0 |
| INPP5D | 0.019 | 0.052 | -10000 | 0 | -0.43 | 4 | 4 |
| SOS1 | 0.029 | 0.005 | -10000 | 0 | -10000 | 0 | 0 |
| SGK1 | -0.032 | 0.17 | -10000 | 0 | -0.62 | 39 | 39 |
| mol:cAMP | 0 | 0 | -10000 | 0 | -10000 | 0 | 0 |
| PTPN11 | 0.029 | 0.006 | -10000 | 0 | -10000 | 0 | 0 |
| IRS1 | 0.023 | 0.059 | -10000 | 0 | -0.64 | 4 | 4 |
| p62DOK/RasGAP | 0.039 | 0.064 | -10000 | 0 | -0.45 | 7 | 7 |
| INS | 0.023 | 0.007 | -10000 | 0 | -10000 | 0 | 0 |
| mol:PI-3-4-P2 | 0.019 | 0.052 | -10000 | 0 | -0.43 | 4 | 4 |
| GRB2 | 0.029 | 0.005 | -10000 | 0 | -10000 | 0 | 0 |
| EIF4EBP1 | 0.012 | 0.12 | 0.4 | 13 | -0.55 | 6 | 19 |
| PTPRA | 0.031 | 0.006 | -10000 | 0 | -10000 | 0 | 0 |
| PIK3CA | 0.027 | 0.03 | -10000 | 0 | -0.64 | 1 | 1 |
| TC10/GTP/CIP4 | 0.039 | 0.008 | -10000 | 0 | -10000 | 0 | 0 |
| PDPK1 | 0.028 | 0.03 | -10000 | 0 | -0.64 | 1 | 1 |
| Insulin Receptor/Insuli/IRS1/GRB2/SHC/Sos | 0.036 | 0.031 | -10000 | 0 | -10000 | 0 | 0 |
| Insulin Receptor/Insulin/IRS1 | 0.048 | 0.042 | -10000 | 0 | -0.38 | 4 | 4 |
| Insulin Receptor/Insulin/IRS3 | 0.041 | 0.011 | -10000 | 0 | -10000 | 0 | 0 |
| Par3/Par6 | 0.04 | 0.09 | -10000 | 0 | -0.32 | 25 | 25 |
Figure S109. Get High-res Image This plot shows pathway concept perturbations across all samples against a permutation model. The concepts along the x-axis are sorted by lowest to highest mean activity for the real patient samples. Mean inferred activities are plotted along the y-axis as a colored band showing the average level and one standard deviation range. Real samples are shown in red and permuted samples in black.
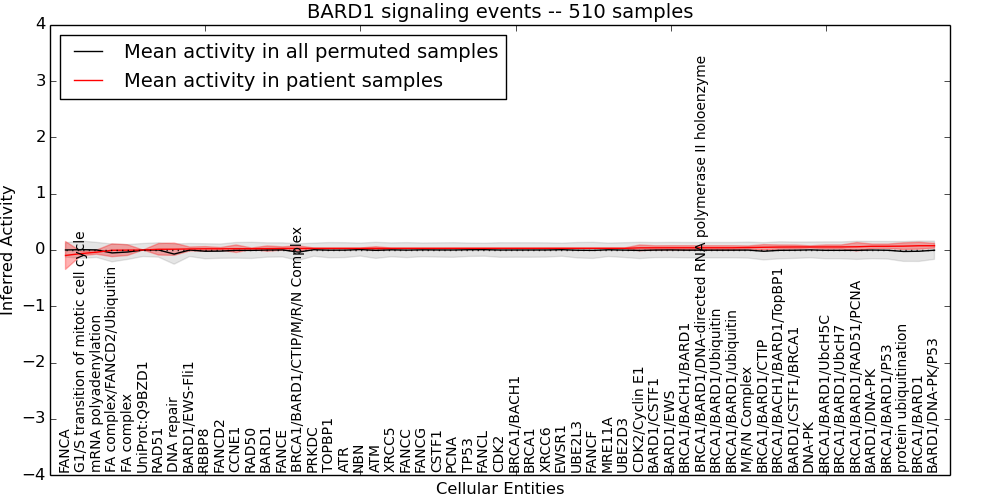
Table S109. Get Full Table This table displays mean, standard deviation, and perturbation statistics for Inferred Pathway Levels (IPLs). A mean perturbation of -9999 implies that the IPLs across all the real samples did not differ enough from the IPLs generated by a background model of permuted samples (> 1 Std.Dev from the permuted sample IPLs).
| Entity | Mean | Std.Dev | Mean.of.Up.Perturbations | Number.of.Up.Perturbations | Mean.of.Down.Perturbations | Number.of.Down.Perturbations | Number.of.Total.Perturbations |
|---|---|---|---|---|---|---|---|
| BARD1/CSTF1 | 0.039 | 0.036 | -10000 | 0 | -0.47 | 2 | 2 |
| ATM | 0.029 | 0.03 | -10000 | 0 | -0.64 | 1 | 1 |
| UBE2D3 | 0.03 | 0.004 | -10000 | 0 | -10000 | 0 | 0 |
| PRKDC | 0.028 | 0.008 | -10000 | 0 | -10000 | 0 | 0 |
| ATR | 0.028 | 0.007 | -10000 | 0 | -10000 | 0 | 0 |
| UBE2L3 | 0.03 | 0.004 | -10000 | 0 | -10000 | 0 | 0 |
| FANCD2 | 0.021 | 0.023 | -10000 | 0 | -0.36 | 1 | 1 |
| protein ubiquitination | 0.068 | 0.059 | -10000 | 0 | -0.64 | 1 | 1 |
| XRCC5 | 0.029 | 0.007 | -10000 | 0 | -10000 | 0 | 0 |
| XRCC6 | 0.03 | 0.004 | -10000 | 0 | -10000 | 0 | 0 |
| M/R/N Complex | 0.045 | 0.027 | -10000 | 0 | -10000 | 0 | 0 |
| MRE11A | 0.03 | 0.004 | -10000 | 0 | -10000 | 0 | 0 |
| DNA-PK | 0.054 | 0.02 | -10000 | 0 | -10000 | 0 | 0 |
| FA complex/FANCD2/Ubiquitin | -0.005 | 0.11 | -10000 | 0 | -0.57 | 13 | 13 |
| FANCF | 0.03 | 0.004 | -10000 | 0 | -10000 | 0 | 0 |
| BRCA1 | 0.03 | 0.005 | -10000 | 0 | -10000 | 0 | 0 |
| CCNE1 | 0.023 | 0.067 | -10000 | 0 | -0.59 | 6 | 6 |
| CDK2/Cyclin E1 | 0.038 | 0.052 | -10000 | 0 | -0.43 | 6 | 6 |
| FANCG | 0.029 | 0.006 | -10000 | 0 | -10000 | 0 | 0 |
| BRCA1/BACH1/BARD1 | 0.039 | 0.037 | -10000 | 0 | -0.47 | 2 | 2 |
| FANCE | 0.028 | 0.028 | -10000 | 0 | -0.59 | 1 | 1 |
| FANCC | 0.029 | 0.006 | -10000 | 0 | -10000 | 0 | 0 |
| NBN | 0.028 | 0.007 | -10000 | 0 | -10000 | 0 | 0 |
| FANCA | -0.097 | 0.25 | -10000 | 0 | -0.59 | 104 | 104 |
| DNA repair | 0.014 | 0.11 | 0.37 | 6 | -0.62 | 4 | 10 |
| BRCA1/BARD1/ubiquitin | 0.039 | 0.037 | -10000 | 0 | -0.47 | 2 | 2 |
| BARD1/DNA-PK | 0.066 | 0.039 | -10000 | 0 | -0.37 | 2 | 2 |
| FANCL | 0.029 | 0.005 | -10000 | 0 | -10000 | 0 | 0 |
| mRNA polyadenylation | -0.038 | 0.036 | 0.47 | 2 | -10000 | 0 | 2 |
| BRCA1/BARD1/CTIP/M/R/N Complex | 0.028 | 0.046 | -10000 | 0 | -0.69 | 1 | 1 |
| BRCA1/BACH1/BARD1/TopBP1 | 0.052 | 0.037 | -10000 | 0 | -0.4 | 2 | 2 |
| BRCA1/BARD1/P53 | 0.066 | 0.039 | -10000 | 0 | -0.37 | 2 | 2 |
| BARD1/CSTF1/BRCA1 | 0.054 | 0.035 | -10000 | 0 | -0.4 | 2 | 2 |
| BRCA1/BACH1 | 0.029 | 0.005 | -10000 | 0 | -10000 | 0 | 0 |
| BARD1 | 0.025 | 0.047 | -10000 | 0 | -0.48 | 4 | 4 |
| PCNA | 0.029 | 0.006 | -10000 | 0 | -10000 | 0 | 0 |
| BRCA1/BARD1/UbcH5C | 0.054 | 0.036 | -10000 | 0 | -0.4 | 2 | 2 |
| BRCA1/BARD1/UbcH7 | 0.054 | 0.036 | -10000 | 0 | -0.4 | 2 | 2 |
| BRCA1/BARD1/RAD51/PCNA | 0.057 | 0.075 | -10000 | 0 | -0.34 | 15 | 15 |
| BARD1/DNA-PK/P53 | 0.076 | 0.042 | -10000 | 0 | -0.34 | 2 | 2 |
| BRCA1/BARD1/Ubiquitin | 0.039 | 0.037 | -10000 | 0 | -0.47 | 2 | 2 |
| BRCA1/BARD1/CTIP | 0.048 | 0.047 | -10000 | 0 | -0.48 | 3 | 3 |
| FA complex | -0.002 | 0.095 | -10000 | 0 | -0.44 | 6 | 6 |
| BARD1/EWS | 0.039 | 0.038 | -10000 | 0 | -0.47 | 2 | 2 |
| RBBP8 | 0.021 | 0.039 | -10000 | 0 | -0.85 | 1 | 1 |
| TP53 | 0.029 | 0.005 | -10000 | 0 | -10000 | 0 | 0 |
| TOPBP1 | 0.028 | 0.007 | -10000 | 0 | -10000 | 0 | 0 |
| G1/S transition of mitotic cell cycle | -0.064 | 0.038 | 0.36 | 2 | -10000 | 0 | 2 |
| BRCA1/BARD1 | 0.076 | 0.061 | -10000 | 0 | -0.64 | 1 | 1 |
| CSTF1 | 0.029 | 0.006 | -10000 | 0 | -10000 | 0 | 0 |
| BARD1/EWS-Fli1 | 0.018 | 0.035 | -10000 | 0 | -0.47 | 2 | 2 |
| CDK2 | 0.029 | 0.005 | -10000 | 0 | -10000 | 0 | 0 |
| UniProt:Q9BZD1 | 0 | 0 | -10000 | 0 | -10000 | 0 | 0 |
| RAD51 | 0.013 | 0.1 | -10000 | 0 | -0.6 | 14 | 14 |
| RAD50 | 0.023 | 0.013 | -10000 | 0 | -10000 | 0 | 0 |
| BRCA1/BARD1/DNA-directed RNA polymerase II holoenzyme | 0.039 | 0.037 | -10000 | 0 | -0.47 | 2 | 2 |
| EWSR1 | 0.03 | 0.004 | -10000 | 0 | -10000 | 0 | 0 |
Figure S110. Get High-res Image This plot shows pathway concept perturbations across all samples against a permutation model. The concepts along the x-axis are sorted by lowest to highest mean activity for the real patient samples. Mean inferred activities are plotted along the y-axis as a colored band showing the average level and one standard deviation range. Real samples are shown in red and permuted samples in black.
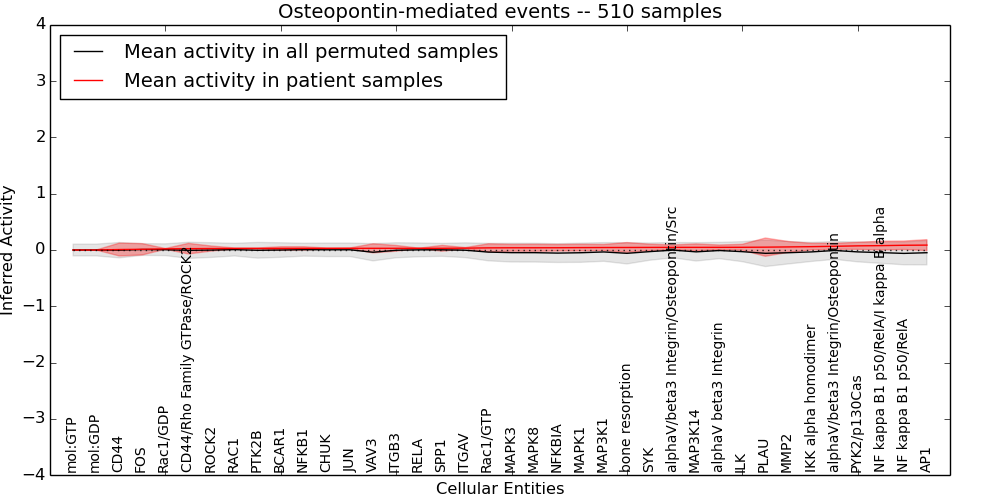
Table S110. Get Full Table This table displays mean, standard deviation, and perturbation statistics for Inferred Pathway Levels (IPLs). A mean perturbation of -9999 implies that the IPLs across all the real samples did not differ enough from the IPLs generated by a background model of permuted samples (> 1 Std.Dev from the permuted sample IPLs).
| Entity | Mean | Std.Dev | Mean.of.Up.Perturbations | Number.of.Up.Perturbations | Mean.of.Down.Perturbations | Number.of.Down.Perturbations | Number.of.Total.Perturbations |
|---|---|---|---|---|---|---|---|
| IKK alpha homodimer | 0.059 | 0.059 | -10000 | 0 | -10000 | 0 | 0 |
| NF kappa B1 p50/RelA/I kappa B alpha | 0.078 | 0.078 | 0.37 | 5 | -0.58 | 1 | 6 |
| alphaV/beta3 Integrin/Osteopontin/Src | 0.047 | 0.043 | -10000 | 0 | -0.47 | 3 | 3 |
| AP1 | 0.087 | 0.097 | -10000 | 0 | -0.62 | 2 | 2 |
| ILK | 0.048 | 0.053 | -10000 | 0 | -10000 | 0 | 0 |
| bone resorption | 0.045 | 0.087 | -10000 | 0 | -0.58 | 2 | 2 |
| PTK2B | 0.027 | 0.009 | -10000 | 0 | -10000 | 0 | 0 |
| PYK2/p130Cas | 0.074 | 0.063 | -10000 | 0 | -10000 | 0 | 0 |
| ITGAV | 0.033 | 0.01 | -10000 | 0 | -10000 | 0 | 0 |
| mol:GTP | 0 | 0 | -10000 | 0 | -10000 | 0 | 0 |
| CD44/Rho Family GTPase/ROCK2 | 0.024 | 0.094 | -10000 | 0 | -0.44 | 20 | 20 |
| alphaV/beta3 Integrin/Osteopontin | 0.066 | 0.053 | -10000 | 0 | -0.38 | 5 | 5 |
| MAP3K1 | 0.044 | 0.055 | -10000 | 0 | -10000 | 0 | 0 |
| JUN | 0.03 | 0.007 | -10000 | 0 | -10000 | 0 | 0 |
| MAPK3 | 0.04 | 0.06 | -10000 | 0 | -10000 | 0 | 0 |
| MAPK1 | 0.042 | 0.059 | -10000 | 0 | -10000 | 0 | 0 |
| Rac1/GDP | 0.02 | 0.007 | -10000 | 0 | -10000 | 0 | 0 |
| NFKB1 | 0.028 | 0.03 | -10000 | 0 | -0.64 | 1 | 1 |
| MAPK8 | 0.04 | 0.062 | 0.41 | 1 | -0.65 | 1 | 2 |
| ITGB3 | 0.03 | 0.051 | -10000 | 0 | -0.62 | 3 | 3 |
| NFKBIA | 0.04 | 0.058 | -10000 | 0 | -10000 | 0 | 0 |
| FOS | 0.013 | 0.1 | -10000 | 0 | -0.63 | 12 | 12 |
| CD44 | 0.008 | 0.11 | -10000 | 0 | -0.59 | 18 | 18 |
| CHUK | 0.029 | 0.006 | -10000 | 0 | -10000 | 0 | 0 |
| PLAU | 0.051 | 0.16 | 0.52 | 4 | -1.1 | 8 | 12 |
| NF kappa B1 p50/RelA | 0.084 | 0.075 | 0.38 | 1 | -0.56 | 1 | 2 |
| BCAR1 | 0.028 | 0.03 | -10000 | 0 | -0.64 | 1 | 1 |
| RELA | 0.03 | 0.003 | -10000 | 0 | -10000 | 0 | 0 |
| alphaV beta3 Integrin | 0.047 | 0.042 | -10000 | 0 | -0.46 | 3 | 3 |
| mol:GDP | 0 | 0 | -10000 | 0 | -10000 | 0 | 0 |
| SYK | 0.046 | 0.057 | -10000 | 0 | -0.35 | 6 | 6 |
| VAV3 | 0.03 | 0.081 | -10000 | 0 | -0.66 | 1 | 1 |
| MAP3K14 | 0.047 | 0.061 | -10000 | 0 | -10000 | 0 | 0 |
| ROCK2 | 0.026 | 0.045 | -10000 | 0 | -0.53 | 3 | 3 |
| SPP1 | 0.03 | 0.052 | -10000 | 0 | -0.63 | 3 | 3 |
| RAC1 | 0.027 | 0.009 | -10000 | 0 | -10000 | 0 | 0 |
| Rac1/GTP | 0.038 | 0.072 | -10000 | 0 | -0.6 | 1 | 1 |
| MMP2 | 0.055 | 0.096 | 0.43 | 2 | -0.52 | 6 | 8 |
Figure S111. Get High-res Image This plot shows pathway concept perturbations across all samples against a permutation model. The concepts along the x-axis are sorted by lowest to highest mean activity for the real patient samples. Mean inferred activities are plotted along the y-axis as a colored band showing the average level and one standard deviation range. Real samples are shown in red and permuted samples in black.
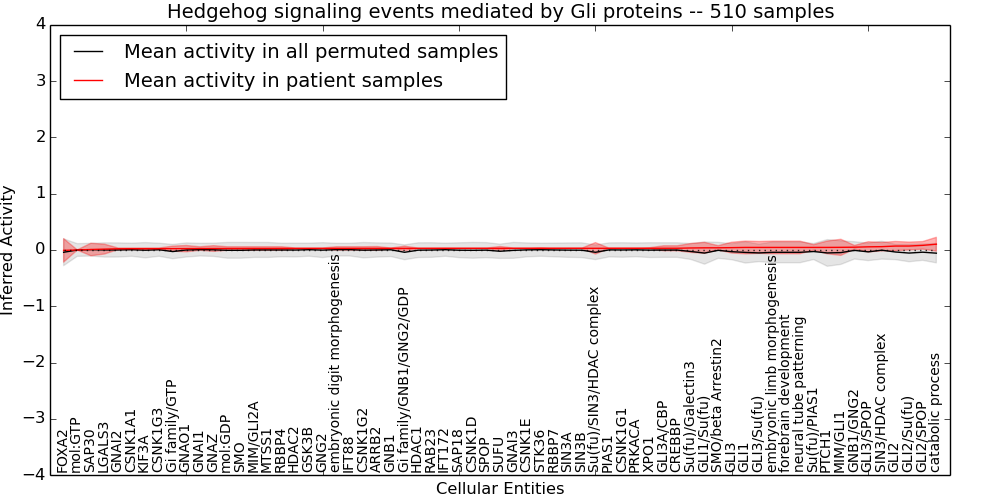
Table S111. Get Full Table This table displays mean, standard deviation, and perturbation statistics for Inferred Pathway Levels (IPLs). A mean perturbation of -9999 implies that the IPLs across all the real samples did not differ enough from the IPLs generated by a background model of permuted samples (> 1 Std.Dev from the permuted sample IPLs).
| Entity | Mean | Std.Dev | Mean.of.Up.Perturbations | Number.of.Up.Perturbations | Mean.of.Down.Perturbations | Number.of.Down.Perturbations | Number.of.Total.Perturbations |
|---|---|---|---|---|---|---|---|
| HDAC1 | 0.029 | 0.006 | -10000 | 0 | -10000 | 0 | 0 |
| HDAC2 | 0.028 | 0.008 | -10000 | 0 | -10000 | 0 | 0 |
| GNB1/GNG2 | 0.05 | 0.032 | -10000 | 0 | -0.4 | 1 | 1 |
| forebrain development | 0.046 | 0.11 | 0.45 | 5 | -0.48 | 5 | 10 |
| GNAO1 | 0.024 | 0.056 | -10000 | 0 | -0.6 | 4 | 4 |
| SMO/beta Arrestin2 | 0.039 | 0.038 | -10000 | 0 | -0.5 | 2 | 2 |
| SMO | 0.027 | 0.031 | -10000 | 0 | -0.63 | 1 | 1 |
| ARRB2 | 0.029 | 0.033 | -10000 | 0 | -0.71 | 1 | 1 |
| GLI3/SPOP | 0.056 | 0.091 | -10000 | 0 | -0.5 | 8 | 8 |
| mol:GTP | 0 | 0.002 | -10000 | 0 | -10000 | 0 | 0 |
| GSK3B | 0.028 | 0.008 | -10000 | 0 | -10000 | 0 | 0 |
| GNAI2 | 0.022 | 0.014 | -10000 | 0 | -10000 | 0 | 0 |
| SIN3/HDAC complex | 0.059 | 0.075 | -10000 | 0 | -0.33 | 15 | 15 |
| GNAI1 | 0.026 | 0.031 | -10000 | 0 | -0.63 | 1 | 1 |
| XPO1 | 0.03 | 0.011 | -10000 | 0 | -10000 | 0 | 0 |
| GLI1/Su(fu) | 0.039 | 0.097 | -10000 | 0 | -0.58 | 5 | 5 |
| SAP30 | 0.009 | 0.11 | -10000 | 0 | -0.59 | 17 | 17 |
| mol:GDP | 0.027 | 0.031 | -10000 | 0 | -0.63 | 1 | 1 |
| MIM/GLI2A | 0.027 | 0.031 | -10000 | 0 | -10000 | 0 | 0 |
| IFT88 | 0.028 | 0.03 | -10000 | 0 | -0.64 | 1 | 1 |
| GNAI3 | 0.03 | 0.006 | -10000 | 0 | -10000 | 0 | 0 |
| GLI2 | 0.07 | 0.081 | 0.31 | 12 | -0.5 | 1 | 13 |
| GLI3 | 0.042 | 0.097 | 0.3 | 3 | -0.56 | 8 | 11 |
| CSNK1D | 0.029 | 0.005 | -10000 | 0 | -10000 | 0 | 0 |
| CSNK1E | 0.03 | 0.004 | -10000 | 0 | -10000 | 0 | 0 |
| SAP18 | 0.029 | 0.005 | -10000 | 0 | -10000 | 0 | 0 |
| embryonic digit morphogenesis | 0.028 | 0.03 | -10000 | 0 | -0.63 | 1 | 1 |
| GNG2 | 0.028 | 0.008 | -10000 | 0 | -10000 | 0 | 0 |
| Gi family/GTP | 0.024 | 0.045 | -10000 | 0 | -0.36 | 4 | 4 |
| SIN3B | 0.03 | 0.003 | -10000 | 0 | -10000 | 0 | 0 |
| SIN3A | 0.03 | 0.003 | -10000 | 0 | -10000 | 0 | 0 |
| GLI3/Su(fu) | 0.046 | 0.11 | -10000 | 0 | -0.59 | 9 | 9 |
| GLI2/Su(fu) | 0.071 | 0.07 | 0.27 | 2 | -0.5 | 2 | 4 |
| FOXA2 | -0.007 | 0.21 | -10000 | 0 | -1 | 14 | 14 |
| neural tube patterning | 0.046 | 0.11 | 0.45 | 5 | -0.48 | 5 | 10 |
| SPOP | 0.029 | 0.005 | -10000 | 0 | -10000 | 0 | 0 |
| Su(fu)/PIAS1 | 0.046 | 0.049 | -10000 | 0 | -0.54 | 1 | 1 |
| GNB1 | 0.029 | 0.006 | -10000 | 0 | -10000 | 0 | 0 |
| CSNK1G2 | 0.028 | 0.03 | -10000 | 0 | -0.64 | 1 | 1 |
| CSNK1G3 | 0.024 | 0.012 | -10000 | 0 | -10000 | 0 | 0 |
| MTSS1 | 0.027 | 0.031 | -10000 | 0 | -10000 | 0 | 0 |
| embryonic limb morphogenesis | 0.046 | 0.11 | 0.45 | 5 | -0.48 | 5 | 10 |
| SUFU | 0.03 | 0.033 | -10000 | 0 | -0.58 | 1 | 1 |
| LGALS3 | 0.016 | 0.087 | -10000 | 0 | -0.6 | 10 | 10 |
| catabolic process | 0.1 | 0.12 | 0.38 | 10 | -0.55 | 7 | 17 |
| GLI3A/CBP | 0.031 | 0.044 | -10000 | 0 | -0.36 | 2 | 2 |
| KIF3A | 0.023 | 0.013 | -10000 | 0 | -10000 | 0 | 0 |
| GLI1 | 0.046 | 0.11 | 0.45 | 5 | -0.49 | 5 | 10 |
| RAB23 | 0.029 | 0.006 | -10000 | 0 | -10000 | 0 | 0 |
| CSNK1A1 | 0.023 | 0.013 | -10000 | 0 | -10000 | 0 | 0 |
| IFT172 | 0.029 | 0.005 | -10000 | 0 | -10000 | 0 | 0 |
| RBBP7 | 0.03 | 0.003 | -10000 | 0 | -10000 | 0 | 0 |
| Su(fu)/Galectin3 | 0.036 | 0.079 | -10000 | 0 | -0.44 | 9 | 9 |
| GNAZ | 0.026 | 0.051 | -10000 | 0 | -0.63 | 3 | 3 |
| RBBP4 | 0.028 | 0.03 | -10000 | 0 | -0.64 | 1 | 1 |
| CSNK1G1 | 0.03 | 0.003 | -10000 | 0 | -10000 | 0 | 0 |
| PIAS1 | 0.03 | 0.003 | -10000 | 0 | -10000 | 0 | 0 |
| PRKACA | 0.03 | 0.002 | -10000 | 0 | -10000 | 0 | 0 |
| GLI2/SPOP | 0.082 | 0.068 | 0.29 | 6 | -10000 | 0 | 6 |
| STK36 | 0.03 | 0.011 | -10000 | 0 | -10000 | 0 | 0 |
| Gi family/GNB1/GNG2/GDP | 0.029 | 0.039 | -10000 | 0 | -0.44 | 1 | 1 |
| PTCH1 | 0.046 | 0.11 | 0.45 | 5 | -0.97 | 1 | 6 |
| MIM/GLI1 | 0.047 | 0.14 | 0.45 | 2 | -0.54 | 5 | 7 |
| CREBBP | 0.031 | 0.044 | -10000 | 0 | -0.36 | 2 | 2 |
| Su(fu)/SIN3/HDAC complex | 0.03 | 0.1 | 0.26 | 1 | -0.54 | 10 | 11 |
Figure S112. Get High-res Image This plot shows pathway concept perturbations across all samples against a permutation model. The concepts along the x-axis are sorted by lowest to highest mean activity for the real patient samples. Mean inferred activities are plotted along the y-axis as a colored band showing the average level and one standard deviation range. Real samples are shown in red and permuted samples in black.
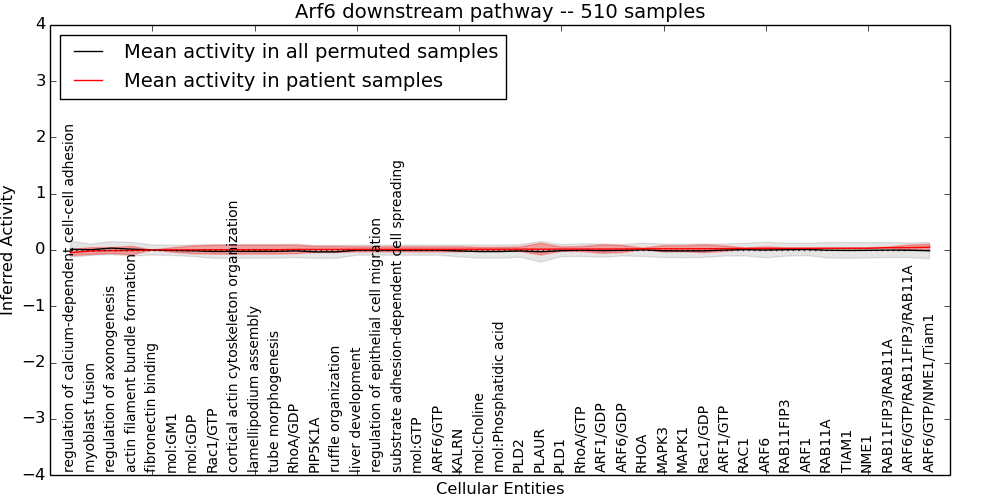
Table S112. Get Full Table This table displays mean, standard deviation, and perturbation statistics for Inferred Pathway Levels (IPLs). A mean perturbation of -9999 implies that the IPLs across all the real samples did not differ enough from the IPLs generated by a background model of permuted samples (> 1 Std.Dev from the permuted sample IPLs).
| Entity | Mean | Std.Dev | Mean.of.Up.Perturbations | Number.of.Up.Perturbations | Mean.of.Down.Perturbations | Number.of.Down.Perturbations | Number.of.Total.Perturbations |
|---|---|---|---|---|---|---|---|
| PLAUR | 0.015 | 0.1 | -10000 | 0 | -0.44 | 21 | 21 |
| regulation of axonogenesis | -0.01 | 0.053 | -10000 | 0 | -10000 | 0 | 0 |
| myoblast fusion | -0.018 | 0.061 | 0.23 | 25 | -10000 | 0 | 25 |
| mol:GTP | 0.012 | 0.046 | -10000 | 0 | -0.3 | 2 | 2 |
| regulation of calcium-dependent cell-cell adhesion | -0.048 | 0.051 | -10000 | 0 | -10000 | 0 | 0 |
| ARF1/GTP | 0.025 | 0.047 | -10000 | 0 | -0.3 | 1 | 1 |
| mol:GM1 | 0.002 | 0.039 | -10000 | 0 | -0.31 | 1 | 1 |
| mol:Choline | 0.014 | 0.032 | -10000 | 0 | -10000 | 0 | 0 |
| lamellipodium assembly | 0.006 | 0.078 | -10000 | 0 | -0.33 | 16 | 16 |
| MAPK3 | 0.022 | 0.056 | -10000 | 0 | -0.47 | 1 | 1 |
| ARF6/GTP/NME1/Tiam1 | 0.049 | 0.052 | -10000 | 0 | -10000 | 0 | 0 |
| ARF1 | 0.029 | 0.006 | -10000 | 0 | -10000 | 0 | 0 |
| ARF6/GDP | 0.018 | 0.061 | -10000 | 0 | -0.24 | 25 | 25 |
| ARF1/GDP | 0.017 | 0.075 | -10000 | 0 | -0.32 | 3 | 3 |
| ARF6 | 0.028 | 0.027 | -10000 | 0 | -10000 | 0 | 0 |
| RAB11A | 0.03 | 0.003 | -10000 | 0 | -10000 | 0 | 0 |
| TIAM1 | 0.03 | 0.008 | -10000 | 0 | -10000 | 0 | 0 |
| fibronectin binding | 0 | 0 | -10000 | 0 | -10000 | 0 | 0 |
| MAPK1 | 0.022 | 0.054 | -10000 | 0 | -0.3 | 1 | 1 |
| actin filament bundle formation | -0.009 | 0.074 | 0.36 | 2 | -10000 | 0 | 2 |
| KALRN | 0.012 | 0.046 | -10000 | 0 | -0.29 | 2 | 2 |
| RAB11FIP3/RAB11A | 0.042 | 0.01 | -10000 | 0 | -10000 | 0 | 0 |
| RhoA/GDP | 0.01 | 0.075 | -10000 | 0 | -0.36 | 2 | 2 |
| NME1 | 0.031 | 0.008 | -10000 | 0 | -10000 | 0 | 0 |
| Rac1/GDP | 0.022 | 0.07 | -10000 | 0 | -0.38 | 1 | 1 |
| substrate adhesion-dependent cell spreading | 0.012 | 0.046 | -10000 | 0 | -0.3 | 2 | 2 |
| cortical actin cytoskeleton organization | 0.005 | 0.078 | -10000 | 0 | -0.33 | 16 | 16 |
| RAC1 | 0.027 | 0.009 | -10000 | 0 | -10000 | 0 | 0 |
| liver development | 0.012 | 0.046 | -10000 | 0 | -0.3 | 2 | 2 |
| ARF6/GTP | 0.012 | 0.046 | -10000 | 0 | -0.3 | 2 | 2 |
| RhoA/GTP | 0.017 | 0.045 | -10000 | 0 | -0.3 | 1 | 1 |
| mol:GDP | 0.003 | 0.069 | -10000 | 0 | -0.31 | 5 | 5 |
| ARF6/GTP/RAB11FIP3/RAB11A | 0.042 | 0.046 | -10000 | 0 | -10000 | 0 | 0 |
| RHOA | 0.021 | 0.014 | -10000 | 0 | -10000 | 0 | 0 |
| PLD1 | 0.016 | 0.038 | -10000 | 0 | -10000 | 0 | 0 |
| RAB11FIP3 | 0.029 | 0.007 | -10000 | 0 | -10000 | 0 | 0 |
| tube morphogenesis | 0.006 | 0.078 | -10000 | 0 | -0.33 | 16 | 16 |
| ruffle organization | 0.01 | 0.053 | -10000 | 0 | -10000 | 0 | 0 |
| regulation of epithelial cell migration | 0.012 | 0.046 | -10000 | 0 | -0.3 | 2 | 2 |
| PLD2 | 0.015 | 0.041 | -10000 | 0 | -10000 | 0 | 0 |
| PIP5K1A | 0.01 | 0.053 | -10000 | 0 | -10000 | 0 | 0 |
| mol:Phosphatidic acid | 0.014 | 0.032 | -10000 | 0 | -10000 | 0 | 0 |
| Rac1/GTP | 0.005 | 0.079 | -10000 | 0 | -0.33 | 16 | 16 |
Figure S113. Get High-res Image This plot shows pathway concept perturbations across all samples against a permutation model. The concepts along the x-axis are sorted by lowest to highest mean activity for the real patient samples. Mean inferred activities are plotted along the y-axis as a colored band showing the average level and one standard deviation range. Real samples are shown in red and permuted samples in black.
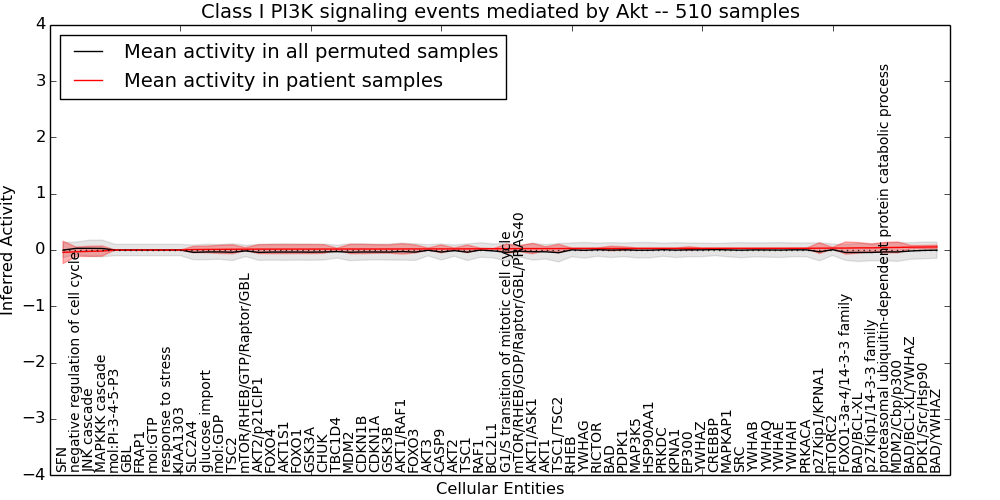
Table S113. Get Full Table This table displays mean, standard deviation, and perturbation statistics for Inferred Pathway Levels (IPLs). A mean perturbation of -9999 implies that the IPLs across all the real samples did not differ enough from the IPLs generated by a background model of permuted samples (> 1 Std.Dev from the permuted sample IPLs).
| Entity | Mean | Std.Dev | Mean.of.Up.Perturbations | Number.of.Up.Perturbations | Mean.of.Down.Perturbations | Number.of.Down.Perturbations | Number.of.Total.Perturbations |
|---|---|---|---|---|---|---|---|
| BCL2L1 | 0.023 | 0.005 | -10000 | 0 | -10000 | 0 | 0 |
| BAD/BCL-XL/YWHAZ | 0.051 | 0.03 | -10000 | 0 | -0.35 | 2 | 2 |
| CDKN1B | 0.018 | 0.082 | -10000 | 0 | -0.58 | 2 | 2 |
| CDKN1A | 0.018 | 0.076 | -10000 | 0 | -0.58 | 2 | 2 |
| FRAP1 | 0 | 0 | -10000 | 0 | -10000 | 0 | 0 |
| PRKDC | 0.028 | 0.008 | -10000 | 0 | -10000 | 0 | 0 |
| FOXO3 | 0.019 | 0.072 | -10000 | 0 | -0.58 | 2 | 2 |
| AKT1 | 0.025 | 0.032 | -10000 | 0 | -0.6 | 1 | 1 |
| BAD | 0.027 | 0.04 | -10000 | 0 | -0.61 | 2 | 2 |
| AKT3 | 0.019 | 0.018 | -10000 | 0 | -0.37 | 1 | 1 |
| mol:GTP | 0 | 0 | -10000 | 0 | -10000 | 0 | 0 |
| FOXO4 | 0.016 | 0.081 | -10000 | 0 | -0.58 | 2 | 2 |
| AKT1/ASK1 | 0.025 | 0.093 | -10000 | 0 | -0.5 | 4 | 4 |
| BAD/YWHAZ | 0.056 | 0.032 | -10000 | 0 | -0.38 | 2 | 2 |
| RICTOR | 0.027 | 0.009 | -10000 | 0 | -10000 | 0 | 0 |
| RAF1 | 0.021 | 0.014 | -10000 | 0 | -10000 | 0 | 0 |
| JNK cascade | -0.024 | 0.09 | 0.49 | 4 | -10000 | 0 | 4 |
| TSC1 | 0.02 | 0.068 | -10000 | 0 | -0.57 | 1 | 1 |
| YWHAZ | 0.029 | 0.007 | -10000 | 0 | -10000 | 0 | 0 |
| AKT1/RAF1 | 0.019 | 0.092 | -10000 | 0 | -0.51 | 4 | 4 |
| EP300 | 0.028 | 0.03 | -10000 | 0 | -0.64 | 1 | 1 |
| mol:GDP | 0.012 | 0.073 | -10000 | 0 | -0.6 | 2 | 2 |
| mol:PI-3-4-5-P3 | 0 | 0 | -10000 | 0 | -10000 | 0 | 0 |
| TSC2 | 0.013 | 0.08 | -10000 | 0 | -0.58 | 2 | 2 |
| YWHAQ | 0.029 | 0.005 | -10000 | 0 | -10000 | 0 | 0 |
| TBC1D4 | 0.017 | 0.016 | -10000 | 0 | -0.31 | 1 | 1 |
| MAP3K5 | 0.028 | 0.008 | -10000 | 0 | -10000 | 0 | 0 |
| MAPKAP1 | 0.029 | 0.006 | -10000 | 0 | -10000 | 0 | 0 |
| negative regulation of cell cycle | -0.032 | 0.084 | 0.32 | 10 | -0.25 | 10 | 20 |
| YWHAH | 0.03 | 0.004 | -10000 | 0 | -10000 | 0 | 0 |
| AKT1S1 | 0.016 | 0.08 | -10000 | 0 | -0.58 | 2 | 2 |
| CASP9 | 0.019 | 0.07 | -10000 | 0 | -0.59 | 1 | 1 |
| YWHAB | 0.029 | 0.006 | -10000 | 0 | -10000 | 0 | 0 |
| p27Kip1/KPNA1 | 0.033 | 0.097 | 0.34 | 5 | -0.49 | 4 | 9 |
| GBL | 0 | 0 | -10000 | 0 | -10000 | 0 | 0 |
| PDK1/Src/Hsp90 | 0.052 | 0.029 | -10000 | 0 | -0.4 | 1 | 1 |
| YWHAE | 0.029 | 0.005 | -10000 | 0 | -10000 | 0 | 0 |
| SRC | 0.029 | 0.006 | -10000 | 0 | -10000 | 0 | 0 |
| AKT2/p21CIP1 | 0.016 | 0.079 | -10000 | 0 | -0.47 | 4 | 4 |
| KIAA1303 | 0 | 0 | -10000 | 0 | -10000 | 0 | 0 |
| mTOR/RHEB/GTP/Raptor/GBL | 0.015 | 0.027 | -10000 | 0 | -10000 | 0 | 0 |
| CHUK | 0.017 | 0.078 | -10000 | 0 | -0.58 | 2 | 2 |
| BAD/BCL-XL | 0.038 | 0.095 | -10000 | 0 | -0.47 | 5 | 5 |
| mTORC2 | 0.034 | 0.013 | -10000 | 0 | -10000 | 0 | 0 |
| AKT2 | 0.02 | 0.018 | -10000 | 0 | -0.37 | 1 | 1 |
| FOXO1-3a-4/14-3-3 family | 0.034 | 0.11 | 0.31 | 8 | -0.42 | 11 | 19 |
| PDPK1 | 0.028 | 0.03 | -10000 | 0 | -0.64 | 1 | 1 |
| MDM2 | 0.017 | 0.082 | -10000 | 0 | -0.58 | 2 | 2 |
| MAPKKK cascade | -0.019 | 0.09 | 0.5 | 4 | -10000 | 0 | 4 |
| MDM2/Cbp/p300 | 0.045 | 0.097 | 0.32 | 3 | -0.46 | 5 | 8 |
| TSC1/TSC2 | 0.026 | 0.076 | 0.35 | 2 | -0.56 | 1 | 3 |
| proteasomal ubiquitin-dependent protein catabolic process | 0.043 | 0.093 | 0.31 | 3 | -0.44 | 5 | 8 |
| glucose import | 0.01 | 0.059 | -10000 | 0 | -0.36 | 10 | 10 |
| mTOR/RHEB/GDP/Raptor/GBL/PRAS40 | 0.025 | 0.054 | 0.24 | 3 | -0.32 | 2 | 5 |
| response to stress | 0 | 0 | -10000 | 0 | -10000 | 0 | 0 |
| SLC2A4 | 0.008 | 0.056 | -10000 | 0 | -0.36 | 10 | 10 |
| GSK3A | 0.016 | 0.081 | -10000 | 0 | -0.58 | 2 | 2 |
| FOXO1 | 0.016 | 0.08 | -10000 | 0 | -0.58 | 2 | 2 |
| GSK3B | 0.018 | 0.074 | -10000 | 0 | -0.58 | 2 | 2 |
| SFN | -0.043 | 0.2 | -10000 | 0 | -0.59 | 59 | 59 |
| G1/S transition of mitotic cell cycle | 0.023 | 0.081 | 0.34 | 3 | -0.52 | 3 | 6 |
| p27Kip1/14-3-3 family | 0.038 | 0.07 | 0.27 | 2 | -0.38 | 3 | 5 |
| PRKACA | 0.03 | 0.002 | -10000 | 0 | -10000 | 0 | 0 |
| KPNA1 | 0.028 | 0.008 | -10000 | 0 | -10000 | 0 | 0 |
| HSP90AA1 | 0.028 | 0.008 | -10000 | 0 | -10000 | 0 | 0 |
| YWHAG | 0.027 | 0.009 | -10000 | 0 | -10000 | 0 | 0 |
| RHEB | 0.027 | 0.009 | -10000 | 0 | -10000 | 0 | 0 |
| CREBBP | 0.029 | 0.006 | -10000 | 0 | -10000 | 0 | 0 |
Figure S114. Get High-res Image This plot shows pathway concept perturbations across all samples against a permutation model. The concepts along the x-axis are sorted by lowest to highest mean activity for the real patient samples. Mean inferred activities are plotted along the y-axis as a colored band showing the average level and one standard deviation range. Real samples are shown in red and permuted samples in black.
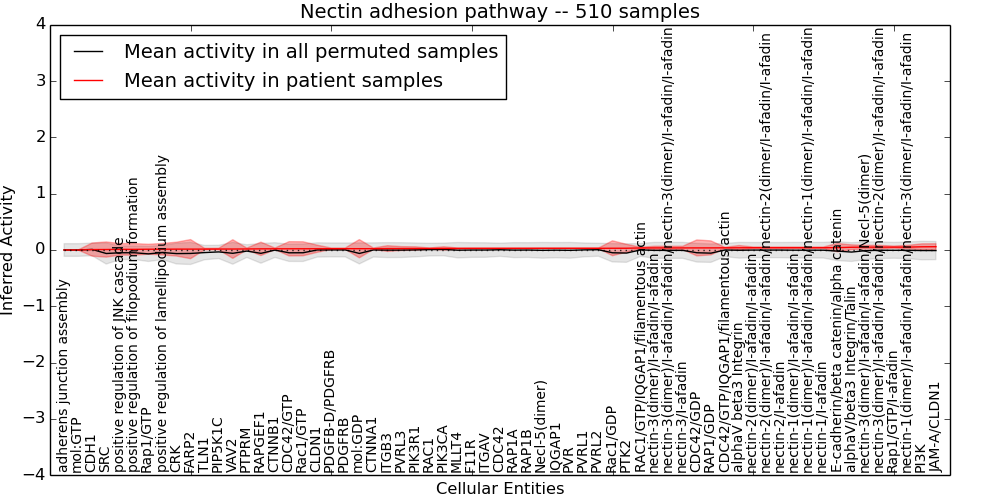
Table S114. Get Full Table This table displays mean, standard deviation, and perturbation statistics for Inferred Pathway Levels (IPLs). A mean perturbation of -9999 implies that the IPLs across all the real samples did not differ enough from the IPLs generated by a background model of permuted samples (> 1 Std.Dev from the permuted sample IPLs).
| Entity | Mean | Std.Dev | Mean.of.Up.Perturbations | Number.of.Up.Perturbations | Mean.of.Down.Perturbations | Number.of.Down.Perturbations | Number.of.Total.Perturbations |
|---|---|---|---|---|---|---|---|
| PDGFRB | 0.023 | 0.013 | -10000 | 0 | -10000 | 0 | 0 |
| alphaV beta3 Integrin | 0.039 | 0.041 | -10000 | 0 | -0.47 | 3 | 3 |
| PTK2 | 0.031 | 0.07 | -10000 | 0 | -0.41 | 1 | 1 |
| positive regulation of JNK cascade | 0.011 | 0.1 | -10000 | 0 | -0.34 | 14 | 14 |
| CDC42/GDP | 0.037 | 0.14 | 0.37 | 3 | -0.43 | 12 | 15 |
| Rac1/GDP | 0.031 | 0.13 | 0.29 | 1 | -0.44 | 10 | 11 |
| RAP1B | 0.029 | 0.005 | -10000 | 0 | -10000 | 0 | 0 |
| RAP1A | 0.029 | 0.005 | -10000 | 0 | -10000 | 0 | 0 |
| CTNNB1 | 0.021 | 0.014 | -10000 | 0 | -10000 | 0 | 0 |
| CDC42/GTP | 0.022 | 0.13 | -10000 | 0 | -0.42 | 14 | 14 |
| nectin-3/I-afadin | 0.037 | 0.03 | -10000 | 0 | -0.47 | 1 | 1 |
| RAPGEF1 | 0.02 | 0.12 | 0.3 | 2 | -0.42 | 2 | 4 |
| mol:GTP | 0 | 0 | -10000 | 0 | -10000 | 0 | 0 |
| CRK | 0.015 | 0.12 | -10000 | 0 | -0.48 | 2 | 2 |
| PDGFB-D/PDGFRB | 0.023 | 0.013 | -10000 | 0 | -10000 | 0 | 0 |
| TLN1 | 0.016 | 0.013 | -10000 | 0 | -10000 | 0 | 0 |
| Rap1/GTP | 0.014 | 0.088 | -10000 | 0 | -10000 | 0 | 0 |
| IQGAP1 | 0.03 | 0.004 | -10000 | 0 | -10000 | 0 | 0 |
| Rap1/GTP/I-afadin | 0.051 | 0.02 | -10000 | 0 | -10000 | 0 | 0 |
| nectin-3(dimer)/I-afadin/I-afadin/nectin-3(dimer)/I-afadin/I-afadin | 0.037 | 0.03 | -10000 | 0 | -0.47 | 1 | 1 |
| PVR | 0.03 | 0.004 | -10000 | 0 | -10000 | 0 | 0 |
| Necl-5(dimer) | 0.03 | 0.004 | -10000 | 0 | -10000 | 0 | 0 |
| mol:GDP | 0.023 | 0.16 | 0.39 | 3 | -0.51 | 16 | 19 |
| MLLT4 | 0.028 | 0.008 | -10000 | 0 | -10000 | 0 | 0 |
| PIK3CA | 0.027 | 0.03 | -10000 | 0 | -0.64 | 1 | 1 |
| PI3K | 0.057 | 0.053 | -10000 | 0 | -0.35 | 2 | 2 |
| nectin-1(dimer)/I-afadin/I-afadin/nectin-1(dimer)/I-afadin/I-afadin | 0.041 | 0.013 | -10000 | 0 | -10000 | 0 | 0 |
| positive regulation of lamellipodium assembly | 0.014 | 0.1 | -10000 | 0 | -0.36 | 10 | 10 |
| PVRL1 | 0.03 | 0.004 | -10000 | 0 | -10000 | 0 | 0 |
| PVRL3 | 0.026 | 0.034 | -10000 | 0 | -0.48 | 2 | 2 |
| PVRL2 | 0.03 | 0.004 | -10000 | 0 | -10000 | 0 | 0 |
| PIK3R1 | 0.026 | 0.031 | -10000 | 0 | -0.64 | 1 | 1 |
| CDH1 | 0.007 | 0.12 | -10000 | 0 | -0.62 | 17 | 17 |
| CLDN1 | 0.022 | 0.064 | -10000 | 0 | -0.62 | 5 | 5 |
| JAM-A/CLDN1 | 0.058 | 0.053 | -10000 | 0 | -0.36 | 4 | 4 |
| SRC | 0.009 | 0.14 | -10000 | 0 | -0.53 | 2 | 2 |
| ITGB3 | 0.025 | 0.051 | -10000 | 0 | -0.64 | 3 | 3 |
| nectin-1(dimer)/I-afadin/I-afadin | 0.041 | 0.013 | -10000 | 0 | -10000 | 0 | 0 |
| FARP2 | 0.016 | 0.17 | -10000 | 0 | -0.63 | 15 | 15 |
| RAC1 | 0.027 | 0.009 | -10000 | 0 | -10000 | 0 | 0 |
| CTNNA1 | 0.023 | 0.013 | -10000 | 0 | -10000 | 0 | 0 |
| nectin-3(dimer)/I-afadin/I-afadin/Necl-5(dimer) | 0.051 | 0.032 | -10000 | 0 | -0.4 | 1 | 1 |
| nectin-1/I-afadin | 0.041 | 0.013 | -10000 | 0 | -10000 | 0 | 0 |
| nectin-2/I-afadin | 0.041 | 0.013 | -10000 | 0 | -10000 | 0 | 0 |
| RAC1/GTP/IQGAP1/filamentous actin | 0.036 | 0.013 | -10000 | 0 | -10000 | 0 | 0 |
| nectin-1(dimer)/I-afadin/I-afadin/nectin-3(dimer/I-afadin/I-afadin | 0.051 | 0.031 | -10000 | 0 | -0.4 | 1 | 1 |
| CDC42/GTP/IQGAP1/filamentous actin | 0.039 | 0.009 | -10000 | 0 | -10000 | 0 | 0 |
| F11R | 0.029 | 0.007 | -10000 | 0 | -10000 | 0 | 0 |
| positive regulation of filopodium formation | 0.011 | 0.1 | -10000 | 0 | -0.34 | 14 | 14 |
| alphaV/beta3 Integrin/Talin | 0.049 | 0.043 | -10000 | 0 | -10000 | 0 | 0 |
| nectin-2(dimer)/I-afadin/I-afadin/nectin-2(dimer/I-afadin/I-afadin | 0.041 | 0.013 | -10000 | 0 | -10000 | 0 | 0 |
| nectin-2(dimer)/I-afadin/I-afadin | 0.041 | 0.013 | -10000 | 0 | -10000 | 0 | 0 |
| PIP5K1C | 0.017 | 0.014 | -10000 | 0 | -10000 | 0 | 0 |
| VAV2 | 0.017 | 0.17 | -10000 | 0 | -0.62 | 12 | 12 |
| RAP1/GDP | 0.038 | 0.12 | -10000 | 0 | -0.4 | 3 | 3 |
| ITGAV | 0.029 | 0.007 | -10000 | 0 | -10000 | 0 | 0 |
| nectin-3(dimer)/I-afadin/I-afadin/nectin-2(dimer)/I-afadin/I-afadin | 0.051 | 0.032 | -10000 | 0 | -0.4 | 1 | 1 |
| nectin-3(dimer)/I-afadin/I-afadin | 0.037 | 0.03 | -10000 | 0 | -0.47 | 1 | 1 |
| Rac1/GTP | 0.022 | 0.12 | -10000 | 0 | -0.44 | 10 | 10 |
| PTPRM | 0.019 | 0.016 | -10000 | 0 | -10000 | 0 | 0 |
| E-cadherin/beta catenin/alpha catenin | 0.042 | 0.074 | -10000 | 0 | -10000 | 0 | 0 |
| adherens junction assembly | 0 | 0 | -10000 | 0 | -10000 | 0 | 0 |
| CDC42 | 0.029 | 0.006 | -10000 | 0 | -10000 | 0 | 0 |
Figure S115. Get High-res Image This plot shows pathway concept perturbations across all samples against a permutation model. The concepts along the x-axis are sorted by lowest to highest mean activity for the real patient samples. Mean inferred activities are plotted along the y-axis as a colored band showing the average level and one standard deviation range. Real samples are shown in red and permuted samples in black.
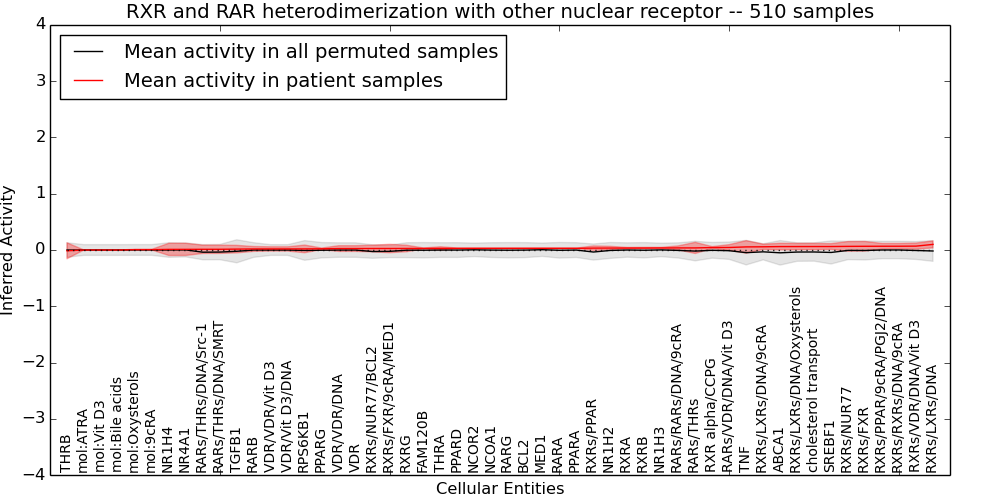
Table S115. Get Full Table This table displays mean, standard deviation, and perturbation statistics for Inferred Pathway Levels (IPLs). A mean perturbation of -9999 implies that the IPLs across all the real samples did not differ enough from the IPLs generated by a background model of permuted samples (> 1 Std.Dev from the permuted sample IPLs).
| Entity | Mean | Std.Dev | Mean.of.Up.Perturbations | Number.of.Up.Perturbations | Mean.of.Down.Perturbations | Number.of.Down.Perturbations | Number.of.Total.Perturbations |
|---|---|---|---|---|---|---|---|
| TGFB1 | 0.016 | 0.067 | 0.84 | 1 | -0.46 | 4 | 5 |
| VDR | 0.025 | 0.051 | -10000 | 0 | -0.64 | 3 | 3 |
| FAM120B | 0.028 | 0.008 | -10000 | 0 | -10000 | 0 | 0 |
| RXRs/LXRs/DNA/9cRA | 0.057 | 0.047 | -10000 | 0 | -0.34 | 1 | 1 |
| RXRs/LXRs/DNA/Oxysterols | 0.061 | 0.056 | -10000 | 0 | -10000 | 0 | 0 |
| MED1 | 0.03 | 0.005 | -10000 | 0 | -10000 | 0 | 0 |
| mol:9cRA | 0.006 | 0.007 | -10000 | 0 | -10000 | 0 | 0 |
| RARs/THRs/DNA/Src-1 | 0.013 | 0.074 | -10000 | 0 | -10000 | 0 | 0 |
| RXRs/NUR77 | 0.064 | 0.086 | -10000 | 0 | -0.36 | 14 | 14 |
| RXRs/PPAR | 0.033 | 0.039 | -10000 | 0 | -0.55 | 1 | 1 |
| NCOR2 | 0.029 | 0.006 | -10000 | 0 | -10000 | 0 | 0 |
| VDR/VDR/Vit D3 | 0.019 | 0.038 | -10000 | 0 | -0.47 | 3 | 3 |
| RARs/VDR/DNA/Vit D3 | 0.045 | 0.051 | -10000 | 0 | -0.34 | 5 | 5 |
| RARA | 0.03 | 0.005 | -10000 | 0 | -10000 | 0 | 0 |
| NCOA1 | 0.029 | 0.005 | -10000 | 0 | -10000 | 0 | 0 |
| VDR/VDR/DNA | 0.025 | 0.051 | -10000 | 0 | -0.63 | 3 | 3 |
| RARs/RARs/DNA/9cRA | 0.037 | 0.036 | -10000 | 0 | -0.34 | 2 | 2 |
| RARG | 0.029 | 0.005 | -10000 | 0 | -10000 | 0 | 0 |
| RPS6KB1 | 0.02 | 0.068 | 0.5 | 8 | -0.43 | 1 | 9 |
| RARs/THRs/DNA/SMRT | 0.013 | 0.073 | -10000 | 0 | -10000 | 0 | 0 |
| THRA | 0.028 | 0.03 | -10000 | 0 | -0.64 | 1 | 1 |
| mol:Bile acids | 0 | 0 | -10000 | 0 | -10000 | 0 | 0 |
| VDR/Vit D3/DNA | 0.019 | 0.038 | -10000 | 0 | -0.47 | 3 | 3 |
| RXRs/PPAR/9cRA/PGJ2/DNA | 0.067 | 0.05 | 0.33 | 1 | -0.34 | 3 | 4 |
| NR1H4 | 0.011 | 0.11 | -10000 | 0 | -0.64 | 14 | 14 |
| RXRs/LXRs/DNA | 0.1 | 0.062 | -10000 | 0 | -10000 | 0 | 0 |
| NR1H2 | 0.034 | 0.031 | -10000 | 0 | -0.63 | 1 | 1 |
| NR1H3 | 0.036 | 0.011 | -10000 | 0 | -10000 | 0 | 0 |
| RXRs/VDR/DNA/Vit D3 | 0.069 | 0.055 | -10000 | 0 | -0.35 | 3 | 3 |
| NR4A1 | 0.011 | 0.11 | -10000 | 0 | -0.63 | 14 | 14 |
| mol:ATRA | 0 | 0 | -10000 | 0 | -10000 | 0 | 0 |
| RXRs/FXR/9cRA/MED1 | 0.026 | 0.074 | -10000 | 0 | -0.37 | 14 | 14 |
| RXRG | 0.027 | 0.058 | -10000 | 0 | -0.61 | 4 | 4 |
| RXR alpha/CCPG | 0.044 | 0.017 | -10000 | 0 | -10000 | 0 | 0 |
| RXRA | 0.034 | 0.011 | -10000 | 0 | -10000 | 0 | 0 |
| RXRB | 0.035 | 0.012 | -10000 | 0 | -10000 | 0 | 0 |
| THRB | -0.014 | 0.14 | -10000 | 0 | -0.56 | 31 | 31 |
| PPARG | 0.021 | 0.014 | -10000 | 0 | -10000 | 0 | 0 |
| PPARD | 0.029 | 0.006 | -10000 | 0 | -10000 | 0 | 0 |
| TNF | 0.055 | 0.11 | -10000 | 0 | -1 | 4 | 4 |
| mol:Oxysterols | 0.006 | 0.006 | -10000 | 0 | -10000 | 0 | 0 |
| cholesterol transport | 0.062 | 0.056 | -10000 | 0 | -10000 | 0 | 0 |
| PPARA | 0.03 | 0.004 | -10000 | 0 | -10000 | 0 | 0 |
| mol:Vit D3 | 0 | 0 | -10000 | 0 | -10000 | 0 | 0 |
| RARB | 0.019 | 0.043 | -10000 | 0 | -0.64 | 2 | 2 |
| RXRs/NUR77/BCL2 | 0.026 | 0.06 | -10000 | 0 | -0.32 | 8 | 8 |
| SREBF1 | 0.062 | 0.052 | -10000 | 0 | -10000 | 0 | 0 |
| RXRs/RXRs/DNA/9cRA | 0.067 | 0.05 | 0.33 | 1 | -0.34 | 3 | 4 |
| ABCA1 | 0.061 | 0.059 | -10000 | 0 | -10000 | 0 | 0 |
| RARs/THRs | 0.037 | 0.099 | -10000 | 0 | -10000 | 0 | 0 |
| RXRs/FXR | 0.066 | 0.085 | -10000 | 0 | -0.37 | 9 | 9 |
| BCL2 | 0.029 | 0.005 | -10000 | 0 | -10000 | 0 | 0 |
Figure S116. Get High-res Image This plot shows pathway concept perturbations across all samples against a permutation model. The concepts along the x-axis are sorted by lowest to highest mean activity for the real patient samples. Mean inferred activities are plotted along the y-axis as a colored band showing the average level and one standard deviation range. Real samples are shown in red and permuted samples in black.
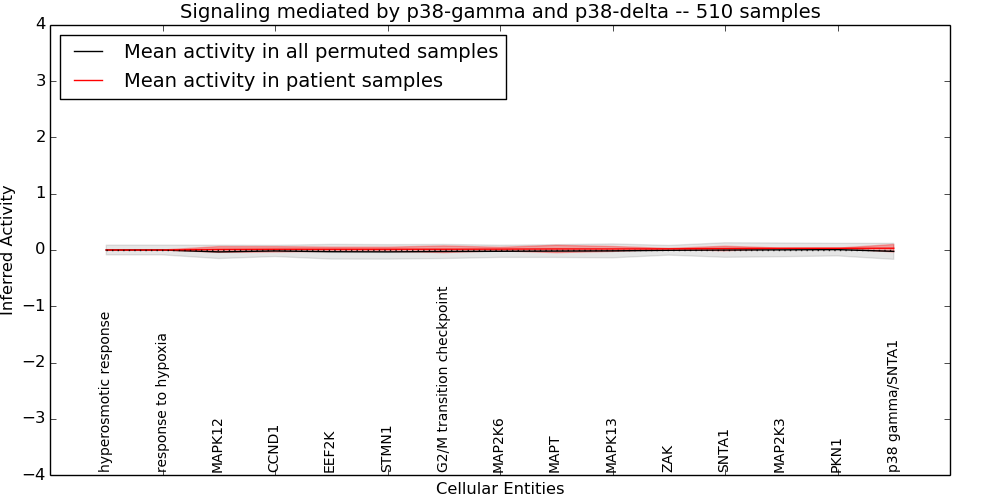
Table S116. Get Full Table This table displays mean, standard deviation, and perturbation statistics for Inferred Pathway Levels (IPLs). A mean perturbation of -9999 implies that the IPLs across all the real samples did not differ enough from the IPLs generated by a background model of permuted samples (> 1 Std.Dev from the permuted sample IPLs).
| Entity | Mean | Std.Dev | Mean.of.Up.Perturbations | Number.of.Up.Perturbations | Mean.of.Down.Perturbations | Number.of.Down.Perturbations | Number.of.Total.Perturbations |
|---|---|---|---|---|---|---|---|
| EEF2K | 0.013 | 0.037 | -10000 | 0 | -0.4 | 4 | 4 |
| SNTA1 | 0.027 | 0.04 | -10000 | 0 | -0.61 | 2 | 2 |
| response to hypoxia | 0 | 0 | -10000 | 0 | -10000 | 0 | 0 |
| STMN1 | 0.013 | 0.037 | -10000 | 0 | -0.39 | 4 | 4 |
| MAPK12 | 0.01 | 0.051 | -10000 | 0 | -0.33 | 11 | 11 |
| CCND1 | 0.013 | 0.048 | -10000 | 0 | -0.32 | 4 | 4 |
| p38 gamma/SNTA1 | 0.031 | 0.067 | 0.29 | 2 | -0.44 | 3 | 5 |
| MAP2K3 | 0.029 | 0.005 | -10000 | 0 | -10000 | 0 | 0 |
| PKN1 | 0.03 | 0.002 | -10000 | 0 | -10000 | 0 | 0 |
| G2/M transition checkpoint | 0.013 | 0.059 | -10000 | 0 | -0.33 | 11 | 11 |
| MAP2K6 | 0.016 | 0.032 | -10000 | 0 | -0.39 | 3 | 3 |
| MAPT | 0.019 | 0.065 | 0.34 | 3 | -0.4 | 8 | 11 |
| MAPK13 | 0.019 | 0.044 | -10000 | 0 | -0.47 | 4 | 4 |
| hyperosmotic response | 0 | 0 | -10000 | 0 | -10000 | 0 | 0 |
| ZAK | 0.021 | 0.007 | -10000 | 0 | -10000 | 0 | 0 |
Figure S117. Get High-res Image This plot shows pathway concept perturbations across all samples against a permutation model. The concepts along the x-axis are sorted by lowest to highest mean activity for the real patient samples. Mean inferred activities are plotted along the y-axis as a colored band showing the average level and one standard deviation range. Real samples are shown in red and permuted samples in black.
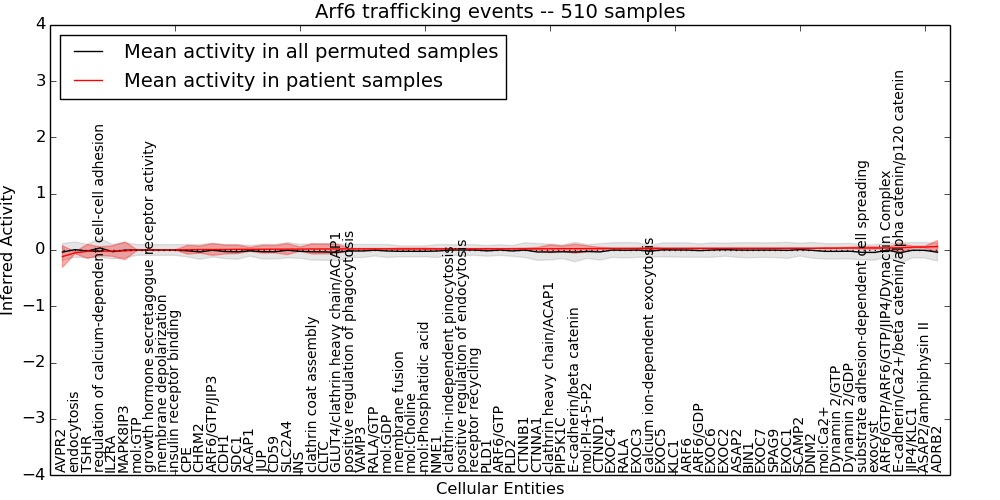
Table S117. Get Full Table This table displays mean, standard deviation, and perturbation statistics for Inferred Pathway Levels (IPLs). A mean perturbation of -9999 implies that the IPLs across all the real samples did not differ enough from the IPLs generated by a background model of permuted samples (> 1 Std.Dev from the permuted sample IPLs).
| Entity | Mean | Std.Dev | Mean.of.Up.Perturbations | Number.of.Up.Perturbations | Mean.of.Down.Perturbations | Number.of.Down.Perturbations | Number.of.Total.Perturbations |
|---|---|---|---|---|---|---|---|
| SLC2A4 | 0.015 | 0.098 | -10000 | 0 | -0.64 | 11 | 11 |
| CLTC | 0.018 | 0.087 | -10000 | 0 | -0.39 | 5 | 5 |
| calcium ion-dependent exocytosis | 0.027 | 0.028 | 0.2 | 1 | -10000 | 0 | 1 |
| Dynamin 2/GTP | 0.033 | 0.011 | -10000 | 0 | -10000 | 0 | 0 |
| EXOC4 | 0.027 | 0.009 | -10000 | 0 | -10000 | 0 | 0 |
| CD59 | 0.015 | 0.066 | -10000 | 0 | -0.3 | 4 | 4 |
| CPE | 0.004 | 0.078 | -10000 | 0 | -0.37 | 21 | 21 |
| CTNNB1 | 0.021 | 0.014 | -10000 | 0 | -10000 | 0 | 0 |
| membrane fusion | 0.02 | 0.015 | -10000 | 0 | -10000 | 0 | 0 |
| CTNND1 | 0.026 | 0.021 | -10000 | 0 | -10000 | 0 | 0 |
| DNM2 | 0.03 | 0.003 | -10000 | 0 | -10000 | 0 | 0 |
| mol:PI-4-5-P2 | 0.024 | 0.05 | 0.26 | 1 | -0.44 | 1 | 2 |
| TSHR | -0.024 | 0.12 | -10000 | 0 | -0.37 | 58 | 58 |
| INS | 0.017 | 0.039 | -10000 | 0 | -0.77 | 1 | 1 |
| BIN1 | 0.029 | 0.005 | -10000 | 0 | -10000 | 0 | 0 |
| mol:Choline | 0.02 | 0.015 | -10000 | 0 | -10000 | 0 | 0 |
| growth hormone secretagogue receptor activity | 0 | 0 | -10000 | 0 | -10000 | 0 | 0 |
| mol:GDP | 0.02 | 0.007 | -10000 | 0 | -10000 | 0 | 0 |
| membrane depolarization | 0 | 0 | -10000 | 0 | -10000 | 0 | 0 |
| ARF6 | 0.028 | 0.008 | -10000 | 0 | -10000 | 0 | 0 |
| mol:Ca2+ | 0.032 | 0.011 | -10000 | 0 | -10000 | 0 | 0 |
| JUP | 0.013 | 0.07 | -10000 | 0 | -0.32 | 5 | 5 |
| ASAP2/amphiphysin II | 0.052 | 0.018 | -10000 | 0 | -10000 | 0 | 0 |
| ARF6/GTP | 0.021 | 0.006 | -10000 | 0 | -10000 | 0 | 0 |
| CDH1 | 0.009 | 0.079 | -10000 | 0 | -0.37 | 7 | 7 |
| clathrin-independent pinocytosis | 0.021 | 0.006 | -10000 | 0 | -10000 | 0 | 0 |
| MAPK8IP3 | -0.015 | 0.16 | -10000 | 0 | -0.59 | 36 | 36 |
| positive regulation of endocytosis | 0.021 | 0.006 | -10000 | 0 | -10000 | 0 | 0 |
| EXOC2 | 0.029 | 0.006 | -10000 | 0 | -10000 | 0 | 0 |
| substrate adhesion-dependent cell spreading | 0.036 | 0.022 | -10000 | 0 | -10000 | 0 | 0 |
| insulin receptor binding | 0 | 0 | -10000 | 0 | -10000 | 0 | 0 |
| SPAG9 | 0.029 | 0.005 | -10000 | 0 | -10000 | 0 | 0 |
| regulation of calcium-dependent cell-cell adhesion | -0.021 | 0.078 | 0.46 | 2 | -10000 | 0 | 2 |
| positive regulation of phagocytosis | 0.02 | 0.007 | -10000 | 0 | -10000 | 0 | 0 |
| ARF6/GTP/JIP3 | 0.008 | 0.1 | -10000 | 0 | -0.37 | 36 | 36 |
| ACAP1 | 0.012 | 0.036 | -10000 | 0 | -0.27 | 1 | 1 |
| mol:GTP | 0 | 0 | -10000 | 0 | -10000 | 0 | 0 |
| CHRM2 | 0.008 | 0.064 | -10000 | 0 | -0.32 | 5 | 5 |
| clathrin heavy chain/ACAP1 | 0.022 | 0.07 | -10000 | 0 | -0.49 | 1 | 1 |
| JIP4/KLC1 | 0.052 | 0.018 | -10000 | 0 | -10000 | 0 | 0 |
| EXOC1 | 0.03 | 0.004 | -10000 | 0 | -10000 | 0 | 0 |
| exocyst | 0.036 | 0.022 | -10000 | 0 | -10000 | 0 | 0 |
| RALA/GTP | 0.02 | 0.007 | -10000 | 0 | -10000 | 0 | 0 |
| ARF6/GTP/ARF6/GTP/JIP4/Dynactin Complex | 0.037 | 0.012 | -10000 | 0 | -10000 | 0 | 0 |
| receptor recycling | 0.021 | 0.006 | -10000 | 0 | -10000 | 0 | 0 |
| CTNNA1 | 0.021 | 0.023 | -10000 | 0 | -10000 | 0 | 0 |
| NME1 | 0.02 | 0.007 | -10000 | 0 | -10000 | 0 | 0 |
| clathrin coat assembly | 0.018 | 0.09 | -10000 | 0 | -0.38 | 5 | 5 |
| IL2RA | -0.019 | 0.094 | -10000 | 0 | -0.37 | 7 | 7 |
| VAMP3 | 0.02 | 0.007 | -10000 | 0 | -10000 | 0 | 0 |
| GLUT4/clathrin heavy chain/ACAP1 | 0.019 | 0.082 | -10000 | 0 | -0.44 | 4 | 4 |
| EXOC6 | 0.029 | 0.006 | -10000 | 0 | -10000 | 0 | 0 |
| PLD1 | 0.021 | 0.01 | -10000 | 0 | -10000 | 0 | 0 |
| PLD2 | 0.021 | 0.009 | -10000 | 0 | -10000 | 0 | 0 |
| EXOC5 | 0.028 | 0.008 | -10000 | 0 | -10000 | 0 | 0 |
| PIP5K1C | 0.023 | 0.047 | -10000 | 0 | -0.45 | 1 | 1 |
| SDC1 | 0.012 | 0.076 | -10000 | 0 | -0.37 | 6 | 6 |
| ARF6/GDP | 0.028 | 0.009 | -10000 | 0 | -10000 | 0 | 0 |
| EXOC7 | 0.029 | 0.005 | -10000 | 0 | -10000 | 0 | 0 |
| E-cadherin/beta catenin | 0.023 | 0.081 | -10000 | 0 | -0.47 | 2 | 2 |
| mol:Phosphatidic acid | 0.02 | 0.015 | -10000 | 0 | -10000 | 0 | 0 |
| endocytosis | -0.051 | 0.017 | -10000 | 0 | -10000 | 0 | 0 |
| SCAMP2 | 0.03 | 0.003 | -10000 | 0 | -10000 | 0 | 0 |
| ADRB2 | 0.062 | 0.11 | 0.33 | 6 | -0.51 | 1 | 7 |
| EXOC3 | 0.027 | 0.009 | -10000 | 0 | -10000 | 0 | 0 |
| ASAP2 | 0.029 | 0.005 | -10000 | 0 | -10000 | 0 | 0 |
| Dynamin 2/GDP | 0.036 | 0.012 | -10000 | 0 | -10000 | 0 | 0 |
| KLC1 | 0.028 | 0.008 | -10000 | 0 | -10000 | 0 | 0 |
| AVPR2 | -0.12 | 0.19 | 0.3 | 1 | -0.57 | 26 | 27 |
| RALA | 0.027 | 0.009 | -10000 | 0 | -10000 | 0 | 0 |
| E-cadherin/Ca2+/beta catenin/alpha catenin/p120 catenin | 0.038 | 0.081 | -10000 | 0 | -0.49 | 1 | 1 |
Figure S118. Get High-res Image This plot shows pathway concept perturbations across all samples against a permutation model. The concepts along the x-axis are sorted by lowest to highest mean activity for the real patient samples. Mean inferred activities are plotted along the y-axis as a colored band showing the average level and one standard deviation range. Real samples are shown in red and permuted samples in black.
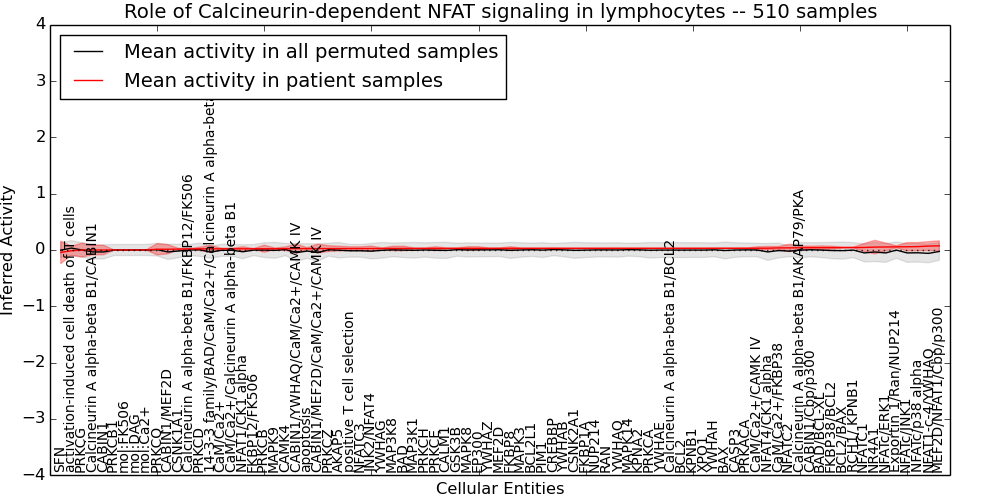
Table S118. Get Full Table This table displays mean, standard deviation, and perturbation statistics for Inferred Pathway Levels (IPLs). A mean perturbation of -9999 implies that the IPLs across all the real samples did not differ enough from the IPLs generated by a background model of permuted samples (> 1 Std.Dev from the permuted sample IPLs).
| Entity | Mean | Std.Dev | Mean.of.Up.Perturbations | Number.of.Up.Perturbations | Mean.of.Down.Perturbations | Number.of.Down.Perturbations | Number.of.Total.Perturbations |
|---|---|---|---|---|---|---|---|
| BCL2L1 | 0.029 | 0.006 | -10000 | 0 | -10000 | 0 | 0 |
| NFATC1 | 0.045 | 0.071 | 0.37 | 3 | -0.44 | 1 | 4 |
| NFATC2 | 0.038 | 0.067 | 0.26 | 5 | -0.27 | 9 | 14 |
| NFATC3 | 0.025 | 0.031 | -10000 | 0 | -0.35 | 3 | 3 |
| YWHAE | 0.029 | 0.005 | -10000 | 0 | -10000 | 0 | 0 |
| Calcineurin A alpha-beta B1/CABIN1 | 0 | 0.086 | 0.31 | 2 | -0.36 | 11 | 13 |
| Exportin 1/Ran/NUP214 | 0.056 | 0.018 | -10000 | 0 | -10000 | 0 | 0 |
| mol:DAG | 0 | 0.001 | -10000 | 0 | -10000 | 0 | 0 |
| CABIN1/MEF2D/CaM/Ca2+/CAMK IV | 0.025 | 0.079 | -10000 | 0 | -0.43 | 3 | 3 |
| BCL2/BAX | 0.043 | 0.009 | -10000 | 0 | -10000 | 0 | 0 |
| CaM/Ca2+/Calcineurin A alpha-beta B1 | 0.021 | 0.01 | -10000 | 0 | -10000 | 0 | 0 |
| CaM/Ca2+ | 0.021 | 0.01 | -10000 | 0 | -10000 | 0 | 0 |
| BAX | 0.03 | 0.003 | -10000 | 0 | -10000 | 0 | 0 |
| MAPK14 | 0.029 | 0.006 | -10000 | 0 | -10000 | 0 | 0 |
| BAD | 0.027 | 0.04 | -10000 | 0 | -0.61 | 2 | 2 |
| CABIN1/MEF2D | 0.013 | 0.082 | 0.31 | 1 | -0.38 | 6 | 7 |
| Calcineurin A alpha-beta B1/BCL2 | 0.029 | 0.005 | -10000 | 0 | -10000 | 0 | 0 |
| FKBP8 | 0.029 | 0.03 | -10000 | 0 | -0.64 | 1 | 1 |
| activation-induced cell death of T cells | -0.013 | 0.082 | 0.37 | 6 | -0.31 | 1 | 7 |
| KPNB1 | 0.029 | 0.005 | -10000 | 0 | -10000 | 0 | 0 |
| KPNA2 | 0.029 | 0.005 | -10000 | 0 | -10000 | 0 | 0 |
| XPO1 | 0.029 | 0.005 | -10000 | 0 | -10000 | 0 | 0 |
| SFN | -0.043 | 0.2 | -10000 | 0 | -0.59 | 59 | 59 |
| MAP3K8 | 0.027 | 0.039 | -10000 | 0 | -0.59 | 2 | 2 |
| NFAT4/CK1 alpha | 0.032 | 0.03 | -10000 | 0 | -10000 | 0 | 0 |
| MEF2D/NFAT1/Cbp/p300 | 0.074 | 0.089 | -10000 | 0 | -0.42 | 4 | 4 |
| CABIN1 | 0 | 0.084 | 0.31 | 2 | -0.37 | 10 | 12 |
| CALM1 | 0.028 | 0.009 | -10000 | 0 | -10000 | 0 | 0 |
| RAN | 0.029 | 0.006 | -10000 | 0 | -10000 | 0 | 0 |
| MAP3K1 | 0.028 | 0.009 | -10000 | 0 | -10000 | 0 | 0 |
| CAMK4 | 0.023 | 0.031 | -10000 | 0 | -0.64 | 1 | 1 |
| mol:Ca2+ | 0.001 | 0.004 | -10000 | 0 | -10000 | 0 | 0 |
| MAPK3 | 0.029 | 0.006 | -10000 | 0 | -10000 | 0 | 0 |
| YWHAH | 0.03 | 0.004 | -10000 | 0 | -10000 | 0 | 0 |
| Calcineurin A alpha-beta B1/AKAP79/PKA | 0.039 | 0.034 | -10000 | 0 | -0.47 | 2 | 2 |
| YWHAB | 0.029 | 0.006 | -10000 | 0 | -10000 | 0 | 0 |
| MAPK8 | 0.028 | 0.03 | -10000 | 0 | -0.63 | 1 | 1 |
| MAPK9 | 0.023 | 0.013 | -10000 | 0 | -10000 | 0 | 0 |
| YWHAG | 0.027 | 0.009 | -10000 | 0 | -10000 | 0 | 0 |
| FKBP1A | 0.029 | 0.006 | -10000 | 0 | -10000 | 0 | 0 |
| NFAT1-c-4/YWHAQ | 0.07 | 0.079 | -10000 | 0 | -0.45 | 1 | 1 |
| PRKCH | 0.028 | 0.008 | -10000 | 0 | -10000 | 0 | 0 |
| CABIN1/Cbp/p300 | 0.041 | 0.027 | -10000 | 0 | -0.47 | 1 | 1 |
| CASP3 | 0.03 | 0.004 | -10000 | 0 | -10000 | 0 | 0 |
| PIM1 | 0.029 | 0.006 | -10000 | 0 | -10000 | 0 | 0 |
| Calcineurin A alpha-beta B1/FKBP12/FK506 | 0.02 | 0.005 | -10000 | 0 | -10000 | 0 | 0 |
| apoptosis | 0.025 | 0.017 | -10000 | 0 | -10000 | 0 | 0 |
| 14-3-3 family/BAD/CaM/Ca2+/Calcineurin A alpha-beta B1 | 0.021 | 0.062 | -10000 | 0 | -0.36 | 5 | 5 |
| PRKCB | 0.022 | 0.063 | -10000 | 0 | -0.61 | 5 | 5 |
| PRKCE | 0.028 | 0.03 | -10000 | 0 | -0.64 | 1 | 1 |
| JNK2/NFAT4 | 0.026 | 0.044 | -10000 | 0 | -0.4 | 1 | 1 |
| BAD/BCL-XL | 0.041 | 0.032 | -10000 | 0 | -0.45 | 2 | 2 |
| PRKCD | 0.02 | 0.03 | -10000 | 0 | -0.59 | 1 | 1 |
| NUP214 | 0.029 | 0.006 | -10000 | 0 | -10000 | 0 | 0 |
| PRKCZ | 0.025 | 0.052 | -10000 | 0 | -0.64 | 3 | 3 |
| PRKCA | 0.029 | 0.005 | -10000 | 0 | -10000 | 0 | 0 |
| PRKCG | -0.002 | 0.12 | -10000 | 0 | -0.59 | 21 | 21 |
| PRKCQ | 0.013 | 0.1 | -10000 | 0 | -0.57 | 14 | 14 |
| FKBP38/BCL2 | 0.042 | 0.024 | -10000 | 0 | -0.47 | 1 | 1 |
| EP300 | 0.028 | 0.03 | -10000 | 0 | -0.63 | 1 | 1 |
| PRKCB1 | 0 | 0 | -10000 | 0 | -10000 | 0 | 0 |
| CSNK2A1 | 0.029 | 0.006 | -10000 | 0 | -10000 | 0 | 0 |
| NFATc/JNK1 | 0.058 | 0.074 | 0.35 | 2 | -0.39 | 1 | 3 |
| CaM/Ca2+/FKBP38 | 0.037 | 0.024 | -10000 | 0 | -0.42 | 1 | 1 |
| FKBP12/FK506 | 0.022 | 0.004 | -10000 | 0 | -10000 | 0 | 0 |
| CSNK1A1 | 0.017 | 0.012 | -10000 | 0 | -10000 | 0 | 0 |
| CaM/Ca2+/CAMK IV | 0.031 | 0.026 | -10000 | 0 | -0.39 | 1 | 1 |
| NFATc/ERK1 | 0.054 | 0.071 | -10000 | 0 | -0.41 | 1 | 1 |
| CABIN1/YWHAQ/CaM/Ca2+/CAMK IV | 0.024 | 0.08 | -10000 | 0 | -0.44 | 3 | 3 |
| NR4A1 | 0.051 | 0.12 | -10000 | 0 | -0.58 | 13 | 13 |
| GSK3B | 0.028 | 0.009 | -10000 | 0 | -10000 | 0 | 0 |
| positive T cell selection | 0.025 | 0.031 | -10000 | 0 | -0.35 | 3 | 3 |
| NFAT1/CK1 alpha | 0.021 | 0.037 | -10000 | 0 | -10000 | 0 | 0 |
| RCH1/ KPNB1 | 0.043 | 0.008 | -10000 | 0 | -10000 | 0 | 0 |
| YWHAQ | 0.029 | 0.005 | -10000 | 0 | -10000 | 0 | 0 |
| PRKACA | 0.03 | 0.003 | -10000 | 0 | -10000 | 0 | 0 |
| AKAP5 | 0.025 | 0.042 | -10000 | 0 | -0.64 | 2 | 2 |
| MEF2D | 0.029 | 0.009 | -10000 | 0 | -10000 | 0 | 0 |
| mol:FK506 | 0 | 0 | -10000 | 0 | -10000 | 0 | 0 |
| YWHAZ | 0.029 | 0.007 | -10000 | 0 | -10000 | 0 | 0 |
| NFATc/p38 alpha | 0.06 | 0.072 | 0.37 | 3 | -0.39 | 1 | 4 |
| CREBBP | 0.029 | 0.008 | -10000 | 0 | -10000 | 0 | 0 |
| BCL2 | 0.029 | 0.005 | -10000 | 0 | -10000 | 0 | 0 |
Figure S119. Get High-res Image This plot shows pathway concept perturbations across all samples against a permutation model. The concepts along the x-axis are sorted by lowest to highest mean activity for the real patient samples. Mean inferred activities are plotted along the y-axis as a colored band showing the average level and one standard deviation range. Real samples are shown in red and permuted samples in black.
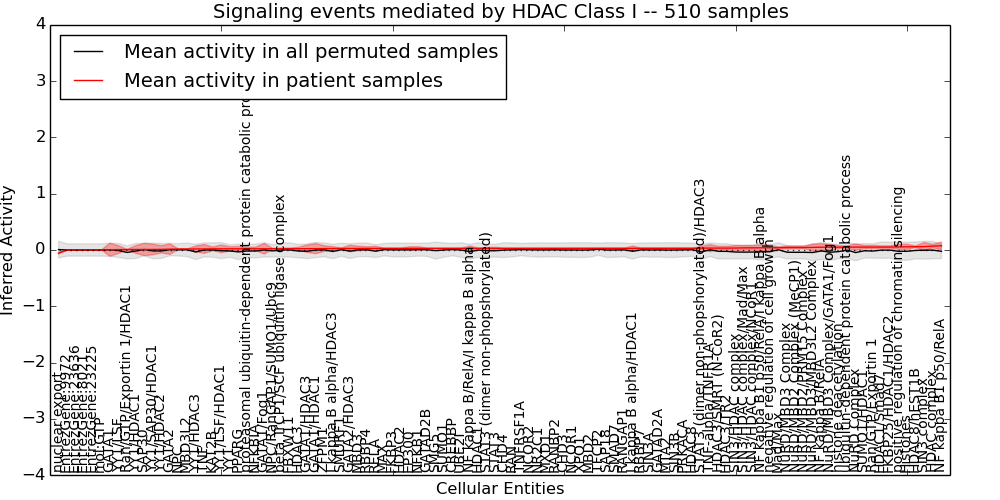
Table S119. Get Full Table This table displays mean, standard deviation, and perturbation statistics for Inferred Pathway Levels (IPLs). A mean perturbation of -9999 implies that the IPLs across all the real samples did not differ enough from the IPLs generated by a background model of permuted samples (> 1 Std.Dev from the permuted sample IPLs).
| Entity | Mean | Std.Dev | Mean.of.Up.Perturbations | Number.of.Up.Perturbations | Mean.of.Down.Perturbations | Number.of.Down.Perturbations | Number.of.Total.Perturbations |
|---|---|---|---|---|---|---|---|
| NF kappa B/RelA | 0.05 | 0.061 | -10000 | 0 | -0.41 | 3 | 3 |
| Ran/GTP/Exportin 1/HDAC1 | 0.008 | 0.002 | -10000 | 0 | -10000 | 0 | 0 |
| NF kappa B1 p50/RelA/I kappa B alpha | 0.039 | 0.055 | -10000 | 0 | -0.37 | 3 | 3 |
| SUMO1 | 0.029 | 0.007 | -10000 | 0 | -10000 | 0 | 0 |
| ZFPM1 | 0.025 | 0.051 | -10000 | 0 | -0.64 | 3 | 3 |
| NPC/RanGAP1/SUMO1/Ubc9 | 0.022 | 0.008 | -10000 | 0 | -10000 | 0 | 0 |
| FKBP3 | 0.028 | 0.008 | -10000 | 0 | -10000 | 0 | 0 |
| Histones | 0.057 | 0.046 | -10000 | 0 | -10000 | 0 | 0 |
| YY1/LSF | 0.007 | 0.069 | -10000 | 0 | -0.64 | 1 | 1 |
| SMG5 | 0.029 | 0.007 | -10000 | 0 | -10000 | 0 | 0 |
| RAN | 0.029 | 0.006 | -10000 | 0 | -10000 | 0 | 0 |
| I kappa B alpha/HDAC3 | 0.026 | 0.034 | -10000 | 0 | -0.28 | 2 | 2 |
| I kappa B alpha/HDAC1 | 0.03 | 0.04 | -10000 | 0 | -10000 | 0 | 0 |
| SAP18 | 0.029 | 0.005 | -10000 | 0 | -10000 | 0 | 0 |
| RELA | 0.028 | 0.037 | -10000 | 0 | -10000 | 0 | 0 |
| HDAC1/Smad7 | 0.052 | 0.022 | -10000 | 0 | -10000 | 0 | 0 |
| RANGAP1 | 0.03 | 0.004 | -10000 | 0 | -10000 | 0 | 0 |
| HDAC3/TR2 | 0.034 | 0.032 | -10000 | 0 | -10000 | 0 | 0 |
| NuRD/MBD3 Complex | 0.044 | 0.027 | -10000 | 0 | -0.32 | 1 | 1 |
| NF kappa B1 p50/RelA | 0.075 | 0.069 | 0.29 | 7 | -0.55 | 1 | 8 |
| EntrezGene:23225 | 0 | 0 | -10000 | 0 | -10000 | 0 | 0 |
| GATA2 | 0.015 | 0.093 | -10000 | 0 | -0.61 | 11 | 11 |
| GATA1 | 0.005 | 0.12 | -10000 | 0 | -0.59 | 19 | 19 |
| Mad/Max | 0.04 | 0.014 | -10000 | 0 | -10000 | 0 | 0 |
| NuRD/MBD3 Complex/GATA1/Fog1 | 0.05 | 0.053 | -10000 | 0 | -0.42 | 2 | 2 |
| RBBP7 | 0.03 | 0.003 | -10000 | 0 | -10000 | 0 | 0 |
| NPC | 0.017 | 0.003 | -10000 | 0 | -10000 | 0 | 0 |
| RBBP4 | 0.028 | 0.03 | -10000 | 0 | -0.64 | 1 | 1 |
| MAX | 0.028 | 0.008 | -10000 | 0 | -10000 | 0 | 0 |
| EntrezGene:9972 | 0 | 0 | -10000 | 0 | -10000 | 0 | 0 |
| FBXW11 | 0.023 | 0.013 | -10000 | 0 | -10000 | 0 | 0 |
| NFKBIA | 0.022 | 0.029 | -10000 | 0 | -10000 | 0 | 0 |
| KAT2B | 0.02 | 0.032 | -10000 | 0 | -0.64 | 1 | 1 |
| mol:GTP | 0 | 0 | -10000 | 0 | -10000 | 0 | 0 |
| SIN3/HDAC complex | 0.035 | 0.045 | -10000 | 0 | -0.42 | 2 | 2 |
| SIN3 complex | 0.06 | 0.075 | -10000 | 0 | -0.33 | 15 | 15 |
| SMURF1 | 0.027 | 0.009 | -10000 | 0 | -10000 | 0 | 0 |
| CHD3 | 0.029 | 0.005 | -10000 | 0 | -10000 | 0 | 0 |
| SAP30 | 0.009 | 0.11 | -10000 | 0 | -0.59 | 17 | 17 |
| EntrezGene:23636 | 0 | 0 | -10000 | 0 | -10000 | 0 | 0 |
| NCOR1 | 0.029 | 0.005 | -10000 | 0 | -10000 | 0 | 0 |
| YY1/HDAC3 | 0.018 | 0.052 | -10000 | 0 | -0.56 | 1 | 1 |
| YY1/HDAC2 | 0.011 | 0.065 | -10000 | 0 | -0.64 | 1 | 1 |
| YY1/HDAC1 | 0.009 | 0.068 | -10000 | 0 | -0.64 | 1 | 1 |
| NuRD/MBD2 Complex (MeCP1) | 0.044 | 0.022 | -10000 | 0 | -10000 | 0 | 0 |
| PPARG | 0.021 | 0.041 | -10000 | 0 | -0.34 | 2 | 2 |
| HDAC8/hEST1B | 0.058 | 0.014 | -10000 | 0 | -10000 | 0 | 0 |
| UBE2I | 0.029 | 0.006 | -10000 | 0 | -10000 | 0 | 0 |
| beta TrCP1/SCF ubiquitin ligase complex | 0.023 | 0.013 | -10000 | 0 | -10000 | 0 | 0 |
| TNFRSF1A | 0.029 | 0.006 | -10000 | 0 | -10000 | 0 | 0 |
| HDAC3/SMRT (N-CoR2) | 0.034 | 0.032 | -10000 | 0 | -10000 | 0 | 0 |
| MBD3L2 | 0.018 | 0.002 | -10000 | 0 | -10000 | 0 | 0 |
| ubiquitin-dependent protein catabolic process | 0.051 | 0.022 | -10000 | 0 | -10000 | 0 | 0 |
| CREBBP | 0.029 | 0.006 | -10000 | 0 | -10000 | 0 | 0 |
| NuRD/MBD3/MBD3L2 Complex | 0.046 | 0.062 | -10000 | 0 | -0.34 | 6 | 6 |
| HDAC1 | 0.029 | 0.006 | -10000 | 0 | -10000 | 0 | 0 |
| HDAC3 | 0.023 | 0.028 | -10000 | 0 | -10000 | 0 | 0 |
| HDAC2 | 0.028 | 0.008 | -10000 | 0 | -10000 | 0 | 0 |
| YY1 | 0.021 | 0.036 | -10000 | 0 | -0.71 | 1 | 1 |
| HDAC8 | 0.03 | 0.001 | -10000 | 0 | -10000 | 0 | 0 |
| SMAD7 | 0.029 | 0.005 | -10000 | 0 | -10000 | 0 | 0 |
| NCOR2 | 0.029 | 0.006 | -10000 | 0 | -10000 | 0 | 0 |
| MXD1 | 0.029 | 0.005 | -10000 | 0 | -10000 | 0 | 0 |
| STAT3 | 0.029 | 0.019 | -10000 | 0 | -0.36 | 1 | 1 |
| NFKB1 | 0.028 | 0.03 | -10000 | 0 | -0.64 | 1 | 1 |
| EntrezGene:8021 | 0 | 0 | -10000 | 0 | -10000 | 0 | 0 |
| RANBP2 | 0.029 | 0.005 | -10000 | 0 | -10000 | 0 | 0 |
| YY1/LSF/HDAC1 | 0.021 | 0.069 | -10000 | 0 | -0.6 | 1 | 1 |
| YY1/SAP30/HDAC1 | 0.01 | 0.095 | -10000 | 0 | -0.36 | 17 | 17 |
| EP300 | 0.028 | 0.03 | -10000 | 0 | -0.64 | 1 | 1 |
| STAT3 (dimer non-phopshorylated) | 0.029 | 0.019 | -10000 | 0 | -0.36 | 1 | 1 |
| proteasomal ubiquitin-dependent protein catabolic process | 0.021 | 0.029 | -10000 | 0 | -10000 | 0 | 0 |
| histone deacetylation | 0.05 | 0.025 | -10000 | 0 | -10000 | 0 | 0 |
| STAT3 (dimer non-phopshorylated)/HDAC3 | 0.033 | 0.033 | -10000 | 0 | -10000 | 0 | 0 |
| nuclear export | -0.057 | 0.014 | -10000 | 0 | -10000 | 0 | 0 |
| PRKACA | 0.03 | 0.002 | -10000 | 0 | -10000 | 0 | 0 |
| GATAD2B | 0.029 | 0.007 | -10000 | 0 | -10000 | 0 | 0 |
| GATAD2A | 0.03 | 0.003 | -10000 | 0 | -10000 | 0 | 0 |
| GATA2/HDAC3 | 0.027 | 0.058 | -10000 | 0 | -0.35 | 7 | 7 |
| GATA1/HDAC1 | 0.024 | 0.09 | -10000 | 0 | -0.43 | 19 | 19 |
| GATA1/HDAC3 | 0.023 | 0.066 | -10000 | 0 | -0.32 | 13 | 13 |
| CHD4 | 0.029 | 0.006 | -10000 | 0 | -10000 | 0 | 0 |
| TNF-alpha/TNFR1A | 0.034 | 0.062 | -10000 | 0 | -0.45 | 8 | 8 |
| SIN3/HDAC complex/Mad/Max | 0.038 | 0.043 | -10000 | 0 | -0.4 | 2 | 2 |
| NuRD Complex | 0.051 | 0.059 | -10000 | 0 | -10000 | 0 | 0 |
| positive regulation of chromatin silencing | 0.054 | 0.044 | -10000 | 0 | -10000 | 0 | 0 |
| SIN3B | 0.03 | 0.003 | -10000 | 0 | -10000 | 0 | 0 |
| MTA2 | 0.03 | 0.003 | -10000 | 0 | -10000 | 0 | 0 |
| SIN3A | 0.03 | 0.003 | -10000 | 0 | -10000 | 0 | 0 |
| XPO1 | 0.029 | 0.005 | -10000 | 0 | -10000 | 0 | 0 |
| SUMO1/HDAC1 | 0.051 | 0.028 | -10000 | 0 | -10000 | 0 | 0 |
| HDAC complex | 0.069 | 0.031 | -10000 | 0 | -0.37 | 1 | 1 |
| GATA1/Fog1 | 0.022 | 0.095 | -10000 | 0 | -0.44 | 20 | 20 |
| FKBP25/HDAC1/HDAC2 | 0.053 | 0.022 | -10000 | 0 | -10000 | 0 | 0 |
| TNF | 0.019 | 0.08 | -10000 | 0 | -0.61 | 8 | 8 |
| negative regulation of cell growth | 0.04 | 0.043 | -10000 | 0 | -0.4 | 2 | 2 |
| NuRD/MBD2/PRMT5 Complex | 0.044 | 0.022 | -10000 | 0 | -10000 | 0 | 0 |
| Ran/GTP/Exportin 1 | 0.052 | 0.029 | -10000 | 0 | -10000 | 0 | 0 |
| NF kappa B/RelA/I kappa B alpha | 0.029 | 0.041 | -10000 | 0 | -0.34 | 2 | 2 |
| SIN3/HDAC complex/NCoR1 | 0.039 | 0.041 | -10000 | 0 | -0.35 | 1 | 1 |
| TFCP2 | 0.029 | 0.005 | -10000 | 0 | -10000 | 0 | 0 |
| NR2C1 | 0.029 | 0.006 | -10000 | 0 | -10000 | 0 | 0 |
| MBD3 | 0.027 | 0.04 | -10000 | 0 | -0.61 | 2 | 2 |
| MBD2 | 0.029 | 0.005 | -10000 | 0 | -10000 | 0 | 0 |
Figure S120. Get High-res Image This plot shows pathway concept perturbations across all samples against a permutation model. The concepts along the x-axis are sorted by lowest to highest mean activity for the real patient samples. Mean inferred activities are plotted along the y-axis as a colored band showing the average level and one standard deviation range. Real samples are shown in red and permuted samples in black.
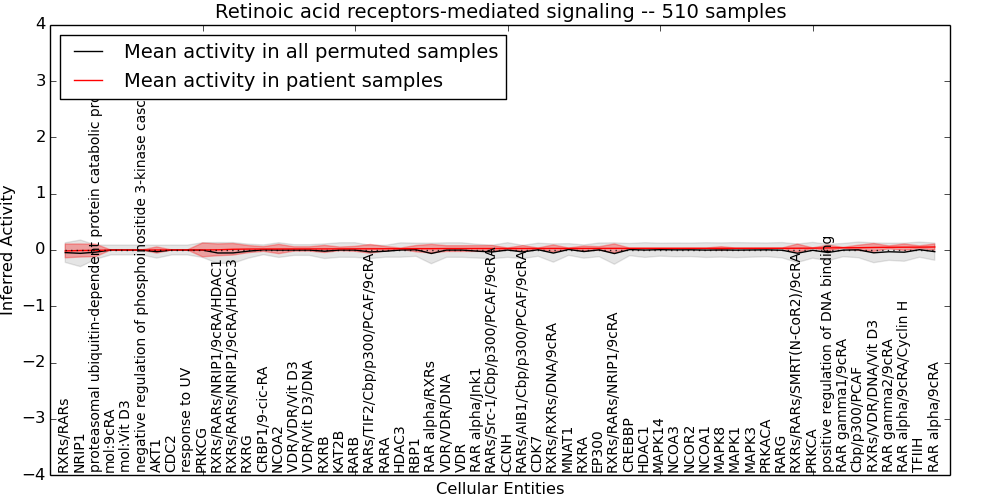
Table S120. Get Full Table This table displays mean, standard deviation, and perturbation statistics for Inferred Pathway Levels (IPLs). A mean perturbation of -9999 implies that the IPLs across all the real samples did not differ enough from the IPLs generated by a background model of permuted samples (> 1 Std.Dev from the permuted sample IPLs).
| Entity | Mean | Std.Dev | Mean.of.Up.Perturbations | Number.of.Up.Perturbations | Mean.of.Down.Perturbations | Number.of.Down.Perturbations | Number.of.Total.Perturbations |
|---|---|---|---|---|---|---|---|
| HDAC1 | 0.029 | 0.006 | -10000 | 0 | -10000 | 0 | 0 |
| HDAC3 | 0.023 | 0.013 | -10000 | 0 | -10000 | 0 | 0 |
| VDR | 0.025 | 0.051 | -10000 | 0 | -0.64 | 3 | 3 |
| Cbp/p300/PCAF | 0.04 | 0.046 | -10000 | 0 | -0.76 | 1 | 1 |
| EP300 | 0.028 | 0.03 | -10000 | 0 | -0.64 | 1 | 1 |
| RARs/AIB1/Cbp/p300/PCAF/9cRA | 0.027 | 0.051 | -10000 | 0 | -0.33 | 4 | 4 |
| KAT2B | 0.02 | 0.032 | -10000 | 0 | -0.64 | 1 | 1 |
| MAPK14 | 0.029 | 0.006 | -10000 | 0 | -10000 | 0 | 0 |
| AKT1 | 0 | 0.055 | 0.22 | 1 | -10000 | 0 | 1 |
| RAR alpha/9cRA/Cyclin H | 0.05 | 0.057 | -10000 | 0 | -10000 | 0 | 0 |
| mol:9cRA | 0 | 0 | -10000 | 0 | -10000 | 0 | 0 |
| RARs/Src-1/Cbp/p300/PCAF/9cRA | 0.026 | 0.054 | -10000 | 0 | -0.44 | 1 | 1 |
| CDC2 | 0.001 | 0 | -10000 | 0 | -10000 | 0 | 0 |
| response to UV | 0.001 | 0 | -10000 | 0 | -10000 | 0 | 0 |
| RAR alpha/Jnk1 | 0.026 | 0.052 | -10000 | 0 | -0.34 | 5 | 5 |
| NCOR2 | 0.029 | 0.006 | -10000 | 0 | -10000 | 0 | 0 |
| VDR/VDR/Vit D3 | 0.019 | 0.038 | -10000 | 0 | -0.47 | 3 | 3 |
| RXRs/RARs/NRIP1/9cRA | 0.029 | 0.079 | -10000 | 0 | -0.53 | 1 | 1 |
| NCOA2 | 0.018 | 0.083 | -10000 | 0 | -0.64 | 8 | 8 |
| NCOA3 | 0.029 | 0.006 | -10000 | 0 | -10000 | 0 | 0 |
| NCOA1 | 0.029 | 0.005 | -10000 | 0 | -10000 | 0 | 0 |
| VDR/VDR/DNA | 0.025 | 0.051 | -10000 | 0 | -0.63 | 3 | 3 |
| RARG | 0.03 | 0.005 | -10000 | 0 | -10000 | 0 | 0 |
| RAR gamma1/9cRA | 0.04 | 0.007 | -10000 | 0 | -10000 | 0 | 0 |
| MAPK3 | 0.03 | 0.006 | -10000 | 0 | -10000 | 0 | 0 |
| MAPK1 | 0.03 | 0.004 | -10000 | 0 | -10000 | 0 | 0 |
| MAPK8 | 0.029 | 0.03 | -10000 | 0 | -0.63 | 1 | 1 |
| mol:Vit D3 | 0 | 0 | -10000 | 0 | -10000 | 0 | 0 |
| RXRs/VDR/DNA/Vit D3 | 0.045 | 0.07 | -10000 | 0 | -0.54 | 1 | 1 |
| RARA | 0.022 | 0.039 | -10000 | 0 | -0.26 | 2 | 2 |
| negative regulation of phosphoinositide 3-kinase cascade | 0 | 0 | -10000 | 0 | -10000 | 0 | 0 |
| RARs/TIF2/Cbp/p300/PCAF/9cRA | 0.021 | 0.077 | -10000 | 0 | -0.5 | 7 | 7 |
| PRKCA | 0.033 | 0.006 | -10000 | 0 | -10000 | 0 | 0 |
| RXRs/RARs/NRIP1/9cRA/HDAC1 | 0.003 | 0.1 | 0.36 | 1 | -0.52 | 3 | 4 |
| RXRG | 0.016 | 0.063 | -10000 | 0 | -0.45 | 2 | 2 |
| RXRA | 0.028 | 0.042 | -10000 | 0 | -10000 | 0 | 0 |
| RXRB | 0.019 | 0.063 | -10000 | 0 | -0.5 | 3 | 3 |
| VDR/Vit D3/DNA | 0.019 | 0.038 | -10000 | 0 | -0.47 | 3 | 3 |
| RBP1 | 0.024 | 0.056 | -10000 | 0 | -0.6 | 4 | 4 |
| CRBP1/9-cic-RA | 0.018 | 0.041 | -10000 | 0 | -0.44 | 4 | 4 |
| RARB | 0.021 | 0.044 | -10000 | 0 | -0.63 | 2 | 2 |
| PRKCG | 0.002 | 0.12 | -10000 | 0 | -0.59 | 21 | 21 |
| MNAT1 | 0.028 | 0.008 | -10000 | 0 | -10000 | 0 | 0 |
| RAR alpha/RXRs | 0.024 | 0.076 | -10000 | 0 | -0.52 | 2 | 2 |
| RXRs/RARs/SMRT(N-CoR2)/9cRA | 0.031 | 0.074 | 0.3 | 1 | -0.43 | 2 | 3 |
| proteasomal ubiquitin-dependent protein catabolic process | -0.007 | 0.11 | 0.27 | 10 | -0.34 | 8 | 18 |
| RXRs/RARs/NRIP1/9cRA/HDAC3 | 0.013 | 0.1 | 0.4 | 1 | -0.51 | 2 | 3 |
| positive regulation of DNA binding | 0.037 | 0.049 | -10000 | 0 | -10000 | 0 | 0 |
| NRIP1 | -0.009 | 0.12 | -10000 | 0 | -10000 | 0 | 0 |
| RXRs/RARs | -0.016 | 0.12 | -10000 | 0 | -0.48 | 4 | 4 |
| RXRs/RXRs/DNA/9cRA | 0.028 | 0.062 | -10000 | 0 | -0.48 | 2 | 2 |
| PRKACA | 0.03 | 0.002 | -10000 | 0 | -10000 | 0 | 0 |
| CDK7 | 0.027 | 0.009 | -10000 | 0 | -10000 | 0 | 0 |
| TFIIH | 0.051 | 0.023 | -10000 | 0 | -10000 | 0 | 0 |
| RAR alpha/9cRA | 0.053 | 0.054 | -10000 | 0 | -10000 | 0 | 0 |
| CCNH | 0.027 | 0.01 | -10000 | 0 | -10000 | 0 | 0 |
| CREBBP | 0.029 | 0.006 | -10000 | 0 | -10000 | 0 | 0 |
| RAR gamma2/9cRA | 0.049 | 0.025 | -10000 | 0 | -10000 | 0 | 0 |
Figure S121. Get High-res Image This plot shows pathway concept perturbations across all samples against a permutation model. The concepts along the x-axis are sorted by lowest to highest mean activity for the real patient samples. Mean inferred activities are plotted along the y-axis as a colored band showing the average level and one standard deviation range. Real samples are shown in red and permuted samples in black.
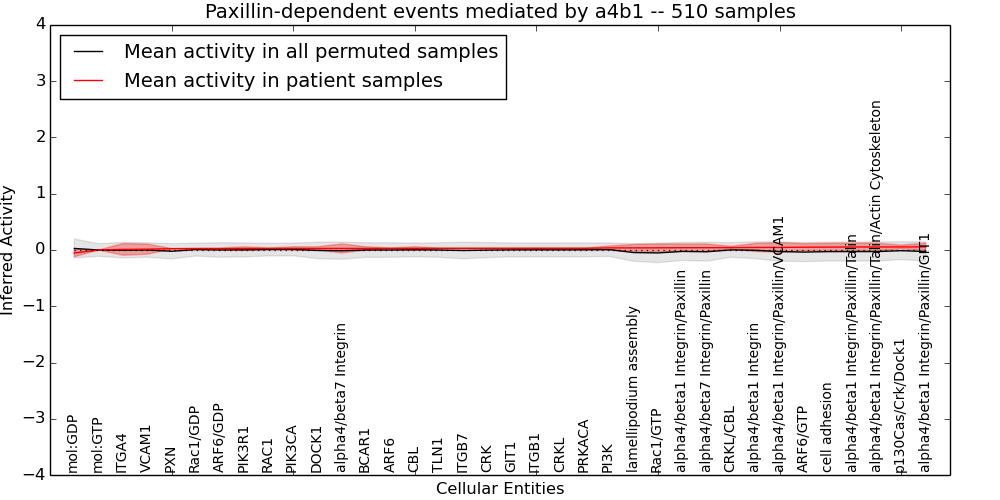
Table S121. Get Full Table This table displays mean, standard deviation, and perturbation statistics for Inferred Pathway Levels (IPLs). A mean perturbation of -9999 implies that the IPLs across all the real samples did not differ enough from the IPLs generated by a background model of permuted samples (> 1 Std.Dev from the permuted sample IPLs).
| Entity | Mean | Std.Dev | Mean.of.Up.Perturbations | Number.of.Up.Perturbations | Mean.of.Down.Perturbations | Number.of.Down.Perturbations | Number.of.Total.Perturbations |
|---|---|---|---|---|---|---|---|
| CRKL | 0.03 | 0.004 | -9999 | 0 | -10000 | 0 | 0 |
| Rac1/GDP | 0.023 | 0.012 | -9999 | 0 | -10000 | 0 | 0 |
| DOCK1 | 0.028 | 0.03 | -9999 | 0 | -0.64 | 1 | 1 |
| ITGA4 | 0.011 | 0.1 | -9999 | 0 | -0.59 | 15 | 15 |
| RAC1 | 0.027 | 0.009 | -9999 | 0 | -10000 | 0 | 0 |
| alpha4/beta7 Integrin | 0.028 | 0.081 | -9999 | 0 | -0.43 | 15 | 15 |
| mol:GTP | 0 | 0 | -9999 | 0 | -10000 | 0 | 0 |
| CRK | 0.029 | 0.005 | -9999 | 0 | -10000 | 0 | 0 |
| alpha4/beta1 Integrin | 0.045 | 0.073 | -9999 | 0 | -0.37 | 15 | 15 |
| alpha4/beta7 Integrin/Paxillin | 0.041 | 0.067 | -9999 | 0 | -10000 | 0 | 0 |
| lamellipodium assembly | 0.038 | 0.061 | -9999 | 0 | -0.49 | 4 | 4 |
| PIK3CA | 0.027 | 0.03 | -9999 | 0 | -0.64 | 1 | 1 |
| PI3K | 0.037 | 0.035 | -9999 | 0 | -0.47 | 2 | 2 |
| ARF6 | 0.028 | 0.008 | -9999 | 0 | -10000 | 0 | 0 |
| TLN1 | 0.029 | 0.006 | -9999 | 0 | -10000 | 0 | 0 |
| PXN | 0.023 | 0.005 | -9999 | 0 | -10000 | 0 | 0 |
| PIK3R1 | 0.026 | 0.031 | -9999 | 0 | -0.64 | 1 | 1 |
| ARF6/GTP | 0.05 | 0.063 | -9999 | 0 | -10000 | 0 | 0 |
| cell adhesion | 0.051 | 0.067 | -9999 | 0 | -10000 | 0 | 0 |
| CRKL/CBL | 0.043 | 0.024 | -9999 | 0 | -0.47 | 1 | 1 |
| alpha4/beta1 Integrin/Paxillin | 0.04 | 0.067 | -9999 | 0 | -10000 | 0 | 0 |
| ITGB1 | 0.03 | 0.004 | -9999 | 0 | -10000 | 0 | 0 |
| ITGB7 | 0.029 | 0.005 | -9999 | 0 | -10000 | 0 | 0 |
| ARF6/GDP | 0.024 | 0.012 | -9999 | 0 | -10000 | 0 | 0 |
| alpha4/beta1 Integrin/Paxillin/VCAM1 | 0.046 | 0.086 | -9999 | 0 | -10000 | 0 | 0 |
| p130Cas/Crk/Dock1 | 0.054 | 0.033 | -9999 | 0 | -0.4 | 2 | 2 |
| VCAM1 | 0.015 | 0.09 | -9999 | 0 | -0.53 | 13 | 13 |
| alpha4/beta1 Integrin/Paxillin/Talin | 0.053 | 0.068 | -9999 | 0 | -10000 | 0 | 0 |
| alpha4/beta1 Integrin/Paxillin/GIT1 | 0.055 | 0.067 | -9999 | 0 | -10000 | 0 | 0 |
| BCAR1 | 0.028 | 0.03 | -9999 | 0 | -0.64 | 1 | 1 |
| mol:GDP | -0.053 | 0.066 | -9999 | 0 | -10000 | 0 | 0 |
| CBL | 0.029 | 0.03 | -9999 | 0 | -0.64 | 1 | 1 |
| PRKACA | 0.03 | 0.002 | -9999 | 0 | -10000 | 0 | 0 |
| GIT1 | 0.03 | 0.005 | -9999 | 0 | -10000 | 0 | 0 |
| alpha4/beta1 Integrin/Paxillin/Talin/Actin Cytoskeleton | 0.053 | 0.068 | -9999 | 0 | -10000 | 0 | 0 |
| Rac1/GTP | 0.039 | 0.069 | -9999 | 0 | -0.56 | 4 | 4 |
Figure S122. Get High-res Image This plot shows pathway concept perturbations across all samples against a permutation model. The concepts along the x-axis are sorted by lowest to highest mean activity for the real patient samples. Mean inferred activities are plotted along the y-axis as a colored band showing the average level and one standard deviation range. Real samples are shown in red and permuted samples in black.
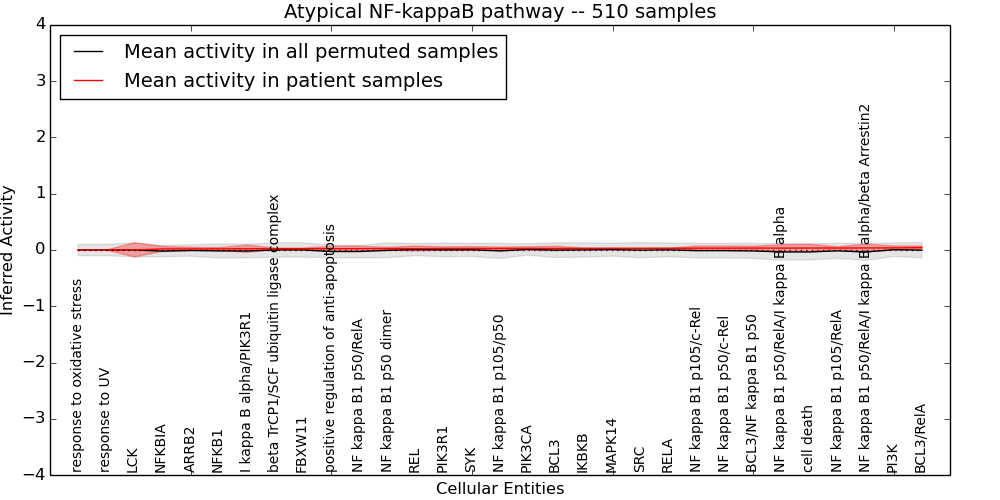
Table S122. Get Full Table This table displays mean, standard deviation, and perturbation statistics for Inferred Pathway Levels (IPLs). A mean perturbation of -9999 implies that the IPLs across all the real samples did not differ enough from the IPLs generated by a background model of permuted samples (> 1 Std.Dev from the permuted sample IPLs).
| Entity | Mean | Std.Dev | Mean.of.Up.Perturbations | Number.of.Up.Perturbations | Mean.of.Down.Perturbations | Number.of.Down.Perturbations | Number.of.Total.Perturbations |
|---|---|---|---|---|---|---|---|
| BCL3/RelA | 0.042 | 0.03 | -10000 | 0 | -0.43 | 2 | 2 |
| FBXW11 | 0.023 | 0.013 | -10000 | 0 | -10000 | 0 | 0 |
| NF kappa B1 p50/c-Rel | 0.033 | 0.037 | -10000 | 0 | -0.41 | 3 | 3 |
| NF kappa B1 p50/RelA/I kappa B alpha | 0.034 | 0.062 | -10000 | 0 | -10000 | 0 | 0 |
| NFKBIA | 0.019 | 0.044 | -10000 | 0 | -0.29 | 3 | 3 |
| MAPK14 | 0.029 | 0.006 | -10000 | 0 | -10000 | 0 | 0 |
| NF kappa B1 p105/p50 | 0.027 | 0.026 | -10000 | 0 | -0.4 | 1 | 1 |
| ARRB2 | 0.019 | 0.029 | -10000 | 0 | -0.62 | 1 | 1 |
| REL | 0.026 | 0.045 | -10000 | 0 | -0.53 | 3 | 3 |
| response to oxidative stress | 0 | 0 | -10000 | 0 | -10000 | 0 | 0 |
| BCL3/NF kappa B1 p50 | 0.034 | 0.033 | -10000 | 0 | -0.37 | 3 | 3 |
| response to UV | 0 | 0 | -10000 | 0 | -10000 | 0 | 0 |
| NF kappa B1 p105/RelA | 0.035 | 0.023 | -10000 | 0 | -0.4 | 1 | 1 |
| PIK3CA | 0.027 | 0.03 | -10000 | 0 | -0.64 | 1 | 1 |
| NF kappa B1 p50 dimer | 0.025 | 0.023 | -10000 | 0 | -0.47 | 1 | 1 |
| PIK3R1 | 0.026 | 0.031 | -10000 | 0 | -0.64 | 1 | 1 |
| NFKB1 | 0.02 | 0.023 | -10000 | 0 | -0.47 | 1 | 1 |
| RELA | 0.03 | 0.003 | -10000 | 0 | -10000 | 0 | 0 |
| positive regulation of anti-apoptosis | 0.023 | 0.042 | -10000 | 0 | -0.28 | 2 | 2 |
| NF kappa B1 p50/RelA/I kappa B alpha/beta Arrestin2 | 0.036 | 0.069 | -10000 | 0 | -0.5 | 1 | 1 |
| SRC | 0.029 | 0.006 | -10000 | 0 | -10000 | 0 | 0 |
| PI3K | 0.037 | 0.035 | -10000 | 0 | -0.47 | 2 | 2 |
| NF kappa B1 p50/RelA | 0.023 | 0.043 | -10000 | 0 | -0.29 | 2 | 2 |
| IKBKB | 0.028 | 0.008 | -10000 | 0 | -10000 | 0 | 0 |
| beta TrCP1/SCF ubiquitin ligase complex | 0.023 | 0.013 | -10000 | 0 | -10000 | 0 | 0 |
| SYK | 0.027 | 0.034 | -10000 | 0 | -0.48 | 2 | 2 |
| I kappa B alpha/PIK3R1 | 0.022 | 0.065 | 0.28 | 1 | -0.36 | 3 | 4 |
| cell death | 0.035 | 0.066 | -10000 | 0 | -0.47 | 1 | 1 |
| NF kappa B1 p105/c-Rel | 0.033 | 0.037 | -10000 | 0 | -0.41 | 3 | 3 |
| LCK | 0.002 | 0.13 | -10000 | 0 | -0.59 | 22 | 22 |
| BCL3 | 0.027 | 0.039 | -10000 | 0 | -0.59 | 2 | 2 |
Figure S123. Get High-res Image This plot shows pathway concept perturbations across all samples against a permutation model. The concepts along the x-axis are sorted by lowest to highest mean activity for the real patient samples. Mean inferred activities are plotted along the y-axis as a colored band showing the average level and one standard deviation range. Real samples are shown in red and permuted samples in black.
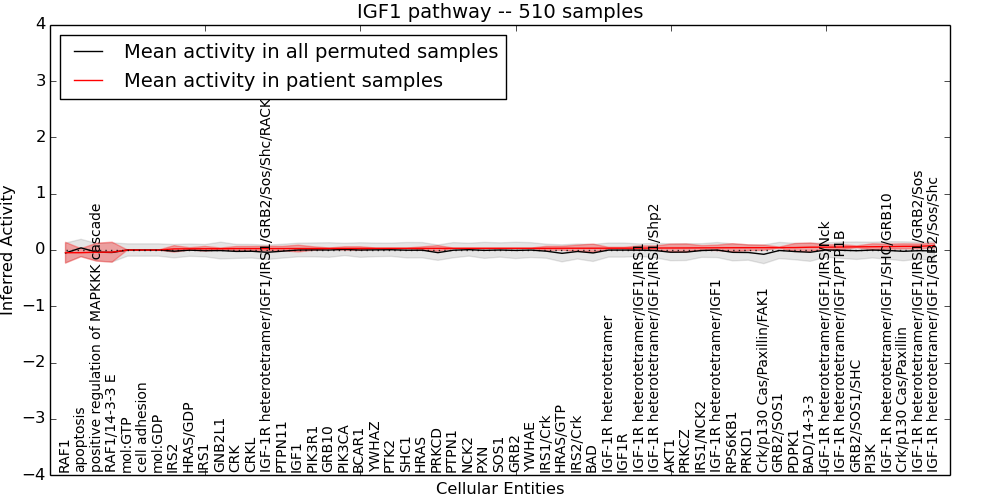
Table S123. Get Full Table This table displays mean, standard deviation, and perturbation statistics for Inferred Pathway Levels (IPLs). A mean perturbation of -9999 implies that the IPLs across all the real samples did not differ enough from the IPLs generated by a background model of permuted samples (> 1 Std.Dev from the permuted sample IPLs).
| Entity | Mean | Std.Dev | Mean.of.Up.Perturbations | Number.of.Up.Perturbations | Mean.of.Down.Perturbations | Number.of.Down.Perturbations | Number.of.Total.Perturbations |
|---|---|---|---|---|---|---|---|
| NCK2 | 0.029 | 0.006 | -10000 | 0 | -10000 | 0 | 0 |
| PTK2 | 0.029 | 0.007 | -10000 | 0 | -10000 | 0 | 0 |
| CRKL | 0.025 | 0.038 | -10000 | 0 | -10000 | 0 | 0 |
| GRB2/SOS1/SHC | 0.056 | 0.017 | -10000 | 0 | -10000 | 0 | 0 |
| HRAS | 0.029 | 0.027 | -10000 | 0 | -0.59 | 1 | 1 |
| IRS1/Crk | 0.03 | 0.036 | -10000 | 0 | -10000 | 0 | 0 |
| IGF-1R heterotetramer/IGF1/PTP1B | 0.052 | 0.042 | -10000 | 0 | -0.32 | 2 | 2 |
| AKT1 | 0.036 | 0.068 | 0.31 | 6 | -0.61 | 1 | 7 |
| BAD | 0.032 | 0.073 | 0.3 | 6 | -0.82 | 1 | 7 |
| mol:GTP | 0 | 0 | -10000 | 0 | -10000 | 0 | 0 |
| CRK | 0.025 | 0.038 | -10000 | 0 | -10000 | 0 | 0 |
| IGF-1R heterotetramer/IGF1/IRS1/Shp2 | 0.035 | 0.038 | -10000 | 0 | -10000 | 0 | 0 |
| RAF1 | -0.048 | 0.18 | 0.32 | 4 | -0.52 | 5 | 9 |
| IGF-1R heterotetramer/IGF1/IRS1/GRB2/Sos | 0.065 | 0.042 | -10000 | 0 | -10000 | 0 | 0 |
| YWHAZ | 0.029 | 0.007 | -10000 | 0 | -10000 | 0 | 0 |
| IGF-1R heterotetramer/IGF1/IRS1 | 0.033 | 0.04 | -10000 | 0 | -0.27 | 6 | 6 |
| PIK3CA | 0.027 | 0.03 | -10000 | 0 | -0.64 | 1 | 1 |
| RPS6KB1 | 0.04 | 0.072 | 0.32 | 7 | -0.61 | 1 | 8 |
| GNB2L1 | 0.023 | 0.013 | -10000 | 0 | -10000 | 0 | 0 |
| positive regulation of MAPKKK cascade | -0.039 | 0.16 | 0.32 | 9 | -0.44 | 4 | 13 |
| PXN | 0.029 | 0.006 | -10000 | 0 | -10000 | 0 | 0 |
| PIK3R1 | 0.026 | 0.031 | -10000 | 0 | -0.64 | 1 | 1 |
| cell adhesion | 0 | 0 | -10000 | 0 | -10000 | 0 | 0 |
| GRB2/SOS1 | 0.043 | 0.01 | -10000 | 0 | -10000 | 0 | 0 |
| HRAS/GTP | 0.031 | 0.034 | -10000 | 0 | -10000 | 0 | 0 |
| IGF-1R heterotetramer/IGF1/GRB2/Sos/Shc | 0.079 | 0.041 | -10000 | 0 | -10000 | 0 | 0 |
| IGF-1R heterotetramer | 0.032 | 0.016 | -10000 | 0 | -10000 | 0 | 0 |
| IGF-1R heterotetramer/IGF1/IRS/Nck | 0.05 | 0.041 | -10000 | 0 | -10000 | 0 | 0 |
| Crk/p130 Cas/Paxillin | 0.064 | 0.046 | -10000 | 0 | -10000 | 0 | 0 |
| IGF1R | 0.032 | 0.016 | -10000 | 0 | -10000 | 0 | 0 |
| IGF1 | 0.026 | 0.06 | -10000 | 0 | -0.56 | 5 | 5 |
| IRS2/Crk | 0.031 | 0.055 | -10000 | 0 | -0.32 | 5 | 5 |
| PI3K | 0.058 | 0.052 | -10000 | 0 | -0.31 | 2 | 2 |
| apoptosis | -0.048 | 0.072 | 0.66 | 1 | -0.3 | 12 | 13 |
| HRAS/GDP | 0.021 | 0.02 | -10000 | 0 | -0.43 | 1 | 1 |
| PRKCD | 0.029 | 0.05 | -10000 | 0 | -0.44 | 3 | 3 |
| RAF1/14-3-3 E | -0.039 | 0.18 | 0.34 | 5 | -0.46 | 4 | 9 |
| BAD/14-3-3 | 0.05 | 0.076 | 0.32 | 9 | -0.73 | 1 | 10 |
| PRKCZ | 0.036 | 0.071 | 0.32 | 5 | -0.61 | 1 | 6 |
| Crk/p130 Cas/Paxillin/FAK1 | 0.041 | 0.046 | -10000 | 0 | -0.51 | 1 | 1 |
| PTPN1 | 0.029 | 0.006 | -10000 | 0 | -10000 | 0 | 0 |
| IGF-1R heterotetramer/IGF1/IRS1/GRB2/Sos/Shc/RACK1 | 0.025 | 0.04 | -10000 | 0 | -0.36 | 3 | 3 |
| BCAR1 | 0.028 | 0.03 | -10000 | 0 | -0.64 | 1 | 1 |
| IGF-1R heterotetramer/IGF1/SHC/GRB10 | 0.061 | 0.044 | -10000 | 0 | -10000 | 0 | 0 |
| mol:GDP | 0 | 0 | -10000 | 0 | -10000 | 0 | 0 |
| SOS1 | 0.029 | 0.005 | -10000 | 0 | -10000 | 0 | 0 |
| IRS1/NCK2 | 0.038 | 0.04 | -10000 | 0 | -10000 | 0 | 0 |
| GRB10 | 0.027 | 0.009 | -10000 | 0 | -10000 | 0 | 0 |
| PTPN11 | 0.026 | 0.039 | -10000 | 0 | -10000 | 0 | 0 |
| IRS1 | 0.022 | 0.041 | 0.21 | 1 | -0.27 | 6 | 7 |
| IRS2 | 0.02 | 0.057 | -10000 | 0 | -0.33 | 7 | 7 |
| IGF-1R heterotetramer/IGF1 | 0.039 | 0.049 | -10000 | 0 | -0.4 | 5 | 5 |
| GRB2 | 0.029 | 0.005 | -10000 | 0 | -10000 | 0 | 0 |
| PDPK1 | 0.043 | 0.071 | 0.32 | 7 | -0.64 | 1 | 8 |
| YWHAE | 0.029 | 0.005 | -10000 | 0 | -10000 | 0 | 0 |
| PRKD1 | 0.041 | 0.051 | -10000 | 0 | -0.36 | 4 | 4 |
| SHC1 | 0.029 | 0.007 | -10000 | 0 | -10000 | 0 | 0 |
Figure S124. Get High-res Image This plot shows pathway concept perturbations across all samples against a permutation model. The concepts along the x-axis are sorted by lowest to highest mean activity for the real patient samples. Mean inferred activities are plotted along the y-axis as a colored band showing the average level and one standard deviation range. Real samples are shown in red and permuted samples in black.
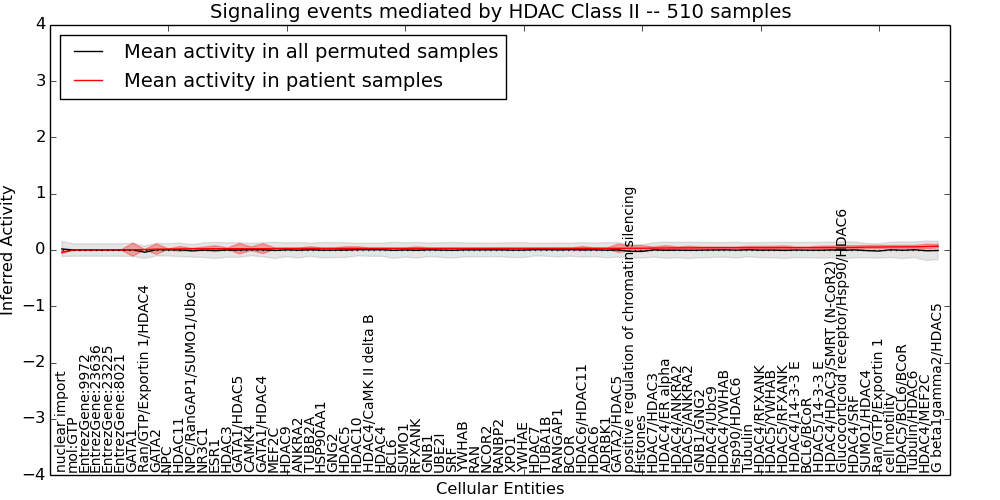
Table S124. Get Full Table This table displays mean, standard deviation, and perturbation statistics for Inferred Pathway Levels (IPLs). A mean perturbation of -9999 implies that the IPLs across all the real samples did not differ enough from the IPLs generated by a background model of permuted samples (> 1 Std.Dev from the permuted sample IPLs).
| Entity | Mean | Std.Dev | Mean.of.Up.Perturbations | Number.of.Up.Perturbations | Mean.of.Down.Perturbations | Number.of.Down.Perturbations | Number.of.Total.Perturbations |
|---|---|---|---|---|---|---|---|
| G beta1gamma2/HDAC5 | 0.068 | 0.032 | -10000 | 0 | -0.37 | 1 | 1 |
| HDAC3 | 0.023 | 0.013 | -10000 | 0 | -10000 | 0 | 0 |
| Ran/GTP/Exportin 1/HDAC4 | 0.008 | 0.003 | -10000 | 0 | -10000 | 0 | 0 |
| GATA1/HDAC4 | 0.024 | 0.088 | -10000 | 0 | -0.43 | 18 | 18 |
| GATA1/HDAC5 | 0.023 | 0.093 | -10000 | 0 | -0.43 | 20 | 20 |
| GATA2/HDAC5 | 0.03 | 0.074 | -10000 | 0 | -0.45 | 11 | 11 |
| HDAC5/BCL6/BCoR | 0.056 | 0.026 | -10000 | 0 | -0.4 | 1 | 1 |
| HDAC9 | 0.027 | 0.009 | -10000 | 0 | -10000 | 0 | 0 |
| Glucocorticoid receptor/Hsp90/HDAC6 | 0.044 | 0.033 | -10000 | 0 | -0.37 | 1 | 1 |
| HDAC4/ANKRA2 | 0.038 | 0.016 | -10000 | 0 | -10000 | 0 | 0 |
| HDAC5/YWHAB | 0.041 | 0.025 | -10000 | 0 | -0.47 | 1 | 1 |
| NPC/RanGAP1/SUMO1/Ubc9 | 0.022 | 0.008 | -10000 | 0 | -10000 | 0 | 0 |
| GATA2 | 0.015 | 0.093 | -10000 | 0 | -0.61 | 11 | 11 |
| HDAC4/RFXANK | 0.041 | 0.024 | -10000 | 0 | -0.43 | 1 | 1 |
| BCOR | 0.03 | 0.004 | -10000 | 0 | -10000 | 0 | 0 |
| mol:GTP | 0 | 0 | -10000 | 0 | -10000 | 0 | 0 |
| HDAC10 | 0.028 | 0.03 | -10000 | 0 | -0.64 | 1 | 1 |
| HDAC5 | 0.028 | 0.03 | -10000 | 0 | -0.64 | 1 | 1 |
| GNB1/GNG2 | 0.04 | 0.014 | -10000 | 0 | -10000 | 0 | 0 |
| Histones | 0.031 | 0.047 | -10000 | 0 | -0.72 | 1 | 1 |
| ADRBK1 | 0.03 | 0.003 | -10000 | 0 | -10000 | 0 | 0 |
| HDAC4 | 0.029 | 0.007 | -10000 | 0 | -10000 | 0 | 0 |
| XPO1 | 0.029 | 0.005 | -10000 | 0 | -10000 | 0 | 0 |
| HDAC5/ANKRA2 | 0.039 | 0.027 | -10000 | 0 | -0.47 | 1 | 1 |
| HDAC4/Ubc9 | 0.041 | 0.013 | -10000 | 0 | -10000 | 0 | 0 |
| HDAC7 | 0.029 | 0.005 | -10000 | 0 | -10000 | 0 | 0 |
| HDAC5/14-3-3 E | 0.042 | 0.024 | -10000 | 0 | -0.47 | 1 | 1 |
| TUBA1B | 0.029 | 0.005 | -10000 | 0 | -10000 | 0 | 0 |
| HDAC6 | 0.03 | 0.003 | -10000 | 0 | -10000 | 0 | 0 |
| HDAC5/RFXANK | 0.042 | 0.032 | -10000 | 0 | -0.45 | 2 | 2 |
| CAMK4 | 0.023 | 0.031 | -10000 | 0 | -0.64 | 1 | 1 |
| Tubulin/HDAC6 | 0.056 | 0.026 | -10000 | 0 | -0.4 | 1 | 1 |
| SUMO1 | 0.029 | 0.007 | -10000 | 0 | -10000 | 0 | 0 |
| EntrezGene:9972 | 0 | 0 | -10000 | 0 | -10000 | 0 | 0 |
| YWHAB | 0.029 | 0.006 | -10000 | 0 | -10000 | 0 | 0 |
| GATA1 | 0.005 | 0.12 | -10000 | 0 | -0.59 | 19 | 19 |
| EntrezGene:8021 | 0 | 0 | -10000 | 0 | -10000 | 0 | 0 |
| YWHAE | 0.029 | 0.005 | -10000 | 0 | -10000 | 0 | 0 |
| NR3C1 | 0.022 | 0.03 | -10000 | 0 | -0.59 | 1 | 1 |
| SUMO1/HDAC4 | 0.052 | 0.028 | -10000 | 0 | -10000 | 0 | 0 |
| SRF | 0.029 | 0.006 | -10000 | 0 | -10000 | 0 | 0 |
| HDAC4/YWHAB | 0.041 | 0.013 | -10000 | 0 | -10000 | 0 | 0 |
| Tubulin | 0.041 | 0.025 | -10000 | 0 | -0.47 | 1 | 1 |
| HDAC4/14-3-3 E | 0.042 | 0.012 | -10000 | 0 | -10000 | 0 | 0 |
| GNB1 | 0.029 | 0.006 | -10000 | 0 | -10000 | 0 | 0 |
| RANGAP1 | 0.03 | 0.004 | -10000 | 0 | -10000 | 0 | 0 |
| BCL6/BCoR | 0.042 | 0.011 | -10000 | 0 | -10000 | 0 | 0 |
| HDAC4/HDAC3/SMRT (N-CoR2) | 0.044 | 0.028 | -10000 | 0 | -10000 | 0 | 0 |
| HDAC4/SRF | 0.045 | 0.033 | -10000 | 0 | -0.4 | 1 | 1 |
| HDAC4/ER alpha | 0.036 | 0.042 | -10000 | 0 | -0.46 | 3 | 3 |
| EntrezGene:23225 | 0 | 0 | -10000 | 0 | -10000 | 0 | 0 |
| positive regulation of chromatin silencing | 0.031 | 0.046 | -10000 | 0 | -0.72 | 1 | 1 |
| cell motility | 0.055 | 0.026 | -10000 | 0 | -0.4 | 1 | 1 |
| EntrezGene:23636 | 0 | 0 | -10000 | 0 | -10000 | 0 | 0 |
| UBE2I | 0.029 | 0.006 | -10000 | 0 | -10000 | 0 | 0 |
| HDAC7/HDAC3 | 0.034 | 0.019 | -10000 | 0 | -10000 | 0 | 0 |
| BCL6 | 0.029 | 0.007 | -10000 | 0 | -10000 | 0 | 0 |
| HDAC4/CaMK II delta B | 0.028 | 0.007 | -10000 | 0 | -10000 | 0 | 0 |
| Hsp90/HDAC6 | 0.041 | 0.013 | -10000 | 0 | -10000 | 0 | 0 |
| ESR1 | 0.023 | 0.052 | -10000 | 0 | -0.55 | 4 | 4 |
| HDAC6/HDAC11 | 0.03 | 0.033 | -10000 | 0 | -0.36 | 2 | 2 |
| Ran/GTP/Exportin 1 | 0.052 | 0.029 | -10000 | 0 | -10000 | 0 | 0 |
| NPC | 0.017 | 0.003 | -10000 | 0 | -10000 | 0 | 0 |
| MEF2C | 0.027 | 0.01 | -10000 | 0 | -10000 | 0 | 0 |
| RAN | 0.029 | 0.006 | -10000 | 0 | -10000 | 0 | 0 |
| HDAC4/MEF2C | 0.063 | 0.042 | -10000 | 0 | -10000 | 0 | 0 |
| GNG2 | 0.028 | 0.008 | -10000 | 0 | -10000 | 0 | 0 |
| NCOR2 | 0.029 | 0.006 | -10000 | 0 | -10000 | 0 | 0 |
| TUBB2A | 0.028 | 0.03 | -10000 | 0 | -0.64 | 1 | 1 |
| HDAC11 | 0.019 | 0.043 | -10000 | 0 | -0.64 | 2 | 2 |
| HSP90AA1 | 0.028 | 0.008 | -10000 | 0 | -10000 | 0 | 0 |
| RANBP2 | 0.029 | 0.005 | -10000 | 0 | -10000 | 0 | 0 |
| ANKRA2 | 0.027 | 0.009 | -10000 | 0 | -10000 | 0 | 0 |
| RFXANK | 0.029 | 0.027 | -10000 | 0 | -0.59 | 1 | 1 |
| nuclear import | -0.041 | 0.022 | 0.35 | 1 | -10000 | 0 | 1 |
Figure S125. Get High-res Image This plot shows pathway concept perturbations across all samples against a permutation model. The concepts along the x-axis are sorted by lowest to highest mean activity for the real patient samples. Mean inferred activities are plotted along the y-axis as a colored band showing the average level and one standard deviation range. Real samples are shown in red and permuted samples in black.
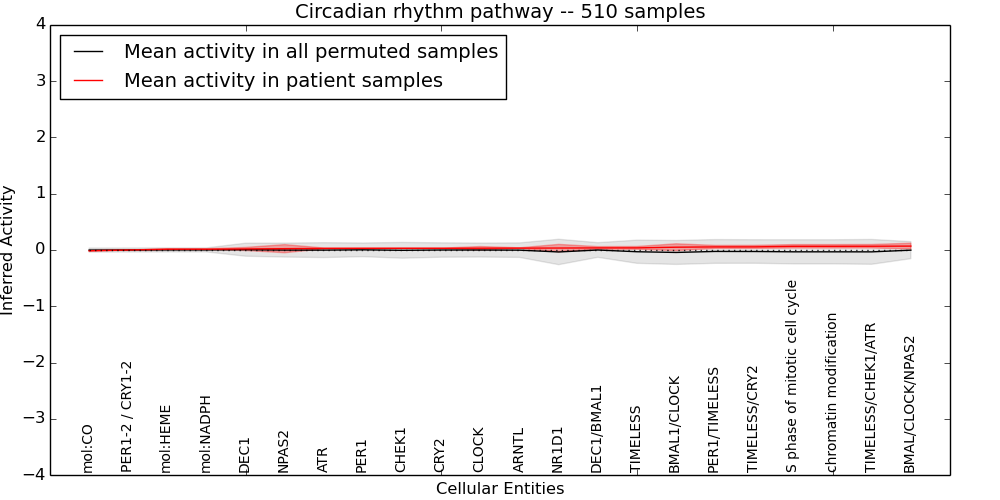
Table S125. Get Full Table This table displays mean, standard deviation, and perturbation statistics for Inferred Pathway Levels (IPLs). A mean perturbation of -9999 implies that the IPLs across all the real samples did not differ enough from the IPLs generated by a background model of permuted samples (> 1 Std.Dev from the permuted sample IPLs).
| Entity | Mean | Std.Dev | Mean.of.Up.Perturbations | Number.of.Up.Perturbations | Mean.of.Down.Perturbations | Number.of.Down.Perturbations | Number.of.Total.Perturbations |
|---|---|---|---|---|---|---|---|
| chromatin modification | 0.066 | 0.031 | -10000 | 0 | -10000 | 0 | 0 |
| CLOCK | 0.032 | 0.03 | -10000 | 0 | -0.63 | 1 | 1 |
| TIMELESS/CRY2 | 0.056 | 0.027 | -10000 | 0 | -10000 | 0 | 0 |
| DEC1/BMAL1 | 0.037 | 0.023 | -10000 | 0 | -0.43 | 1 | 1 |
| ATR | 0.028 | 0.007 | -10000 | 0 | -10000 | 0 | 0 |
| NR1D1 | 0.035 | 0.065 | -10000 | 0 | -1.2 | 1 | 1 |
| ARNTL | 0.033 | 0.006 | -10000 | 0 | -10000 | 0 | 0 |
| TIMELESS | 0.038 | 0.025 | -10000 | 0 | -10000 | 0 | 0 |
| NPAS2 | 0.024 | 0.072 | -10000 | 0 | -0.49 | 9 | 9 |
| CRY2 | 0.03 | 0.003 | -10000 | 0 | -10000 | 0 | 0 |
| mol:CO | -0.014 | 0.008 | 0.11 | 2 | -10000 | 0 | 2 |
| CHEK1 | 0.03 | 0.003 | -10000 | 0 | -10000 | 0 | 0 |
| mol:HEME | 0.014 | 0.008 | -10000 | 0 | -0.11 | 2 | 2 |
| PER1 | 0.029 | 0.005 | -10000 | 0 | -10000 | 0 | 0 |
| BMAL/CLOCK/NPAS2 | 0.069 | 0.052 | -10000 | 0 | -0.39 | 4 | 4 |
| BMAL1/CLOCK | 0.05 | 0.061 | -10000 | 0 | -0.8 | 1 | 1 |
| S phase of mitotic cell cycle | 0.066 | 0.031 | -10000 | 0 | -10000 | 0 | 0 |
| TIMELESS/CHEK1/ATR | 0.067 | 0.031 | -10000 | 0 | -10000 | 0 | 0 |
| mol:NADPH | 0.014 | 0.008 | -10000 | 0 | -0.11 | 2 | 2 |
| PER1/TIMELESS | 0.055 | 0.026 | -10000 | 0 | -10000 | 0 | 0 |
| PER1-2 / CRY1-2 | 0 | 0 | -10000 | 0 | -10000 | 0 | 0 |
| DEC1 | 0.018 | 0.028 | -10000 | 0 | -0.59 | 1 | 1 |
Figure S126. Get High-res Image This plot shows pathway concept perturbations across all samples against a permutation model. The concepts along the x-axis are sorted by lowest to highest mean activity for the real patient samples. Mean inferred activities are plotted along the y-axis as a colored band showing the average level and one standard deviation range. Real samples are shown in red and permuted samples in black.
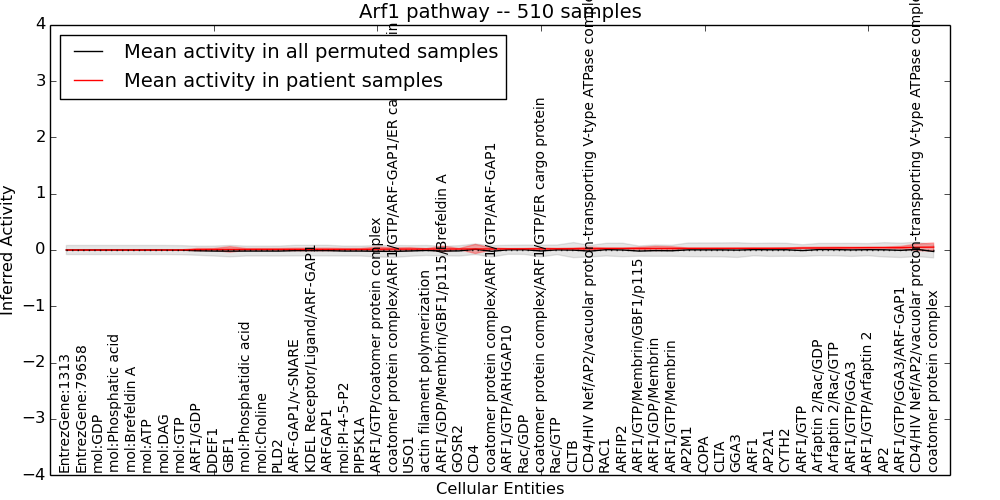
Table S126. Get Full Table This table displays mean, standard deviation, and perturbation statistics for Inferred Pathway Levels (IPLs). A mean perturbation of -9999 implies that the IPLs across all the real samples did not differ enough from the IPLs generated by a background model of permuted samples (> 1 Std.Dev from the permuted sample IPLs).
| Entity | Mean | Std.Dev | Mean.of.Up.Perturbations | Number.of.Up.Perturbations | Mean.of.Down.Perturbations | Number.of.Down.Perturbations | Number.of.Total.Perturbations |
|---|---|---|---|---|---|---|---|
| coatomer protein complex | 0.051 | 0.074 | 0.31 | 8 | -0.45 | 1 | 9 |
| EntrezGene:79658 | 0 | 0 | -10000 | 0 | -10000 | 0 | 0 |
| ARF1/GDP/Membrin/GBF1/p115/Brefeldin A | 0.018 | 0.051 | -10000 | 0 | -0.36 | 5 | 5 |
| AP2 | 0.042 | 0.011 | -10000 | 0 | -10000 | 0 | 0 |
| mol:DAG | 0 | 0 | -10000 | 0 | -10000 | 0 | 0 |
| Arfaptin 2/Rac/GTP | 0.038 | 0.014 | -10000 | 0 | -10000 | 0 | 0 |
| CLTB | 0.023 | 0.013 | -10000 | 0 | -10000 | 0 | 0 |
| coatomer protein complex/ARF1/GTP/ER cargo protein | 0.021 | 0.015 | -10000 | 0 | -10000 | 0 | 0 |
| CD4 | 0.018 | 0.081 | -10000 | 0 | -0.59 | 9 | 9 |
| CLTA | 0.029 | 0.006 | -10000 | 0 | -10000 | 0 | 0 |
| mol:GTP | 0.001 | 0.001 | -10000 | 0 | -10000 | 0 | 0 |
| ARFGAP1 | 0.011 | 0.022 | -10000 | 0 | -0.48 | 1 | 1 |
| mol:PI-4-5-P2 | 0.011 | 0.016 | -10000 | 0 | -0.35 | 1 | 1 |
| ARF1/GTP | 0.035 | 0.014 | -10000 | 0 | -10000 | 0 | 0 |
| coatomer protein complex/ARF1/GTP/ARF-GAP1/ER cargo protein | 0.016 | 0.022 | -10000 | 0 | -0.4 | 1 | 1 |
| mol:Choline | 0.011 | 0.016 | -10000 | 0 | -0.34 | 1 | 1 |
| mol:GDP | 0 | 0 | -10000 | 0 | -10000 | 0 | 0 |
| ARF1 | 0.03 | 0.007 | -10000 | 0 | -10000 | 0 | 0 |
| DDEF1 | 0.01 | 0.016 | -10000 | 0 | -0.35 | 1 | 1 |
| ARF1/GDP | 0.007 | 0.021 | -10000 | 0 | -0.38 | 1 | 1 |
| AP2M1 | 0.029 | 0.007 | -10000 | 0 | -10000 | 0 | 0 |
| EntrezGene:1313 | 0 | 0 | -10000 | 0 | -10000 | 0 | 0 |
| actin filament polymerization | 0.017 | 0.007 | -10000 | 0 | -10000 | 0 | 0 |
| Rac/GTP | 0.021 | 0.008 | -10000 | 0 | -10000 | 0 | 0 |
| ARF1/GTP/GGA3/ARF-GAP1 | 0.042 | 0.022 | -10000 | 0 | -0.35 | 1 | 1 |
| ARFIP2 | 0.027 | 0.008 | -10000 | 0 | -10000 | 0 | 0 |
| COPA | 0.029 | 0.007 | -10000 | 0 | -10000 | 0 | 0 |
| RAC1 | 0.027 | 0.009 | -10000 | 0 | -10000 | 0 | 0 |
| ARF1/GTP/coatomer protein complex | 0.014 | 0.037 | -10000 | 0 | -0.29 | 4 | 4 |
| ARF1/GTP/ARHGAP10 | 0.02 | 0.005 | -10000 | 0 | -10000 | 0 | 0 |
| GGA3 | 0.029 | 0.005 | -10000 | 0 | -10000 | 0 | 0 |
| ARF1/GTP/Membrin | 0.028 | 0.03 | -10000 | 0 | -0.23 | 6 | 6 |
| AP2A1 | 0.03 | 0.003 | -10000 | 0 | -10000 | 0 | 0 |
| coatomer protein complex/ARF1/GTP/ARF-GAP1 | 0.02 | 0.017 | -10000 | 0 | -10000 | 0 | 0 |
| ARF1/GDP/Membrin | 0.028 | 0.037 | -10000 | 0 | -0.3 | 6 | 6 |
| Arfaptin 2/Rac/GDP | 0.036 | 0.013 | -10000 | 0 | -10000 | 0 | 0 |
| CYTH2 | 0.031 | 0.005 | -10000 | 0 | -10000 | 0 | 0 |
| ARF1/GTP/GGA3 | 0.039 | 0.011 | -10000 | 0 | -10000 | 0 | 0 |
| mol:ATP | 0 | 0 | -10000 | 0 | -10000 | 0 | 0 |
| Rac/GDP | 0.02 | 0.007 | -10000 | 0 | -10000 | 0 | 0 |
| mol:Brefeldin A | 0 | 0 | -10000 | 0 | -10000 | 0 | 0 |
| CD4/HIV Nef/AP2/vacuolar proton-transporting V-type ATPase complex/Coatomer protein complex/ARF1/GTP | 0.023 | 0.028 | -10000 | 0 | -10000 | 0 | 0 |
| PLD2 | 0.011 | 0.016 | -10000 | 0 | -0.34 | 1 | 1 |
| ARF-GAP1/v-SNARE | 0.011 | 0.022 | -10000 | 0 | -0.47 | 1 | 1 |
| PIP5K1A | 0.011 | 0.016 | -10000 | 0 | -0.35 | 1 | 1 |
| ARF1/GTP/Membrin/GBF1/p115 | 0.027 | 0.02 | -10000 | 0 | -10000 | 0 | 0 |
| mol:Phosphatic acid | 0 | 0 | -10000 | 0 | -10000 | 0 | 0 |
| mol:Phosphatidic acid | 0.011 | 0.016 | -10000 | 0 | -0.34 | 1 | 1 |
| KDEL Receptor/Ligand/ARF-GAP1 | 0.011 | 0.022 | -10000 | 0 | -0.47 | 1 | 1 |
| GOSR2 | 0.018 | 0.009 | -10000 | 0 | -10000 | 0 | 0 |
| USO1 | 0.016 | 0.026 | -10000 | 0 | -0.3 | 3 | 3 |
| GBF1 | 0.01 | 0.049 | -10000 | 0 | -0.3 | 12 | 12 |
| ARF1/GTP/Arfaptin 2 | 0.042 | 0.011 | -10000 | 0 | -10000 | 0 | 0 |
| CD4/HIV Nef/AP2/vacuolar proton-transporting V-type ATPase complex | 0.049 | 0.058 | -10000 | 0 | -0.37 | 9 | 9 |
Figure S127. Get High-res Image This plot shows pathway concept perturbations across all samples against a permutation model. The concepts along the x-axis are sorted by lowest to highest mean activity for the real patient samples. Mean inferred activities are plotted along the y-axis as a colored band showing the average level and one standard deviation range. Real samples are shown in red and permuted samples in black.
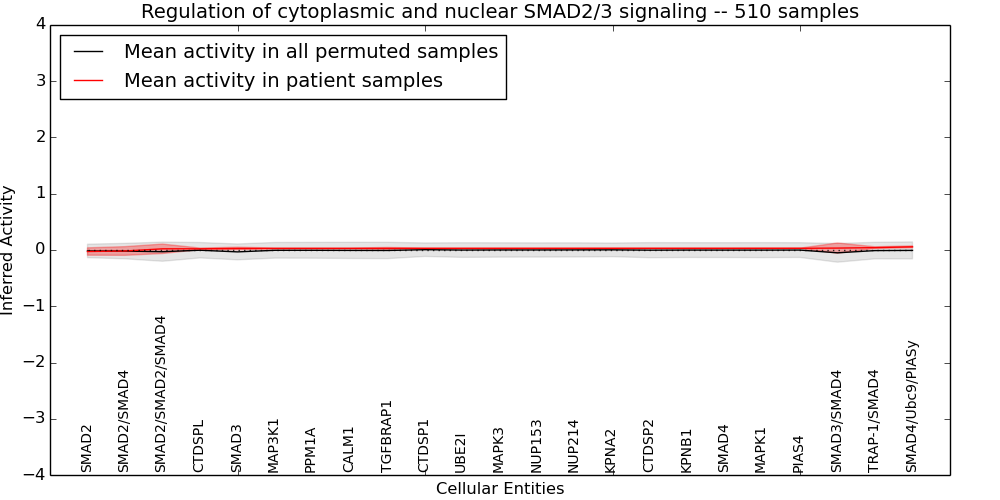
Table S127. Get Full Table This table displays mean, standard deviation, and perturbation statistics for Inferred Pathway Levels (IPLs). A mean perturbation of -9999 implies that the IPLs across all the real samples did not differ enough from the IPLs generated by a background model of permuted samples (> 1 Std.Dev from the permuted sample IPLs).
| Entity | Mean | Std.Dev | Mean.of.Up.Perturbations | Number.of.Up.Perturbations | Mean.of.Down.Perturbations | Number.of.Down.Perturbations | Number.of.Total.Perturbations |
|---|---|---|---|---|---|---|---|
| SMAD4 | 0.029 | 0.005 | -10000 | 0 | -10000 | 0 | 0 |
| SMAD2 | -0.027 | 0.066 | 0.23 | 1 | -10000 | 0 | 1 |
| SMAD3 | 0.027 | 0.023 | -10000 | 0 | -10000 | 0 | 0 |
| SMAD3/SMAD4 | 0.034 | 0.091 | -10000 | 0 | -0.49 | 9 | 9 |
| SMAD4/Ubc9/PIASy | 0.057 | 0.017 | -10000 | 0 | -10000 | 0 | 0 |
| SMAD2/SMAD2/SMAD4 | 0.021 | 0.084 | -10000 | 0 | -0.4 | 1 | 1 |
| PPM1A | 0.028 | 0.008 | -10000 | 0 | -10000 | 0 | 0 |
| CALM1 | 0.028 | 0.008 | -10000 | 0 | -10000 | 0 | 0 |
| SMAD2/SMAD4 | -0.018 | 0.077 | -10000 | 0 | -0.37 | 3 | 3 |
| MAP3K1 | 0.028 | 0.009 | -10000 | 0 | -10000 | 0 | 0 |
| TRAP-1/SMAD4 | 0.042 | 0.015 | -10000 | 0 | -10000 | 0 | 0 |
| MAPK3 | 0.029 | 0.006 | -10000 | 0 | -10000 | 0 | 0 |
| MAPK1 | 0.03 | 0.004 | -10000 | 0 | -10000 | 0 | 0 |
| NUP214 | 0.029 | 0.006 | -10000 | 0 | -10000 | 0 | 0 |
| CTDSP1 | 0.029 | 0.007 | -10000 | 0 | -10000 | 0 | 0 |
| CTDSP2 | 0.029 | 0.005 | -10000 | 0 | -10000 | 0 | 0 |
| CTDSPL | 0.021 | 0.014 | -10000 | 0 | -10000 | 0 | 0 |
| KPNB1 | 0.029 | 0.005 | -10000 | 0 | -10000 | 0 | 0 |
| TGFBRAP1 | 0.029 | 0.017 | -10000 | 0 | -0.32 | 1 | 1 |
| UBE2I | 0.029 | 0.006 | -10000 | 0 | -10000 | 0 | 0 |
| NUP153 | 0.029 | 0.006 | -10000 | 0 | -10000 | 0 | 0 |
| KPNA2 | 0.029 | 0.005 | -10000 | 0 | -10000 | 0 | 0 |
| PIAS4 | 0.03 | 0.003 | -10000 | 0 | -10000 | 0 | 0 |
Figure S128. Get High-res Image This plot shows pathway concept perturbations across all samples against a permutation model. The concepts along the x-axis are sorted by lowest to highest mean activity for the real patient samples. Mean inferred activities are plotted along the y-axis as a colored band showing the average level and one standard deviation range. Real samples are shown in red and permuted samples in black.
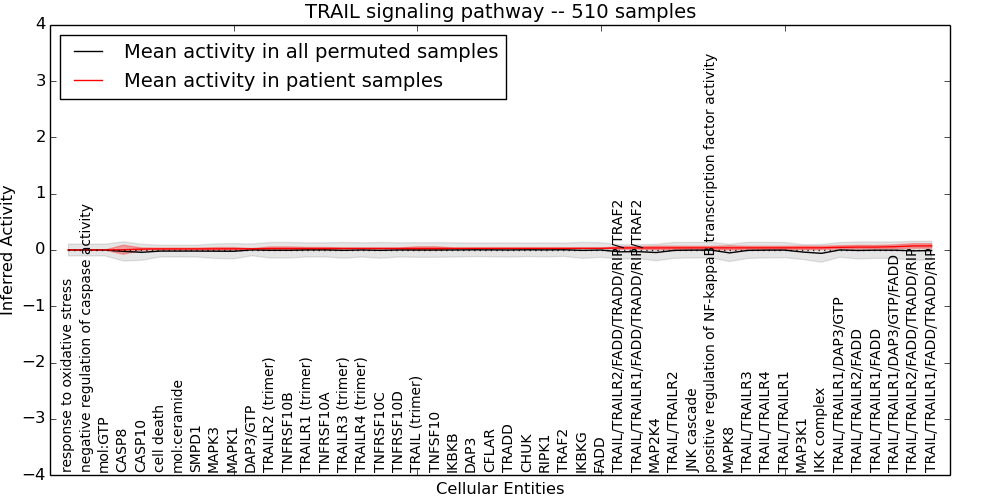
Table S128. Get Full Table This table displays mean, standard deviation, and perturbation statistics for Inferred Pathway Levels (IPLs). A mean perturbation of -9999 implies that the IPLs across all the real samples did not differ enough from the IPLs generated by a background model of permuted samples (> 1 Std.Dev from the permuted sample IPLs).
| Entity | Mean | Std.Dev | Mean.of.Up.Perturbations | Number.of.Up.Perturbations | Mean.of.Down.Perturbations | Number.of.Down.Perturbations | Number.of.Total.Perturbations |
|---|---|---|---|---|---|---|---|
| TNFSF10 | 0.027 | 0.03 | -10000 | 0 | -0.64 | 1 | 1 |
| positive regulation of NF-kappaB transcription factor activity | 0.038 | 0.027 | -10000 | 0 | -0.47 | 1 | 1 |
| MAP2K4 | 0.037 | 0.031 | -10000 | 0 | -10000 | 0 | 0 |
| IKBKB | 0.028 | 0.008 | -10000 | 0 | -10000 | 0 | 0 |
| TNFRSF10B | 0.026 | 0.029 | -10000 | 0 | -0.59 | 1 | 1 |
| TNFRSF10A | 0.027 | 0.018 | -10000 | 0 | -0.32 | 1 | 1 |
| SMPD1 | 0.019 | 0.015 | -10000 | 0 | -10000 | 0 | 0 |
| IKBKG | 0.03 | 0.004 | -10000 | 0 | -10000 | 0 | 0 |
| mol:GTP | 0 | 0 | -10000 | 0 | -10000 | 0 | 0 |
| TNFRSF10D | 0.027 | 0.009 | -10000 | 0 | -10000 | 0 | 0 |
| TRAIL/TRAILR2 | 0.037 | 0.029 | -10000 | 0 | -0.47 | 1 | 1 |
| TRAIL/TRAILR3 | 0.038 | 0.027 | -10000 | 0 | -0.47 | 1 | 1 |
| TRAIL/TRAILR1 | 0.038 | 0.027 | -10000 | 0 | -0.47 | 1 | 1 |
| TRAIL/TRAILR4 | 0.038 | 0.027 | -10000 | 0 | -0.47 | 1 | 1 |
| TRAIL/TRAILR1/DAP3/GTP | 0.047 | 0.029 | -10000 | 0 | -0.37 | 1 | 1 |
| IKK complex | 0.039 | 0.029 | -10000 | 0 | -10000 | 0 | 0 |
| RIPK1 | 0.029 | 0.006 | -10000 | 0 | -10000 | 0 | 0 |
| response to oxidative stress | 0 | 0 | -10000 | 0 | -10000 | 0 | 0 |
| DAP3/GTP | 0.021 | 0.005 | -10000 | 0 | -10000 | 0 | 0 |
| MAPK3 | 0.021 | 0.023 | -10000 | 0 | -0.47 | 1 | 1 |
| MAP3K1 | 0.038 | 0.032 | -10000 | 0 | -10000 | 0 | 0 |
| TRAILR4 (trimer) | 0.027 | 0.009 | -10000 | 0 | -10000 | 0 | 0 |
| TRADD | 0.029 | 0.006 | -10000 | 0 | -10000 | 0 | 0 |
| TRAILR1 (trimer) | 0.027 | 0.018 | -10000 | 0 | -0.32 | 1 | 1 |
| TRAIL/TRAILR1/FADD/TRADD/RIP/TRAF2 | 0.037 | 0.023 | -10000 | 0 | -10000 | 0 | 0 |
| CFLAR | 0.029 | 0.006 | -10000 | 0 | -10000 | 0 | 0 |
| MAPK1 | 0.021 | 0.023 | -10000 | 0 | -0.47 | 1 | 1 |
| TRAIL/TRAILR1/FADD/TRADD/RIP | 0.073 | 0.04 | -10000 | 0 | -0.34 | 1 | 1 |
| mol:ceramide | 0.019 | 0.015 | -10000 | 0 | -10000 | 0 | 0 |
| FADD | 0.03 | 0.004 | -10000 | 0 | -10000 | 0 | 0 |
| MAPK8 | 0.038 | 0.038 | 0.29 | 1 | -10000 | 0 | 1 |
| TRAF2 | 0.029 | 0.006 | -10000 | 0 | -10000 | 0 | 0 |
| TRAILR3 (trimer) | 0.027 | 0.009 | -10000 | 0 | -10000 | 0 | 0 |
| CHUK | 0.029 | 0.006 | -10000 | 0 | -10000 | 0 | 0 |
| TRAIL/TRAILR1/FADD | 0.052 | 0.029 | -10000 | 0 | -0.4 | 1 | 1 |
| DAP3 | 0.029 | 0.007 | -10000 | 0 | -10000 | 0 | 0 |
| CASP10 | 0.017 | 0.02 | -10000 | 0 | -0.4 | 1 | 1 |
| JNK cascade | 0.038 | 0.027 | -10000 | 0 | -0.47 | 1 | 1 |
| TRAIL (trimer) | 0.027 | 0.03 | -10000 | 0 | -0.63 | 1 | 1 |
| TNFRSF10C | 0.027 | 0.009 | -10000 | 0 | -10000 | 0 | 0 |
| TRAIL/TRAILR1/DAP3/GTP/FADD | 0.059 | 0.033 | -10000 | 0 | -0.35 | 1 | 1 |
| TRAIL/TRAILR2/FADD | 0.052 | 0.031 | -10000 | 0 | -0.4 | 1 | 1 |
| cell death | 0.019 | 0.014 | -10000 | 0 | -10000 | 0 | 0 |
| TRAIL/TRAILR2/FADD/TRADD/RIP/TRAF2 | 0.037 | 0.023 | -10000 | 0 | -10000 | 0 | 0 |
| TRAILR2 (trimer) | 0.026 | 0.029 | -10000 | 0 | -0.59 | 1 | 1 |
| CASP8 | 0.005 | 0.08 | -10000 | 0 | -0.58 | 9 | 9 |
| negative regulation of caspase activity | 0 | 0 | -10000 | 0 | -10000 | 0 | 0 |
| TRAIL/TRAILR2/FADD/TRADD/RIP | 0.073 | 0.041 | -10000 | 0 | -10000 | 0 | 0 |
Figure S129. Get High-res Image This plot shows pathway concept perturbations across all samples against a permutation model. The concepts along the x-axis are sorted by lowest to highest mean activity for the real patient samples. Mean inferred activities are plotted along the y-axis as a colored band showing the average level and one standard deviation range. Real samples are shown in red and permuted samples in black.
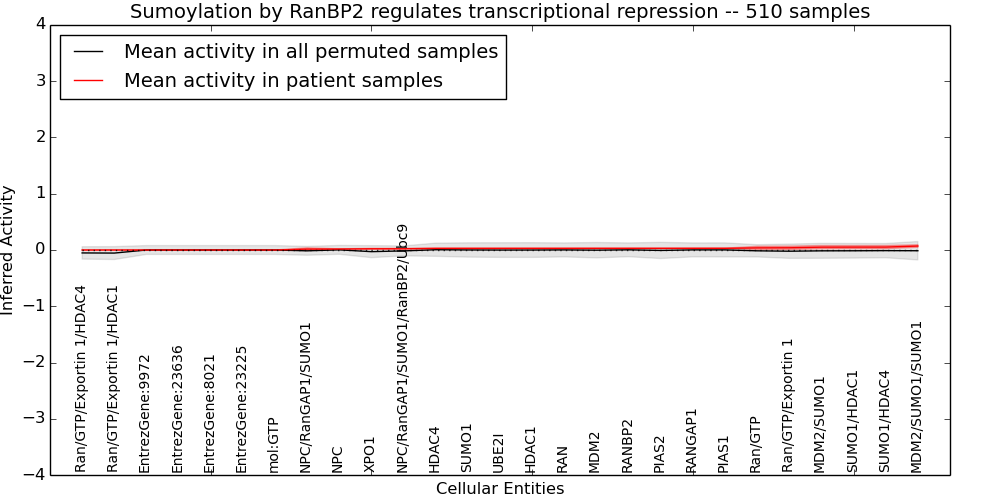
Table S129. Get Full Table This table displays mean, standard deviation, and perturbation statistics for Inferred Pathway Levels (IPLs). A mean perturbation of -9999 implies that the IPLs across all the real samples did not differ enough from the IPLs generated by a background model of permuted samples (> 1 Std.Dev from the permuted sample IPLs).
| Entity | Mean | Std.Dev | Mean.of.Up.Perturbations | Number.of.Up.Perturbations | Mean.of.Down.Perturbations | Number.of.Down.Perturbations | Number.of.Total.Perturbations |
|---|---|---|---|---|---|---|---|
| HDAC1 | 0.029 | 0.006 | -10000 | 0 | -9999 | 0 | 0 |
| Ran/GTP/Exportin 1/HDAC4 | 0 | 0.001 | -10000 | 0 | -9999 | 0 | 0 |
| MDM2/SUMO1 | 0.051 | 0.029 | -10000 | 0 | -9999 | 0 | 0 |
| HDAC4 | 0.029 | 0.007 | -10000 | 0 | -9999 | 0 | 0 |
| Ran/GTP/Exportin 1/HDAC1 | 0 | 0.001 | -10000 | 0 | -9999 | 0 | 0 |
| SUMO1 | 0.029 | 0.007 | -10000 | 0 | -9999 | 0 | 0 |
| NPC/RanGAP1/SUMO1 | 0.016 | 0.023 | -10000 | 0 | -9999 | 0 | 0 |
| mol:GTP | 0 | 0 | -10000 | 0 | -9999 | 0 | 0 |
| XPO1 | 0.022 | 0.008 | -10000 | 0 | -9999 | 0 | 0 |
| EntrezGene:23636 | 0 | 0 | -10000 | 0 | -9999 | 0 | 0 |
| RAN | 0.029 | 0.006 | -10000 | 0 | -9999 | 0 | 0 |
| EntrezGene:8021 | 0 | 0 | -10000 | 0 | -9999 | 0 | 0 |
| RANBP2 | 0.029 | 0.005 | -10000 | 0 | -9999 | 0 | 0 |
| SUMO1/HDAC4 | 0.052 | 0.028 | -10000 | 0 | -9999 | 0 | 0 |
| SUMO1/HDAC1 | 0.051 | 0.028 | -10000 | 0 | -9999 | 0 | 0 |
| RANGAP1 | 0.03 | 0.004 | -10000 | 0 | -9999 | 0 | 0 |
| MDM2/SUMO1/SUMO1 | 0.071 | 0.023 | -10000 | 0 | -9999 | 0 | 0 |
| NPC/RanGAP1/SUMO1/RanBP2/Ubc9 | 0.022 | 0.008 | -10000 | 0 | -9999 | 0 | 0 |
| Ran/GTP | 0.038 | 0.028 | -10000 | 0 | -9999 | 0 | 0 |
| EntrezGene:23225 | 0 | 0 | -10000 | 0 | -9999 | 0 | 0 |
| MDM2 | 0.029 | 0.005 | -10000 | 0 | -9999 | 0 | 0 |
| UBE2I | 0.029 | 0.006 | -10000 | 0 | -9999 | 0 | 0 |
| Ran/GTP/Exportin 1 | 0.039 | 0.03 | 0.25 | 2 | -9999 | 0 | 2 |
| NPC | 0.017 | 0.003 | -10000 | 0 | -9999 | 0 | 0 |
| PIAS2 | 0.029 | 0.005 | -10000 | 0 | -9999 | 0 | 0 |
| PIAS1 | 0.03 | 0.003 | -10000 | 0 | -9999 | 0 | 0 |
| EntrezGene:9972 | 0 | 0 | -10000 | 0 | -9999 | 0 | 0 |
Figure S130. Get High-res Image This plot shows pathway concept perturbations across all samples against a permutation model. The concepts along the x-axis are sorted by lowest to highest mean activity for the real patient samples. Mean inferred activities are plotted along the y-axis as a colored band showing the average level and one standard deviation range. Real samples are shown in red and permuted samples in black.
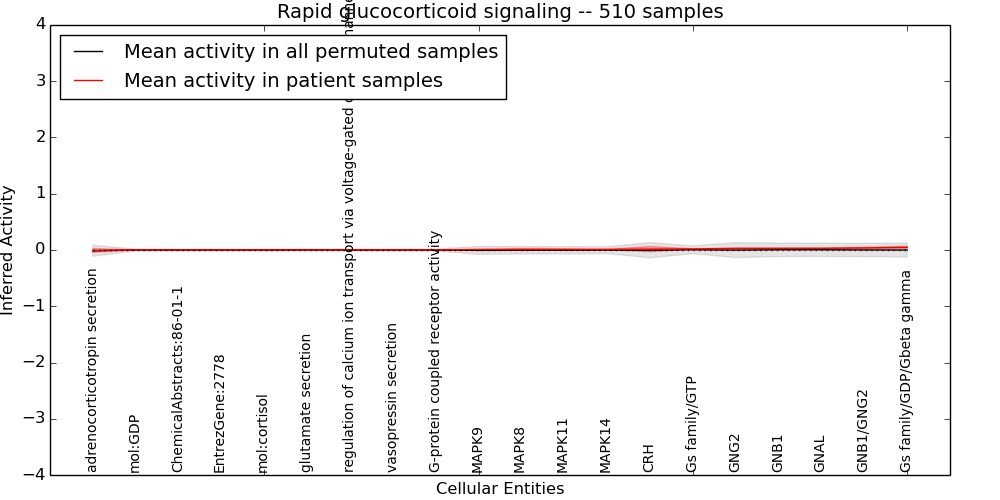
Table S130. Get Full Table This table displays mean, standard deviation, and perturbation statistics for Inferred Pathway Levels (IPLs). A mean perturbation of -9999 implies that the IPLs across all the real samples did not differ enough from the IPLs generated by a background model of permuted samples (> 1 Std.Dev from the permuted sample IPLs).
| Entity | Mean | Std.Dev | Mean.of.Up.Perturbations | Number.of.Up.Perturbations | Mean.of.Down.Perturbations | Number.of.Down.Perturbations | Number.of.Total.Perturbations |
|---|---|---|---|---|---|---|---|
| Gs family/GDP/Gbeta gamma | 0.047 | 0.018 | -9999 | 0 | -10000 | 0 | 0 |
| MAPK9 | 0.008 | 0.005 | -9999 | 0 | -10000 | 0 | 0 |
| adrenocorticotropin secretion | -0.007 | 0.035 | -9999 | 0 | -0.43 | 3 | 3 |
| GNB1/GNG2 | 0.037 | 0.013 | -9999 | 0 | -10000 | 0 | 0 |
| GNB1 | 0.029 | 0.006 | -9999 | 0 | -10000 | 0 | 0 |
| regulation of calcium ion transport via voltage-gated calcium channel activity | 0 | 0 | -9999 | 0 | -10000 | 0 | 0 |
| mol:GDP | 0 | 0 | -9999 | 0 | -10000 | 0 | 0 |
| MAPK14 | 0.01 | 0.002 | -9999 | 0 | -10000 | 0 | 0 |
| Gs family/GTP | 0.019 | 0.003 | -9999 | 0 | -10000 | 0 | 0 |
| EntrezGene:2778 | 0 | 0 | -9999 | 0 | -10000 | 0 | 0 |
| vasopressin secretion | 0 | 0 | -9999 | 0 | -10000 | 0 | 0 |
| G-protein coupled receptor activity | 0 | 0 | -9999 | 0 | -10000 | 0 | 0 |
| ChemicalAbstracts:86-01-1 | 0 | 0 | -9999 | 0 | -10000 | 0 | 0 |
| glutamate secretion | 0 | 0 | -9999 | 0 | -10000 | 0 | 0 |
| GNAL | 0.03 | 0.005 | -9999 | 0 | -10000 | 0 | 0 |
| GNG2 | 0.028 | 0.008 | -9999 | 0 | -10000 | 0 | 0 |
| CRH | 0.016 | 0.047 | -9999 | 0 | -0.59 | 3 | 3 |
| mol:cortisol | 0 | 0 | -9999 | 0 | -10000 | 0 | 0 |
| MAPK8 | 0.01 | 0.017 | -9999 | 0 | -0.38 | 1 | 1 |
| MAPK11 | 0.01 | 0.012 | -9999 | 0 | -0.25 | 1 | 1 |
Figure S131. Get High-res Image This plot shows pathway concept perturbations across all samples against a permutation model. The concepts along the x-axis are sorted by lowest to highest mean activity for the real patient samples. Mean inferred activities are plotted along the y-axis as a colored band showing the average level and one standard deviation range. Real samples are shown in red and permuted samples in black.
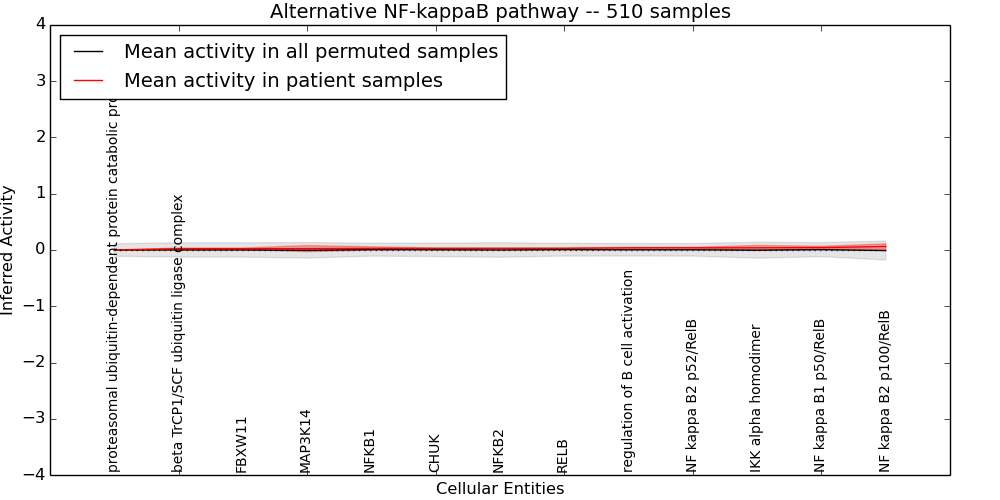
Table S131. Get Full Table This table displays mean, standard deviation, and perturbation statistics for Inferred Pathway Levels (IPLs). A mean perturbation of -9999 implies that the IPLs across all the real samples did not differ enough from the IPLs generated by a background model of permuted samples (> 1 Std.Dev from the permuted sample IPLs).
| Entity | Mean | Std.Dev | Mean.of.Up.Perturbations | Number.of.Up.Perturbations | Mean.of.Down.Perturbations | Number.of.Down.Perturbations | Number.of.Total.Perturbations |
|---|---|---|---|---|---|---|---|
| IKK alpha homodimer | 0.039 | 0.043 | -9999 | 0 | -0.43 | 4 | 4 |
| FBXW11 | 0.023 | 0.013 | -9999 | 0 | -10000 | 0 | 0 |
| proteasomal ubiquitin-dependent protein catabolic process | 0 | 0 | -9999 | 0 | -10000 | 0 | 0 |
| beta TrCP1/SCF ubiquitin ligase complex | 0.023 | 0.013 | -9999 | 0 | -10000 | 0 | 0 |
| CHUK | 0.029 | 0.006 | -9999 | 0 | -10000 | 0 | 0 |
| NF kappa B2 p100/RelB | 0.062 | 0.048 | -9999 | 0 | -10000 | 0 | 0 |
| NFKB1 | 0.028 | 0.03 | -9999 | 0 | -0.64 | 1 | 1 |
| MAP3K14 | 0.025 | 0.055 | -9999 | 0 | -0.59 | 4 | 4 |
| NF kappa B1 p50/RelB | 0.043 | 0.024 | -9999 | 0 | -0.47 | 1 | 1 |
| RELB | 0.03 | 0.004 | -9999 | 0 | -10000 | 0 | 0 |
| NFKB2 | 0.029 | 0.006 | -9999 | 0 | -10000 | 0 | 0 |
| NF kappa B2 p52/RelB | 0.039 | 0.009 | -9999 | 0 | -10000 | 0 | 0 |
| regulation of B cell activation | 0.038 | 0.009 | -9999 | 0 | -10000 | 0 | 0 |
Table 3. Get Full Table First 10 out of 7202 rows and 4 out of 510 columns in the PARADIGM inferred pathway levels matrix.
| pid_entity | TCGA.MW.A4EC | TCGA.MM.A564 | TCGA.GK.A6C7 | TCGA.G6.A5PC |
|---|---|---|---|---|
| 109_MAP3K5 | 0.1 | 0.055 | 0.055 | -0.063 |
| 47_PPARGC1A | 0.03 | 0.03 | 0.03 | 0.03 |
| 105_BMP4 | 0.03 | 0.03 | 0.03 | 0 |
| 105_BMP6 | 0.03 | 0.03 | 0.03 | 0.03 |
| 105_BMP7 | 0.018 | -0.63 | -0.63 | 0.018 |
| 105_BMP2 | 0.03 | 0.03 | 0.03 | 0.03 |
| 131_RELN/VLDLR | -0.37 | -0.37 | -0.37 | -0.37 |
| 30_TGFB1/TGF beta receptor Type II | 0.03 | 0.034 | 0.03 | 0.03 |
| 84_STAT5B | -0.052 | -0.13 | -0.028 | -0.28 |
| 84_STAT5A | -0.052 | -0.13 | -0.028 | -0.28 |
-
Expression Data Normalization = Normal controls were used to median center the expression data used in this analysis.
-
mRNASeq Expression File Used = /xchip/cga/gdac-prod/tcga-gdac/jobResults/mRNAseq_preprocessor/KIRC-TP/8100468/KIRC-TP.uncv2.mRNAseq_RSEM_normalized_log2_PARADIGM.txt
-
Copy Number File Used = /xchip/cga/gdac-prod/tcga-gdac/jobResults/GDAC_Gistic2/KIRC-TP/8266084/Gistic2_Analysis_8266107/all_data_by_genes.txt
Both copy number and expression data are incorporated into PARADIGM's inference. Whenever normal tissue controls are available for analysis in the expression data, each patient's gene-value is normalized by subtracting the gene's median level observed in the normal control. Copy number data is also normalized to reflect the difference in copy number between a gene's levels detected in tumor versus control (e.g. blood normal). The collection of pathways used by PARADIGM includes those from NCI-PID on September 15, 2009 containing 131 pathways, 11,563 interactions, and 7,204 entities. All gene identifiers were translated into HUGO standard identifiers wherever possible. We refer to molecular entities as "concepts," which include gene products such as proteins and miRNAs, small molecules, protein complexes, and abstract concepts. Each concept is represented as "node" in PARADIGM's graphical model. The abstract concepts correspond to general cellular processes (such as "apoptosis" or "DNA damage response") and families of genes that share functional activity such as the RAS family of signal transducers. Various types of concept-concept interactions are included in the pathways including protein-protein interactions, transcriptional regulatory interactions, and protein modifications such as phosphorylation and ubiquitinylation interactions.
The PARADIGM algorithm (described in PMID: 20529912) assigns an integrated pathway level (IPL) reflecting the activity of a concept determined through a belief propagation strategy. The belief propagation is given the copy number and gene expression measurements of all of the genes and iteratively updates hidden states reflecting the activities of all of the genes in a pathway so as to maximize the likelihood of the observed data given the interactions in the pathway. In the end, the inferred level of a concept reflects both the data observed for the concept and the neighborhood of activity surrounding the concept.
The significance of the IPL obtained for each concept in each patient sample is assessed using a permutation analysis. Importantly, the permutation analysis preserves data tuples so as to preserve any implicit correlations between the different data modalities. For example, genes that are deleted have concomitantly lower expression levels. Preserving the copy number and expression pairs therefore retains this data property. The simulation therefore makes "null samples" by permuting data tuples across all of the genes in the genome so that each gene in a null sample is associated with a random tuple of another gene with equal probability. This approach has the added benefit of preserving the pathway structure so that every observed IPL can be compared to a distribution of random IPLs derived from exactly the same interaction context. PARADIGM inferences are then obtained for 1000 "null" patients and serve as a background distribution to contrast the observed IPLs against. Pathway concepts are excluded from further analysis if they did not obtain a minimum IPL of 0.5 in any patient sample both observed or simulated.
An IPL I(i,j) for concept i in sample j, is considered to be deviated if its absolute level is two standard deviations from the average level observed for concept i in the 1000 null samples. The degree to which a concept has significantly altered levels across a patient cohort is summarized in the proportion of deviated samples (PDS) score. For example, a protein with a PDS of 0.10 reflects that the protein's level of activity was inferred to be significantly higher or lower in tumors compared to normal in 10% of the patient samples. An average PDS for a pathway is also reported by computing the mean PDS over all concepts in the pathway.
In addition to the links below, the full results of the analysis summarized in this report can also be downloaded programmatically using firehose_get, or interactively from either the Broad GDAC website or TCGA Data Coordination Center Portal.